Introduction
Colorectal cancer (CRC) is currently one of the most
commonly diagnosed cancers worldwide, with an estimated 1.4 million
cases and 693,900 deaths occurring in 2012 (1). It is much more prevalent in Europe and
Northern America than the developing countries, which however is
also rising in the last decade (2).
Though many advances have been achieved in the clinical management
of CRC, the 5-year survival is usually only approximately 55%
(3). Surgical resection remains the
primary means of curative treatment. However, a proportion of
patients will develop local recurrences and metastases thus having
a poor prognosis after resection. Moreover, the outcomes of
patients with similar clinical or pathologic stage remain
unpredictable, especially when they are treated similarly (4). This inherent clinical diversity is most
likely due to the genetic heterogeneity of each patient (5). Therefore, identifying the diversity in
the genetic profile of colorectal carcinoma that governs the
prognosis as well as accurate risk evaluation based on genetic
screening would lead to new and more effective clinical strategies
in decision making.
Microarray technology allows comprehensive analysis
of gene expression profiles in different diseases, which has been
demonstrated in a variety of hematological tumors and solid tumors
including lung (6), liver (7), pancreas (8), and breast (9). Biomarkers discovered by microarrays have
a great potential in the prediction of clinical outcomes and
survival as well as classification in different sub-types (10–12).
However, several reported survival-related biomarkers in CRC are
not well performed when their ability was assessed in independent
datasets (13–15). Their clinical implement may also
limited due to lack of reproducibility and/or standardization. This
may be related to un-optimized parameters, different technique
platforms, and small volume of samples. So an integrated strategy
to combine several specific biomarkers together, which are verified
by multiple data source, may be feasible in predicting CRC risk and
prognosis.
In the present study, we identified and verified 66
differentially expressed genes (DEGs) between CRC and normal tissue
by bioinformatics analysis with multiple classifiers. Among them,
we classified 46 biomarkers which were closely related to patient
survival. We looked into the function of these genes via GO and
KEGG pathway analysis. Finally, through random survival forests
algorithm, we ranked these gene by importance and built a
5-genes-based linear risk score with multivariable cox regression
model. Our findings suggest that this risk score is a powerful and
arcuate prognostic tool and is promisingly implemented in the
clinical setting.
Materials and methods
CRC datasets
The training and validation datasets were achieved
from the Gene Expression Omnibus (GEO, https://www.ncbi.nlm.nih.gov/geo/). GSE9348 (70 CRC
and 12 normal, platform GPL570 [HG-U133_Plus_2] Affymetrix Human
Genome U133 Plus 2.0 Array) was used as training set for DEGs to
distinguish cancerous and non-cancerous samples, GSE44076 (98 pairs
of CRC and adjacent normal tissues, platform GPL13667 [HG-U219]
Affymetrix Human Genome U219 Array) and GSE44861 (56 tumors and 55
adjacent normal tissues, by GPL3921 [HT_HG-U133A] Affymetrix HT
Human Genome U133A Array) for validation. Three datasets with
survival information generated by GPL570 [HG-U133_Plus_2]
Affymetrix Human Genome U133 Plus 2.0 Array were introduced for
calculating risk score formula. GSE14333 (n=226) was set for
training set, and GSE17536 (n=177) as well as GSE29621 (n=65) for
validation.
Data preprocessing
All microarray data preprocessing were processed in
R software version 3.1.0 using packages from Bioconductor. Raw
microarray data (CEL files) of tumors and normal samples were
pre-processed with the RMA algorithm using the affy package
(16). Gene expression values were
arranged after background adjustment, quantile normalization and
summarizing probe values into one expression measure. If multiple
probe sets mapping to a same gene, the averages of the probe values
were taken as the expression values (17). Annotations for the probe arrays were
downloaded from the GEO database.
Functional enrichment analysis
The GO and pathway functional enrichment analysis
was operated by the online software GENECODIS3 to facilitate the
interpretation of biological roles of survival related-DEGs
(http://genecodis.cnb.csic.es) (18). The GO functions of the survival
related-DEGs were categorized by biological process, molecular
functions, and cellular components. Pathway enrichment analysis was
based on the Kyoto Encyclopedia of Genes and Genomes (KEGG)
database. P-values have been obtained through Hypergeometric
analysis corrected by FDR method. Terms with P<0.05 were
considered as significantly enriched.
Statistical analysis
SPSS software (version 20.0; IBM SPSS, Armonk, NY,
USA) were applied for statistical analysis. Survival analysis was
performed by Kaplan-Meier method and Mantel-Cox log-rank test was
used to evaluate the statistical significance of the differences.
Pearson's Chi-Square test was used to investigate the difference in
live and dead status of patients with different risk score.
Differences were considered as statistically significant when
P<0.05.
Results
Identification of DEGs between
cancerous and non-cancerous tissues
GSE9348 was used as the training set to identify the
DEGs between cancerous and non-cancerous tissues. This dataset
included tumors from 70 patients and biopsies from 12 healthy
controls. We employed different classifiers, namely Compound
Covariate (CC), Diagonal Linear Discriminant Analysis (DLDA),
Bayesian CCP (BCCP), Nearest Neighbor (NN), Nearest Centroid (NC)
and Support Vector Machines (SVM), to identify specific gene
markers. Leave-one-out cross validation was introduced to make the
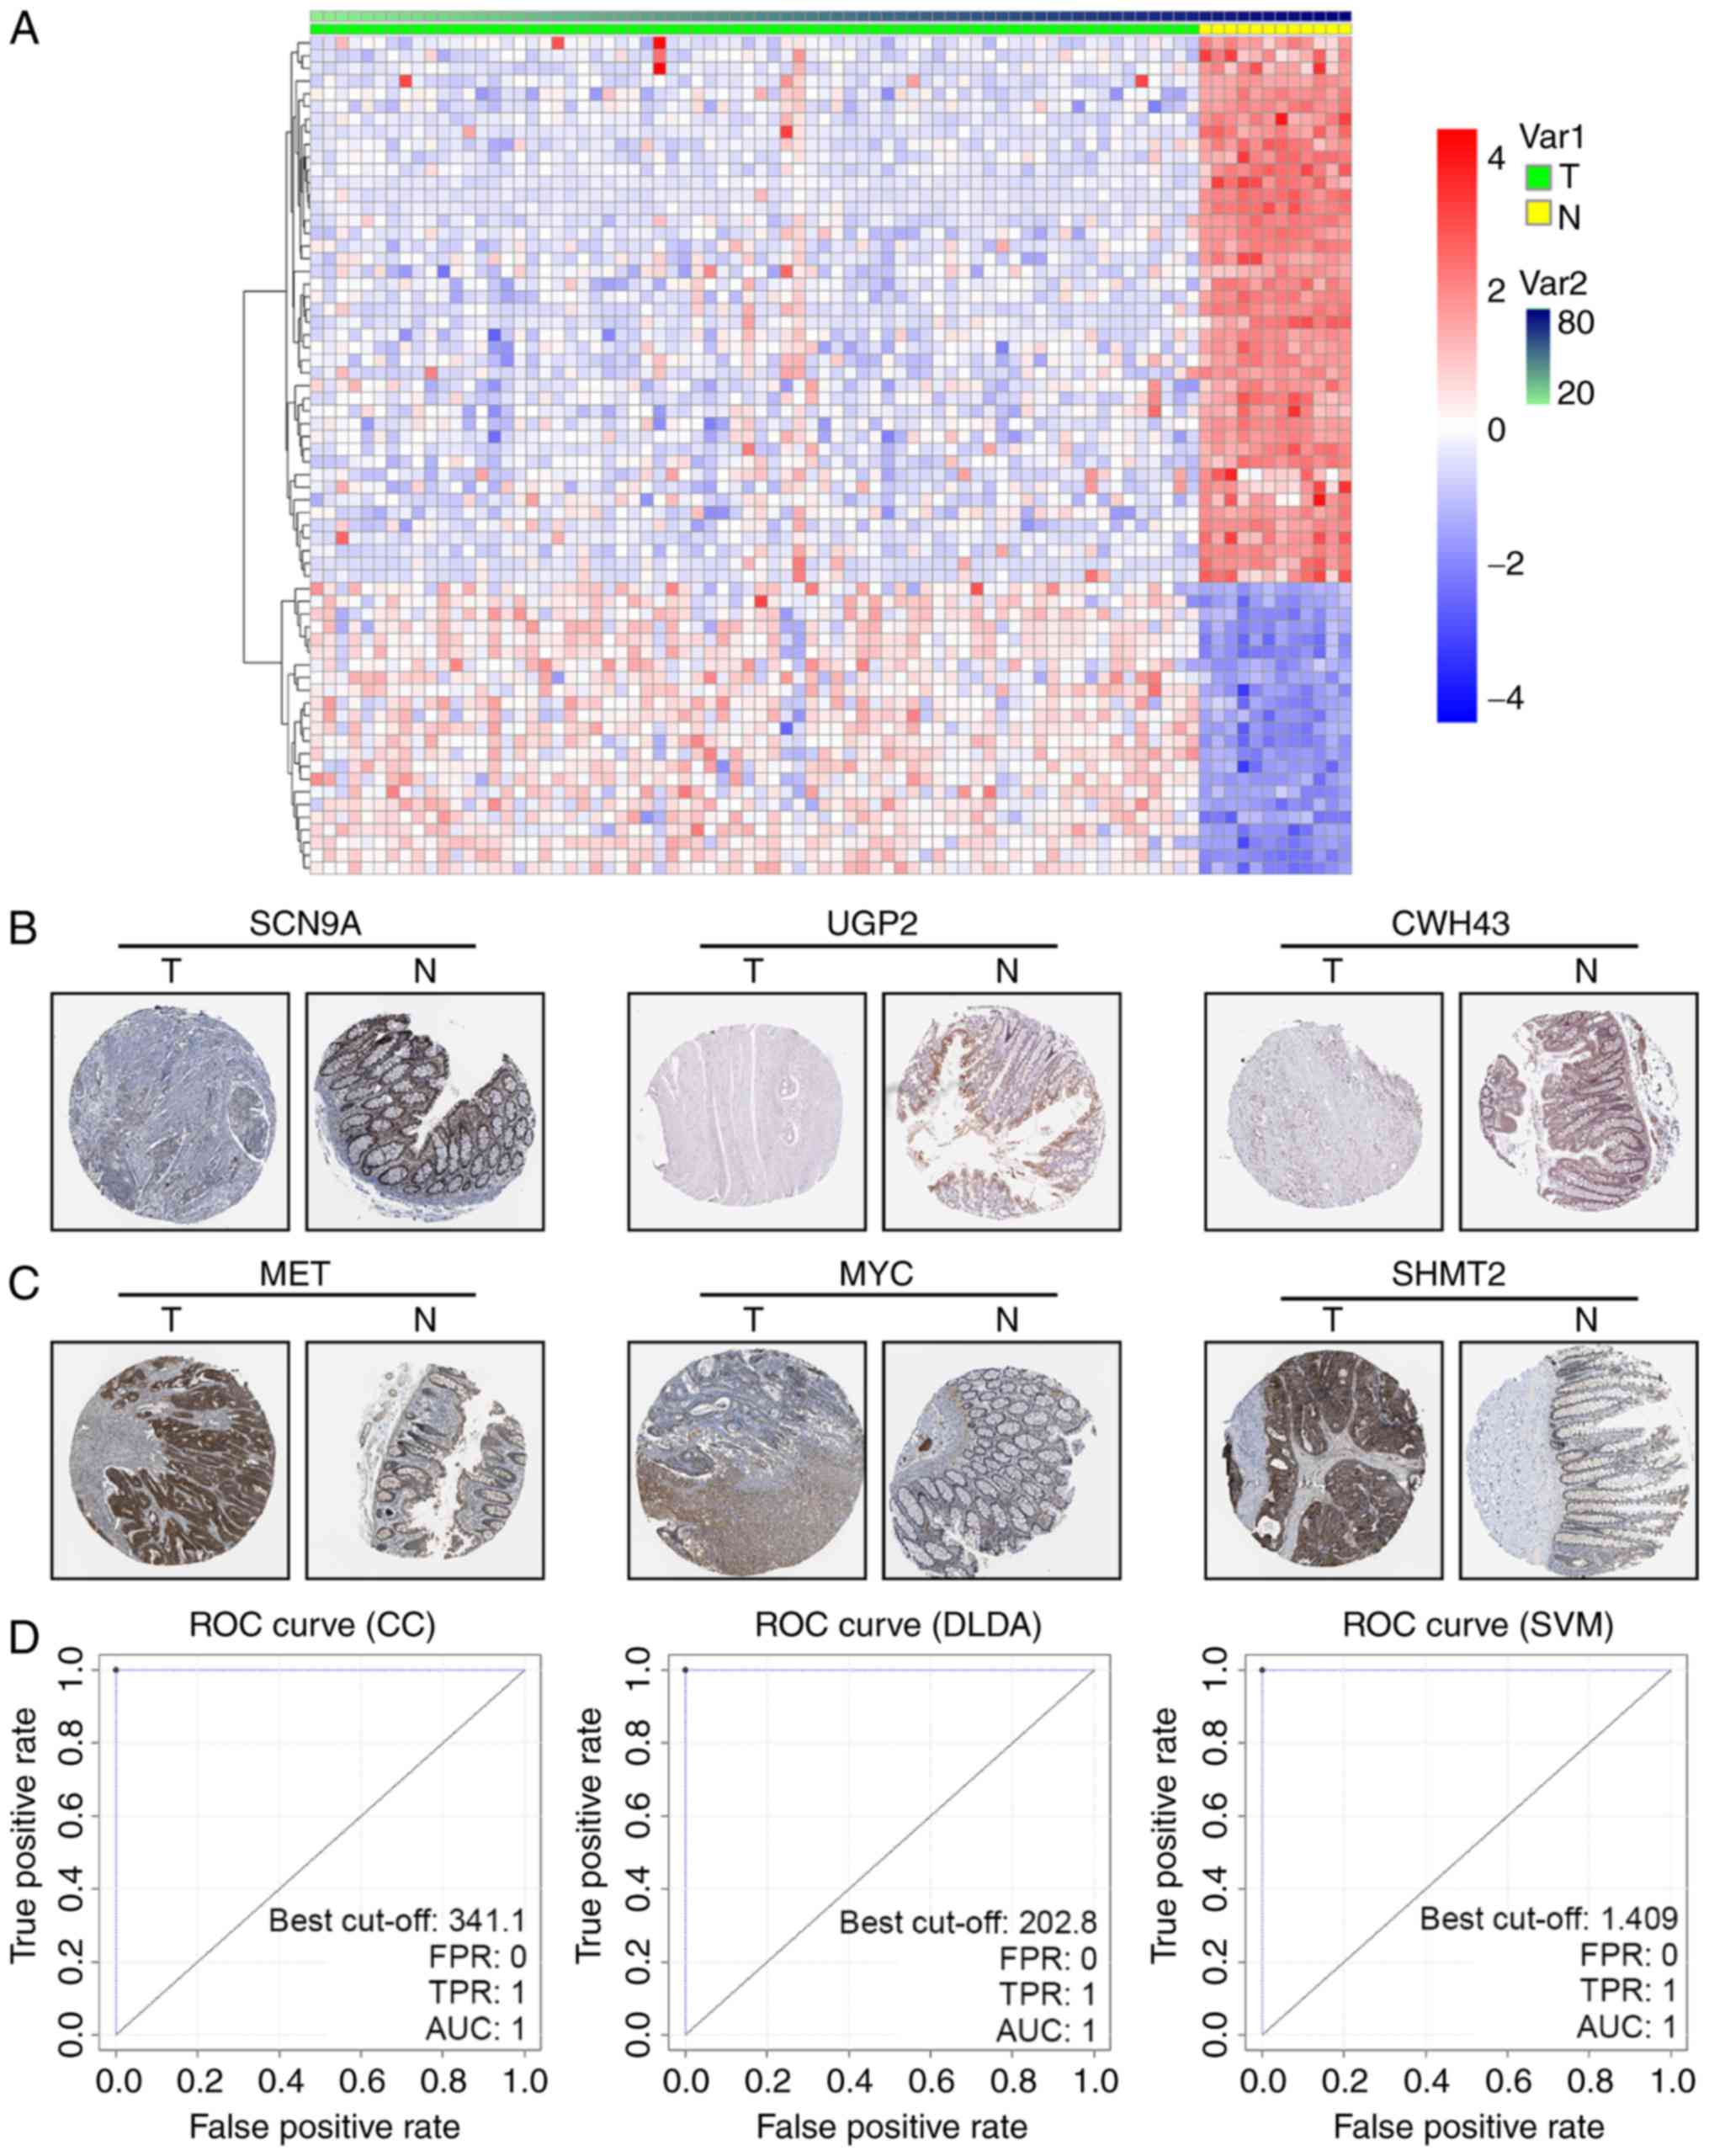
result stable and accurate. After processing, we got 66 DEGs, with
high accuracy (classifier error rate <0.1) (data not shown). The
distribution of the 66 genes in tumor and non-tumor tissue was
clearly demarcated in the GSE9348 dataset (Fig. 1A). To further confirm the DEGs in
cancerous and non-cancerous tissue, the human protein atlas
immunohistochemistry database (www.proteinatlas.org) was utilized to visualize the
expression. We found that downregulated DEGs like SCN9A, UGP2 and
CWH43 were less stained even negative in CRC tissues (Fig. 1B), while upregulated DEGs as MET, MYC
and SHMT2 were high stained in tumor parts (Fig. 1C).
As classifier CC, DLDA and SVM were linear
classifiers, a linear discriminant with weight values could
determine the cancerous status of samples. If one gene's weight
value in a sample within a certain linear classifier was
ωi, and its expression value
xi, then Σiωi
xi> threshold was defined as cancerous. The
threshold of classifier CC, DLDA and SVM were calculated as
−43.835, −234.08 and 0.409, respectively. The ROC curves of the
three linear classifiers confirmed its high effectiveness (AUC=1)
(Fig. 1D). It should be noted that
these ROC curves were derived from the training set GSE9348, in
which the Σiωi xi
discriminant of the three linear classifiers was set to compare
with a calculated threshold adapting to GSE9348, so the sensibility
and specificity was very high (Table
I upper).
 | Table I.Survival related DEGs by univariable
cox proportional hazards regression analysis. |
Table I.
Survival related DEGs by univariable
cox proportional hazards regression analysis.
| Gene | P-value | HR | Gene | P-value | HR |
|---|
| LOC339166 | <1e-07 | 7.748 | MYC | 7E-07 | 0.581 |
| SCN9A | <1e-07 | 0.154 | SQRDL | 7E-07 | 0.513 |
| LGI1 | <1e-07 | 0.115 | SHMT2 | 0.000001 | 0.509 |
| P2RY1 | <1e-07 | 3.592 | PDE6A | 2.1E-06 | 2.229 |
| PRPF4 | <1e-07 | 0.245 | UGDH | 2.3E-06 | 1.792 |
| GUCA2B | <1e-07 | 1.688 | PTPRH | 2.5E-06 | 1.733 |
| ENOX2 | <1e-07 | 0.193 | PPP2R3A | 8.4E-06 | 2.19 |
| NPY | <1e-07 | 4.787 | HSPH1 | 2.62E-05 | 1.61 |
| SCGN | <1e-07 | 2.266 | NR5A2 | 3.16E-05 | 0.585 |
| TMEM9B | <1e-07 | 3.445 | TRIP13 | 3.21E-05 | 0.631 |
| RNASEH2A | <1e-07 | 0.438 | CPM | 6.06E-05 | 0.498 |
| HSD11B2 | <1e-07 | 0.647 | DUSP14 | 0.000183 | 0.54 |
| DENND2A | <1e-07 | 0.299 | RCL1 | 0.000274 | 0.415 |
| ASPA | <1e-07 | 3.507 | ETV4 | 0.000396 | 0.672 |
| CA7 | <1e-07 | 2.626 | SEMA6D | 0.000472 | 1.9 |
| LPHN3 | <1e-07 | 0.247 | HOMER1 | 0.000475 | 0.666 |
| ABCG2 | <1e-07 | 1.497 | CCND1 | 0.000522 | 1.584 |
| GALNT6 | <1e-07 | 0.588 | METTL7A | 0.000543 | 2.012 |
| PTGDR | <1e-07 | 0.336 | MET | 0.000577 | 1.528 |
| TST | <1e-07 | 0.497 | CWH43 | 0.0006 | 0.699 |
| SMPDL3A | 1E-07 | 0.428 | DHRS11 | 0.000607 | 0.748 |
| HSD17B11 | 1E-07 | 2.087 | UGP2 | 0.000701 | 1.977 |
| ETFDH | 3E-07 | 0.549 | SLC22A18AS | 0.000812 | 0.558 |
Validation of DEGs in independent CRC
datasets
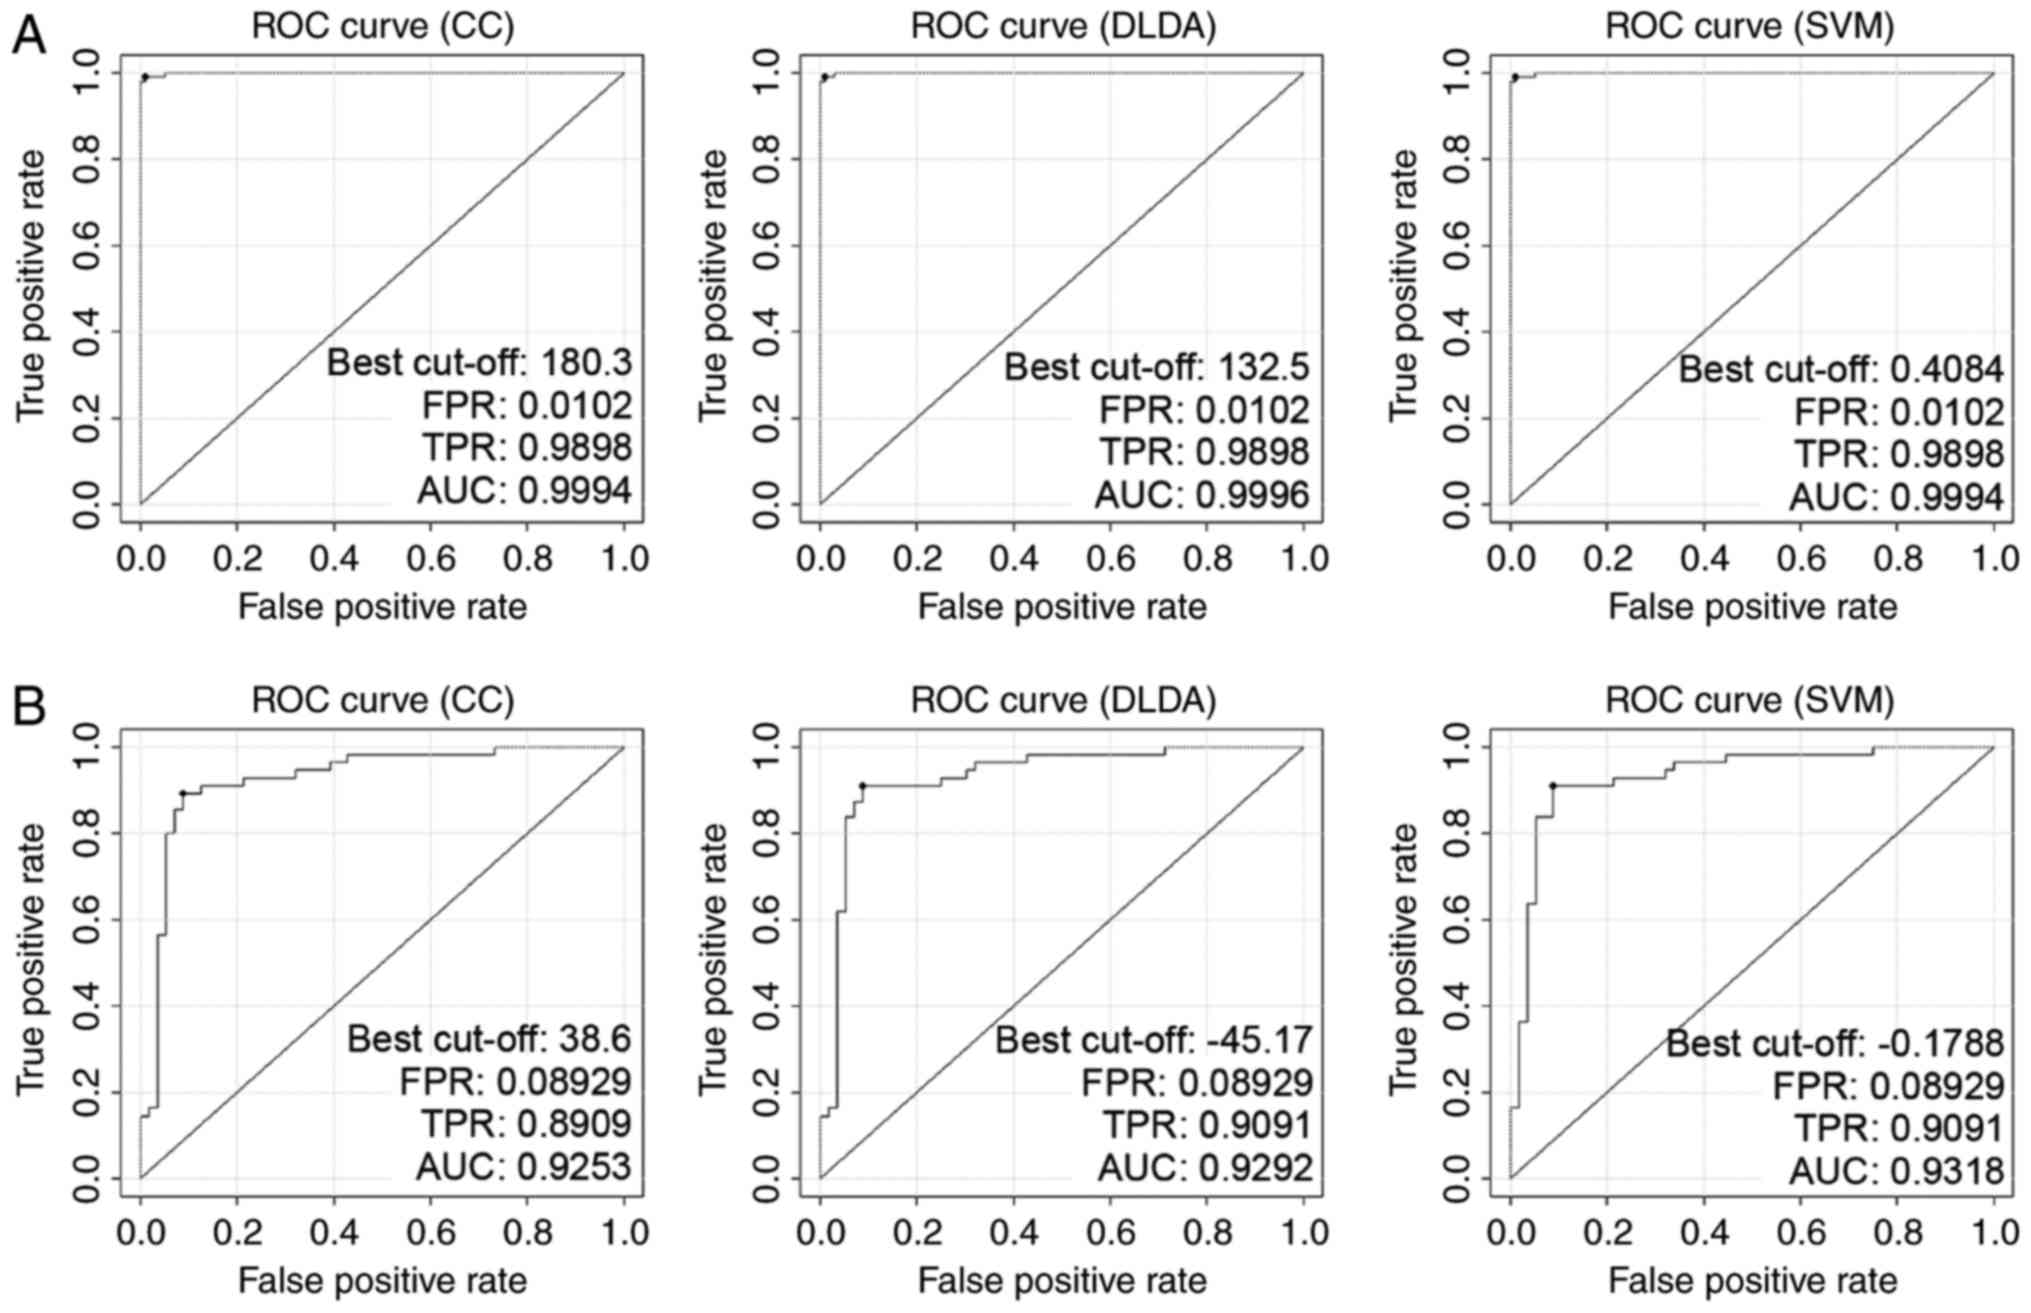
To avoid over-fitting and ensure marker stability,
two independent CRC datasets, GSE44076 (98 pairs of CRC and
adjacent tissues) and GSE44861 (56 tumors and 55 adjacent tissues)
were introduced for verification. The classifiers utilized in
GSE9348 worked well in these datasets (Table II), and the sensibility and
specificity of Σiωi
xi discriminant in classification of cancerous
samples were also tested and confirmed (Table I middle and lower). Gene expressions
of the 66 DEGs derived from GSE9348 performed a similar style in
GSE44076 and GSE44861 (data not shown). The reliability of the
three linear classifiers (CC, DLDA and SVM) was guaranteed when
they applied to GSE44076 and GSE44861. The AUCs of classifier CC,
DLDA and SVM in GSE44076 were 0.9994, 0.9996 and 0.9994 (Fig. 2A), while in GSE44861 the AUC values
were 0.9253, 0.9292 and 0.9318, respectively (Fig. 2B).
| Table II.GO analysis and KEGG pathway analysis
of 46 survival related-DEGs (partial data). |
Table II.
GO analysis and KEGG pathway analysis
of 46 survival related-DEGs (partial data).
| Genes | Hyp | Hypa | Annotations |
|---|
| Biological
process |
|
|
|
|
5 | 4.7E-05 | 0.00408 | GO:0042493:
Response to drug (BP) |
|
4 | 0.00079 | 0.02956 | GO:0008152:
Metabolic process (BP) |
|
3 | 0.00804 | 0.03142 | GO:0008283: Cell
proliferation (BP) |
|
3 | 0.00769 | 0.03249 | GO:0007411: Axon
guidance (BP) |
|
3 | 0.01192 | 0.0359 | GO:0008284:
Positive regulation of cell proliferation (BP) |
|
3 | 0.02362 | 0.04835 | GO:0045893:
Positive regulation of transcription, DNA-dependent (BP) |
| Molecular
function |
|
|
|
| 13 | 0.00391 | 0.02429 | GO:0005515: Protein
binding (MF) |
|
7 | 1.6E-06 | 0.00019 | GO:0016491:
Oxidoreductase activity (MF) |
|
7 | 0.01988 | 0.04888 | GO:0000166:
Nucleotide binding (MF) |
|
6 | 0.01607 | 0.0431 | GO:0004872:
Receptor activity (MF) |
|
5 | 0.00871 | 0.03213 | GO:0016787:
Hydrolase activity (MF) |
|
4 | 0.00865 | 0.03294 | GO:0016740:
Transferase activity (MF) |
|
4 | 0.01535 | 0.04312 | GO:0004930:
G-protein coupled receptor activity (MF) |
| Cellular
component |
|
|
|
| 15 | 0.00234 | 0.03334 | GO:0005737:
Cytoplasm (CC) |
| 13 | 0.00169 | 0.03219 | GO:0016020:
Membrane (CC) |
| 11 | 0.00562 | 0.03205 | GO:0005886: Plasma
membrane (CC) |
|
9 | 0.00075 | 0.02125 | GO:0005576:
Extracellular region (CC) |
|
7 | 0.0028 | 0.02656 | GO:0005730:
Nucleolus (CC) |
|
6 | 0.00948 | 0.04156 | GO:0005739:
Mitochondrion (CC) |
|
5 | 0.00357 | 0.02911 | GO:0005615:
Extracellular space (CC) |
|
4 | 0.00072 | 0.04092 | GO:0005743:
Mitochondrial inner membrane (CC) |
|
3 | 0.00236 | 0.02696 | GO:0005759:
Mitochondrial matrix (CC) |
| KEGG pathway |
|
|
|
|
3 | 0.0089 | 0.0411 | (KEGG) 05200:
Pathways in cancer |
|
2 | 0.00215 | 0.02152 | (KEGG) 05213:
Endometrial cancer |
|
2 | 0.00258 | 0.02211 | (KEGG) 05221: Acute
myeloid leukemia |
|
2 | 0.00304 | 0.02282 | (KEGG) 05210:
Colorectal cancer |
|
2 | 0.00077 | 0.02304 | (KEGG) 00040:
Pentose and glucuronate interconversions |
|
2 | 0.00207 | 0.02485 | (KEGG) 00500:
Starch and sucrose metabolism |
|
2 | 0.00419 | 0.02514 | (KEGG) 05220:
Chronic myeloid leukemia |
|
2 | 0.00386 | 0.02574 | (KEGG) 05218:
Melanoma |
|
2 | 0.00184 | 0.02755 | (KEGG) 00520: Amino
sugar and nucleotide sugar metabolism |
|
2 | 0.00141 | 0.02818 | (KEGG) 05219:
Bladder cancer |
|
2 | 0.00551 | 0.03004 | (KEGG) 05222: Small
cell lung cancer |
|
2 | 0.00063 | 0.03755 | (KEGG) 05216:
Thyroid cancer |
|
2 | 0.01148 | 0.04919 | (KEGG) 04110: Cell
cycle |
|
2 | 0.01238 | 0.04953 | (KEGG) 04360: Axon
guidance |
Survival analysis of DEGs in CRC and
their function annotation
The 66 biomarkers were significant differential
genes in CRC, however, whether the expression of these genes were
correlated with patient survival was unclear. We used GSE14333
which contained 226 samples with survival information among total
290 patients as the training set for survival analysis. By
univariable cox proportional hazards regression analysis and random
permutation test, we obtained 46 genes correlated with patient
survival (P<0.001) (Table
III).
| Table III.Multivariable and univariable model
tests of risk score and other factors. |
Table III.
Multivariable and univariable model
tests of risk score and other factors.
| A, GSE14333 |
|---|
|
|---|
|
| Multivariable
model | Univariable
model |
|---|
|
|
|
|
|---|
| Variables | HR | 95% CI of HR |
| P-value | HR | 95% CI of HR |
| P-value |
|---|
| Risk score | 2.346 | 1.298 | 4.241 | 0.005 | 2.718 | 1.523 | 4.851 | 0.001 |
| Location | 0.965 | 0.814 | 1.144 | 0.683 | 0.892 | 0.76 | 1.047 | 0.163 |
| Dukes stage | 1.18 | 0.926 | 1.503 | 0.18 | 1.044 | 0.86 | 1.266 | 0.666 |
| Age of
diagnosis | 1.008 | 0.994 | 1.023 | 0.257 | 1.105 | 1.002 | 1.028 | 0.02 |
| Sex | 0.926 | 0.683 | 1.255 | 0.62 | 0.877 | 0.651 | 1.182 | 0.39 |
| Adj XRT | 0.463 | 0.218 | 0.984 | 0.045 | 0.433 | 0.212 | 0.884 | 0.021 |
| Adj CTX | 0.867 | 0.568 | 1.325 | 0.51 | 0.847 | 0.618 | 1.16 | 0.3 |
|
| B,
GSE17536 |
|
|
| Multivariable
model | Univariable
model |
|
|
|
|
|
Variables | HR | 95% CI of
HR |
| P-value | HR | 95% CI of
HR |
| P-value |
|
| Risk score | 2.745 | 1.204 | 6.262 | 0.016 | 3.283 | 1.489 | 7.236 | 0.003 |
| Age | 1.015 | 0.999 | 1.031 | 0.061 | 1.018 | 1.003 | 1.034 | 0.016 |
| Sex | 1.084 | 0.747 | 1.572 | 0.672 | 0.953 | 0.666 | 1.362 | 0.79 |
| Ethnicity | 0.967 | 0.728 | 1.284 | 0.817 | 0.915 | 0.685 | 1.221 | 0.545 |
| AJCC stage | 1.107 | 0.892 | 1.373 | 0.357 | 1.051 | 0.861 | 1.284 | 0.625 |
| Grade | 1.254 | 0.828 | 1.898 | 0.285 | 1.375 | 0.924 | 2.045 | 0.116 |
|
| C,
GSE29621 |
|
|
| Multivariable
model | Univariable
model |
|
|
|
|
|
Variables | HR | 95% CI of
HR |
| P-value | HR | 95% CI of
HR |
| P-value |
|
| Risk score | 9.03 | 1.425 | 57.223 | 0.019 | 2.526 | 0.481 | 13.269 | 2.73E-05 |
| Sex | 1.243 | 0.513 | 3.014 | 0.63 | 1.508 | 0.649 | 3.505 | 0.34 |
| T stage | 0.449 | 0.091 | 2.209 | 0.325 | 1.048 | 0.438 | 2.509 | 0.915 |
| N stage | 1.583 | 0.604 | 4.143 | 0.35 | 2.688 | 1.526 | 4.734 | 0.001 |
| M stage | 2.065 | 0.368 | 11.592 | 0.41 | 4.934 | 2.188 | 11.124 | 1.19E-04 |
| Histology
grade | 0.849 | 0.325 | 2.219 | 0.738 | 0.665 | 0.284 | 1.558 | 0.348 |
| AJCC stage | 1.965 | 0.518 | 7.45 | 0.321 | 2.708 | 1.615 | 4.542 | 1.59E-04 |
To elucidate the function of these survival related
DEGs, we conducted GO and KEGG pathway analysis and revealed that
many genes play an important role in ‘response to drug’, ‘metabolic
process’, ‘cell proliferation’, and ‘oxidoreductase activity’,
which were highly correlated to drug resistance, altered cancer
metabolism, ROS level and proliferation, and many genes also
participated in multiple cancer pathways, such as MYC and CCND1
(Table IV).
| Table IV.GO analysis and KEGG pathway analysis
of 46 survival related-DEGs (partial data). |
Table IV.
GO analysis and KEGG pathway analysis
of 46 survival related-DEGs (partial data).
| Genes | Hyp | Hypa | Annotations |
|---|
| Biological
process |
|
|
|
|
5 | 4.7E-05 | 0.00408 | GO:0042493:
Response to drug (BP) |
|
4 | 0.00079 | 0.02956 | GO:0008152:
Metabolic process (BP) |
|
3 | 0.00804 | 0.03142 | GO:0008283: Cell
proliferation (BP) |
|
3 | 0.00769 | 0.03249 | GO:0007411: Axon
guidance (BP) |
|
3 | 0.01192 | 0.0359 | GO:0008284:
Positive regulation of cell proliferation (BP) |
|
3 | 0.02362 | 0.04835 | GO:0045893:
Positive regulation of transcription, DNA-dependent (BP) |
| Molecular
function |
|
|
|
| 13 | 0.00391 | 0.02429 | GO:0005515: Protein
binding (MF) |
|
7 | 1.6E-06 | 0.00019 | GO:0016491:
Oxidoreductase activity (MF) |
|
7 | 0.01988 | 0.04888 | GO:0000166:
Nucleotide binding (MF) |
|
6 | 0.01607 | 0.0431 | GO:0004872:
Receptor activity (MF) |
|
5 | 0.00871 | 0.03213 | GO:0016787:
Hydrolase activity (MF) |
|
4 | 0.00865 | 0.03294 | GO:0016740:
Transferase activity (MF) |
|
4 | 0.01535 | 0.04312 | GO:0004930:
G-protein coupled receptor activity (MF) |
| Cellular
component |
|
|
|
| 15 | 0.00234 | 0.03334 | GO:0005737:
Cytoplasm (CC) |
| 13 | 0.00169 | 0.03219 | GO:0016020:
Membrane (CC) |
| 11 | 0.00562 | 0.03205 | GO:0005886: Plasma
membrane (CC) |
|
9 | 0.00075 | 0.02125 | GO:0005576:
Extracellular region (CC) |
|
7 | 0.0028 | 0.02656 | GO:0005730:
Nucleolus (CC) |
|
6 | 0.00948 | 0.04156 | GO:0005739:
Mitochondrion (CC) |
|
5 | 0.00357 | 0.02911 | GO:0005615:
Extracellular space (CC) |
|
4 | 0.00072 | 0.04092 | GO:0005743:
Mitochondrial inner membrane (CC) |
|
3 | 0.00236 | 0.02696 | GO:0005759:
Mitochondrial matrix (CC) |
| KEGG pathway |
|
|
|
|
3 | 0.0089 | 0.0411 | (KEGG) 05200:
Pathways in cancer |
|
2 | 0.00215 | 0.02152 | (KEGG) 05213:
Endometrial cancer |
|
2 | 0.00258 | 0.02211 | (KEGG) 05221: Acute
myeloid leukemia |
|
2 | 0.00304 | 0.02282 | (KEGG) 05210:
Colorectal cancer |
|
2 | 0.00077 | 0.02304 | (KEGG) 00040:
Pentose and glucuronate interconversions |
|
2 | 0.00207 | 0.02485 | (KEGG) 00500:
Starch and sucrose metabolism |
|
2 | 0.00419 | 0.02514 | (KEGG) 05220:
Chronic myeloid leukemia |
|
2 | 0.00386 | 0.02574 | (KEGG) 05218:
Melanoma |
|
2 | 0.00184 | 0.02755 | (KEGG) 00520: Amino
sugar and nucleotide sugar metabolism |
|
2 | 0.00141 | 0.02818 | (KEGG) 05219:
Bladder cancer |
|
2 | 0.00551 | 0.03004 | (KEGG) 05222: Small
cell lung cancer |
|
2 | 0.00063 | 0.03755 | (KEGG) 05216:
Thyroid cancer |
|
2 | 0.01148 | 0.04919 | (KEGG) 04110: Cell
cycle |
|
2 | 0.01238 | 0.04953 | (KEGG) 04360: Axon
guidance |
Construction of risk score
formula
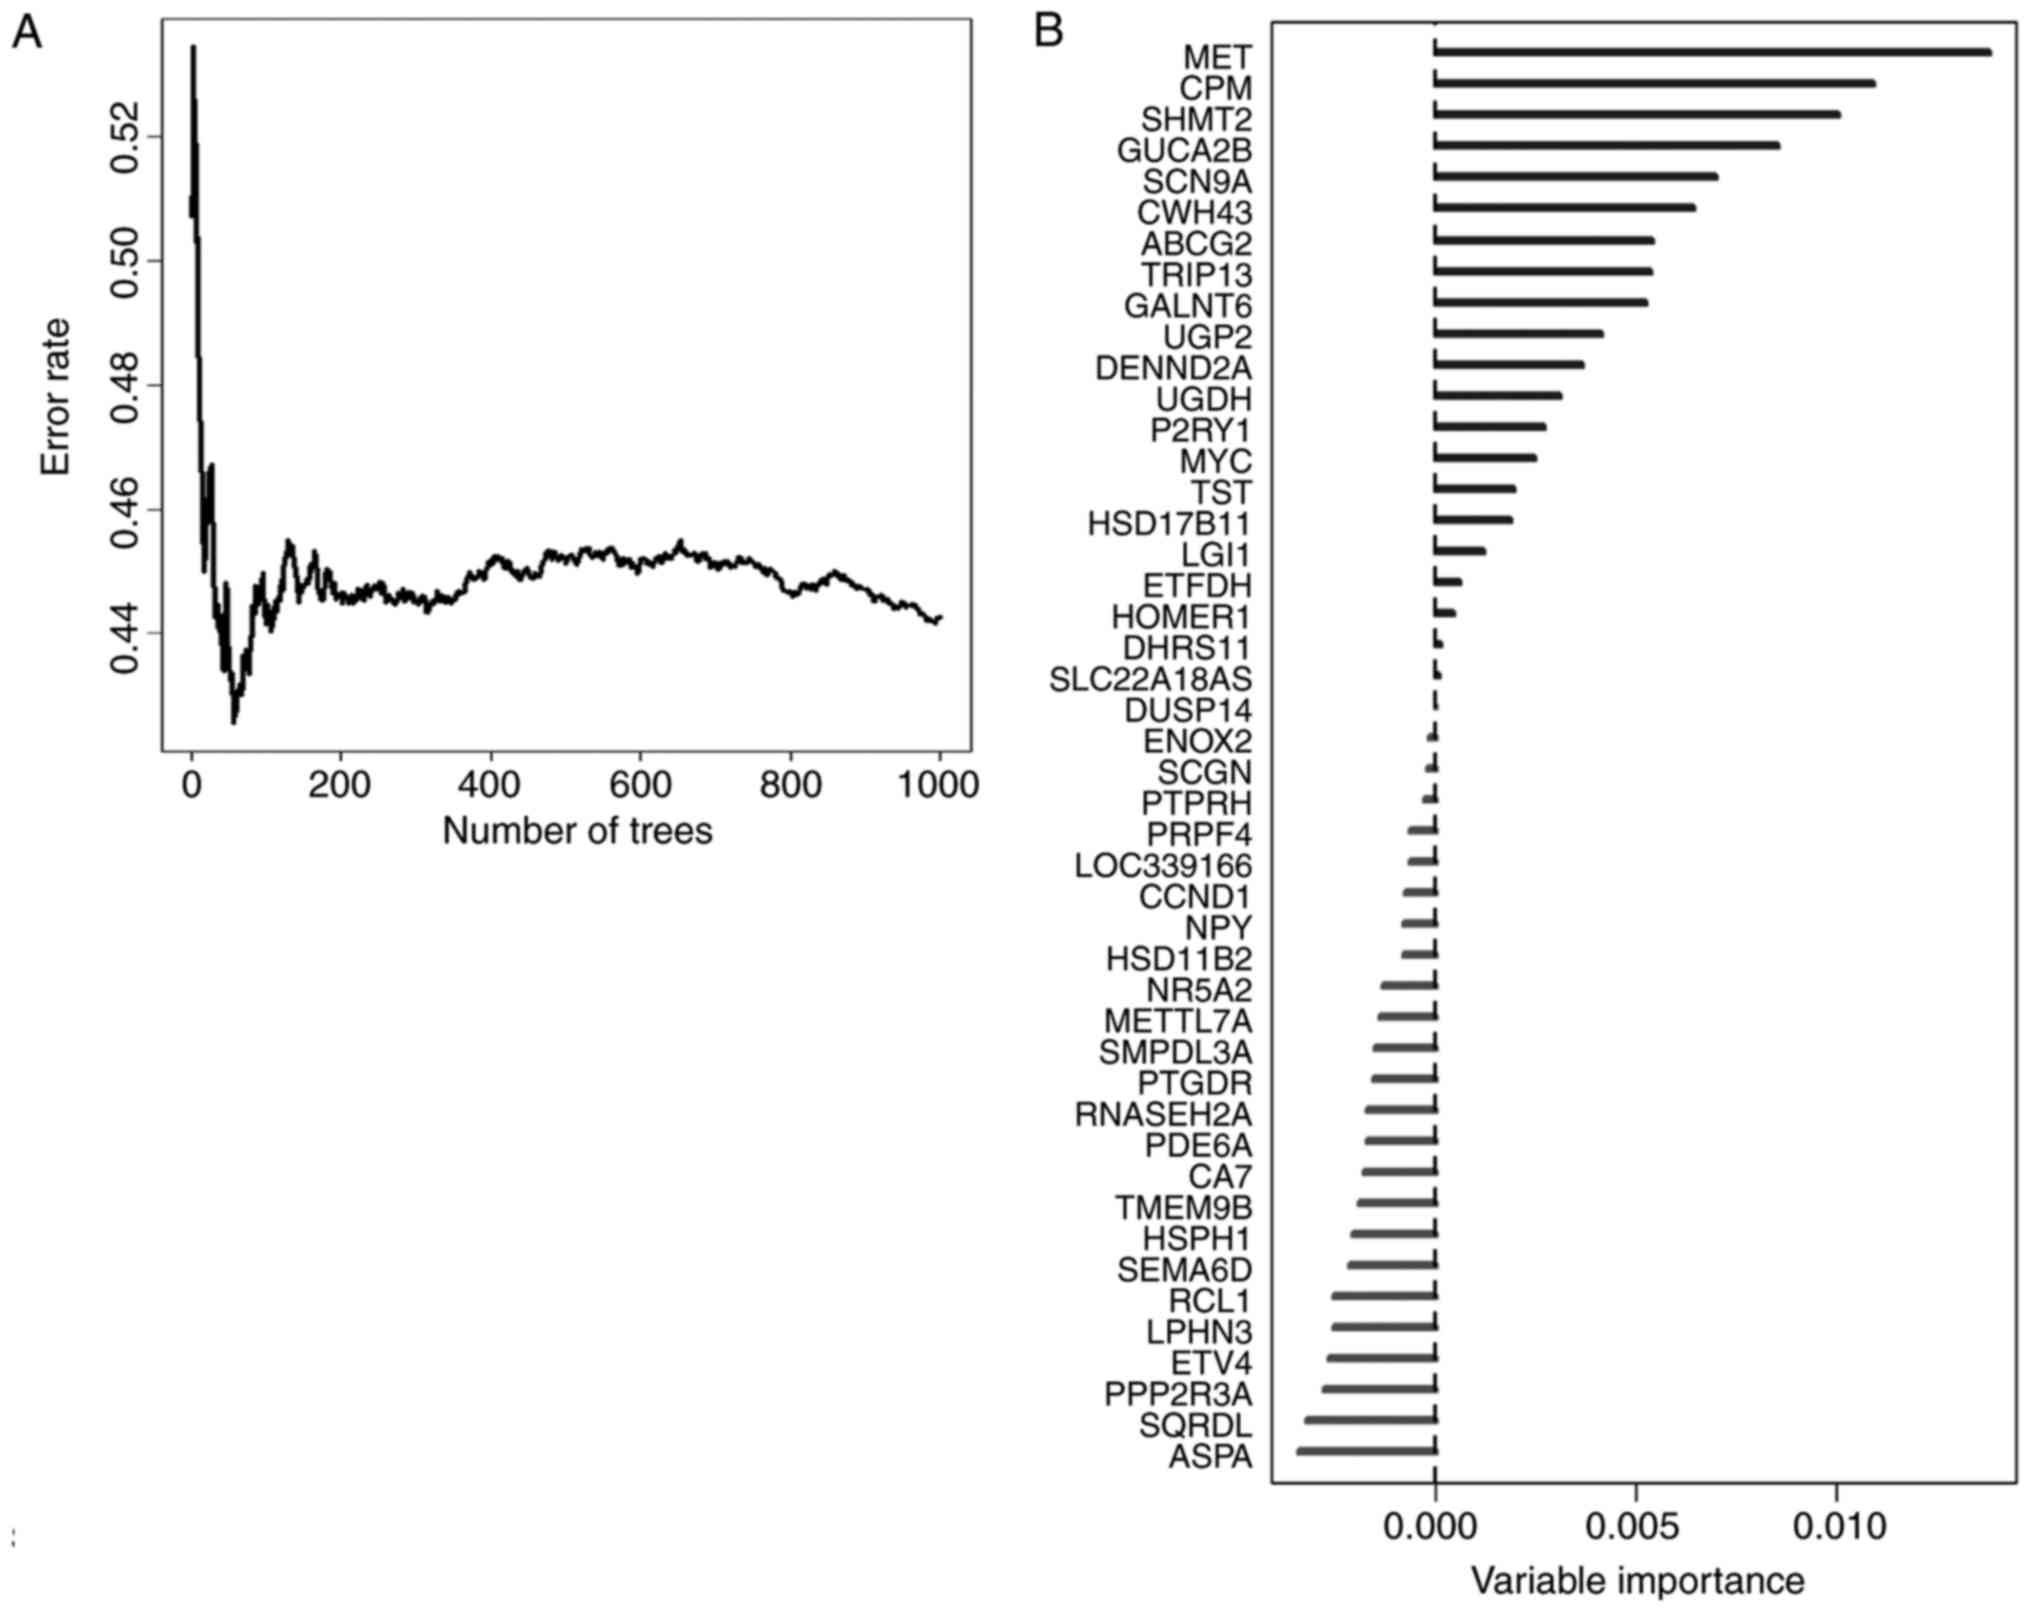
In order to select the most weighted genes, we
utilized random survival forests algorithm (Ntree =1,000, default
parameters of Hemant Ishwaran algorithm) (Fig. 3A), and set the 46 survival related
genes as variables in this model. We ranked these 46 genes by their
importance after the processing of random survival forests
algorithm via R software (Fig. 3B).
Five genes, namely MET, CPM, SHMT2, GUCA2B and SCN9A were selected
as the most important candidates (relative importance >0.5).
Relative importance means the relative value of a certain gene
normalized to the gene MET, which was the most important gene in
our random survival forests model (Fig.
3B, and detailed normalized data not shown). To investigate
whether the 5 candidates could provide an accurate prediction of
survival in CRC patients, the expression data of these genes were
fit into a multivariable cox regression model as covariates of the
training dataset. We obtained each gene's regression coefficient
and then built a risk score formula for each individual as
follows:
Risk score =−0.370* (expression value of CPM)-0.122*
(expression value of GUCA2B) + 0.332* (expression value of MET) +
0.088* (expression value of SCN9A) + 0.827* (expression value of
SHMT2).
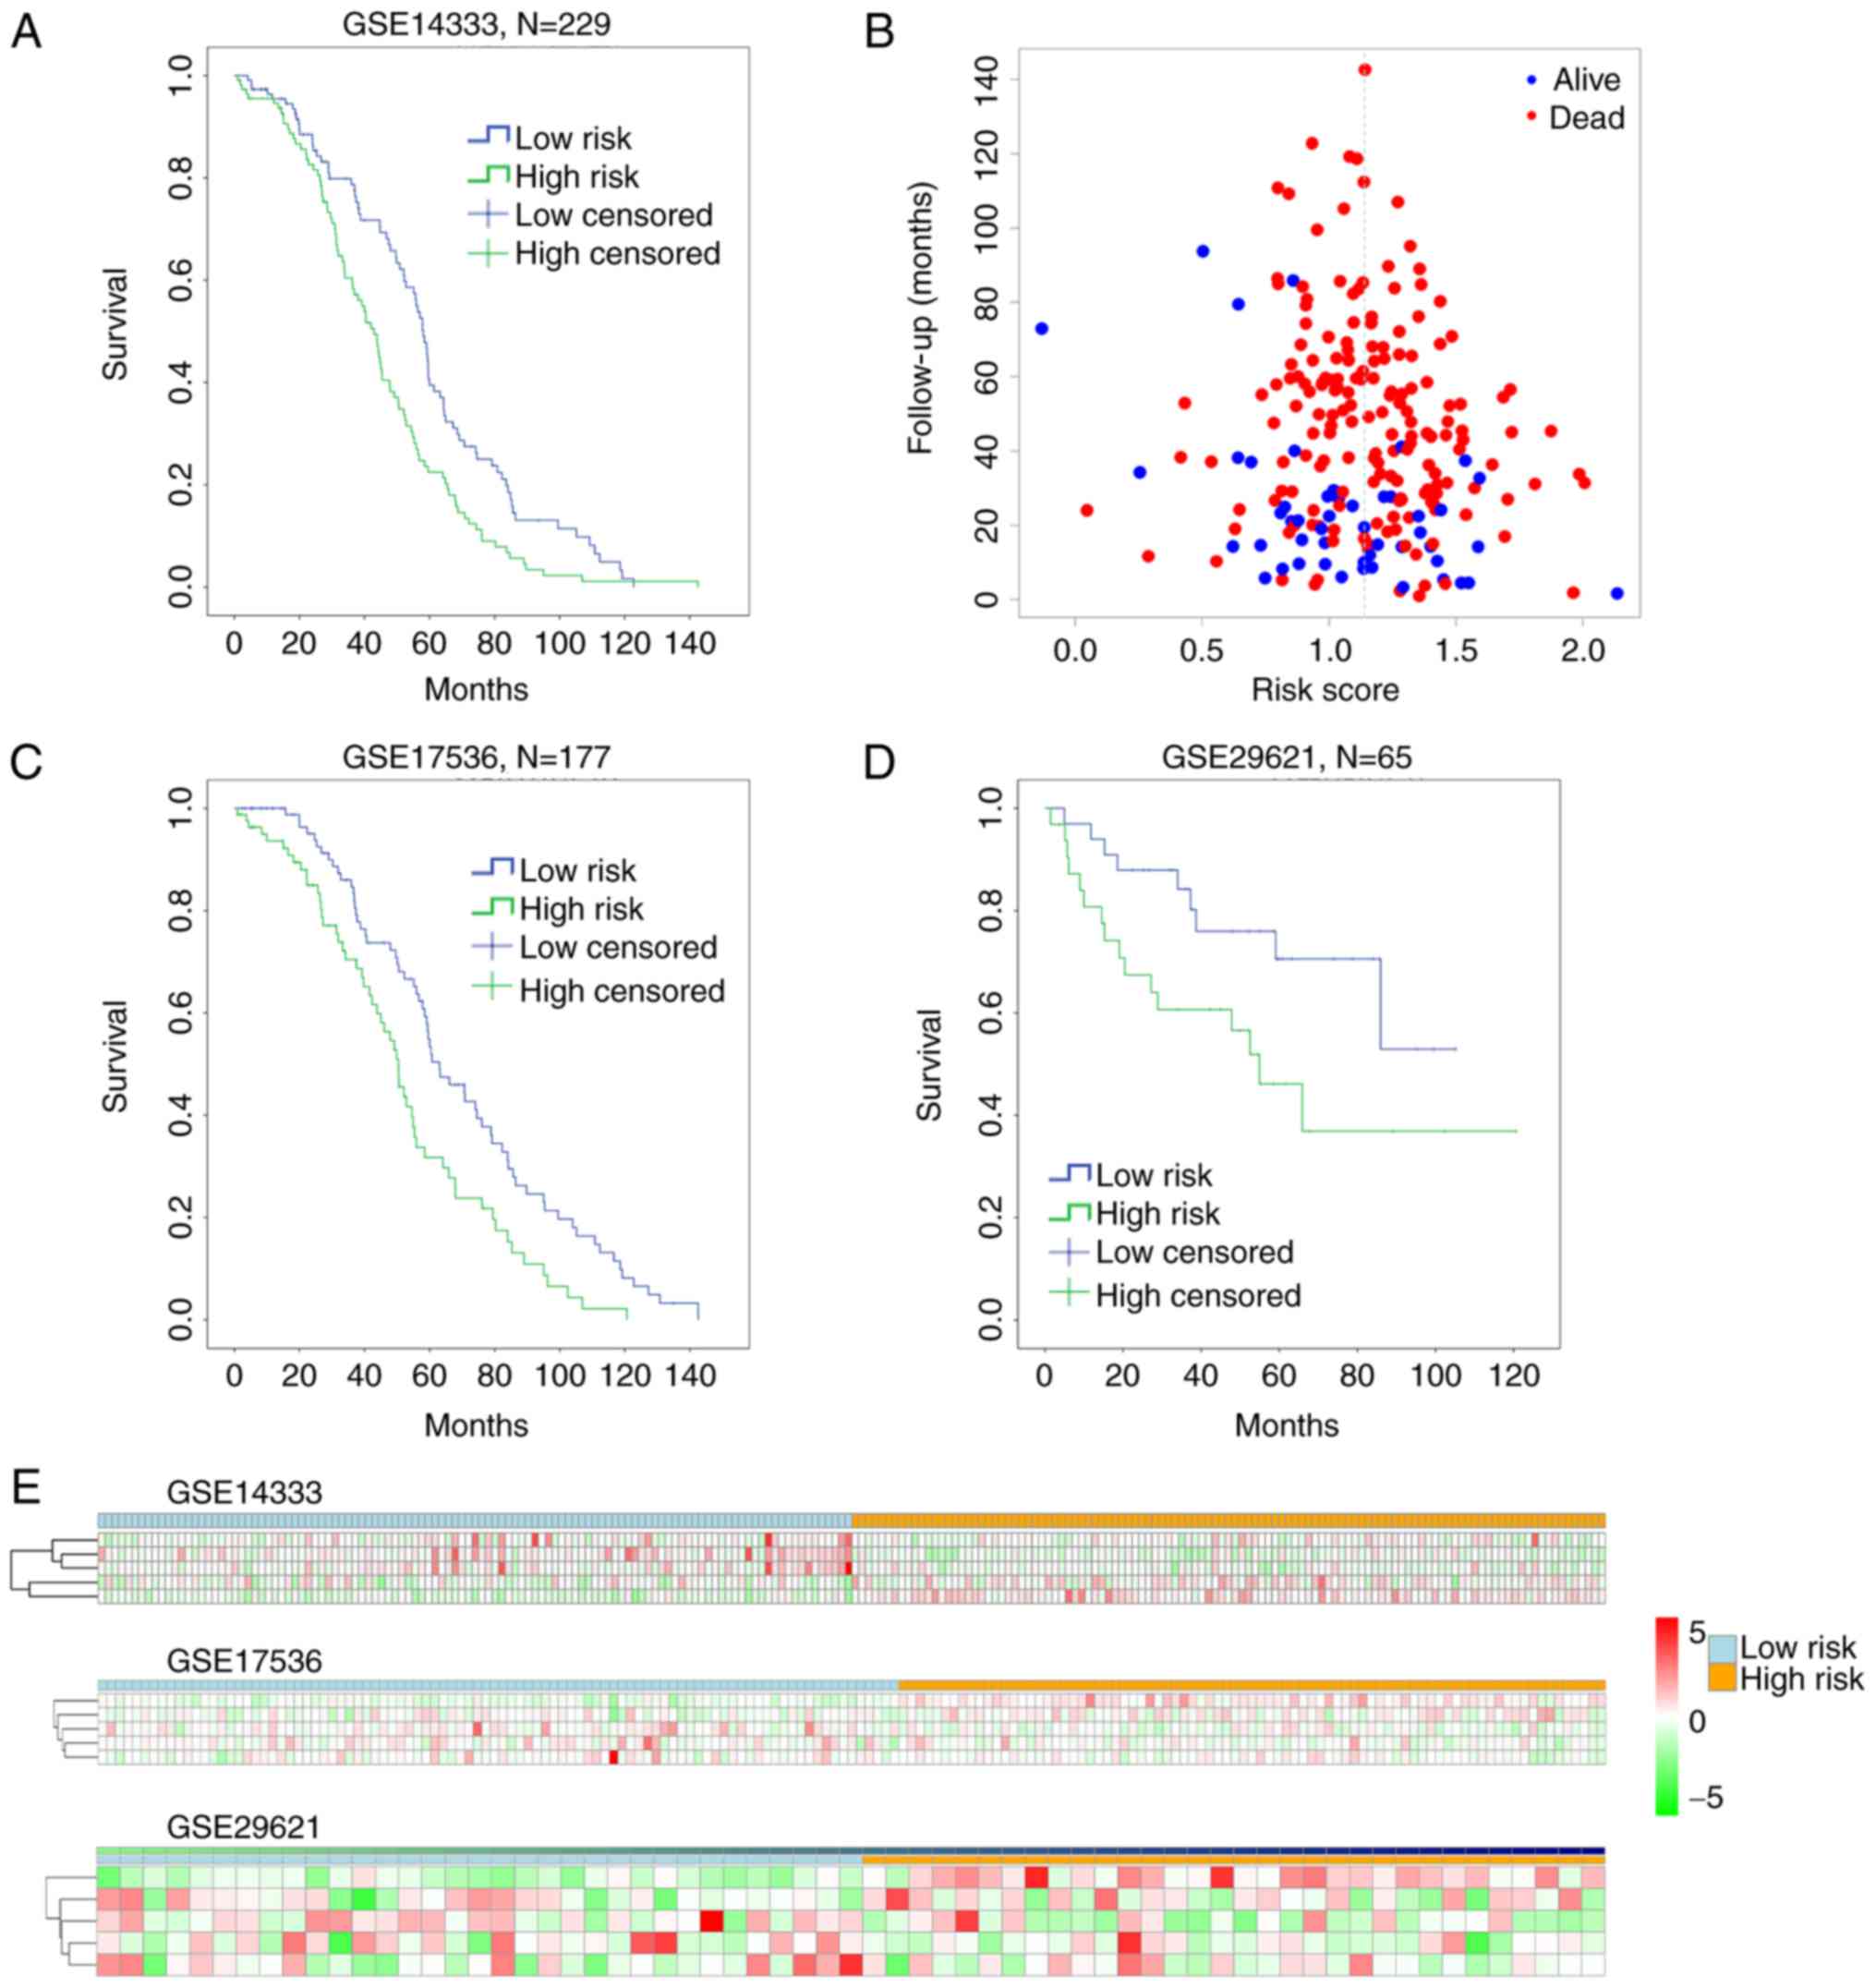
Cutting off by the median of the risk score, we
defined risk score < median as low-risk group, and risk score
> median as high-risk group. To assess the reliability of the
risk-score formula in predicting patients survival, we ranked all
the patients in the training set GSE14333, and divided them into
either high-risk group (n=116) or low-risk group (n=113; Fig. 4). Patients in the low-risk group had a
markedly longer overall survival than those in the high-risk group
(P=0.001, by Mantel-Cox log rank) (Fig.
4A). The distribution of the follow-up months of a certain risk
score and the live/dead status were shown in Fig. 4B. However, the P-value by Pearson
Chi-Square test was 0.109, suggesting no significant difference
between the live and dead status of patients with different risk
score, indicating that our work was more valuable in predicting
patient overall survival (Fig. 4A),
not the final live/dead status. Moreover, the distribution of risk
score in lower expression of SCN9A, CPM and GUCA2B as well as
higher expression of MET and SHMT2 showed relative homogeneity and
stability from patient to patient with high risk score (Fig. 4E upper).
In addition, we performed multivariable and
univariate cox regression analysis to elucidate the relationship
between risk score and other factors like sex, age of diagnosis and
Dukes stage. It was shown that risk score was the most significant
among other factors [P=0.005 (multivarible) and P=0.001
(univariable)], while age (P=0.016) and adjuvant radiation therapy
(P=0.021) were univariable factors to prognosis as reported
(19,20) (Table V
upper). These data suggested that the risk score could predict
patient survival directly and independently.
| Table V.Multivariable and univariable model
tests of risk score and other factors. |
Table V.
Multivariable and univariable model
tests of risk score and other factors.
| A, GSE14333 |
|---|
|
|---|
|
| Multivariable
model | Univariable
model |
|---|
|
|
|
|
|---|
| Variables | HR | 95% CI of HR |
| P-value | HR | 95% CI of HR |
| P-value |
|---|
| Risk score | 2.346 | 1.298 | 4.241 | 0.005 | 2.718 | 1.523 | 4.851 | 0.001 |
| Location | 0.965 | 0.814 | 1.144 | 0.683 | 0.892 | 0.76 | 1.047 | 0.163 |
| Dukes stage | 1.18 | 0.926 | 1.503 | 0.18 | 1.044 | 0.86 | 1.266 | 0.666 |
| Age of
diagnosis | 1.008 | 0.994 | 1.023 | 0.257 | 1.105 | 1.002 | 1.028 | 0.02 |
| Sex | 0.926 | 0.683 | 1.255 | 0.62 | 0.877 | 0.651 | 1.182 | 0.39 |
| Adj XRT | 0.463 | 0.218 | 0.984 | 0.045 | 0.433 | 0.212 | 0.884 | 0.021 |
| Adj CTX | 0.867 | 0.568 | 1.325 | 0.51 | 0.847 | 0.618 | 1.16 | 0.3 |
|
| B,
GSE17536 |
|
|
| Multivariable
model | Univariable
model |
|
|
|
|
|
Variables | HR | 95% CI of
HR |
| P-value | HR | 95% CI of
HR |
| P-value |
|
| Risk score | 2.745 | 1.204 | 6.262 | 0.016 | 3.283 | 1.489 | 7.236 | 0.003 |
| Age | 1.015 | 0.999 | 1.031 | 0.061 | 1.018 | 1.003 | 1.034 | 0.016 |
| Sex | 1.084 | 0.747 | 1.572 | 0.672 | 0.953 | 0.666 | 1.362 | 0.79 |
| Ethnicity | 0.967 | 0.728 | 1.284 | 0.817 | 0.915 | 0.685 | 1.221 | 0.545 |
| AJCC stage | 1.107 | 0.892 | 1.373 | 0.357 | 1.051 | 0.861 | 1.284 | 0.625 |
| grade | 1.254 | 0.828 | 1.898 | 0.285 | 1.375 | 0.924 | 2.045 | 0.116 |
|
| C,
GSE29621 |
|---|
|
|
| Multivariable
model | Univariable
model |
|
|
|
|
|
Variables | HR | 95% CI of
HR |
| P-value | HR | 95% CI of
HR |
| P-value |
|
| Risk score | 9.03 | 1.425 | 57.223 | 0.019 | 2.526 | 0.481 | 13.269 | 2.73E-05 |
| Sex | 1.243 | 0.513 | 3.014 | 0.63 | 1.508 | 0.649 | 3.505 | 0.34 |
| T stage | 0.449 | 0.091 | 2.209 | 0.325 | 1.048 | 0.438 | 2.509 | 0.915 |
| N stage | 1.583 | 0.604 | 4.143 | 0.35 | 2.688 | 1.526 | 4.734 | 0.001 |
| M stage | 2.065 | 0.368 | 11.592 | 0.41 | 4.934 | 2.188 | 11.124 | 1.19E-04 |
| Histology
grade | 0.849 | 0.325 | 2.219 | 0.738 | 0.665 | 0.284 | 1.558 | 0.348 |
| AJCC stage | 1.965 | 0.518 | 7.45 | 0.321 | 2.708 | 1.615 | 4.542 | 1.59E-04 |
Validation of risk score in predicting
survival within independent CRC datasets
To further evaluate the clinical value of this risk
score, we used 2 independent CRC datasets GSE17536 (n=177) and
GSE29621 (n=65) with survival information. We utilized the
threshold in GSE14333 to classify high-risk and low-risk groups.
Both datasets showed that high risk score patients had lower
overall survival (P=0.001, GSE17536; P=0.038, GSE29621) (Fig. 4C and D). The 5 biomarkers of risk
score (MET, CPM, SHMT2, GUCA2B and SCN9A) perform a similar
stability in GSE17536 and GSE29621 as in GSE14333 (Fig. 4E middle and lower). In addition, by
multivariable and univariate cox regression analysis, we confirmed
that this risk score was the most significant in GSE17536 [P=0.016
(multivarible) and P=0.003 (univariable)], while P-value of other
factors >0.05 except age, which was a univariable significant
only (P=0.016) (Table V middle). In
GSE29621, risk score was also the most significant (P=0.019
(multivarible) and P=2.73E-05 (univariable)), while N, M stage (TNM
staging) and AJCC stage were only univariable significant (Table V lower), as it was easy to comprehend
that metastasis and stage was related to patient outcome (21). These data indicated that risk score
could directly predict patient survival.
Discussion
In the present study, we have identified and
verified 46 survival related-biomarkers from 66 DEGs in CRC and
then built a prognostic risk score which could be translated into
the clinical setting. The 46 survival related-biomarkers mainly
located in cytoplasm, membrane and nucleolus, only a small portion
in mitochondria and other sub-cellular parts. Their GO enrichment
showed that these genes involved in multiple biological processes
such as response to drug, metabolic process, cell proliferation,
and positive regulation of cell proliferation. Obviously, these
biological processes played a pivotal role in cancer proliferation,
drug-resistance, and metastasis, thus further affecting patient
survival (22–24). Genes like MYC and CCND1 within CRC
pathway in KEGG annotation also participated in other cancer
pathway as endometrial cancer or chronic myeloid leukemia (25,26). After
that, we ranked the 46 survival-related genes by random survival
forests algorithm and got five most important biomarkers namely
MET, CPM, SHMT2, GUCA2B and SCN9A.
Recently, MET was reported gradually upregulated in
the development and progression of CRC from normal epithelium to
adenoma, colorectal carcinoma and metastases (27,28).
Although others argued that the increase of MET in metastatic CRC
was an acquired response to EGFR inhibition, not a de novo
phenomenon (29), its prognostic
value was confirmed by several independent researches (30,31).
Moreover, suppressing MET by specific inhibitor or shRNA has a
therapeutic role in CRC (32,33). CPM was less reported, and only one
literature revealed that it was the target of miR-146a which
promoted cell migration and invasion in CRC via CPM/src-FAK pathway
(34). It was suggested that CPM has
the potential to be a therapeutic target in cancer (35), but its function still need further
discovery. SHMT2 participated in the cellular one-carbon
metabolism, and has been implicated as a critical component for
tumor survival. Its upregulation was correlated with tumor
proliferation in several cancers (36,37). Kim
et al found SHMT2 activity limits that of pyruvate kinase
(PKM2) and reduces oxygen consumption, thus eliciting a metabolic
switch that confers a profound survival advantage to cells in
poorly vascularized regions (38).
GUCA2B and SCN9A were rarely demonstrated in cancer and more light
should shed on their role in CRC. The cause and progression of CRC
are complicated and remains to be further elucidated, and we think
the rest genes in Table III should
have potential value in better interpreting the carcinogenesis and
progression of CRC.
Moreover, we established a linear risk score as a
survival predicting model based on the above five genes by
multivariable Cox regression using highly reliable CRC datasets.
This risk score predicted patients at high risk of mortality
independently and directly in all validation datasets. Although
more prospective studies are necessary to further validate the
reliability and robustness of this risk score, our work provide an
new method toward clinical applications of gene expression
profiling in CRC, especially in future personalized prediction and
precision medicine.
Acknowledgements
The present study was supported by grants from the
Ministry of Science and Technology of China (grant no.
2013CB945401) and the National Natural Science Foundation of China
(grant no. 81500503). Data which were not shown in this article
could be archived by contacting the corresponding author.
References
|
1
|
Torre LA, Bray F, Siegel RL, Ferlay J,
Lortet-Tieulent J and Jemal A: Global cancer statistics, 2012. CA
Cancer J Clin. 65:87–108. 2015. View Article : Google Scholar : PubMed/NCBI
|
|
2
|
Siegel RL, Miller KD and Jemal A: Cancer
Statistics, 2017. CA Cancer J Clin. 67:7–30. 2017. View Article : Google Scholar : PubMed/NCBI
|
|
3
|
Frampton M and Houlston RS: Modeling the
prevention of colorectal cancer from the combined impact of host
and behavioral risk factors. Genet Med. 19:314–321. 2017.
View Article : Google Scholar : PubMed/NCBI
|
|
4
|
Inadomi JM: Screening for colorectal
neoplasia. N Engl J Med. 376:149–156. 2017. View Article : Google Scholar : PubMed/NCBI
|
|
5
|
Chang W, Gao X, Han Y, Du Y, Liu Q, Wang
L, Tan X, Zhang Q, Liu Y, Zhu Y, et al: Gene expression
profiling-derived immunohistochemistry signature with high
prognostic value in colorectal carcinoma. Gut. 63:1457–1467. 2014.
View Article : Google Scholar : PubMed/NCBI
|
|
6
|
Shahid M, Choi TG, Nguyen MN, Matondo A,
Jo YH, Yoo JY, Nguyen NN, Yun HR, Kim J, Akter S, et al: An 8-gene
signature for prediction of prognosis and chemoresponse in
non-small cell lung cancer. Oncotarget. 7:86561–86572.
2016.PubMed/NCBI
|
|
7
|
Francois-Vaughan H, Adebayo AO, Brilliant
KE, Parry NMA, Gruppuso PA and Sanders JA: Persistent effect of
mTOR inhibition on preneoplastic foci progression and gene
expression in a rat model of hepatocellular carcinoma.
Carcinogenesis. 37:408–419. 2016. View Article : Google Scholar : PubMed/NCBI
|
|
8
|
Baek SJ, Sato K, Nishida N, Koseki J,
Azuma R, Kawamoto K, Konno M, Hayashi K, Satoh T, Doki Y, et al:
MicroRNA miR-374, a potential radiosensitizer for carbon ion beam
radiotherapy. Oncol Rep. 36:2946–2950. 2016. View Article : Google Scholar : PubMed/NCBI
|
|
9
|
Paula LM, De Moraes LH, Do Canto AL, Dos
Santos L, Martin AA, Rogatto SR and De Azevedo Canevari R: Analysis
of molecular markers as predictive factors of lymph node
involvement in breast carcinoma. Oncol Lett. 13:488–496.
2017.PubMed/NCBI
|
|
10
|
Li G, Li X, Yang M, Xu L, Deng S and Ran
L: Prediction of biomarkers of oral squamous cell carcinoma using
microarray technology. Sci Rep. 7:421052017. View Article : Google Scholar : PubMed/NCBI
|
|
11
|
Viziteu E, Klein B, Basbous J, Lin YL,
Hirtz C, Gourzones C, Tiers L, Bruyer A, Vincent L, Grandmougin C,
et al: RECQ1 helicase is involved in replication stress survival
and drug resistance in multiple myeloma. Leukemia. Mar
10–2017.(Epub ahead of print). View Article : Google Scholar : PubMed/NCBI
|
|
12
|
Wu J, Wang J and Shen W: Identification of
MAGEA12 as a prognostic outlier gene in gastric cancers. Neoplasma.
64:238–243. 2017. View Article : Google Scholar : PubMed/NCBI
|
|
13
|
Jo J, Nam CM, Sull JW, Yun JE, Kim SY, Lee
SJ, Kim YN, Park EJ, Kimm H and Jee SH: Prediction of colorectal
cancer risk using a genetic risk score: The Korean cancer
prevention study-II (KCPS-II). Genomics Inform. 10:175–183. 2012.
View Article : Google Scholar : PubMed/NCBI
|
|
14
|
Ito H, Mo Q, Qin LX, Viale A, Maithel SK,
Maker AV, Shia J, Kingham P, Allen P, DeMatteo RP, et al: Gene
expression profiles accurately predict outcome following liver
resection in patients with metastatic colorectal cancer. PLoS One.
8:e816802013. View Article : Google Scholar : PubMed/NCBI
|
|
15
|
Mármol I, Sánchez-de-Diego C, Dieste
Pradilla A, Cerrada E and Yoldi Rodriguez MJ: Colorectal carcinoma:
A general overview and future perspectives in colorectal cancer.
Int J Mol Sci. 18:pii:E1972017. View Article : Google Scholar
|
|
16
|
Zhu Q, Izumchenko E, Aliper AM, Makarev E,
Paz K, Buzdin AA, Zhavoronkov AA and Sidransky D: Pathway
activation strength is a novel independent prognostic biomarker for
cetuximab sensitivity in colorectal cancer patients. Hum Genome
Var. 2:150092015. View Article : Google Scholar : PubMed/NCBI
|
|
17
|
Zhu T, Gao YF, Chen YX, Wang ZB, Yin JY,
Mao XY, Li X, Zhang W, Zhou HH and Liu ZQ: Genome-scale analysis
identifies GJB2 and ERO1LB as prognosis markers in patients with
pancreatic cancer. Oncotarget. 8:21281–21289. 2017.PubMed/NCBI
|
|
18
|
Tabas-Madrid D, Nogales-Cadenas R and
Pascual-Montano A: GeneCodis3: A non-redundant and modular
enrichment analysis tool for functional genomics. Nucleic Acids
Res. 40:W478–W483. 2012. View Article : Google Scholar : PubMed/NCBI
|
|
19
|
Gruber-Rouh T, Marko C, Thalhammer A,
Nour-Eldin NE, Langenbach M, Beeres M, Naguib NN, Zangos S and Vogl
TJ: Current strategies in interventional oncology of colorectal
liver metastases. Br J Radiol. May 26–2016.(Epub ahead of print).
View Article : Google Scholar : PubMed/NCBI
|
|
20
|
Song N, Shin A, Park JW, Kim J and Oh JH:
Common risk variants for colorectal cancer: An evaluation of
associations with age at cancer onset. Sci Rep. 7:406442017.
View Article : Google Scholar : PubMed/NCBI
|
|
21
|
Slattery ML, Herrick JS, Mullany LE, Gertz
J and Wolff RK: Improved survival among colon cancer patients with
increased differentially expressed pathways. BMC Med. 13:752015.
View Article : Google Scholar : PubMed/NCBI
|
|
22
|
Dong G, Mao Q, Yu D, Zhang Y, Qiu M, Dong
G, Chen Q, Xia W, Wang J, Xu L and Jiang F: Integrative analysis of
copy number and transcriptional expression profiles in esophageal
cancer to identify a novel driver gene for therapy. Sci Rep.
7:420602017. View Article : Google Scholar : PubMed/NCBI
|
|
23
|
Gao B, Shao Q, Choudhry H, Marcus V, Dong
K, Ragoussis J and Gao ZH: Weighted gene co-expression network
analysis of colorectal cancer liver metastasis genome sequencing
data and screening of anti-metastasis drugs. Int J Oncol.
49:1108–1118. 2016. View Article : Google Scholar : PubMed/NCBI
|
|
24
|
Xiong W, Gao D, Li Y, Liu X, Dai P, Qin J,
Wang G, Li K, Bai H and Li W: Genome-wide profiling of
chemoradiation-induced changes in alternative splicing in colon
cancer cells. Oncol Rep. 36:2142–2150. 2016. View Article : Google Scholar : PubMed/NCBI
|
|
25
|
Huang H, Jiang X, Wang J, Li Y, Song CX,
Chen P, Li S, Gurbuxani S, Arnovitz S, Wang Y, et al:
Identification of MLL-fusion/MYC-miR-26-TET1 signaling circuit in
MLL-rearranged leukemia. Cancer Lett. 372:157–165. 2016. View Article : Google Scholar : PubMed/NCBI
|
|
26
|
Zhu XL, Ai ZH, Wang J, Xu YL and Teng YC:
Weighted gene co-expression network analysis in identification of
endometrial cancer prognosis markers. Asian Pac J Cancer Prev.
13:4607–4611. 2012. View Article : Google Scholar : PubMed/NCBI
|
|
27
|
Bradley CA, Dunne PD, Bingham V, McQuaid
S, Khawaja H, Craig S, James J, Moore WL, McArt DG, Lawler M, et
al: Transcriptional upregulation of c-MET is associated with
invasion and tumor budding in colorectal cancer. Oncotarget.
7:78932–78945. 2016.PubMed/NCBI
|
|
28
|
Gayyed MF, Abd El-Maqsoud NM, El-Heeny
El-Hameed AA and Mohammed MF: c-MET expression in colorectal
adenomas and primary carcinomas with its corresponding metastases.
J Gastrointest Oncol. 6:618–627. 2015.PubMed/NCBI
|
|
29
|
Raghav K, Morris V, Tang C, Morelli P,
Amin HM, Chen K, Manyam GC, Broom B, Overman MJ, Shaw K, et al: MET
amplification in metastatic colorectal cancer: An acquired response
to EGFR inhibition, not a de novo phenomenon. Oncotarget.
7:54627–54631. 2016. View Article : Google Scholar : PubMed/NCBI
|
|
30
|
Al-Maghrabi J, Emam E, Gomaa W, Saggaf M,
Buhmeida A, Al-Qahtani M and Al-Ahwal M: c-MET immunostaining in
colorectal carcinoma is associated with local disease recurrence.
BMC Cancer. 15:6762015. View Article : Google Scholar : PubMed/NCBI
|
|
31
|
Takahashi N, Iwasa S, Taniguchi H, Sasaki
Y, Shoji H, Honma Y, Takashima A, Okita N, Kato K, Hamaguchi T, et
al: Prognostic role of ERBB2, MET and VEGFA expression in
metastatic colorectal cancer patients treated with anti-EGFR
antibodies. Br J Cancer. 114:1003–1011. 2016. View Article : Google Scholar : PubMed/NCBI
|
|
32
|
Jia Y, Dai G, Wang J, Gao X, Zhao Z, Duan
Z, Gu B, Yang W, Wu J, Ju Y, et al: c-MET inhibition enhances the
response of the colorectal cancer cells to irradiation in
vitro and in vivo. Oncol Lett. 11:2879–2885.
2016.PubMed/NCBI
|
|
33
|
Sun Y, Sun L, An Y and Shen X:
Cabozantinib, a Novel c-Met Inhibitor, inhibits colorectal cancer
development in a Xenograft model. Med Sci Monit. 21:2316–2321.
2015. View Article : Google Scholar : PubMed/NCBI
|
|
34
|
Lu D, Yao Q, Zhan C, Le-Meng Z, Liu H, Cai
Y, Tu C, Li X, Zou Y and Zhang S: MicroRNA-146a promote cell
migration and invasion in human colorectal cancer via
carboxypeptidase M/src-FAK pathway. Oncotarget. 8:22674–22684.
2017.PubMed/NCBI
|
|
35
|
Denis CJ and Lambeir AM: The potential of
carboxypeptidase M as a therapeutic target in cancer. Expert Opin
Ther Targets. 17:265–279. 2013. View Article : Google Scholar : PubMed/NCBI
|
|
36
|
Wang B, Wang W, Zhu Z, Zhang X, Tang F,
Wang D, Liu X, Yan X and Zhuang H: Mitochondrial serine
hydroxymethyltransferase 2 is a potential diagnostic and prognostic
biomarker for human glioma. Clin Neurol Neurosurg. 154:28–33. 2017.
View Article : Google Scholar : PubMed/NCBI
|
|
37
|
Zhang L, Chen Z, Xue D, Zhang Q, Liu X,
Luh F, Hong L, Zhang H, Pan F, Liu Y, et al: Prognostic and
therapeutic value of mitochondrial serine
hydroxyl-methyltransferase 2 as a breast cancer biomarker. Oncol
Rep. 36:2489–2500. 2016. View Article : Google Scholar : PubMed/NCBI
|
|
38
|
Kim D, Fiske BP, Birsoy K, Freinkman E,
Kami K, Possemato RL, Chudnovsky Y, Pacold ME, Chen WW, Cantor JR,
et al: SHMT2 drives glioma cell survival in ischaemia but imposes a
dependence on glycine clearance. Nature. 520:363–367. 2015.
View Article : Google Scholar : PubMed/NCBI
|