Introduction
Hyperprolactinemia is most commonly caused by
prolactinoma, but may also be caused by other types of pituitary
adenomas, in addition to the pituitary stalk interruption effect,
peritumoral pituitary compression and endocrine feedback (1,2). Pituitary
adenoma-associated hyperprolactinemia is usually considered to be
caused by prolactinoma, but other types of pituitary adenomas may
also cause secondary hyperprolactinemia. For example, the incidence
of non-functional pituitary large adenoma-associated secondary
hyperprolactinemia is 34.8–41.2% (3–8). The
presence of secondary hyperprolactinemia makes it difficult to
differentiate prolactinoma from other types of pituitary adenomas
(9–12). However, the treatment for prolactinoma
differs greatly from that of other types of pituitary adenomas.
Thus, it is of great importance to differentiate prolactinoma from
other types of pituitary adenomas. Currently, clinical symptoms,
imaging and pituitary hormone tests are used for this differential
diagnosis, but the diagnostic accuracy of these techniques is
limited (11,13–15).
Therefore, the present study was designed to
identify a novel diagnostic approach for differentiating
prolactinoma from other types of pituitary adenomas. The prolactin
(PRL) level in prolactinomas is strongly associated with tumor size
(16). As the tumor size increases,
the synthesis and release of PRL is enhanced. However, the PRL
levels of other types of pituitary adenomas depend more upon the
location of the adenomas (17) and
the increased size of the adenoma may not lead to a significant
increase in PRL.
The present study proposed the use of the
prolactin/adenoma maximum diameter (PRL/MD) and the
prolactin/adenoma volume (PRL/V) as novel diagnostic tools for
prolactinoma, and the diagnostic value of these methods was
investigated. Due to the fact that mis-differentiation occurs only
in large adenomas, the present study primarily included large
pituitary adenomas (diameter ≥10 mm). Meanwhile, the
Hyperprolactinemia Treatment Guidelines of the European Endocrine
Society demonstrate that a PRL >250 µg/l is most likely caused
by prolactinoma (15). Therefore,
only patients with a PRL between the upper limit of the normal
range and 250 µg/l were included in the present study.
Patients and methods
Patients
Data from 516 patients with pituitary adenoma who
had been admitted to the Department of Neurosurgery, Fuzhou General
Hospital (Fuzhou, China) between December 2008 and December 2014
were retrospectively analyzed. A total of 178 of these were cases
of large pituitary adenoma with hyperprolactinemia.
The inclusion criteria of the present study were as
follows: i) Pituitary adenoma diagnosed by pathology and classified
by immunohistochemistry (18,19); ii) having undergone ≥1 set of
concurrent pituitary hormone tests and magnetic resonance imaging
(MRI) prior to treatment; iii) a pituitary adenoma diameter >10
mm; and iv) a PRL between the upper limit of the normal range [PRL,
2.1–17.7 µg/l (male), 2.8–29.2 µg/l (female, not pregnant),
1.8–20.3 µg/l (female, menopause) and 3.4–33.4 µg/l (female,
ovulatory phase)] and 250 µg/l. The exclusion criteria were as
follows: i) The presence of other primary endocrine diseases,
including hyperthyroidism and Cushing's syndrome; ii) pituitary
hormone tests exhibiting growth hormone (GH; <10 µg/l),
thyroid-stimulating hormone (TSH; 0.35–5.5 µIU/ml) or
adrenocorticotropic hormone (ACTH; 4.7–48.8 pg/ml) levels above the
upper normal limit; iii) a history of glucocorticoid replacement
therapy; and iv) recent treatment with drugs that affect pituitary
hormone levels, including antipsychotic drugs, opioids, proton pump
inhibitors, estrogen preparations and calcium antagonists. The
surgical indications were as follows: i) A poor efficacy of medical
therapy after 3–6 months of treatment; ii) the inability to
tolerate medical therapy; iii) a lack of mental capacity to live
with the tumor (determined by an interview with the patients or
their family) or refusal of long-term medication; iv) the presence
of tumor apoplexy, manifesting as severe headaches and a sharp
decrease in vision; and v) experienced surgeons anticipating total
tumor removal by surgery having fully taken into consideration the
wishes of the patients (20).
Finally, there were 118 patients included in the
present study. Patients were divided into two groups, with PRL(+),
GH(−), ACTH(−), TSH(−), follicle-stimulating hormone (FSH) (−), and
luteinizing hormone (LH)(−) patients (as assessed by
immunohistochemistry) in group A (prolactinoma group, n=30) and all
other patients in group B (other types of pituitary adenoma, n=88).
The mean ages of the two groups were 35.27 (range, 19–64 years) in
group A and 47.61 in group B (range, 20–74 years). The male:female
ratio consisted of 7:23 in group A and 33:55 in group B. Prior
written and informed consent was obtained from each patient and the
study was approved by the Ethics Review Board of Fuzhou General
Hospital.
Determination of tumor maximum
diameter (MD) and tumor volume (V) by enhanced and plain MRI
scanning
All patients underwent an enhanced and a plain MRI
scan using a Siemens 3.0T MRI machine (Magnetom; Siemens AG,
Munich, Germany). The scan sequences included at least axial and
sagittal T1-weighted imaging, axial and coronal T2-weighted
imaging, coronal fluid-attenuated inversion recovery and a
three-dimensional enhanced scan. The imaging was measured at an
INFINITT PACS workstation (PACS; INFINITT Healthcare Co., Ltd.,
Seoul, South Korea) by at least one neurosurgeon, one radiologist
and one neurosurgery physician.
The tumor MD of all planes (including coronal,
sagittal and axial) was measured, and the tumor was categorized as
a micro pituitary adenoma (<10 mm), large pituitary adenoma (10≤
MD <0 mm) or macro pituitary adenoma (≥40 mm), as described
previously (21). The maximum coronal
length (a) and the sagittal width (b) were measured on enhanced
T1-weighted imaging, and the maximum height (c) was measured at the
middle sella turcica (middle cavernous) in the coronal section. The
tumor V was calculated as follows: V=a × b × c × π/6 (22).
Detection of hormone level by
chemiluminescence
The levels of TSH, triiodothyronine (T3), thyroxine
(T4), free triiodothyronine (FT3), free thyroxine (FT4), LH, FSH,
PRL, ACTH, GH, estradiol, testosterone and cortisol were measured.
A volume of 10 ml blood was collected from fasting outpatients (at
8:00 a.m.) and inpatients (at 7:00 a.m.), all of whom were in a
resting state. Chemiluminescence was used to detect hormone levels
using the ADVIA Centaur XP Immunoassay system (Siemens AG). The
normal ranges of these hormones were: GH, <10 µg/l; ACTH,
4.7–48.8 pg/ml; T3, 0.92–2.79 µg/l; T4, 58.1–140.6 µg/l; FT3,
3.5–6.5 pmol/l; FT4, 11.5–22.7 pmol/l; TSH, 0.35–5.5 µIU/ml; PRL,
2.1–17.7 µg/l (male), 2.8–29.2 µg/l (female, not pregnant),
1.8–20.3 µg/l (female, menopause) and 3.4–33.4 µg/l (female,
ovulatory phase); FSH, 1.4–18.1 mIU/ml (male), 9.7–208 mIU/ml
(female, pregnancy), 2.5–10.2 mIU/ml (female, follicular phase),
1.5–9.1 mIU/ml (female, luteal phase) and 23–116 mIU/ml (female,
menopause); and LH, 1.5–9.3 mIU/ml (male), 1.9–12.5 mIU/ml (female,
follicular phase), 8.7–76.3 mIU/ml (female, ovulatory phase),
0.5–16.9 mIU/ml (female, luteal phase) and 15.9–54 mIU/ml (female,
menopause). For suspected prolactinoma patients with significantly
low PRL levels, the PRL level was retested with a dilution of 1:100
to exclude the Hook effect (23,24). The
PRL/MD (µg/(l × mm)) was the ratio of PRL (µg) to MD (l × mm). The
PRL/V µg/(l × cm3) was the ratio of PRL (µg) to V (l ×
cm3).
Statistical analysis
SPSS 19.0 statistical software (IBM Corp., Armonk,
NY, US) was used for statistical analysis. Normally distributed
data are expressed as the mean ± standard deviation. The values of
PRL, PRL/MD and PRL/V that were not normally distributed are
expressed as the median (range). Categorical data were compared
using the χ2 test and quantitative data were compared
using Student's t-test, analysis of variance followed by Tukey's
test for post-hoc multiple comparisons and the rank sum test. The
diagnostic sensitivity (SE), specificity (SP), positive predictive
value (PPV) and negative predictive value (NPV), and the diagnostic
accuracy of PRL, PRL/MD and PRL/V were recorded. Receiver operating
characteristic (ROC) curves were drawn to identify the cut-off
point [corresponding to the maximum Youden index (YI)]. The area
under the curve (AUC) was compared using Student's t-test.
P<0.05 was considered to indicate a statistically significant
difference.
Results
Characteristics of patients
The 118 pituitary adenoma cases with PRL between the
upper limit of the normal range and 250 µg/l were included,
including 30 cases in group A (prolactinoma group) and 88 cases in
group B (other pituitary adenoma group). There was no significant
difference in gender ratio between the two groups, with 7:23
(male:female) in group A and 33:55 in group B. However, there was a
significant difference in age between group A (mean, 35.27±11.31;
range, 19–64 years) and B (mean, 47.61±12.65; range, 20–74 years)
(P<0.05). Immunohistochemistry revealed that all cases in group
A were prolactin-type (confirmed prolactinoma cases). In group B,
there were 4 cases of GH-type adenoma, 4 cases of ACTH-type
adenoma, 1 case of TSH-type adenoma, 29 cases of null cell adenoma,
33 cases of gonadotropic hormone (GnH)-type adenoma and 17 cases of
plurihormonal-type adenoma (including 4 cases with tumors positive
for ACTH + FSH + GH + PRL+ TSH, 1 case positive for ACTH + PRL, 3
cases positive for ACTH + GH + PRL, 1 case positive for ACTH + GH +
LH + PRL + TSH, 2 cases positive for ACTH + FSH + GH + LH + PRL +
TSH, 2 cases positive for FSH + PRL, 1 case positive for PRL + TSH,
1 case positive for GH + TSH, 1 case positive for ACTH + GH + LH +
PRL and 1 case positive for ACTH + FSH + GH + PRL).
There was a significant difference in the median PRL
level between group A (114.71 µg/l; range, 31.74–238.16 µg/l) and
group B (44.42 µg/l; range, 18.03–220.59 µg/l) (P<0.05; Table I). In group B, the median PRL level in
null cell-, GnH- and plurihormonal-type adenomas was 45.6 (range,
18.03–131.12) µg/l, 35.3 (range, 19.49–126.9) µg/l and 51.17
(range, 21.97–220.59) µg/l, respectively. The PRL level in
plurihormonal-type adenoma was significantly higher than that in
GnH-type adenoma (P<0.05; data not shown). No significant
difference was observed between null cell and plurihormonal-type
adenomas or between null cell- and GnH-type adenomas (P>0.05;
data not shown). The maximum diameter was 15.81±4.93 mm in group A
and 29.00±10.97 mm in group B, and the mean volume was 1.58±2.20
cm3 in group A and 8.21±8.53 cm3 in group B,
with a significant difference (Table
I). The mean PRL/MD was 7.77 µg/(l × mm) [range, 1.73–17.01
µg/(l × mm)] in group A and 1.70 µg/(l × mm) [range, 0.45–11.59
µg/(l × mm)] in group B, and the mean PRL/V was 107.55 µg/(l ×
cm3) [range, 5.29–360.99 µg/(l × cm3)] in
group A and 9.15 µg/(l × cm3) [range, 0.68–117.50 µg/(l
× cm3)] in group B, with a significant difference
(P<0.001). These results indicated that there were significant
differences in the PRL level, PRL/MD and PRL/V between the two
groups, which may aid in achieving a differential diagnosis.
 | Table I.Clinical characteristics of all
patients in the study. |
Table I.
Clinical characteristics of all
patients in the study.
| Characteristic | Group A (n=30) | Group B (n=88) | P-value |
|---|
| Age,
yearsa | 35.27±11.31 | 47.61±12.65 | <0.001 |
| Gender (male:female),
n | 7:23 | 33:55 | 0.185 |
|
Hyperprolactinemia-related symptoms, n
(%) | 24 (80.00) | 22 (25.00) | <0.001 |
|
Amenorrhea | 17 (56.67) | 14 (15.91) |
|
|
Lactation | 20 (66.67) | 9 (10.23) |
|
| Decreased
sexual function | 0 (0.00) | 7 (7.95) |
|
|
Fatigue | 0 (0.00) | 4 (4.55) |
|
| Adenoma mass effects,
n (%) | 19 (63.33) | 81 (92.05) | 0.001 |
| Headache,
dizziness | 14 (46.67) | 51 (57.95) |
|
| Visual
impairment | 8 (26.67) | 57 (64.77) |
|
| PRL level,
µg/l |
|
|
|
| Median
(range)b | 114.71
(31.74–238.16) | 44.42
(18.03–220.59) | <0.001 |
|
18–50 | 4 (13.33) | 55 (62.50) |
|
|
50–100 | 10 (33.33) | 23 (26.14) |
|
|
100–150 | 4 (13.33) | 8 (9.09) |
|
|
150–250 | 12 (40.00) | 2 (2.27) |
|
| Adenoma
sizea |
|
|
|
| Maximum
diameter, mm | 15.81±4.93 | 29.00±10.97 | <0.001 |
| Volume,
cm3 | 1.58±2.20 | 8.21±8.53 | <0.001 |
| New
indicatorsb |
|
|
|
| PRL/MD,
µg/(l × mm) | 7.77
(1.73–17.01) | 1.70
(0.45–11.59) | <0.001 |
| PRL/V,
µg/(l × cm3) | 107.55
(5.29–360.99) | 9.15
(0.68–117.50) | <0.001 |
Differential diagnosis using
symptoms
To determine the differential diagnostic ability of
clinical symptoms, hyperprolactinemia symptoms and pituitary
adenoma mass effects, these factors were compared between the two
groups. There were 24 cases (80.00%) in group A and 22 cases
(25.00%) in group B with hyperprolactinemia symptoms, including
amenorrhea, lactation, decreased sexual function and fatigue, with
significant differences (P<0.001). There were 19 cases (63.33%)
in group A and 81 cases (92.05%) in group B with pituitary adenoma
mass effects, including headache, dizziness and visual impairment,
with significant differences (P=0.001) (Table I). The differential diagnostic ability
of hyperprolactinemia symptoms, including amenorrhea, lactation,
decreased sexual function and fatigue, was further analyzed by ROC.
The results revealed that the diagnostic SE was 0.800 and the SP
was 0.750 (data not shown). These results indicated that
hyperprolactinemia symptoms alone could not effectively
differentiate prolactinomas from other types of pituitary
adenomas.
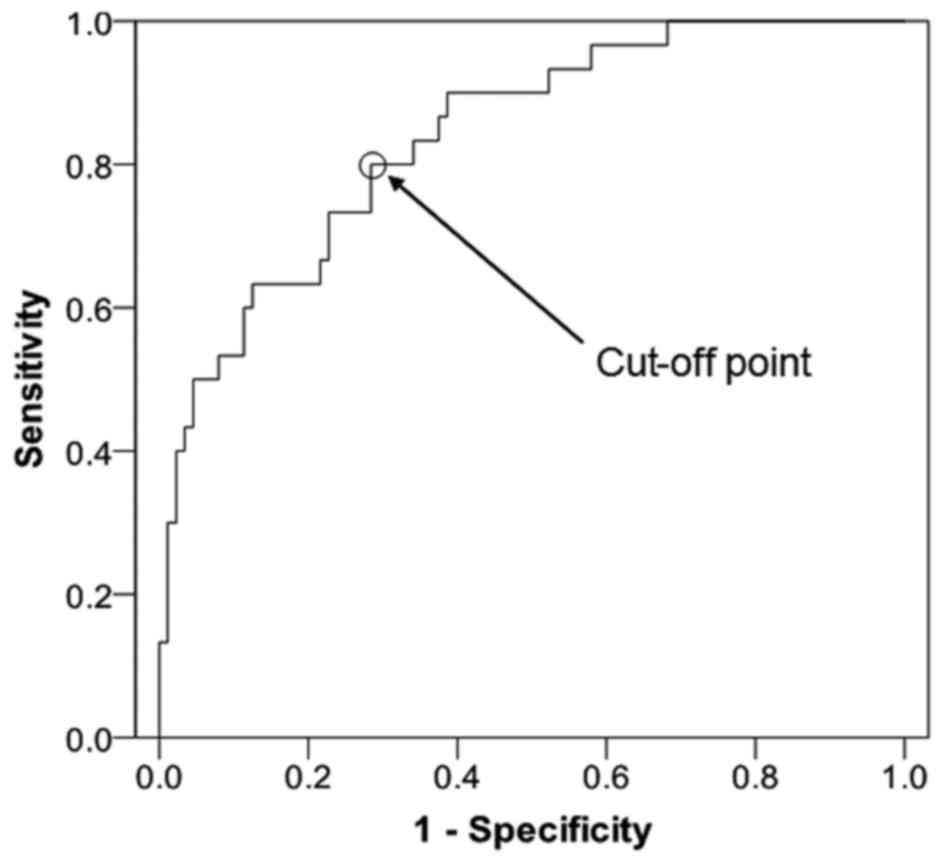
Differential diagnostic potential of
PRL
To determine the differential diagnostic potential
of PRL, the PRL level was compared between the two groups. The ROC
curve of PRL is presented in Fig. 1
[cut-off point, 55.65 µg/l; AUC, 0.840; AUC standard error, 0.040;
and 95% confidence interval (CI), 0.761–0.919]. The SE was 0.800,
the SP was 0.716, the PPV was 0.857, the NVP was 0.933 and the YI
was 0.516 (Table II). These results
indicate that PRL has a high differential diagnostic capacity,
however, a number of patients may have been misdiagnosed based upon
the low YI.
| Table II.PRL differentiation of prolactinoma
and other types of pituitary adenoma. |
Table II.
PRL differentiation of prolactinoma
and other types of pituitary adenoma.
| PLR, µg/l | Diagnosis | Group A, n | Group B, n | Total | SE | SP | PPV | NPV | YI |
|---|
| >55.65 | Prolactinoma | 24 | 4 | 28 |
|
|
|
|
|
| ≤55.65 | Other pituitary
adenomas | 6 | 84 | 90 |
|
|
|
|
|
| Total |
| 30 | 88 | 118 | 0.800 | 0.716 | 0.857 | 0.933 | 0.516 |
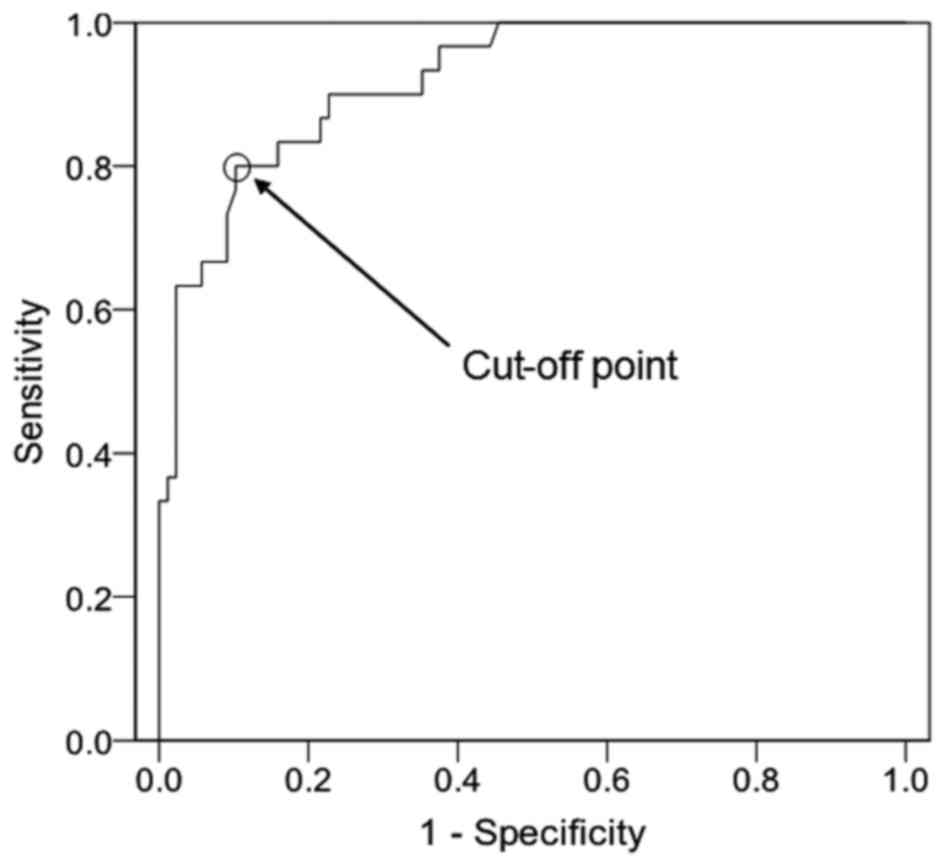
Differential diagnostic potential of
PRL/MD
To determine the differential diagnostic potential
of PRL/MD, PRL/MD was compared between the two groups. The ROC
curve of PRL/MD is presented in Fig.
2 [cut-off point, 4.03 µg/(l × mm); AUC, 0.920; AUC standard
error, 0.027; and 95% CI, 0.868–0.972]. The SE was 0.898, the SP
was 0.727, the PPV was 0.727, the NVP was 0.929 and the YI was
0.698 (Table III). These results
suggest that, due to its higher YI, PRL/MD may be more effective
than PRL in differentiating prolactinomas from other types of
pituitary adenomas.
| Table III.PRL/MD differentiation of
prolactinoma and other types of pituitary adenoma. |
Table III.
PRL/MD differentiation of
prolactinoma and other types of pituitary adenoma.
| PLR/MD, µg/(l ×
mm) | Diagnosis | Group A, n | Group B, n | Total | SE | SP | PPV | NPV | YI |
|---|
| >4.03 | Prolactinoma | 24 | 9 | 33 |
|
|
|
|
|
| ≤4.03 | Other pituitary
adenomas | 6 | 79 | 85 |
|
|
|
|
|
| Total |
| 30 | 88 | 118 | 0.800 | 0.898 | 0.727 | 0.929 | 0.698 |
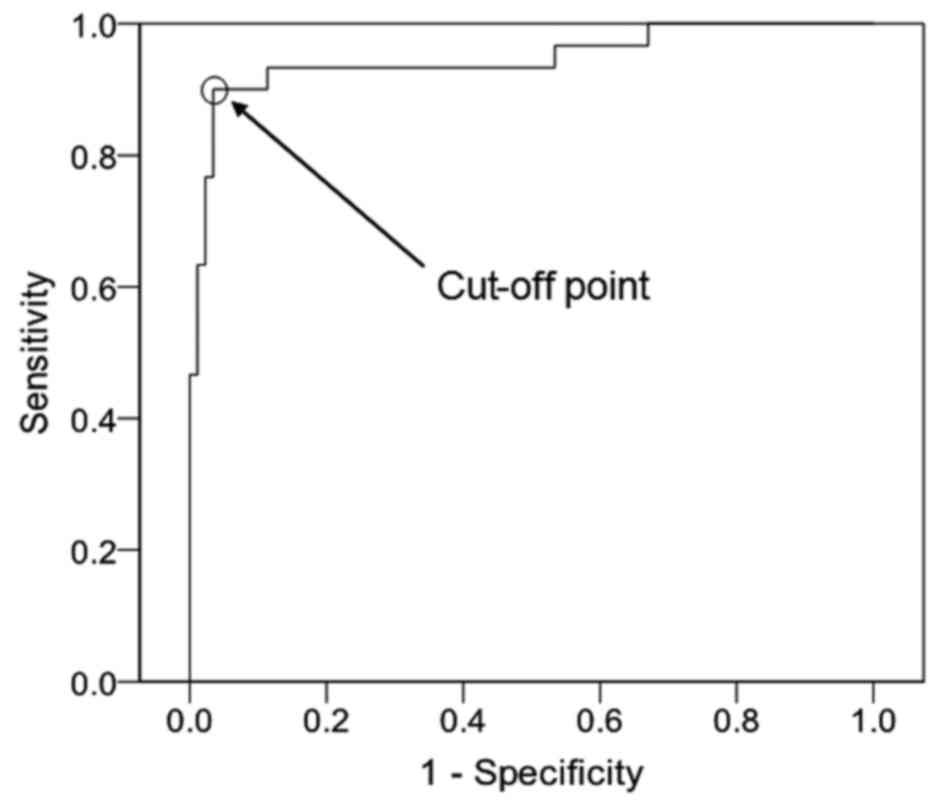
Differential diagnostic potential of
PRL/V
To determine the differential diagnostic potential
of PRL/V, PRL/V was compared between the two groups. Group A was
considered as a positive case group and group B was considered as a
negative case group. The ROC curve of PRL/V is presented in
Fig. 3 [cut-off point, 54.00 µg/(l ×
cm3); AUC, 0.947; AUC standard error, 0.028; and 95% CI,
0.891–1.000]. The SE was 0.900, the SP was 0.966, the PPV was
0.900, the NVP was 0.966 and the YI was 0.866 (Table IV). These findings indicate that
PRL/V may have the greatest differential diagnostic potential among
these three indicators, due to the fact that its YI is the
greatest.
| Table IV.PRL/V differentiation of prolactinoma
and other types of pituitary adenoma. |
Table IV.
PRL/V differentiation of prolactinoma
and other types of pituitary adenoma.
| PRL/V, µg/(l ×
cm3) | Diagnosis | Group A, n | GroDup B, n | Total | SE | SP | PPV | NPV | YI |
|---|
| >54 | Prolactinoma | 27 | 3 | 30 |
|
|
|
|
|
| ≤54 | Other pituitary
adenomas | 3 | 85 | 88 |
|
|
|
|
|
| Total |
| 30 | 88 | 118 | 0.900 | 0.966 | 0.900 | 0.966 | 0.866 |
Comparison of the differential
diagnostic potential of PRL, PRL/MD and PRL/V
To compare the differential diagnostic potential of
PRL, PRL/MD and PRL/V, an ROC curve and a Student's t-test were
performed. The ROC curves of PRL, PRL/MD and PRL/V are presented in
Figs. 1–3, and the AUC comparison is presented in
Table V. PRL/MD tended to be more
diagnostically accurate than PRL, but without a significant
difference (P=0.097). PRL/V was of higher diagnostic accuracy
compared with PRL, with significance (P=0.028). Therefore, PRL/V
had a greater potential to differentially diagnose when compared
with the PRL level. Furthermore, PRL/MD had a greater potential to
differentially diagnose when compared with the PRL level, but
without statistical significance.
| Table V.AUC comparison of receiver operating
characteristic curve of PRL, PRL/MD and PRL/V. |
Table V.
AUC comparison of receiver operating
characteristic curve of PRL, PRL/MD and PRL/V.
| Marker | AUC | Standard error | 95% CI | P-value |
|---|
| PRL | 0.840 | 0.040 | 0.761–0.919 | – |
| PRL/MD | 0.920 | 0.027 | 0.868–0.972 | 0.097a |
| PRL/V | 0.947 | 0.028 | 0.891–1.000 | 0.028a |
Discussion
The present study is the first to propose the use of
PRL/MD and PRL/V as diagnostic tools to distinguish prolactinoma
from other types of pituitary adenomas. The optimal PRL
differentiation level was 55.65 µg/l with a YI of 0.516, the
optimal PDL/MD differentiation ratio was 4.03 µg/(l × mm) with a YI
of 0.698, and the optimal PRL/V differentiation ratio was 54.00
µg/(l × cm3) with a YI of 0.866. PRL/MD appeared to have
a greater diagnostic accuracy than PRL, but with no statistical
significance (P=0.097), while the greater diagnostic accuracy of
the PRL/V compared with that of PRL was statistically significant
(P=0.028). Therefore, for pituitary adenoma patients with PRL
between the upper limit of the normal range and 250 µg/l, PRL/V may
be a more efficient tool for differential diagnosis than PRL.
Patients with hyperprolactinemia symptoms were often
believed to have prolactinoma with a high rate of misdiagnosis
(25). In the present study, there
were 24 cases (80.00%) in group A and 22 cases (25.00%) in group B
with hyperprolactinemia symptoms, and 19 patients (63.33%) in group
A and 81 cases (92.05%) in group B with pituitary adenoma mass
effects. Although there were significant differences in clinical
symptoms between groups A and B, the use of hyperprolactinemia
symptoms in diagnosis led to a high rate of misdiagnosis (SE,
0.800; SP, 0.750).
The PRL level is frequently used for differential
diagnosis. In cases where pituitary adenoma was present along with
hyperprolactinemia (15),
prolactinoma was clinically considered. PRL >500 µg/l was
considered to reflect the presence of large prolactinoma (26), and pituitary adenoma with PRL >250
µg/l was considered to indicate likely prolactinoma (27). However, in clinical practice, the
optimal PRL level for the differential diagnosis of prolactinoma
and other types of pituitary adenoma is far from 250 µg/l.
Kawaguchi et al (28) reported
that the optimal PRL level for the differential diagnosis of
prolactinoma and non-functioning adenomas was 38.6 µg/l, which is
substantially lower than 100–200 ng/ml. Karavitak et al
(6) demonstrated that the PRL level
of non-functional pituitary adenomas did not exceed 2,000 mIU/l (1
µg/l=21.2 mIU/l), and 2,000 mIU/l was considered as the upper PRL
limit of non-functional pituitary adenomas. However, Hong et
al (14) revealed that 5/35
patients with non-functional pituitary adenoma exhibited
hyperprolactinemia and a PRL level >100 µg/l. A total of
1.3–11.8% non-functional pituitary adenoma patients exhibited a PRL
level >100 µg/l (6,14,29). The
Europe Endocrine Society recommended that pituitary adenomas with a
PRL level >250 µg/l should be diagnosed as prolactinoma
(15). The PRL level of patients with
secondary hyperprolactinemia caused by pituitary stalk compression
was likely between 25–200 µg/l (11,30).
Therefore, the gray area (the upper limit of the normal range to
250 µg/l) may easily lead to a misdiagnosis. In the present study,
the optimal PRL level for differential diagnosis was 55.65 µg/l,
with an SE of 0.800 and an SP of 0.716. Therefore, a higher
diagnostic accuracy is required.
The differentiation between prolactinoma and other
types of pituitary adenomas is essential for making decisions
regarding treatment. Dopamine agonists, which lead to tumor cell
apoptosis and secondary necrosis, are the first line of treatment
for prolactinomas (15,31,32).
However, bromocriptine should be administered for ≥3 months for
other types of pituitary adenomas in order to rule out prolactinoma
(6). This is not only time-consuming,
but may also aggravate adenoma fibrosis (33) and increase surgical risks.
Additionally, unnecessary surgery for prolactinoma may increase the
financial burden on the patient. In addition to treating
prolactinoma, dopamine agonists may also reduce PRL levels in other
types of pituitary adenomas with hyperprolactinemia and may relieve
hyperprolactinemia symptoms. However, the effects of these drugs on
the volume of adenoma remain unclear (9,15).
Patients exhibiting GH, TSH or ACTH above the upper normal limits
were excluded from the present study.
There are some limitations to the present study.
Firstly, for a small portion of the patients, the PRL level, PRL/MD
and PRL/V were not able to accurately differentiate between disease
types. Secondly, the sample size was small and data was collected
from a single center. Therefore, multi-center and prospective
clinical studies are required to further elucidate the role of
PRL/MD and PRL/V in the differential diagnosis of adenoma.
In conclusion, serum PRL, PRL/MD and PRL/V were
useful in the differential diagnosis of pituitary adenomas. For
pituitary adenoma patients with a PRL level between the upper limit
of the normal range and 250 µg/l, imaging combined with plasma
hormone level detection may improve the accuracy of the
differential diagnosis. PRL/V may be more accurate for the
differential diagnosis than PRL, and the optimal PRL/V ratio in the
differentiation of prolactinomas from other types of
hyperprolactinemia-causing pituitary adenomas in this study was
54.00 µg/(l × cm3).
Acknowledgements
The authors would like to thank Dr Qun Zhong
(Department of Radiology, Fuzhou General Hospital, Fujian, China)
for aiding in the preparation of the original manuscript. The
present study was supported by Nanjing Military Region Fuzhou
General Hospital Innovation (grant no. 2014CXTD07) and Nanjing
Military Region Fuzhou General Hospital Young Talent (grant no.
2014Q32).
References
|
1
|
Wass JA and Karavitaki N: Nonfunctioning
pituitary adenomas: The oxford experience. Nat Rev Endocrinol.
5:519–522. 2009. View Article : Google Scholar : PubMed/NCBI
|
|
2
|
Capozzi A, Scambia G, Pontecorvi A and
Lello S: Hyperprolactinemia: Pathophysiology and therapeutic
approach. Gynecol Endocrinol. 31:506–510. 2015. View Article : Google Scholar : PubMed/NCBI
|
|
3
|
Sakurai T, Seo H, Yamamoto N, Nagaya T,
Nakane T, Kuwayama A, Kageyama N and Matsui N: Detection of mRNA of
prolactin and ACTH in clinically nonfunctioning pituitary adenomas.
J Neurosurg. 69:653–659. 1988. View Article : Google Scholar : PubMed/NCBI
|
|
4
|
Beentjes JA, Tjeerdsma G, Sluiter WJ and
Dullaart RP: Divergence between growth hormone responses to
insulin-induced hypoglycaemia and growth hormone-releasing hormone
in patients with non-functioning pituitary macroadenomas and
hyperprolactinaemia. Clin Endocrinol (Oxf). 45:391–398. 1996.
View Article : Google Scholar : PubMed/NCBI
|
|
5
|
Fonseca AL, Chimelli L, Santos MJ, Santos
AA and Violante AH: Influence of hyperprolactinemia and tumoral
size in the postoperative pituitary function in clinically
nonfunctioning pituitary macroadenomas. Arq Neuropsiquiatr.
60:590–602. 2002.(In Portuguese). View Article : Google Scholar : PubMed/NCBI
|
|
6
|
Karavitaki N, Thanabalasingham G, Shore
HC, Trifanescu R, Ansorge O, Meston N, Turner HE and Wass JA: Do
the limits of serum prolactin in disconnection hyperprolactinaemia
need re-definition? A study of 226 patients with histologically
verified non-functioning pituitary macroadenoma. Clin Endocrinol
(Oxf). 65:524–529. 2006. View Article : Google Scholar : PubMed/NCBI
|
|
7
|
Cury ML, Fernandes JC, Machado HR, Elias
LL, Moreira AC and Castro Md: Non-functioning pituitary adenomas:
Clinical feature, laboratorial and imaging assessment, therapeutic
management and outcome. Arq Bras Endocrinol Metabol. 53:31–39.
2009. View Article : Google Scholar : PubMed/NCBI
|
|
8
|
Berkmann S, Fandino J, Muller B, Remonda L
and Landolt H: Intraoperative MRI and endocrinological outcome of
transsphenoidal surgery for non-functioning pituitary adenoma. Acta
Neurochir (Wien). 154:639–647. 2012. View Article : Google Scholar : PubMed/NCBI
|
|
9
|
Colao A, Di Somma C, Pivonello R, Faggiano
A, Lombardi G and Savastano S: Medical therapy for clinically
non-functioning pituitary adenomas. Endocr Relat Cancer.
15:905–915. 2008. View Article : Google Scholar : PubMed/NCBI
|
|
10
|
Zhao W, Ye H, Li Y, Zhou L, Lu B, Zhang S,
Wen J, Li S, Yang Y and Hu R: Thyrotropin-secreting pituitary
adenomas: Diagnosis and management of patients from one Chinese
center. Wien Klin Wochenschr. 124:678–684. 2012. View Article : Google Scholar : PubMed/NCBI
|
|
11
|
Behan LA, O'sullivan EP, Glynn N, Woods C,
Crowley RK, Tun TK, Smith D, Thompson CJ and Agha A: Serum
prolactin concentration at presentation of non-functioning
pituitary macroadenomas. J Endocrinol Invest. 36:508–514.
2013.PubMed/NCBI
|
|
12
|
Shimon I, Jallad RS, Fleseriu M, Yedinak
CG, Greenman Y and Bronstein MD: Giant GH-secreting pituitary
adenomas: Management of rare and aggressive pituitary tumors. Eur J
Endocrinol. 172:707–713. 2015. View Article : Google Scholar : PubMed/NCBI
|
|
13
|
Ferrante E, Ferraroni M, Castrignanò T,
Menicatti L, Anagni M, Reimondo G, Del Monte P, Bernasconi D, Loli
P, Faustini-Fustini M, et al: Non-functioning pituitary adenoma
database: A useful resource to improve the clinical management of
pituitary tumors. Eur J Endocrinol. 155:823–829. 2006. View Article : Google Scholar : PubMed/NCBI
|
|
14
|
Hong JW, Lee MK, Kim SH and Lee EJ:
Discrimination of prolactinoma from hyperprolactinemic
non-functioning adenoma. Endocrine. 37:140–147. 2010. View Article : Google Scholar : PubMed/NCBI
|
|
15
|
Melmed S, Casanueva FF, Hoffman AR,
Kleinberg DL, Montori VM, Schlechte JA and Wass JA; Endocrine
Society, : Diagnosis and treatment of hyperprolactinemia: An
Endocrine Society clinical practice guideline. J Clin Endocrinol
Metab. 96:273–288. 2011. View Article : Google Scholar : PubMed/NCBI
|
|
16
|
Zhu M, Zhang Y and Peng H: Comparative
Analysis and Clinical Application of Serum PRL and MRI Scan on
Pituitary Prolactinoma. J Radioimmunol. 2013.
|
|
17
|
Smith MV and Laws ER Jr: Magnetic
resonance imaging measurements of pituitary stalk compression and
deviation in patients with nonprolactin-secreting intrasellar and
parasellar tumors: Lack of correlation with serum prolactin levels.
Neurosurgery. 34:834–839. 1994. View Article : Google Scholar : PubMed/NCBI
|
|
18
|
Delellis RA: Pathology and genetics of
tumours of endocrine organs. IARC Press; 2004
|
|
19
|
Trouillas J, Roy P, Sturm N, Dantony E,
Cortet-Rudelli C, Viennet G, Bonneville JF, Assaker R, Auger C,
Brue T, et al: A new prognostic clinicopathological classification
of pituitary adenomas: A multicentric case-control study of 410
patients with 8 years post-operative follow-up. Acta Neuropathol.
126:123–135. 2013. View Article : Google Scholar : PubMed/NCBI
|
|
20
|
Jan M, Dufour H, Brue T and Jaquet P:
Prolactinoma surgery. Ann Endocrinol (Paris). 68:118–119. 2007.
View Article : Google Scholar : PubMed/NCBI
|
|
21
|
Gruppetta M and Vassallo J: Epidemiology
and radiological geometric assessment of pituitary macroadenomas:
Population-based study. Clin Endocrinol (Oxf). 85:223–231. 2016.
View Article : Google Scholar : PubMed/NCBI
|
|
22
|
Osamura RY, Kajiya H, Takei M, Egashira N,
Tobita M, Takekoshi S and Teramoto A: Pathology of the human
pituitary adenomas. Histochem Cell Biol. 130:495–507. 2008.
View Article : Google Scholar : PubMed/NCBI
|
|
23
|
Barkan AL and Chandler WF: Giant pituitary
prolactinoma with falsely low serum prolactin: The pitfall of the
‘high-dose hook effect’: Case report. Neurosurgery. 42:913–916.
1998. View Article : Google Scholar : PubMed/NCBI
|
|
24
|
Petakov MS, Damjanović SS, Nikolić-Durović
MM, Dragojlović ZL, Obradović S, Gligorović MS, Simić MZ and
Popović VP: Pituitary adenomas secreting large amounts of prolactin
may give false low values in immunoradiometric assays. The hook
effect. J Endocrinol Invest. 21:184–188. 1998. View Article : Google Scholar : PubMed/NCBI
|
|
25
|
Romijn JA: Hyperprolactinemia and
prolactinoma. Handb Clin Neurol. 124:185–195. 2014. View Article : Google Scholar : PubMed/NCBI
|
|
26
|
Vilar L, Freitas MC, Naves LA, Casulari
LA, Azevedo M, Montenegro R Jr, Barros AI, Faria M, Nascimento GC,
Lima JG, et al: Diagnosis and management of hyperprolactinemia:
Results of a Brazilian multicenter study with 1234 patients. J
Endocrinol Invest. 31:436–444. 2008. View Article : Google Scholar : PubMed/NCBI
|
|
27
|
Paepegaey AC, Veron L, Wimmer MC and
Christin-Maitre S: Misleading diagnosis of hyperprolactinemia in
women. Gynecol Obstet Fertil. 44:181–186. 2016.(In French).
View Article : Google Scholar : PubMed/NCBI
|
|
28
|
Kawaguchi T, Ogawa Y and Tominaga T:
Diagnostic pitfalls of hyperprolactinemia: The importance of
sequential pituitary imaging. BMC Res Notes. 7:5552014. View Article : Google Scholar : PubMed/NCBI
|
|
29
|
Ross RJ, Grossman A, Bouloux P, Rees LH,
Doniach I and Besser GM: The relationship between serum prolactin
and immunocytochemical staining for prolactin in patients with
pituitary macroadenomas. Clin Endocrinol (Oxf). 23:227–235. 1985.
View Article : Google Scholar : PubMed/NCBI
|
|
30
|
Arafah BM, Nekl KE, Gold RS and Selman WR:
Dynamics of prolactin secretion in patients with hypopituitarism
and pituitary macroadenomas. J Clin Endocrinol Metab. 80:3507–3512.
1995. View Article : Google Scholar : PubMed/NCBI
|
|
31
|
Pala NA, Laway BA, Misgar RA and Dar RA:
Metabolic abnormalities in patients with prolactinoma: Response to
treatment with cabergoline. Diabetol Metab Syndr. 7:992015.
View Article : Google Scholar : PubMed/NCBI
|
|
32
|
Wong A, Eloy JA, Couldwell WT and Liu JK:
Update on prolactinomas. Part. 2:Treatment and management
strategies. J Clin Neurosci 22: 1568–1574. 2015.
|
|
33
|
Menucci M, Quinones-Hinojosa A, Burger P
and Salvatori R: Effect of dopaminergic drug treatment on surgical
findings in prolactinomas. Pituitary. 14:68–74. 2011. View Article : Google Scholar : PubMed/NCBI
|