Introduction
Esophageal squamous cell carcinoma (ESCC) is the 4th
most common cause of cancer-associated mortality and the fifth most
frequently diagnosed cancer type in China (1). ESCC is a highly aggressive malignancy
with a poor prognosis due to the fact that the majority of tumors
are asymptomatic until they have reached advanced stages (1). At present, concurrent chemoradiotherapy
(CRT) has been established as an important approach for patients
with locally advanced carcinoma of the esophagus (2). This treatment schedule is also
appropriate for patients who are either medically unfit for surgery
or unwilling to undergo surgery (3).
The ability to predict which patients respond to CRT or develop
resistance would be invaluable for individualizing therapeutic
approaches, as early modifications in therapy regimens for
non-responders may improve treatment outcomes.
Conventional anatomic imaging modalities, such as
computed tomography, evaluate tumor response as changes in tumor
size only after weeks or months following therapy, and are not
ideally suitable for early prediction for treatment response.
18F-fluorodeoxyglucose positron emission computed
tomography (18F-FDG PET) as a functional imaging
technique has demonstrated potential value for monitoring early
response to neoadjuvant CRT in esophageal cancer (4–8), as
metabolic variation of the tumor occurs prior to any anatomical
structure changes. However, there is no study to date has examined
interim treatment 18F-FDG PET for monitoring response to
definitive CRT.
The present study aimed to investigate the
prognostic value of interim 18F-FDG PET in order to
determine the objective tumor response (oTR) in patients with ESCC
who received only definitive CRT.
Patients and methods
Patients
Between August 2011 and January 2015, 48 consecutive
patients with biopsy-proven locally advanced ESCC were enrolled in
the present study. The study protocol was approved by the Shandong
Tumor Hospital Ethics Committee (Shandong, China) and written
informed consent was obtained from all patients. Among the 48
patients, there were 40 (83.3%) male and 8 (16.7%) female, with a
median age of 61 years (range, 40–75 years). Pretreatment
investigations included a complete blood count, measurement of
serum electrolytes, a chest radiograph, a computed tomography (CT)
scan of the chest and abdomen, barium swallow radiography and an
upper gastroesophageal endoscopy.
Patients who had undergone 18F-FDG PET
scans prior to CRT (pre-CRT) and 40 Gy/4 weeks of starting
radiation therapy (inter-CRT) were included in the present study.
Other inclusion criteria were as follows: i) Patient age was <76
years and the Karnofsky score was >70 without any previous
treatment; ii) the absence of distant metastasis; iii) no
contraindications to radiotherapy or chemotherapy; and iv) no signs
of infection or diagnosis of diabetes at the time of the PET scan.
The characteristics of the enrolled patients are listed in Table I. Of the 48 patients treated with
definitive CRT, 10 were diagnosed with clinical stage II cancer and
did not undergo surgery due to patient refusal, poor
cardiopulmonary function or advanced age.
 | Table I.Patient characteristics. |
Table I.
Patient characteristics.
|
Characteristics | Responder | Non-responder | Total no. (%) | P-value |
|---|
| Sex |
|
|
| 0.833 |
|
Male | 36 | 4 | 40 (83.3) |
|
|
Female | 7 | 1 | 8 (16.7) |
|
| Age, years |
|
|
| 0.645 |
|
Range | 40–75 | 61–75 | 40–75 |
|
|
Median | 60 | 64 | 61 |
|
| Tumor length,
cm |
|
|
| 0.361 |
|
Range | 2–15 | 6.4–11 | 2–15 |
|
|
Median | 5.6 | 7.8 | 6 |
|
| Tumor location |
|
|
| 0.626 |
|
Cervical | 4 | 0 | 4 (8.3) |
|
| Upper
thoracic | 17 | 1 | 18 (37.5) |
|
| Middle
thoracic | 18 | 3 | 21 (43.8) |
|
| Lower
thoracic | 4 | 1 | 5 (10.4) |
|
| TNM stage |
|
|
| 0.689 |
|
IIa | 7 | 0 | 7 (14.6) |
|
|
IIb | 3 | 0 | 3 (6.3) |
|
|
III | 20 | 3 | 23 (47.9) |
|
|
IVa | 13 | 2 | 15 (31.2) |
|
| Chemotherapy |
|
|
| 0.943 |
|
Cisplatin + 5-FU | 20 | 2 | 22 (45.8) |
|
|
Cisplatin + pemetrexed | 14 | 2 | 16 (33.4) |
|
|
Cisplatin + capecitabine | 9 | 1 | 10 (20.8) |
|
PET scanning
All patients fasted and rested for >6 h prior to
consuming 500 ml water and were then administered with 7–11 mCi
radioactive tracer. Patient serum glucose levels were confirmed to
be <6.6 mmol/l. All patients were examined on a dedicated PET/CT
scanner (GE Healthcare Life Sciences, Little Chalfont, UK).
Subsequently, the emission scans were acquired from the level of
the calvaria to the thigh for 4 min per position. Each patient
received a scan lasting 24–28 min in total covering 14.5 cm at an
axial sampling thickness of 4.25 mm per slice. The non-contrast
spiral CT component was performed with a slice thickness of 4.25 mm
and a rotation speed of 0.8 sec per rotation. PET images were
reconstructed with CT-derived attenuation correction using the
ordered-subset expectation maximization algorithm. The
attenuation-corrected PET images, CT images and fused PET/CT images
displayed as coronal, sagittal and transaxial slices were viewed on
a GE Xeleris 2 workstation (GE Healthcare Life Sciences, Little
Chalfont, UK). Pre-CRT scans were performed 1–5 days prior to
commencing CRT and inter-CRT scans were acquired following 40 Gy/4
weeks of starting radiation therapy.
Treatment
Radiotherapy
All patients were placed in a supine position with
thermoplastic immobilization prior to the CT simulation and each
daily radiotherapy (RT). All patients received intensity-modulated
radiotherapy (IMRT) with six MV X-rays and a two-phase irradiation
protocol. The first phase was administered as conventionally
fractionated RT with a total of 40 Gy in 20 fractions (fx) in 4
weeks, which irradiated the gross tumor volume (GTV), including
that of the primary tumor (GTVp) and that of the
metastatic lymph nodes (GTVn). The planning target
volume was defined as GTVp with the addition of 3–5 cm
margins superiorly and inferiorly, 1 cm margins laterally, and with
the addition of a 1 cm margin for GTVn. The second phase
was delivered to the boost volume as an additional dose of 19.6 Gy
twice a day in 14 fx over 7 days at 1.4 Gy/fx, with a 6 h minimal
interval between fractions. The total dose administered to the
clinical tumor was 59.6 Gy and 34 fx over 35 days.
Chemotherapy
All patients were scheduled to receive two cycles of
concurrent chemotherapy, which began on the first day of RT. The
chemotherapeutic regimens in the present study consisted of
intravenous cisplatin 25 mg/m2/day on days 1–3 plus
500–600 mg/m2 fluorouracil (5-FU) every 24 h by
continuous infusion for 120 h, plus 1,000 mg capecitabine twice
daily with a 12 h interval on days 1–14 or plus 400–500
mg/m2 pemetrexed on day 1 of a 21-day cycle.
Metabolic parameters
The pre- and inter-CRT PET images were analyzed by
two experienced and independent nuclear medicine physicians.
Semi-quantitative analysis of the SUV was corrected by the injected
dose and body weight (g) and was calculated as follows: Tissue
activity concentration (Bq/ml)/[administered activity (Bq)/weight
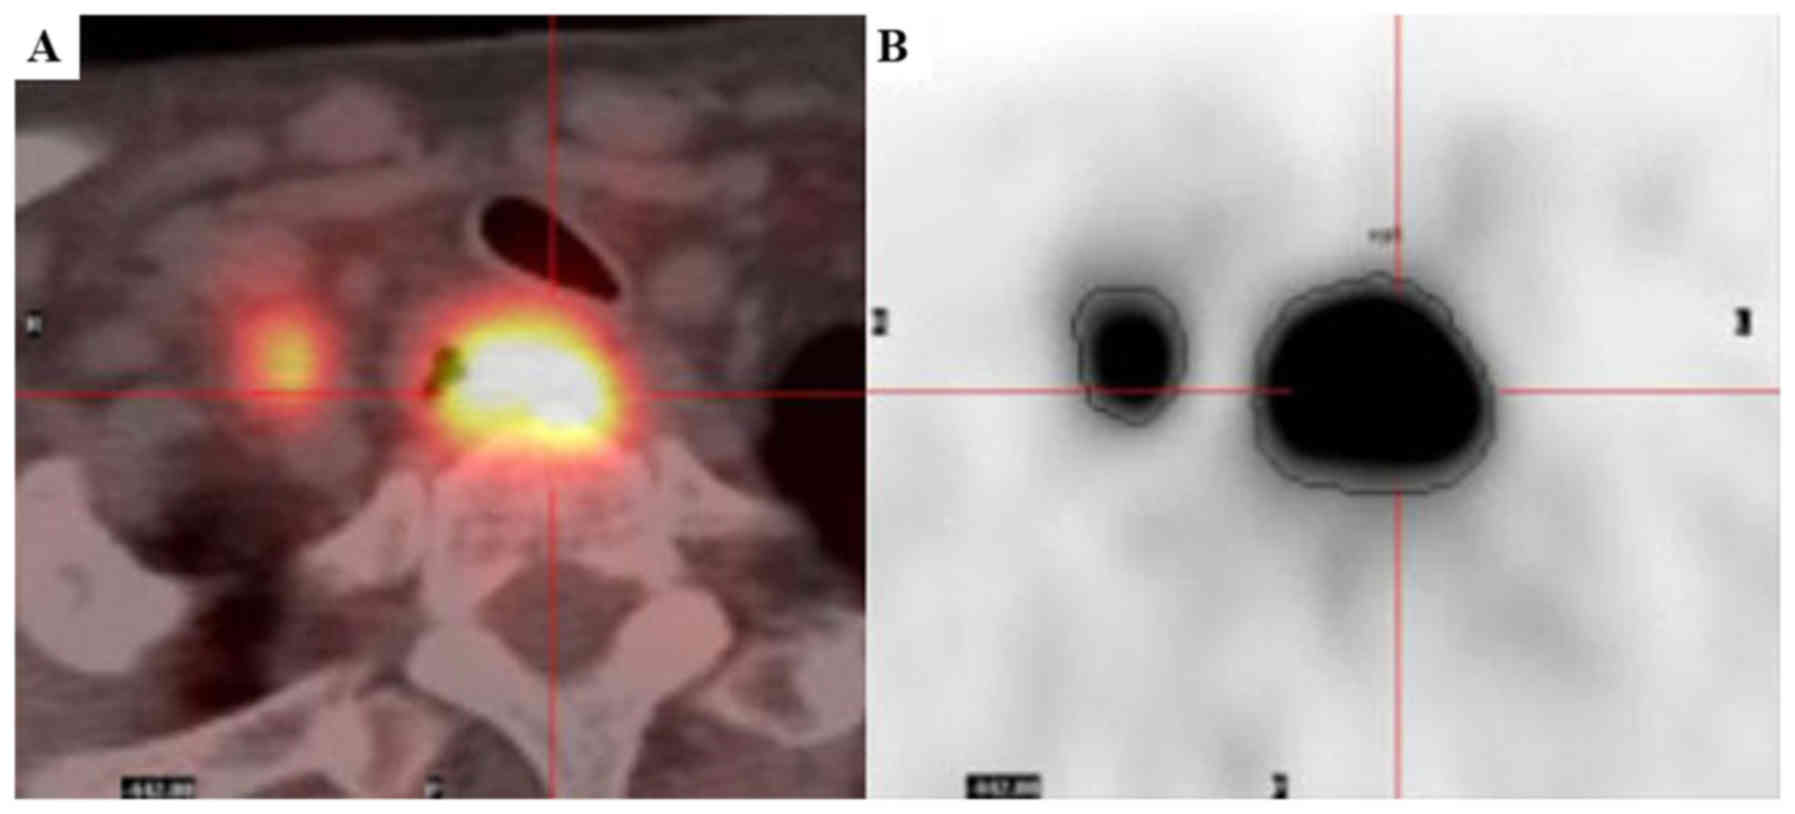
(g)]. Metabolic and volumetric parameters were measured using
PET-Volume Computer-Assisted Reading software (AW4.5 Platform; GE
Healthcare, Chicago, IL, USA), which provides an automatically
delineated volume of interest using an isocontour threshold method
based upon the SUV. SUVmax was defined as the SUV on the
highest pixel image in the tumor region. MTV was defined as the
volume of interest of tumor segmented by a threshold of 2.5
(Fig. 1) (9,10). The
percentage changes (Δ) of metabolic parameters (P) between pre- and
inter-CRT were calculated and expressed as a ratio, and were marked
for ΔP, which was calculated as follows: ΔP = [(Ppre-CRT
- Pinter-CRT)/Ppre-CRT] × 100%.
Response evaluation
The oTR evaluation was performed ≥4 weeks after the
end of therapy based upon the Response Evaluation Criteria in Solid
Tumors 1.1 (RECIST 1.1) (11),
outlined as follows: Complete response (CR), disappearance of all
target lesions; partial response (PR), ≥30% decrease from baseline;
progressive disease (PD), ≥20% increase over smallest sum observed
or appearance of new lesions; and stable disease (SD), neither PR
nor PD criteria met. The assessment of oTR included repeated
endoscopy, barium swallow and contrast-enhanced CT scan. Response
was assessed by two experienced radiologists who were blinded to
the outcomes of the PET scans. Patients with an outcome of CR or PR
were defined as responders and those with an outcome of SD, or PD
were classed as non-responders.
Statistical analysis
Descriptive analyses are expressed as the mean ±
standard deviation. Statistical comparisons between responders and
non-responders were performed using independent Student's t-tests.
Parameter comparisons between pre- and inter-CRT were calculated
using paired Student's t-tests. Associations between parameters and
the oTR were analyzed using univariate analysis. Receiver-operating
characteristic (ROC) curve analysis was used to evaluate the
predictive ability of parameters. All statistical analysis was
performed using SPSS version 20.0 (IBM Corp., Armonk, NY, USA) and
MedCalc version 15.2 (MedCalc Software bvba, Ostend, Belgium). All
tests were two-tailed and P<0.05 was considered to indicate a
statistically significant difference.
Results
Treatment response
There were 10 (20.9%) patients with stage II
disease, 23 (47.9%) with stage III disease and 15 (31.2%) with
stage IVa disease, according to the American Joint
Committee on Cancer 7th staging system (12). The median tumor length was 6.0 cm
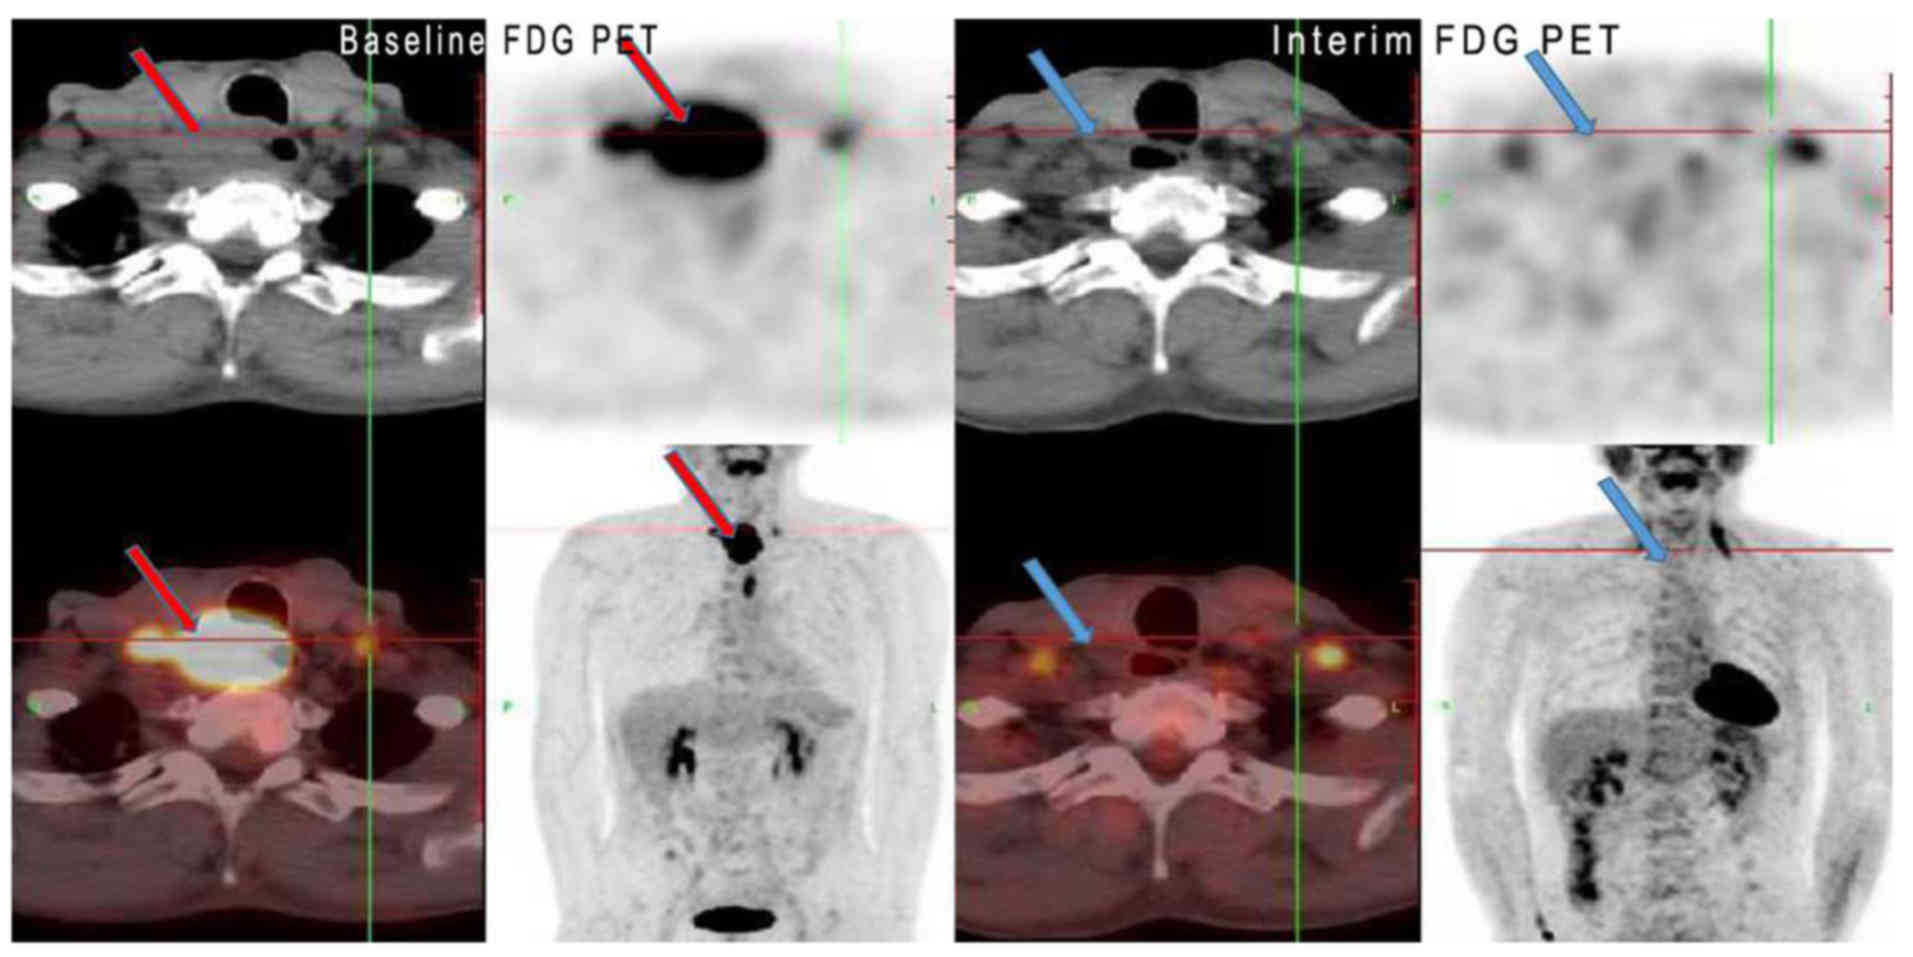
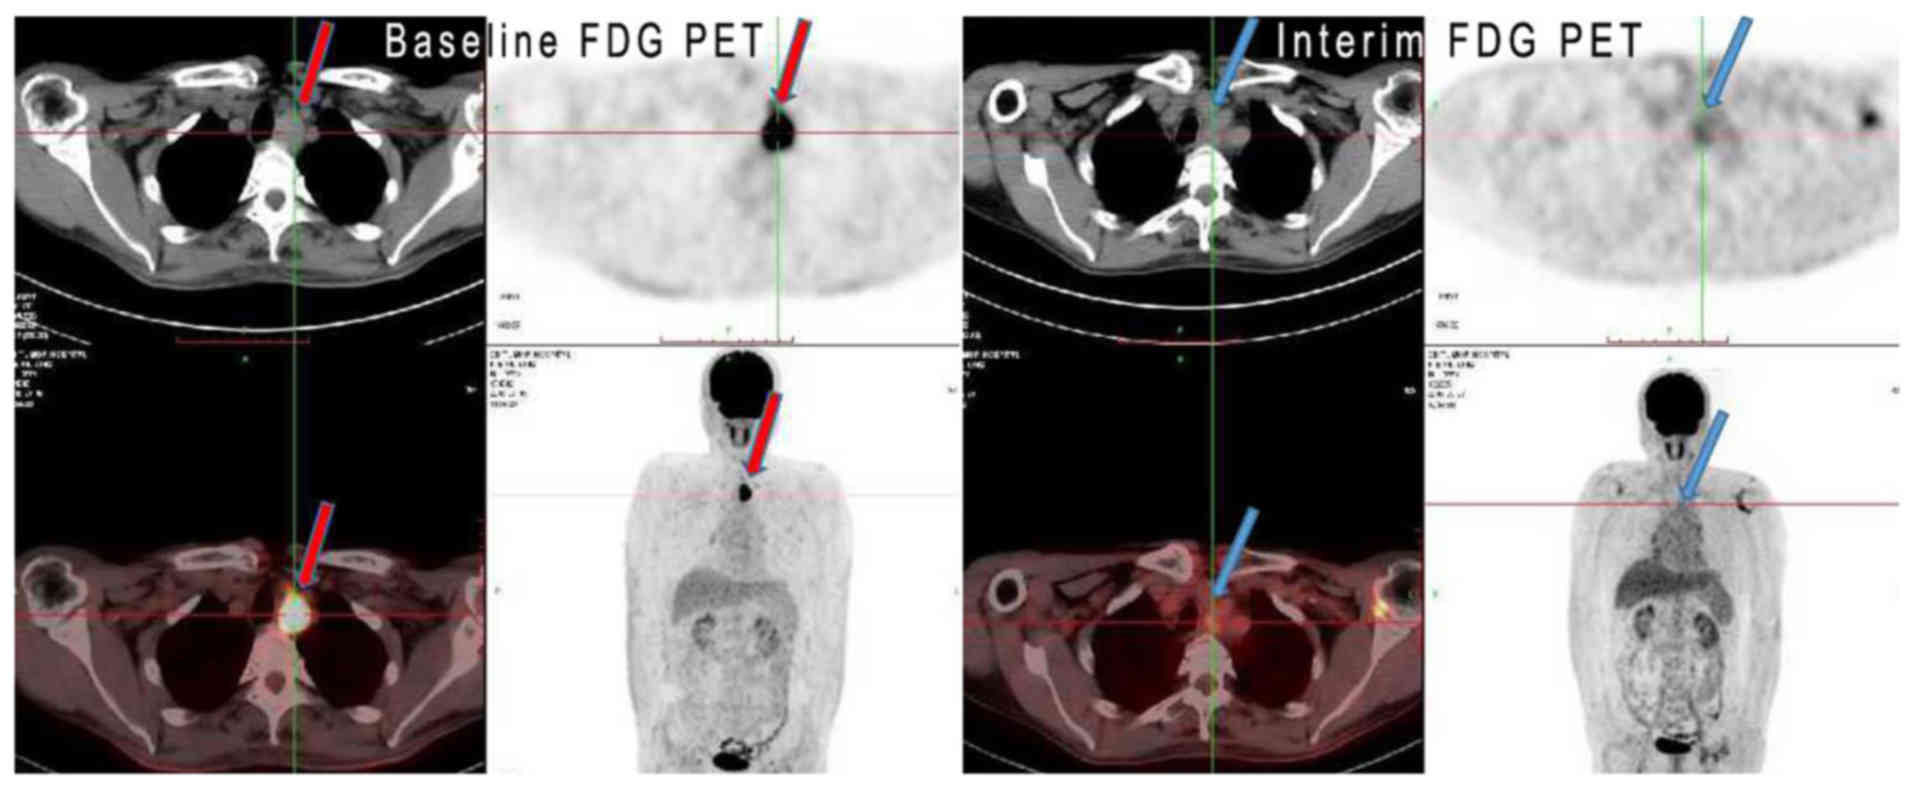
(range, 2.0–15.0 cm). Following the completion of treatment, 10
patients (20.8%) attained a CR, 33 (68.8%) exhibited a PR and 5
(10.4%) had SD, with no cases of PD. The overall oTR rate was 89.6%
(43/48). No significant differences in patient characteristics
between responders and non-responders were observed (Table I; all P>0.05). Figs. 2 and 3
show two representative cases of clinical CR and PR,
respectively.
FDG uptake by tumors
All 48 patients had abnormal FDG uptake in their
primary tumors or lymph nodes on pre-CRT PET scans, with a mean
SUVmax of 14.1±5.8 and a mean MTV of 58.2±25.4
cm3. However, following 40 Gy irradiation over 4 weeks
and 1–2 cycles of concurrent chemotherapy, FDG uptake by tumors in
the interim PET scans was significantly decreased, with a mean
SUVmax of 4.3±3.5 and a mean MTV of 19.0±12.1
cm3 (Table II;
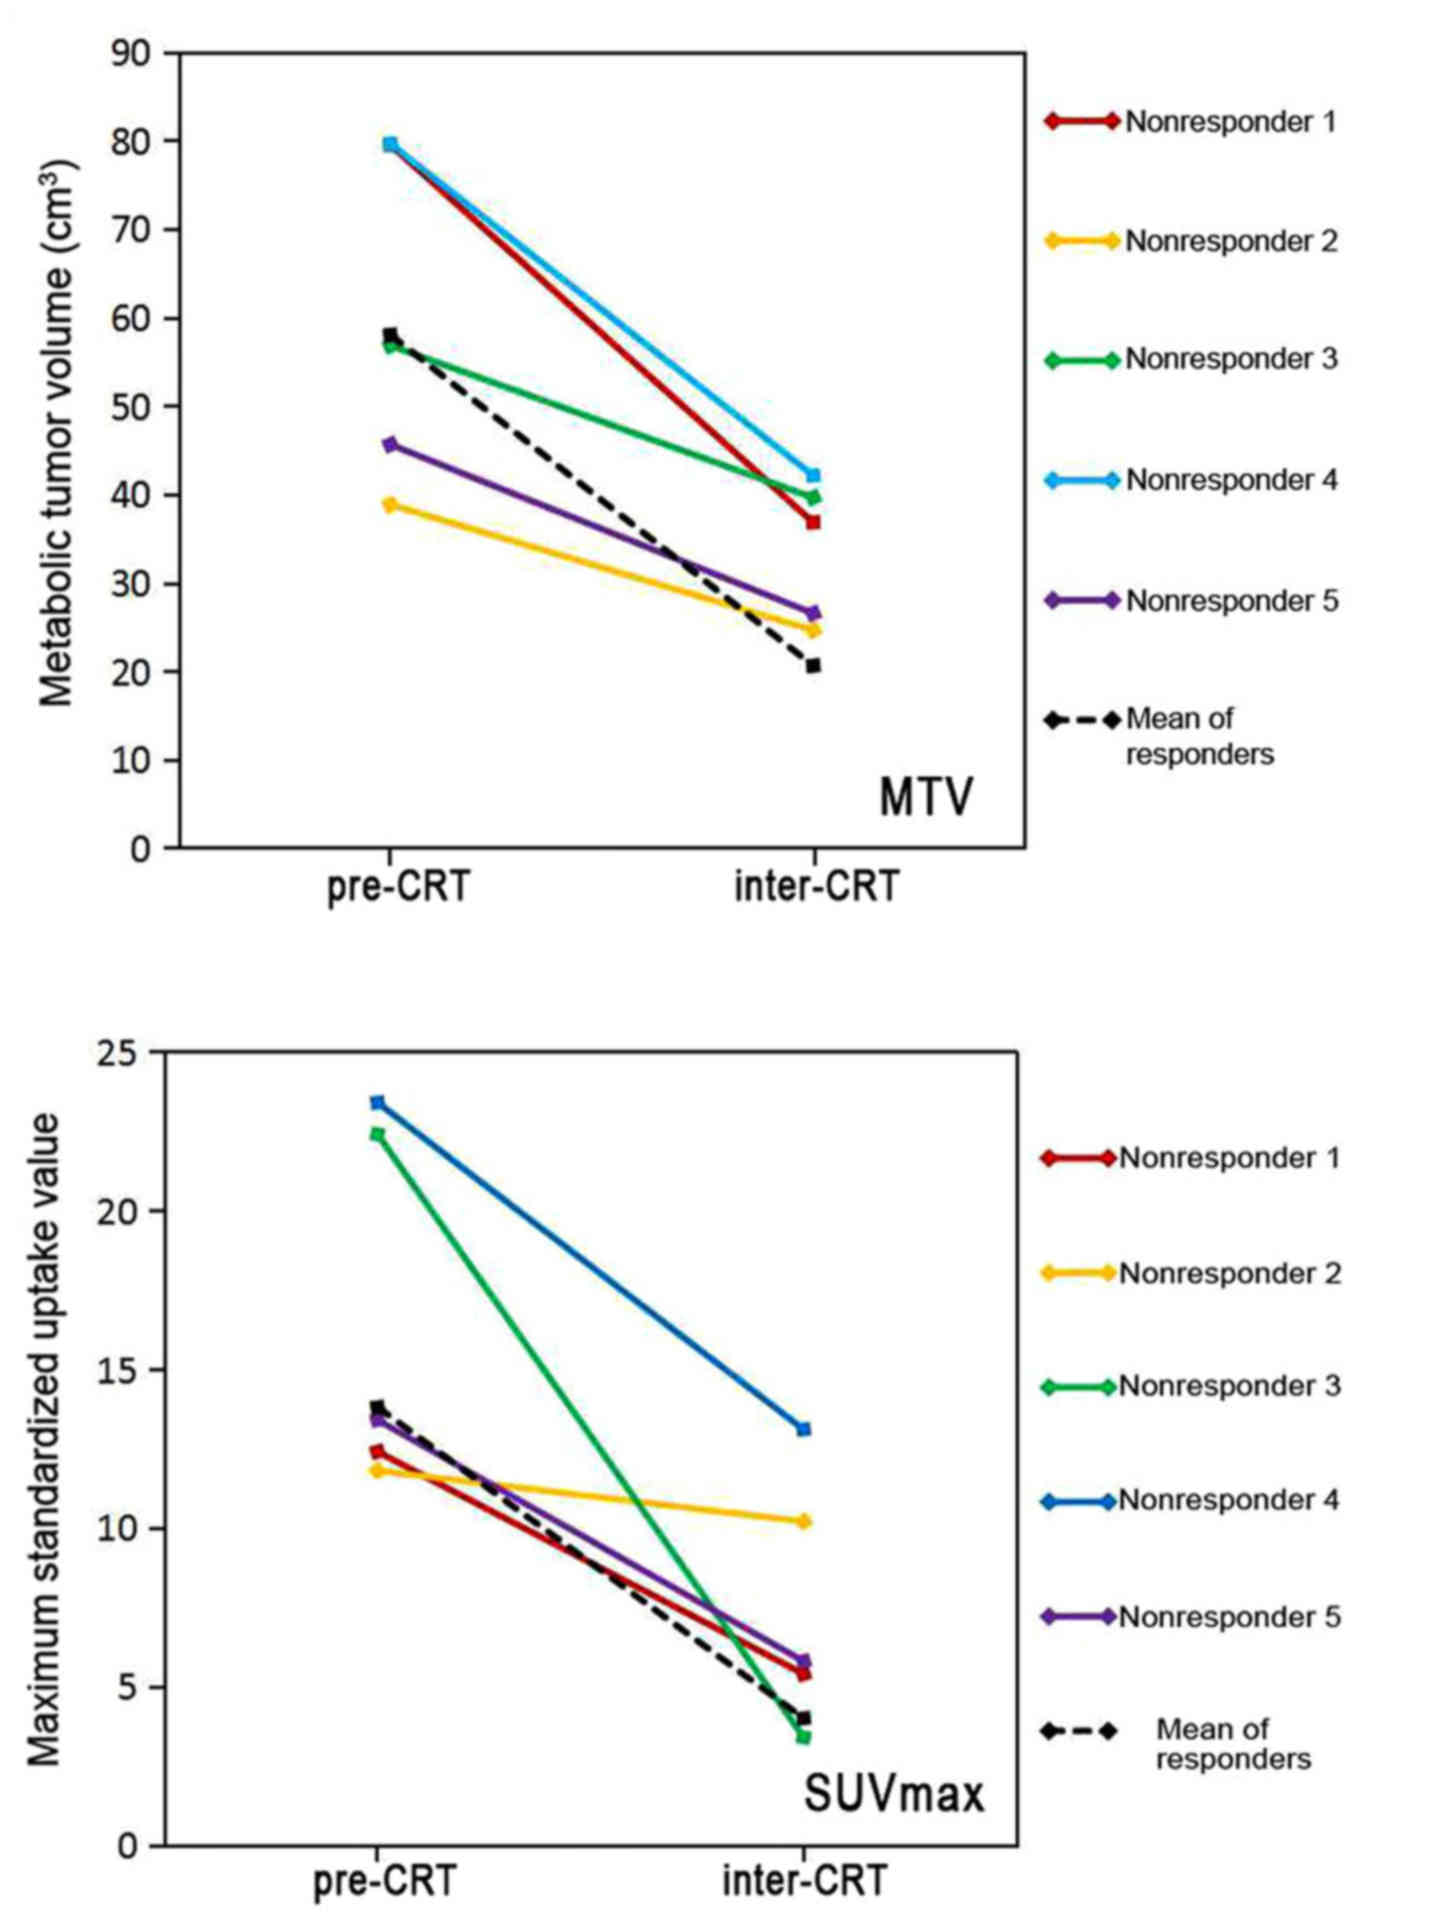
P<0.001). Fig. 4 demonstrates the
changes in MTV and SUVmax in 5 non-responders between
pre- and inter-CRT PET scans compared with the changes in
responders. The metabolic and volumetric parameters of FDG PET were
all decreased steadily from baseline to interim treatment in
responders, and non-responders. However, the reduction rate of MTV
between pre- and inter-CRT in responders was 0.64±0.13 vs.
0.42±0.09 in non-responders, a difference that was statistically
significant (P=0.001). A similar difference was observed for
ΔSUVmax, (0.71±0.16 in responders vs. 0.51±0.26 in
non-responders; P=0.015; Table
III).
| Table II.Comparisons of fluorodeoxyglucose
positron emission tomography parameters between the baseline
(pre-CRT) and 4 weeks after starting concurrent chemoradiotherapy
(inter-CRT). |
Table II.
Comparisons of fluorodeoxyglucose
positron emission tomography parameters between the baseline
(pre-CRT) and 4 weeks after starting concurrent chemoradiotherapy
(inter-CRT).
| Parameter | Pre-CRT | Inter-CRT | P-value |
|---|
| MTV,
cm3 | 58.2±25.4 | 19.0±12.1 | <0.001 |
|
SUVmax | 14.1±5.8 | 4.3±3.5 | <0.001 |
| Table III.Differences in fluorodeoxyglucose
positron emission tomography parameters between responders and
non-responders. |
Table III.
Differences in fluorodeoxyglucose
positron emission tomography parameters between responders and
non-responders.
| Parameter | Responder | Non-responder | P-value |
|---|
| ΔMTV | 0.64±0.13 | 0.42±0.09 | 0.001 |
|
ΔSUVmax | 0.71±0.16 | 0.51±0.26 | 0.015 |
Associations between clinical
characteristics and tumor response
Univariate analysis revealed that ΔSUVmax
and ΔMTV were significantly associated with oTR (P=0.010 and
P=0.001, respectively). An association between interim MTV
(MTVinter) and oTR was also observed (P=0.041), while no
significant association was observed between interim
SUVmax and oTR (P=0.056). Age, sex, tumor location,
tumor diameter, chemotherapy and clinical tumor-node-metastasis
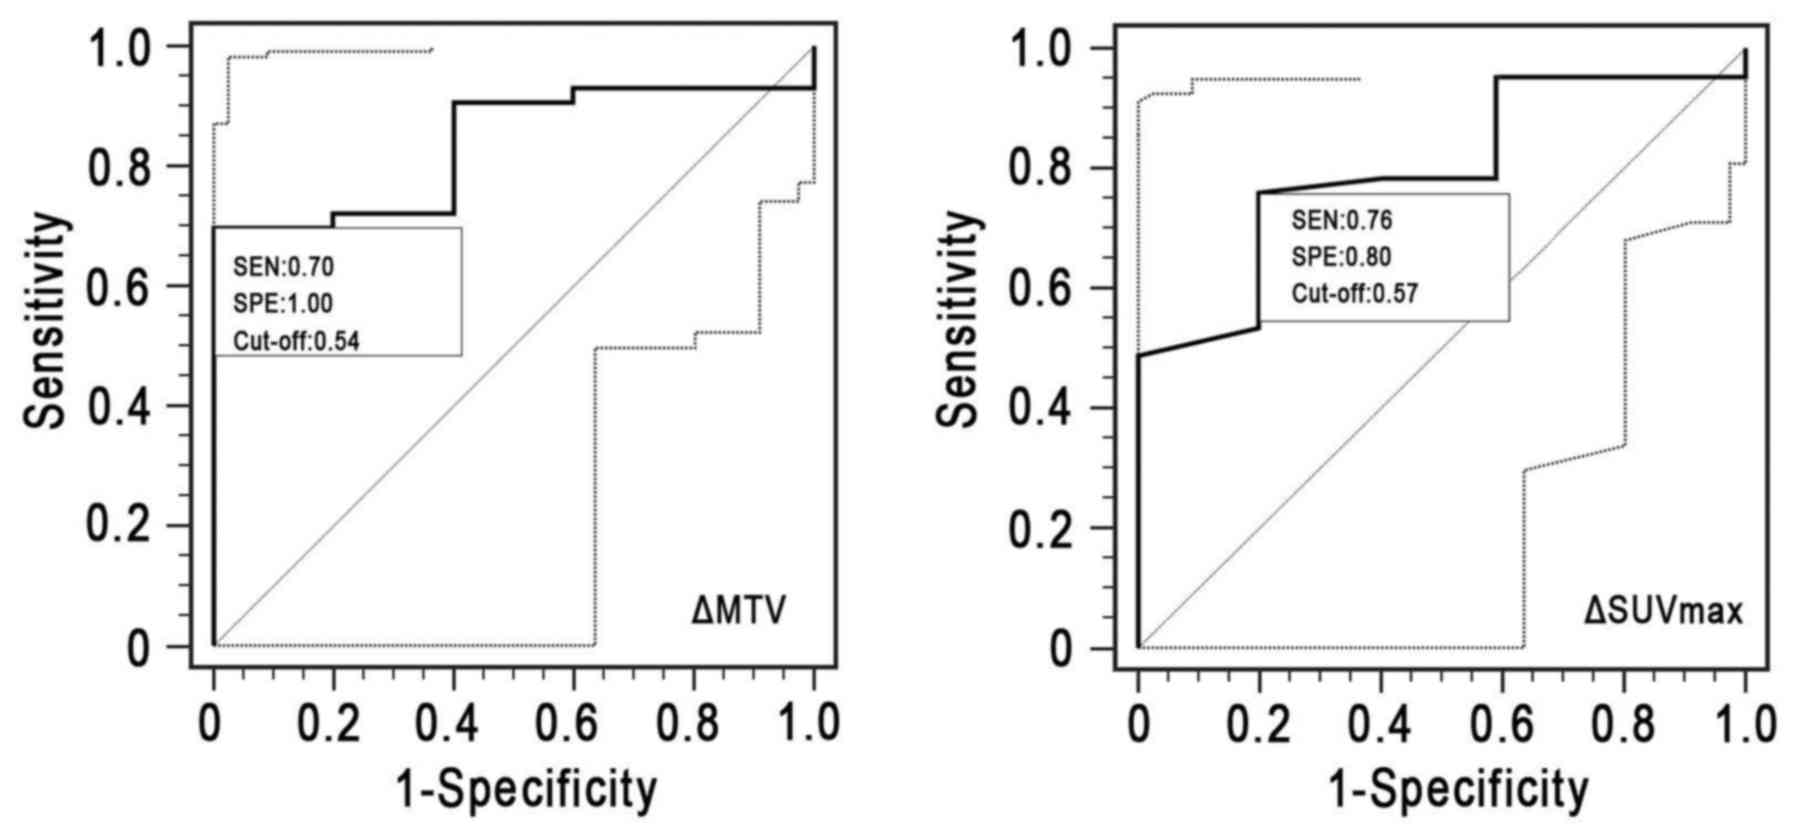
(TNM) stage were not significantly associated with oTR (Table IV; all P>0.05). ROC curve analysis
(Table V and Fig. 5) revealed that ΔSUVmax
(cut-off, 57%) displayed an area under the ROC curve (AUC) of 0.744
[95% confidence interval (CI), 0.544–0.890], with a sensitivity of
0.761 and a specificity of 0.800 (P=0.057). However, a threshold of
54% ΔMTV divided the responders from the non-responders with a
sensitivity of 0.698, a specificity of 1.000 and an AUC of 0.837
(95% CI, 0.702–0.928; P=0.001).
| Table IV.Associations between parameters and
objective tumor response. |
Table IV.
Associations between parameters and
objective tumor response.
| Parameter | Threshold
valuea | χ2 | P-value |
|---|
| MTVpre,
cm3 | 50.6 | 0.81 | 0.367 |
|
MTVinter, cm3 | 20.4 | 4.16 | 0.041 |
| ΔMTV | 0.54 | 11.0 | 0.001 |
|
SUVpre | 12.5 | 0.59 | 0.442 |
|
SUVinter | 3.4 | 3.65 | 0.056 |
|
ΔSUVmax | 0.57 | 9.32 | 0.010 |
| Age (years) | – | 1.26 | 0.461 |
| Sex | – | 0.08 | 0.778 |
| Tumor location | – | 3.20 | 0.361 |
| Tumor diameter | – | 2.25 | 0.086 |
| TNM stage | – | 2.87 | 0.412 |
| Chemotherapy | – | 0.21 | 0.712 |
| Table V.ROC curve analysis of metabolic
parameters for treatment response prediction. |
Table V.
ROC curve analysis of metabolic
parameters for treatment response prediction.
| Parameter | AUC | 95% CI of AUC | Sensitivity | Specificity | P-value |
|---|
| ΔMTV | 0.837 | 0.702–0.928 | 0.698 | 1.000 | 0.001 |
|
ΔSUVmax | 0.744 | 0.544–0.890 | 0.761 | 0.800 | 0.057 |
Discussion
ESCC is a highly heterogeneous type of cancer where
patients at the same TNM stage and undergoing the same treatment
regimens, exhibit different treatment responses and survival rates.
Therefore, it is necessary to obtain a reliable tool to identify
the treatment-resistant patients and to develop individualized
treatment strategies, which may be an effective way to improve the
survival of patients.
A previous study reported that clinical parameters
(age, sex, TNM stage, tumor location and pathology) were unable to
predict response to CRT (13).
Certain studies have focused on biological markers to estimate
possible treatment responses to CRT; however, these promising
biomarkers require further validation with larger high-quality
clinical trials (14,15). Previous studies have suggested that
18F-FDG PET is a non-invasive method for monitoring
pathological response and prognosis for carcinomas of the esophagus
during or following neoadjuvant CRT (4–8). Monjazeb
et al (16) reviewed 163
patients with esophageal cancer receiving neoadjuvant CRT with or
without resection. 18F-FDG PET scans were performed and
analyzed pre- and post-CRT. In a study undertaken by Monjazeb et
al (16), for patients treated
with definitive CRT, the median survival time and the 2-year
overall survival (OS) rate for the patients achieving complete
response was 38 months, and 71% vs. 11 months and 11% for those
patients who had not achieved a complete response. Multivariate
analysis indicated that PET complete response is the strongest
independent prognostic factor for esophageal cancer [survival
hazard ratio (HR), 9.82; P<0.01; local failure HR, 14.13;
P<0.01].
As a semi-quantitative parameter of
18F-FDG PET, SUV, which may reflect the intensity of
metabolic activity of the tumor, has been suggested as a prognostic
marker for the histopathological response of esophageal carcinoma
(4–8,17–20). For example, Wieder et al
(7) reported that, for
histopathological responders, the decrease in SUV between baseline
and 2 weeks after initiation of therapy was 44%, but was only 21%
in the non-responders (P=0.0055). At the preoperative scan (3–4
weeks after CRT), tumor metabolic activity had decreased by 70% in
histopathological responders and by 51% in histopathological
non-responders. Lordick et al (5) reported that the median event-free
survival time was 29.7 months (95% CI, 23.6–35.7 months) in
metabolic responders vs. 14.1 months (95% CI, 7.5–20.6 months) in
non-responders (HR, 2.18; P=0.002). Chhabra et al (18) observed that with a cut-off value of a
35% decrease in SUVmax between baseline and post-CRT,
the 3-year OS rate for responders (ΔSUV ≥35%) was 64%, while that
for non-responders (ΔSUV <35%) was only 15% (P=0.004). Another
study undertaken by Huang et al (19) revealed that ΔSUV was significantly
associated with OS and disease-free survival rates. The 3-year OS
rate of the ΔSUV >60% group was 71% and that of the ΔSUV ≤60%
group was 40.7% (P=0.045). In the present study, the
SUVmax of tumor(s) decreased steadily from baseline to
interim treatment in responders and non-responders, and the
reduction rates of SUVmax (ΔSUVmax) were
significantly different between the responders and the
non-responders. However, a threshold of 57% ΔSUVmax was
unable to divide the responders from the non-responders
successfully, with an AUC of 0.744 (95% CI, 0.544–0.934;
P=0.057).
The ability of SUVmax to predict oTR
remains controversial and is influenced by a variety of factors,
including the total dose of FDG injected, the time between the
injection and scanning, noise and image reconstruction.
Furthermore, a number of biological and technological factors
influence the measurement of SUVmax (21). Therefore, the exploration of other
metabolic parameters is required. MTV and total lesion glycolysis
(TLG) are volume-based parameters that represent metabolic tumor
burden. A number of previous studies have reported the
effectiveness of MTV and/or TLG as prognostic factors in esophageal
carcinoma (6,22–24). Roedl
et al (24) reported that a
decrease in MTV between pre- and post-treatment PET scans was a
better predictor of histopathological response, and survival in
comparison with a decrease in the SUV or the clinical response
evaluation based on the RECIST 1.1 in adenocarcinomas of the
esophagus. Kim et al (6)
revealed that a threshold of 25.5% ΔMTV divided the responders from
the non-responders with a sensitivity of 80%, a specificity of
76.3% and an AUC of 0.731 (95% CI, 0.591–0.843; P=0.0027). The
present study observed that MTV decreased steadily from baseline to
interim treatment in responders and non-responders. Furthermore,
the reduction rate of MTV was significantly higher in responders
compared with that in non-responders. Univariate analysis
demonstrated that ΔMTV was significantly associated with oTR. A
threshold of 54% ΔMTV divided the responders from the
non-responders with an AUC of 0.837 (95% CI 0.702–0.928), a
sensitivity of 0.698 and a specificity reaching 1.000 (P=0.001).
One retrospective multi-center study demonstrated that the MTV
defined by a physician significantly decreased from PET1 (pre-CRT)
to PET2 (3 weeks from the start of CRT), whereas the MTV defined as
40% of the SUVmax did not decrease significantly
(25). The MTV from PET1 or PET2 was
significantly lower in patients with CR at 3 months, while the
SUVmax was not.
The reasons for certain discrepancies in the
aforementioned studies may be explained by differences in the
pathological types of cancer, treatment regimens or criteria used
to evaluate the tumor response. In Western countries, the most
common pathological type of esophageal cancer is esophageal
adenocarcinoma, which may be more suited for neoadjuvant CRT
followed by surgery at locally advanced stages. The pathological CR
may be used to assess treatment response. However, in China, a
substantial proportion of newly diagnosed esophageal carcinomas
were squamous cell carcinomas and were not suitable for surgery
(26). For these patient, CRT was an
important treatment option. Therefore, the patients enrolled in the
present study all received definitive CRT. The aim of the present
study was to identify a reliable predictor to permit the early
identification of patients who may or may not respond to CRT. The
RECIST criteria is recommended to evaluate the solid tumor response
using the changes in tumor size on CT images. Due to
radiation-induced inflammation, edema may remain present in the
esophageal wall of certain patients, even >8 weeks after
radiotherapy (27). When using
metabolic parameters of FDG PET, OTR may be assessed 4 weeks from
the start of CRT (after 40 Gy irradiation), as in the present
study. However, it must be accounted for that FDG PET may have
difficulty in differentiating between complete responses and
residual disease or post-treatment inflammation (28), as glucose accumulates in tumor and
inflammatory cells, and inflammatory cells are common in irradiated
esophageal tissue. Therefore, uptake on an 18F-FDG PET
scan may represent either residual tumor or esophagitis. For
example, Yue et al (29)
recruited 21 patients with inoperable locally advanced ESCC who
underwent a serial 3′-deoxy-3′-(18)F-fluorothymidine (18F-FLT)
PET scan during radiotherapy. Among the 19 patients, 2 patients who
had undergone scans following completion of the entire radiotherapy
course exhibited no tumor uptake on the 18F-FLT PET
scan, but high uptake on the 18F-FDG PET scan.
Pathological examination of these regions revealed inflammatory
infiltrates, but no residual tumor (29). The aforementioned study suggests that
18F-FLT PET may discriminate tumor from esophagitis more
effectively than 18F-FDG PET, which may have important
clinical applications.
The present study has a number of limitations that
must be taken into account. To begin with, the study was
retrospective in design and comprised a small population.
Additionally, 18F-FDG PET scan results were compared
with objective therapeutic responses according to the RECIST 1.1
and not with the pathological response to treatment. According to
the pathological criteria, pathological T (primary tumor) and N
(lymph nodes) were assessed according to the percentage of viable
residual tumor cells within the postoperative cancerous tissues. In
the present study, it was not possible to acquire the postoperative
pathological tissues. Future prospective studies with a larger
study population may be able to accurately identify the association
between 18F-FDG PET scan results and oTR.
In conclusion, given the aforementioned limitations,
the present study provides clinical evidence that interim
18F-FDG PET scans may exhibit early prognostic value for
determining oTR in patients with ESCC. The findings of the present
study suggest that ΔMTV may be a useful parameter to assess
clinical oTR to definitive CRT, which may permit early
identification of CRT responders and non-responders.
References
|
1
|
Chen W, He Y, Zheng R, Zhang S, Zeng H,
Zou X and He J: Esophageal cancer incidence and mortality in China,
2009. J Thorac Dis. 5:19–26. 2013.PubMed/NCBI
|
|
2
|
Cooper JS, Guo MD, Herskovic A, Macdonald
JS, Martenson JA Jr, Al-Sarraf M, Byhardt R, Russell AH, Beitler
JJ, Spencer S, et al: Chemoradiotherapy of locally advanced
esophageal cancer: Long-term follow-up of a prospective randomized
trial (RTOG 85-01). Radiation therapy oncology group. JAMA.
281:1623–1627. 1999. View Article : Google Scholar : PubMed/NCBI
|
|
3
|
Ajani J, Bekaii-Saab T, D'Amico TA, Fuchs
C, Gibson MK, Goldberg M, Hayman JA, Ilson DH, Javle M, Kelley S,
et al: Esophageal cancer clinical practice guidelines. J Natl Compr
Canc Netw. 4:328–347. 2006. View Article : Google Scholar : PubMed/NCBI
|
|
4
|
Wieder HA, Ott K, Lordick F, Becker K,
Stahl A, Herrmann K, Fink U, Siewert JR, Schwaiger M and Weber WA:
Prediction of tumor response by FDG-PET: Comparison of the accuracy
of single and sequential studies in patients with adenocarcinomas
of the esophagogastric junction. Eur J Nucl Med Mol Imaging.
34:1925–1932. 2007. View Article : Google Scholar : PubMed/NCBI
|
|
5
|
Lordick F, Ott K, Krause BJ, Weber WA,
Becker K, Stein HJ, Lorenzen S, Schuster T, Wieder H, Herrmann K,
et al: PET to assess early metabolic response and to guide
treatment of adenocarcinoma of the oesophagogastric junction: The
MUNICON phase II trial. Lancet Oncol. 8:797–705. 2007. View Article : Google Scholar : PubMed/NCBI
|
|
6
|
Kim SJ, Koo PJ and Chang S: Predictive
value of repeated F-18 FDG PET/CT parameters changes during
preoperative chemoradiotherapy to predict pathologic response and
overall survival in locally advanced esophageal adenocarcinoma
patients. Cancer Chemother Pharmacol. 77:723–731. 2016. View Article : Google Scholar : PubMed/NCBI
|
|
7
|
Wieder HA, Brücher BL, Zimmermann F,
Becker K, Lordick F, Beer A, Schwaiger M, Fink U, Siewert JR, Stein
HJ and Weber WA: Time course of tumor metabolic activity during
chemoradiotherapy of esophageal squamous cell carcinoma and
response to treatment. J Clin Oncol. 22:900–908. 2004. View Article : Google Scholar : PubMed/NCBI
|
|
8
|
Swisher SG, Erasmus J, Maish M, Correa AM,
Macapinlac H, Ajani JA, Cox JD, Komaki RR, Hong D, Lee HK, et al:
2-Fluoro-2-deoxy-D-glucose positron emission tomography imaging is
predictive of pathologic response and survival after preoperative
chemoradiation in patients with esophageal carcinoma. Cancer.
101:1776–1785. 2004. View Article : Google Scholar : PubMed/NCBI
|
|
9
|
Vali FS, Nagda S, Hall W, Sinacore J, Gao
M, Lee SH, Hong R, Shoup M and Emami B: Comparison of standardized
uptake value-based positron emission tomography and computed
tomography target volumes in esophageal cancer patients undergoing
radiotherapy. Int J Radiat Oncol Biol Phys. 78:1057–1063. 2010.
View Article : Google Scholar : PubMed/NCBI
|
|
10
|
Jeganathan R, McGuigan J, Campbell F and
Lynch T: Does pre-operative estimation of oesophageal tumour
metabolic length using 18F-fluorodeoxyglucose PET/CT images compare
with surgical pathology length? Eur J Nucl Med Mol Imaging.
38:656–662. 2011. View Article : Google Scholar : PubMed/NCBI
|
|
11
|
Wahl RL, Jacene H, Kasamon Y and Lodge MA:
From RECIST to PERCIST: Evolving considerations for PET response
criteria in solid tumors. J Nucl Med. 50 Suppl 1:122S–150S. 2009.
View Article : Google Scholar : PubMed/NCBI
|
|
12
|
Edge SB, Byrd DR, Compton CC, Fritz AG,
Greene FL and Trotti A: From the AJCC cancer staging manualAJCC
Cancer Staging Handbook. 7th. Springer; New York, NY: 2010
|
|
13
|
Elimova E, Wang X, Etchebehere E, Shiozaki
H, Shimodaira Y, Wadhwa R, Planjery V, Charalampakis N, Blum MA,
Hofstetter W, et al: 18F-FDG PET/CT as predictive of response after
chemoradiation in esophageal cancer patients. Eur J Cancer.
51:2545–2552. 2015. View Article : Google Scholar : PubMed/NCBI
|
|
14
|
Findlay JM, Middleton MR and Tomlinson I:
A systematic review and meta-analysis of somatic and germline DNA
sequence biomarkers of esophageal cancer survival, therapy response
and stage. Ann Oncol. 26:624–644. 2015. View Article : Google Scholar : PubMed/NCBI
|
|
15
|
Sato Y, Motoyama S, Saito H and Minamiya
Y: Novel candidate biomarkers of chemoradiosensitivity in
esophageal squamous cell carcinoma: A systematic review. Eur Surg
Res. 56:141–153. 2016. View Article : Google Scholar : PubMed/NCBI
|
|
16
|
Monjazeb AM, Riedlinger G, Aklilu M,
Geisinger KR, Mishra G, Isom S, Clark P, Levine EA and Blackstock
AW: Outcomes of patients with esophageal cancer staged with
[18F]fluorodeoxyglucose positron emission tomography (FDG-PET): Can
postchemoradiotherapy FDG-PET predict the utility of resection? J
Clin Oncol. 28:4714–4721. 2010. View Article : Google Scholar : PubMed/NCBI
|
|
17
|
Yuan H, Tong DK, Vardhanabhuti V, Law SY,
Chiu KW and Khong PL: PET/CT in the evaluation of treatment
response to neoadjuvant chemoradiotherapy and prognostication in
patients with locally advanced esophageal squamous cell carcinoma.
Nucl Med Commun. 37:947–955. 2016. View Article : Google Scholar : PubMed/NCBI
|
|
18
|
Chhabra A, Ong LT, Kuk D, Ku G, Ilson D,
Janjigian YY, Wu A, Schöder H and Goodman KA: Prognostic
significance of PET assessment of metabolic response to therapy in
oesophageal squamous cell carcinoma. Br J Cancer. 113:1658–1665.
2015. View Article : Google Scholar : PubMed/NCBI
|
|
19
|
Huang JW, Yeh HL, Hsu CP, Lu YY, Chuang
CY, Lin JC, Lin JF and Chang CF: To evaluate the treatment response
of locally advanced esophageal cancer after preoperative
chemoradiotherapy by FDG-PET/CT scan. J Chin Med Assoc. 78:229–234.
2015. View Article : Google Scholar : PubMed/NCBI
|
|
20
|
Myslivecek M, Neoral C, Vrba R, Vomackova
K, Cincibuch J, Formanek R, Koranda P and Zapletalova J: The value
of 18F-FDG PET/CT in assessment of metabolic response in esophageal
cancer for prediction of histopathological response and survival
after preoperative chemoradiotherapy. Biomed Pap Med Fac Univ
Palacky Olomouc Czech Repub. 156:171–179. 2012. View Article : Google Scholar : PubMed/NCBI
|
|
21
|
Adams MC, Turkington TG, Wilson JM and
Wong TZ: A systematic review of the factors affecting accuracy of
SUV measurements. AJR Am J Roentgenol. 195:310–320. 2010.
View Article : Google Scholar : PubMed/NCBI
|
|
22
|
Lemarignier C, Di Fiore F, Marre C, Hapdey
S, Modzelewski R, Gouel P, Michel P, Dubray B and Vera P:
Pretreatment metabolic tumour volume is predictive of disease-free
survival and overall survival in patients with oesophageal squamous
cell carcinoma. Eur J Nucl Med Mol Imaging. 41:2008–2016. 2014.
View Article : Google Scholar : PubMed/NCBI
|
|
23
|
Chang S, Koo PJ, Kwak JJ and Kim SJ:
Changes in total lesion glycolysis evaluated by repeated F-18 FDG
PET/CT as prognostic factor in locally advanced esophageal cancer
patients treated with preoperative chemoradiotherapy. Oncology.
90:97–102. 2016. View Article : Google Scholar : PubMed/NCBI
|
|
24
|
Roedl JB, Colen RR, Holalkere NS, Fischman
AJ, Choi NC and Blake MA: Adenocarcinomas of the esophagus:
Response to chemoradiotherapy is associated with decrease of
metabolic tumor volume as measured on PET-CT. Comparison to
histopathologic and clinical response evaluation. Radiother Oncol.
89:278–286. 2008. View Article : Google Scholar : PubMed/NCBI
|
|
25
|
Palie O, Michel P, Ménard JF, Rousseau C,
Rio E, Bridji B, Benyoucef A, Meyer ME, Jalali K, Bardet S, et al:
The predictive value of treatment response using FDG PET performed
on day 21 of chemoradiotherapy in patients with oesophageal
squamous cell carcinoma. A prospective, multicentre study (RTEP3).
Eur J Nucl Med Mol Imaging. 40:1345–1355. 2013. View Article : Google Scholar : PubMed/NCBI
|
|
26
|
Shi XH: Advances on esophageal carcinoma
radiotherapy in China. China Oncol. 2001.
|
|
27
|
Lloyd S and Chang BW: Current strategies
in chemoradiation for esophageal cancer. J Gastrointest Oncol.
5:156–165. 2014.PubMed/NCBI
|
|
28
|
Arslan N, Miller TR, Dehdashti F,
Battafarano RJ and Siegel BA: Evaluation of response to neoadjuvant
therapy by quantitative 2-deoxy-2-[18F]fluoro-D-glucose with
positron emission tomography in patients with esophageal cancer.
Mol Imaging Biol. 4:301–310. 2002. View Article : Google Scholar : PubMed/NCBI
|
|
29
|
Yue J, Chen L, Cabrera AR, Sun X, Zhao S,
Zheng F, Han A, Zheng J, Teng X, Ma L, et al: Measuring tumor cell
proliferation with 18F-FLT PET during radiotherapy of esophageal
squamous cell carcinoma: A pilot clinical study. J Nucl Med.
51:528–534. 2010. View Article : Google Scholar : PubMed/NCBI
|