Introduction
Computed tomography (CT) has been widely used in
clinical diagnoses and treatments. In many CT scanners, standard
12-bit depth images have been commonly utilized, and 4,096 CT
values ranging from −1,024 HU to 3,071 HU have been established.
This range can accurately represent different tissues in patients
under normal conditions. However, CT values significantly exceed
the upper limit of 3,071 HU because of the presence of metal
implants in a patient's body. Therefore, different metal implants
cannot be distinguished in 12-bit images. In patients with common
hip prostheses, implants are characterized by either a high atomic
number or high-density metals. The exact CT values of such
prostheses cannot also be determined through conventional CT scan;
consequently, the calculated dose distributions of radiation are
affected (1,2). Therefore, 16-bit CT images are
reconstructed by extending the bit depth of CT (3–5), and this
reconstruction generates a wide range of CT values. Coolens
(6) also observed that stainless
steel, titanium, and other hip prostheses can be differentiated in
16-bit CT images. Metal regions can also be distinguished by
adjusting the window width and window level.
In radiotherapy, dose distribution is calculated on
the basis of a patient's CT image (7)
in a treatment planning system (TPS). In the TPS, a CT image is
converted to the corresponding electron density on the basis of a
calibrated CT with a relative electron density (CT-ED) curve, which
is obtained under a certain standard scanning condition. Patients
are usually examined under different scanning conditions depending
on clinical requirements. The frequent upgrades of hardware and
software for CT scanners and TPS may require recalibration
procedures, which are hard to satisfy. In practice, a conversion
table is usually fixed and a scanning condition similar to a
standard condition is selected whenever possible. Nevertheless,
this procedure may cause errors in dose delivery. Varying CT
scanning conditions may alter the CT value of the same material
(8). For instance, Zurl (9) demonstrated that a change in tube voltage
results in variations of up to 20% in HU and thus yields a maximum
dose error of 1.5%. However, dose errors may increase remarkably in
patients with high-density metal implants, and such errors are
detrimental to patients undergoing radiotherapy. In the present
study, stainless steel and titanium rods, which are commonly used
implanted materials, were scanned and analyzed under various CT
scanning conditions. Differences in dose distributions for CT
images were further analyzed.
Materials and methods
Experimental materials
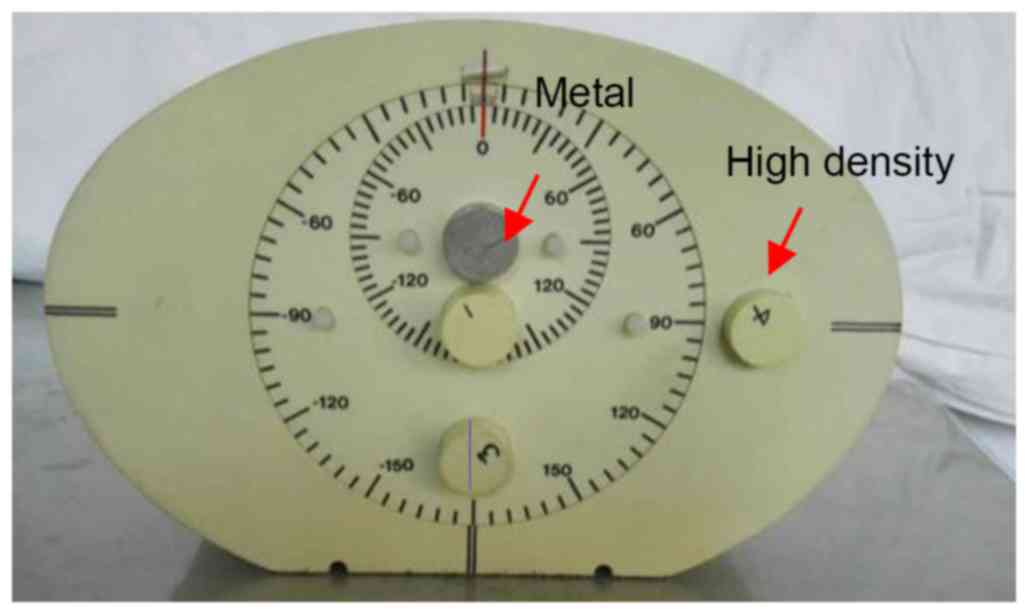
We used a computerized imaging reference system
(CIRS) intensity-modulated radiation therapy-verified phantom
(Fig. 1) produced by CIRS, Inc., USA.
A cylindrical metal rod, a stainless steel rod, or a titanium alloy
rod was inserted into the center of the phantom. A high-density rod
with a bone-like tissue and two cylindrical rods composed of a
material similar to that of the phantom were also utilized. The
phantom was scanned with SOMATOM Definition Flash CT (SIEMENS). The
extended bit depth function was chosen, and a 16-bit CT image was
reconstructed. The axial scanning mode was applied. The collimator
width was 64.0×0.6 mm and the X-ray tube rotation time was 0.5
s/rotation. The scanning layer thickness was 2 mm, and the image
reconstruction matrix was 512×512.
Experimental method
After the metal rod was inserted into the phantom,
the tube voltages or currents were altered and the other scanning
conditions were unchanged. The CT images were obtained under
different conditions during the experiment. The tube current was
fixed at 230 mA, and the tube voltages were 100, 120, and 140 kV.
The tube voltage was fixed at 120 kV, and the tube currents were
set to 180, 230, and 280 mA. CT image data in DICOM format were
inputted into MATLAB 8.3. The relationship between the CT value
distribution of the metal parts and the scanning conditions was
analyzed. The standard scanning conditions were set as 120 kV and
230 mA, and the absolute and relative differences in CT values were
calculated when the tube voltage and tube current were changed.
d=x–x120kV,230mA
r=dx120kV,230mA×100%.
where × is the CT value of the material under each
scanning condition, x120kV,230mA is the CT value of the
material under the standard scanning conditions 120 kV and 230 mA,
d is the absolute difference between these values, and r is the
relative difference between these values. Throughout this text, the
CT values are the theoretical Hounsfield number (HU) plus 1,000
(6,10); i.e., air =0 and water =1,000. The CT
value of the phantom is similar to water.
The densities of the titanium alloy and stainless
steel rods were high, and their corresponding CT values were
significantly higher than that of normal tissues. The metal parts
could be segmented on the basis of 4000 HU threshold. In the
phantom, the CT value of the metal parts fluctuated greatly because
of the serious ‘cupping artifact’ and inaccuracy. For the
cylindrical metal rod, the maximum CT value at the edge of the
metal region is close to the actual value (5). To correct the ‘cupping artifact’, we
uniformly set the CT values of the segmented metal area to the
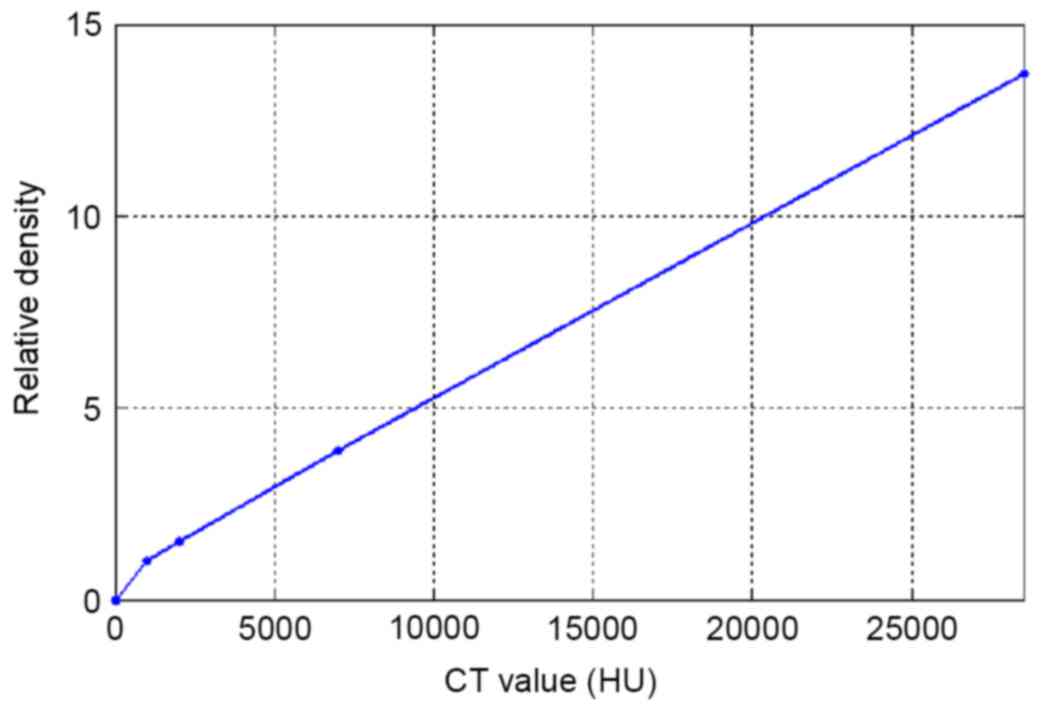
maximum CT value of the metal region. The corrected CT images were
then inputted into the Varian treatment planning system (Varian
Eclipse edition 11.0). In the TPS, the CT-ED curve (Fig. 2) calibrated at 120 kV and 230 mA was
used in dose calculation. A radiotherapy treatment plan was
designed on the basis of these images. A 0° single irradiation
field was used, the source to skin distance (SSD) was 100 cm, and
the machine output quality was 200 MU. The radiation field was
10×10 cm, and the X-ray energy was 6 MV. Dose distribution was
calculated using an anisotropic analytic algorithm.
Results
CT value distribution in the
phantom
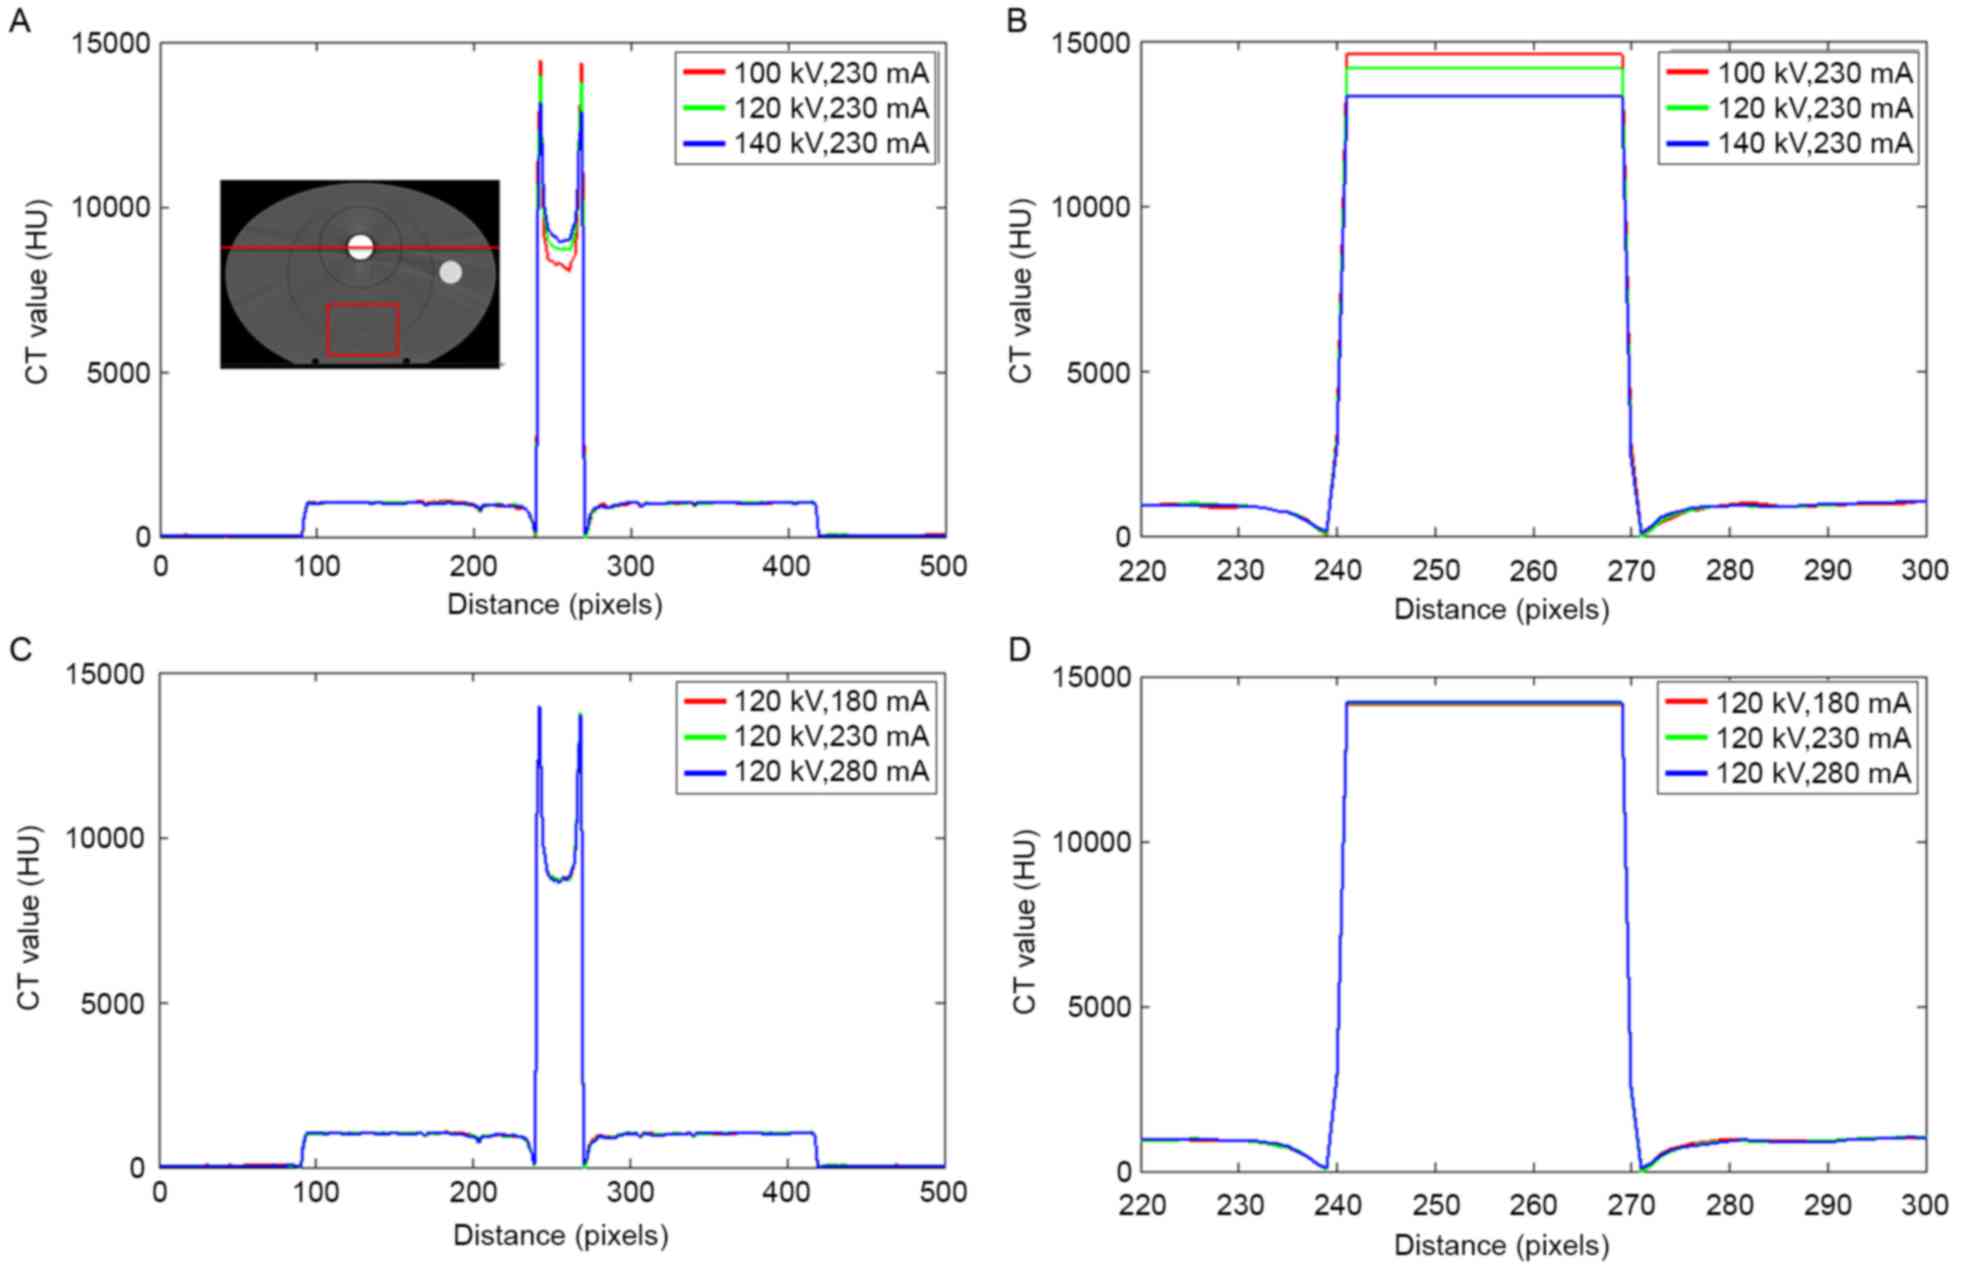
Fig. 3 depicts the CT
value distribution in the phantom with a stainless steel rod under
different scanning conditions. The serious ‘cupping artifact’ was
observed in uncorrected CT images Fig. 3A
and C. The tube voltage ranged from 100–140 kV, and the CT
values of the metals varied significantly. On the edge of the metal
area, the largest CT value was detected at 100 kV and the smallest
CT value was recorded at 140 kV. By contrast, the CT value of the
metal center was decreased at 100 kV and increased at 140 kV. The
changes in the tube current resulted in slight deviations in the
metal region.
A region of interest (ROI) in the phantom, as shown
in the rectangular red region far from the metal in Fig. 3A, was analyzed. The mean CT values of
the ROI were 999, 998, and 997 HU when the tube voltages were 100,
120, and 140 kV, respectively. The changes in the tube voltage
resulted in a slight variation of the CT values at low densities.
These findings are consistent with those in a previous study
(9). For the bone
equivalent insert, the mean CT values were 1,811, 1,741, and 1,700
HU when the tube voltages were 100, 120, and 140 kV, respectively.
The changes in the tube voltage resulted in larger deviations as
density increased.
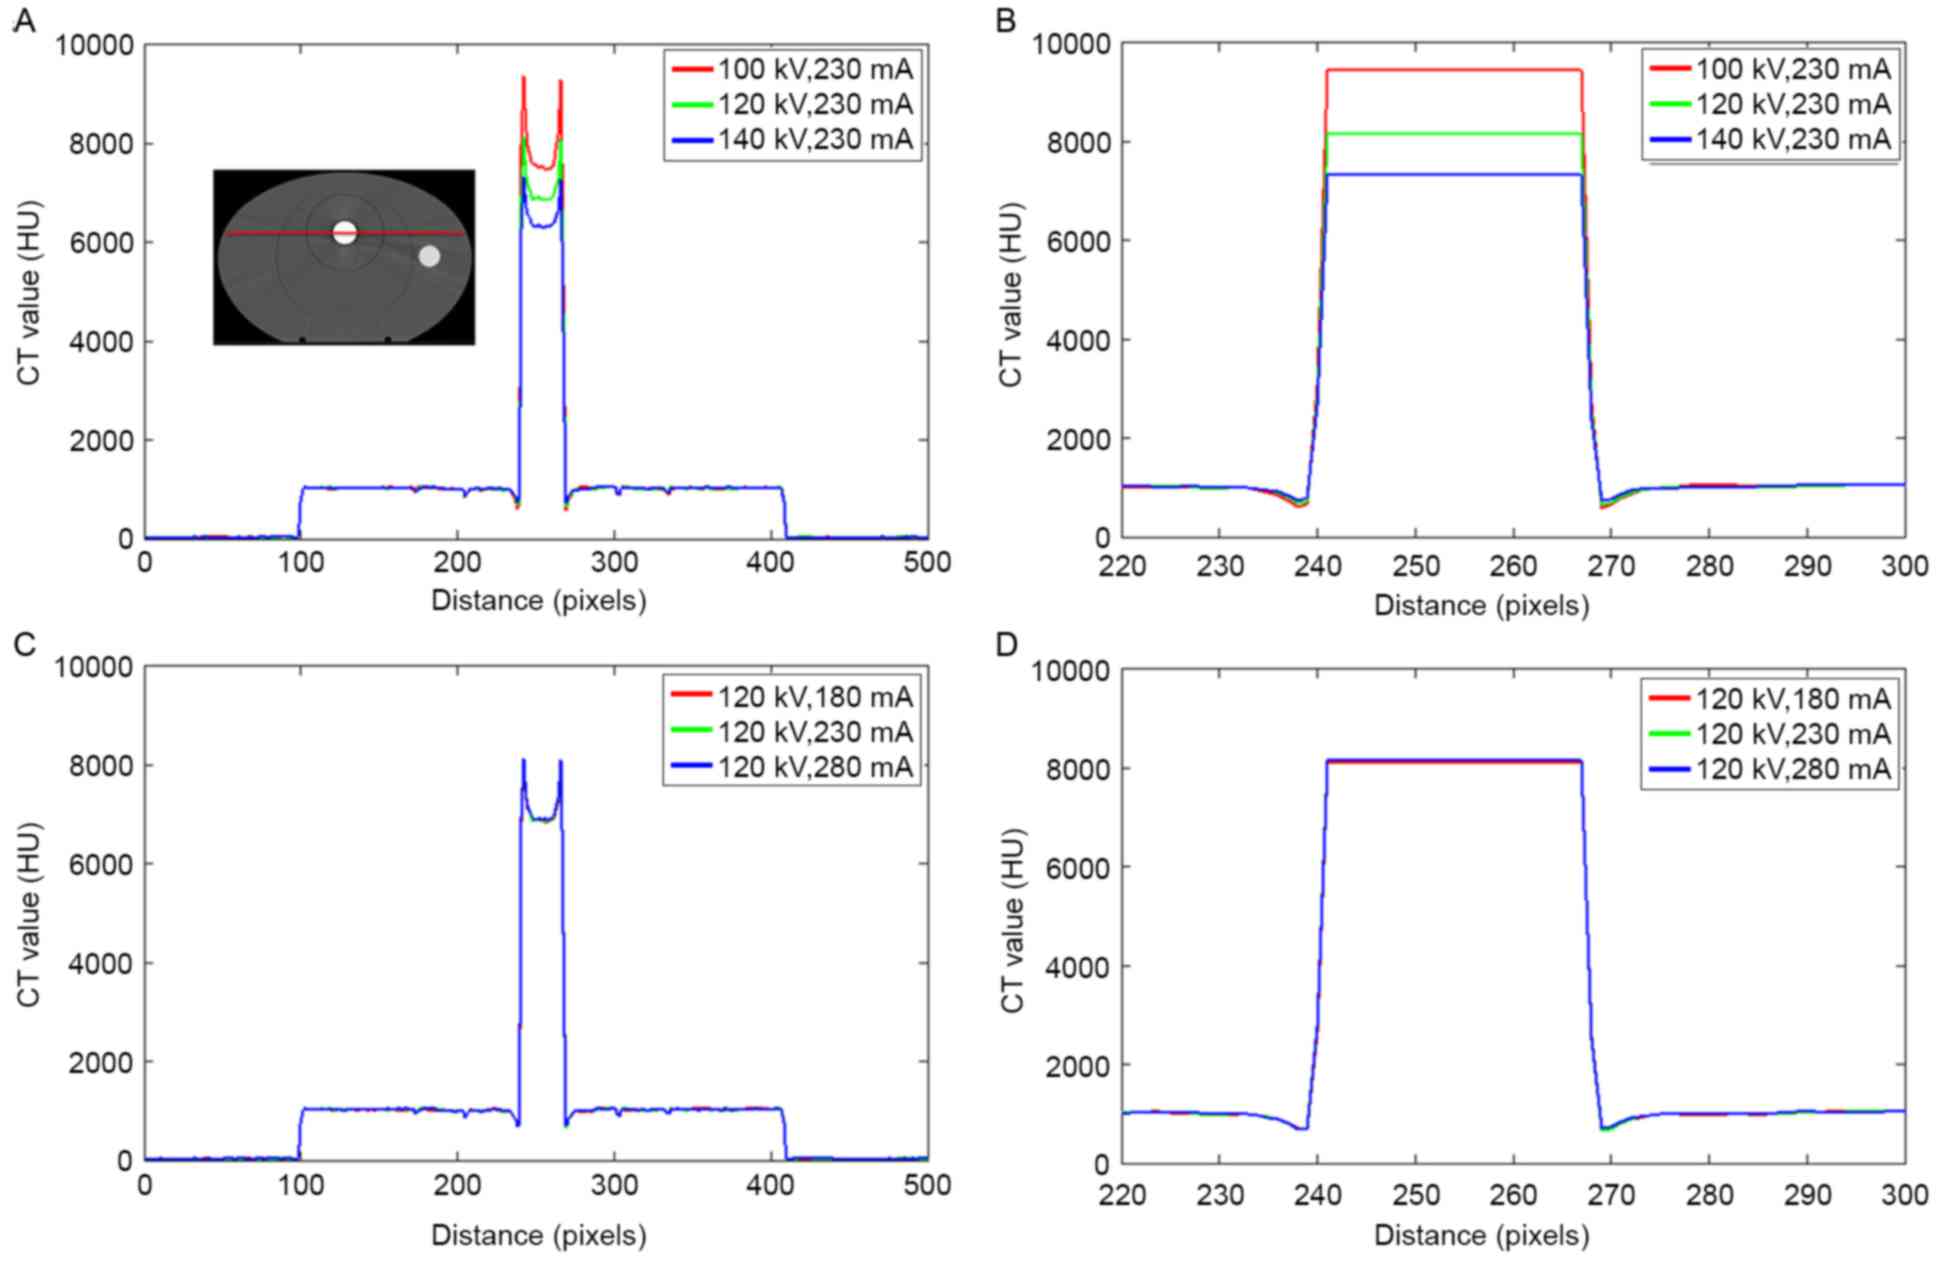
The CT value in the phantom with a titanium rod is
illustrated in Fig. 4. Similar to
those shown in Fig. 3, large
deviations were observed in the titanium rod as the tube voltage
changed. The CT value of the metal was slightly influenced by the
tube current.
The differences in the CT values of stainless steel
and titanium under various scanning conditions are shown in
Table I. The CT value of the metals
was corrected with the maximum CT values in the metal region. With
different tube voltages, the deviations in HU reached 5.89 and
15.72% for stainless steel and titanium, respectively. Variations
smaller than 1% in HU were caused by changes in the tube currents
for both stainless steel and titanium.
 | Table I.Maximum CT values of stainless steel
and titanium under various scanning conditions. Differences
calculated through Eqs. (1) and
(2). |
Table I.
Maximum CT values of stainless steel
and titanium under various scanning conditions. Differences
calculated through Eqs. (1) and
(2).
|
| Stainless steel | Titanium |
|---|
|
|
|
|
|---|
| Scanning
conditions | CT value | d (HU) | r (%) | CT value | d (HU) | r (%) |
|---|
| 120 kV, 230 mA | 14,127 | – | – | 8,140 | – | – |
| 100 kV, 230 mA | 14,568 | 441 | 3.12 | 9,420 | 1,280 | 15.72 |
| 140 kV, 230 mA | 13,295 | −832 | −5.89 | 7,310 | −830 | −10.20 |
| 120 kV, 180 mA | 14,107 | −20 | −0.14 | 8,080 | −60 | −0.74 |
| 120 kV, 280 mA | 14,183 | 56 | 0.40 | 8,140 | 0 | 0 |
Dose distribution in the phantom
In the TPS, the CT image was converted to the
corresponding electron density via the CT-ED curve (11–13)
calibrated at 120 kV and 230 mA, and dose distribution was
calculated.
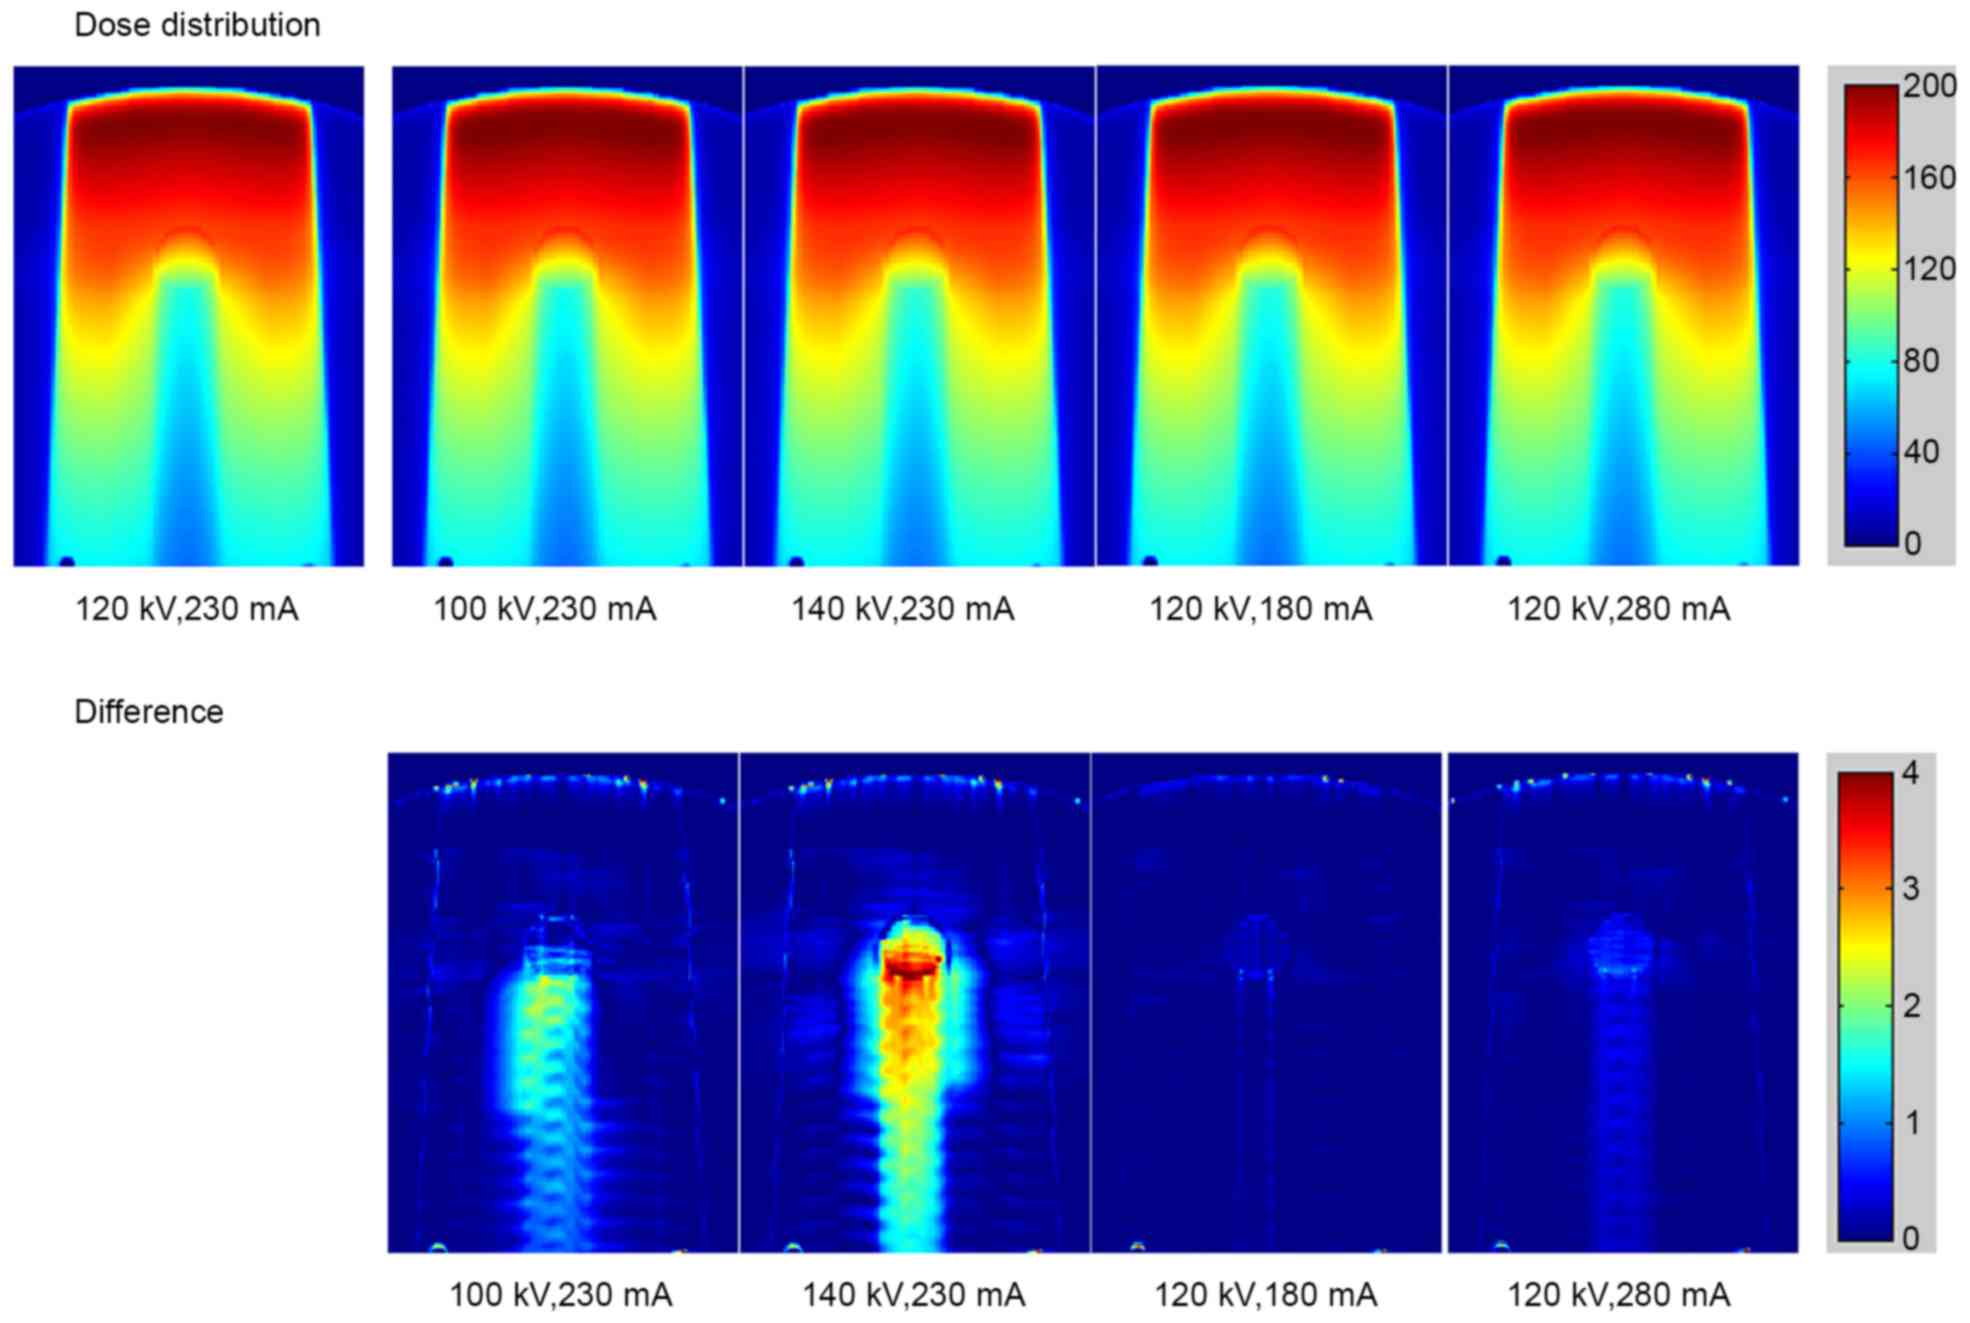
The calculated dose distributions in the phantom
with stainless steel rod under different scanning conditions are
shown in Fig. 5 (top row). The bottom
row in Fig. 5 reveals the dose
difference under various scanning conditions compared with the
standard conditions of 120 kV and 230 mA. The dose distribution for
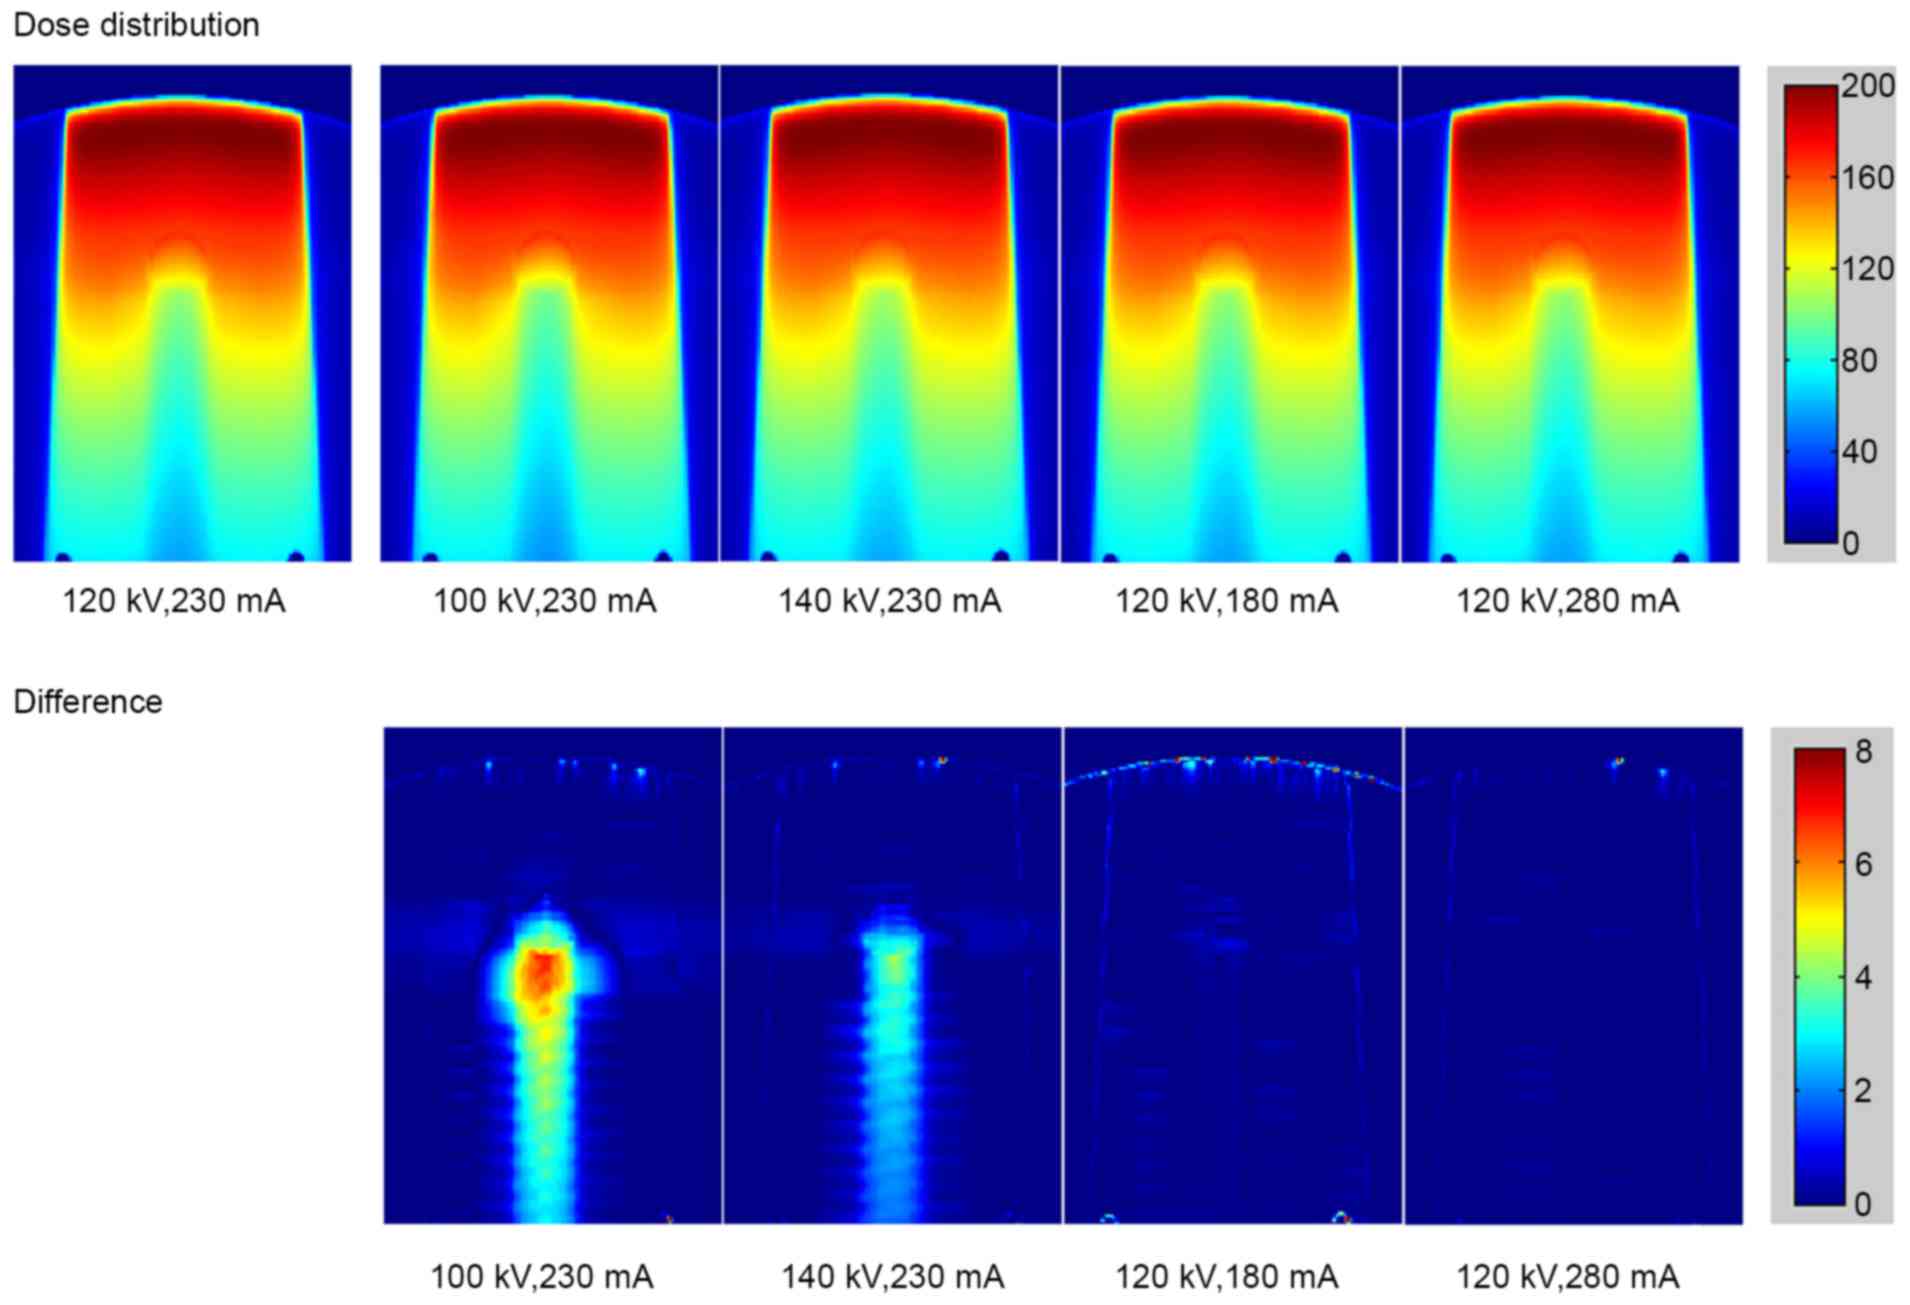
titanium rod is displayed in Fig. 6.
As the tube voltage changed, the dose errors resulting from the
deviations of CT values were observed in stainless steel and
titanium. The major error was detected in the region downstream of
the metal rod. Small errors caused by the tube current were also
detected.
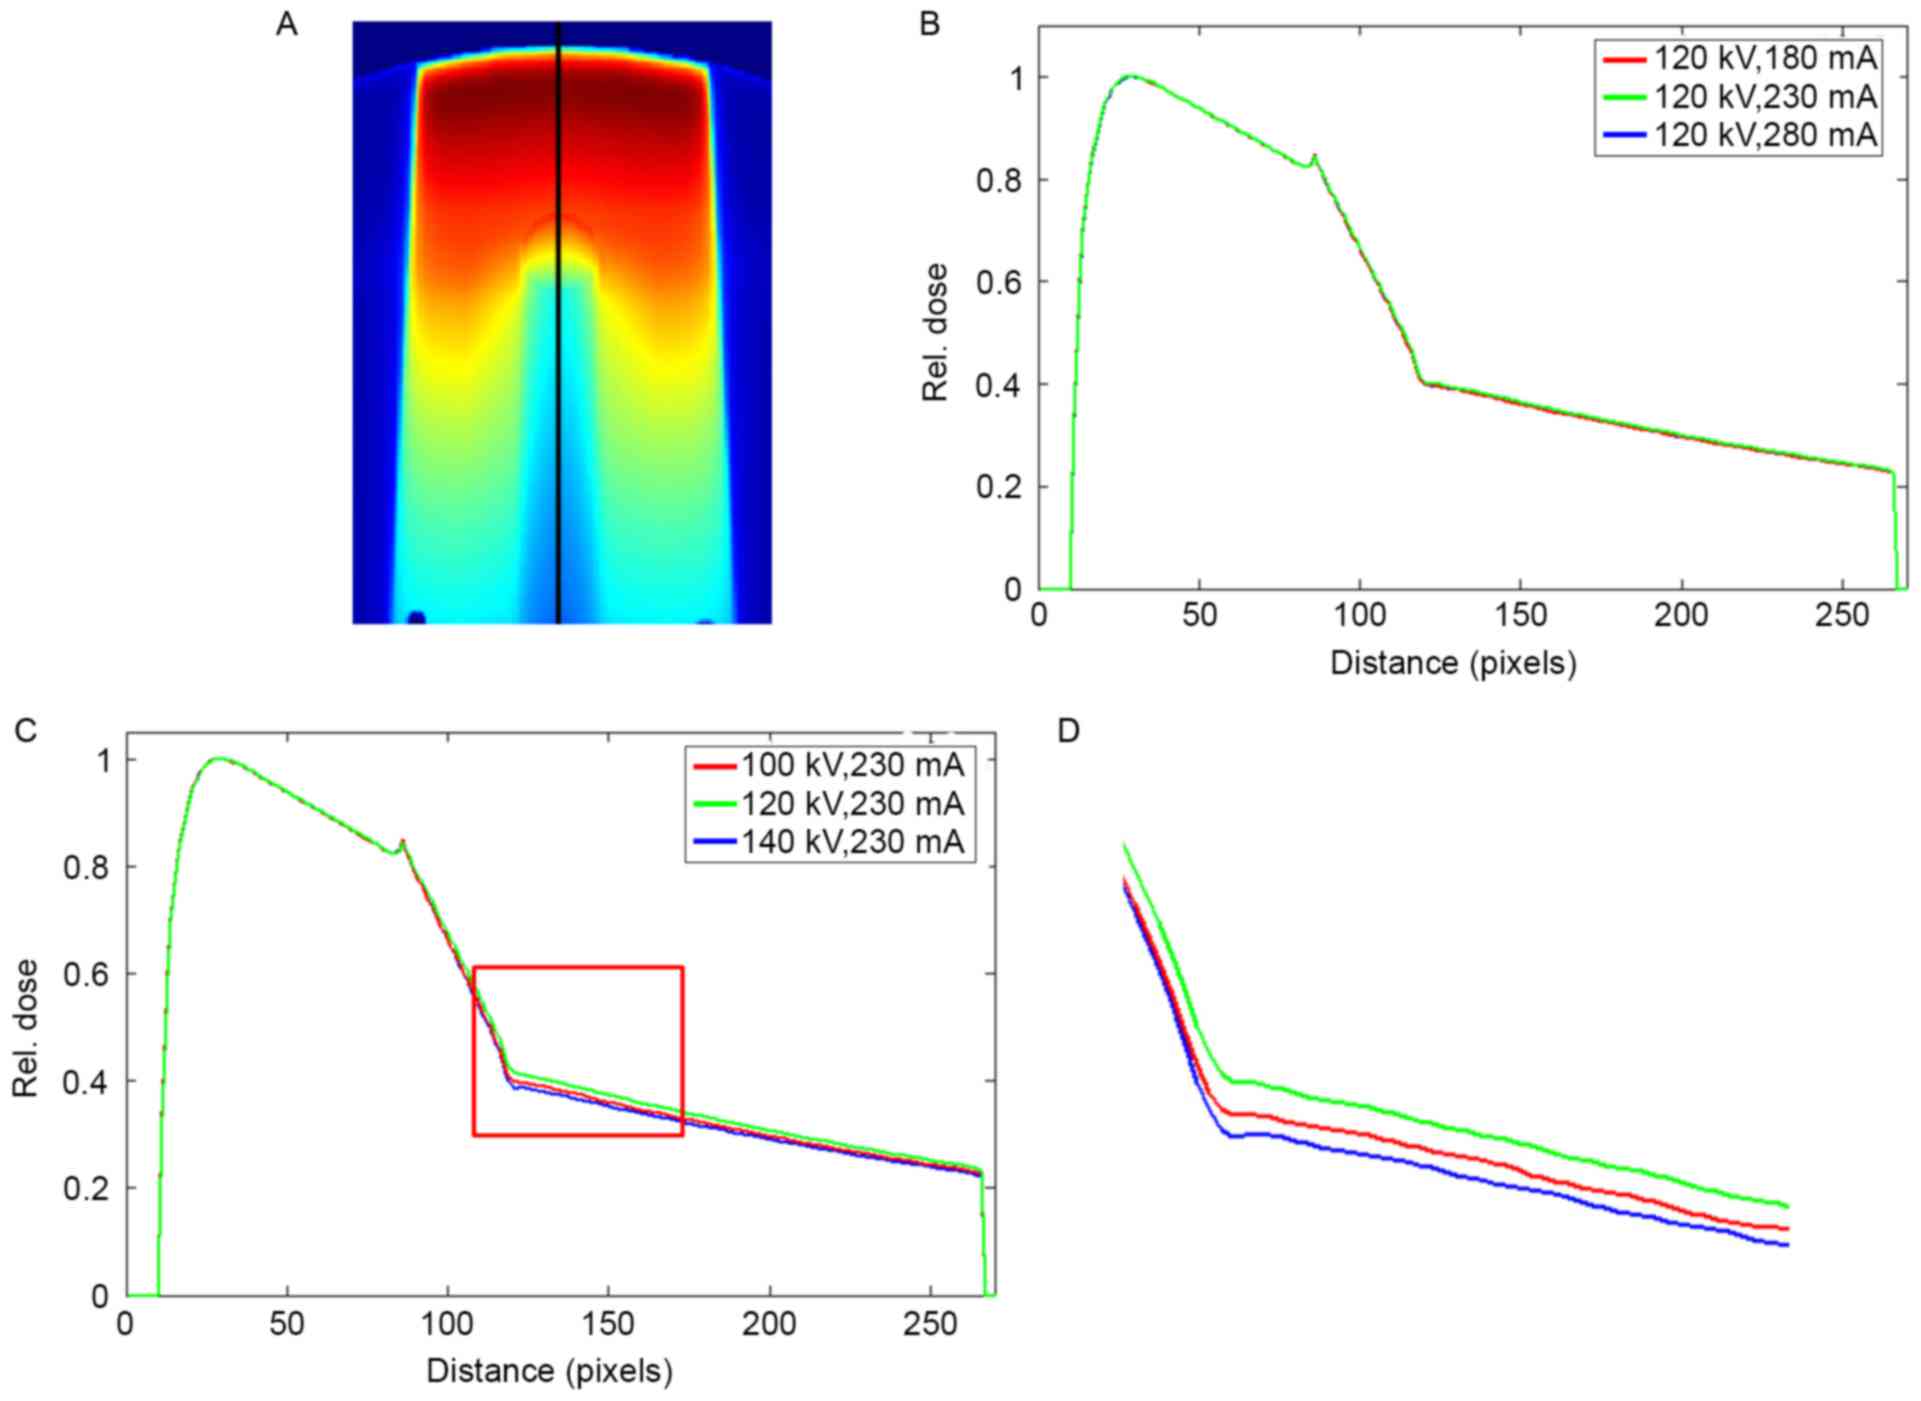
Fig. 7 summarizes the
dose profiles following the beam trajectory in the phantom with
stainless steel under different scanning conditions. The profiles
were normalized to the maximum dose before they were compared. A
peak was observed at the tissue-metal interface. At different tube
currents, the curves of the dose profiles almost completely
overlapped. As the tube currents changed to 180 and 280 mA, the
respective maximum dose errors were 0.55 and 0.98%. The changes in
tube voltages resulted in visible differences in the profiles. The
maximum dose errors of 2.85 and 5.70% were observed at 100 and 140
kV, respectively. The mean dose errors in the downstream of the
metal rod were 1.99 and 4.72% at 100 and 140 kV, respectively.
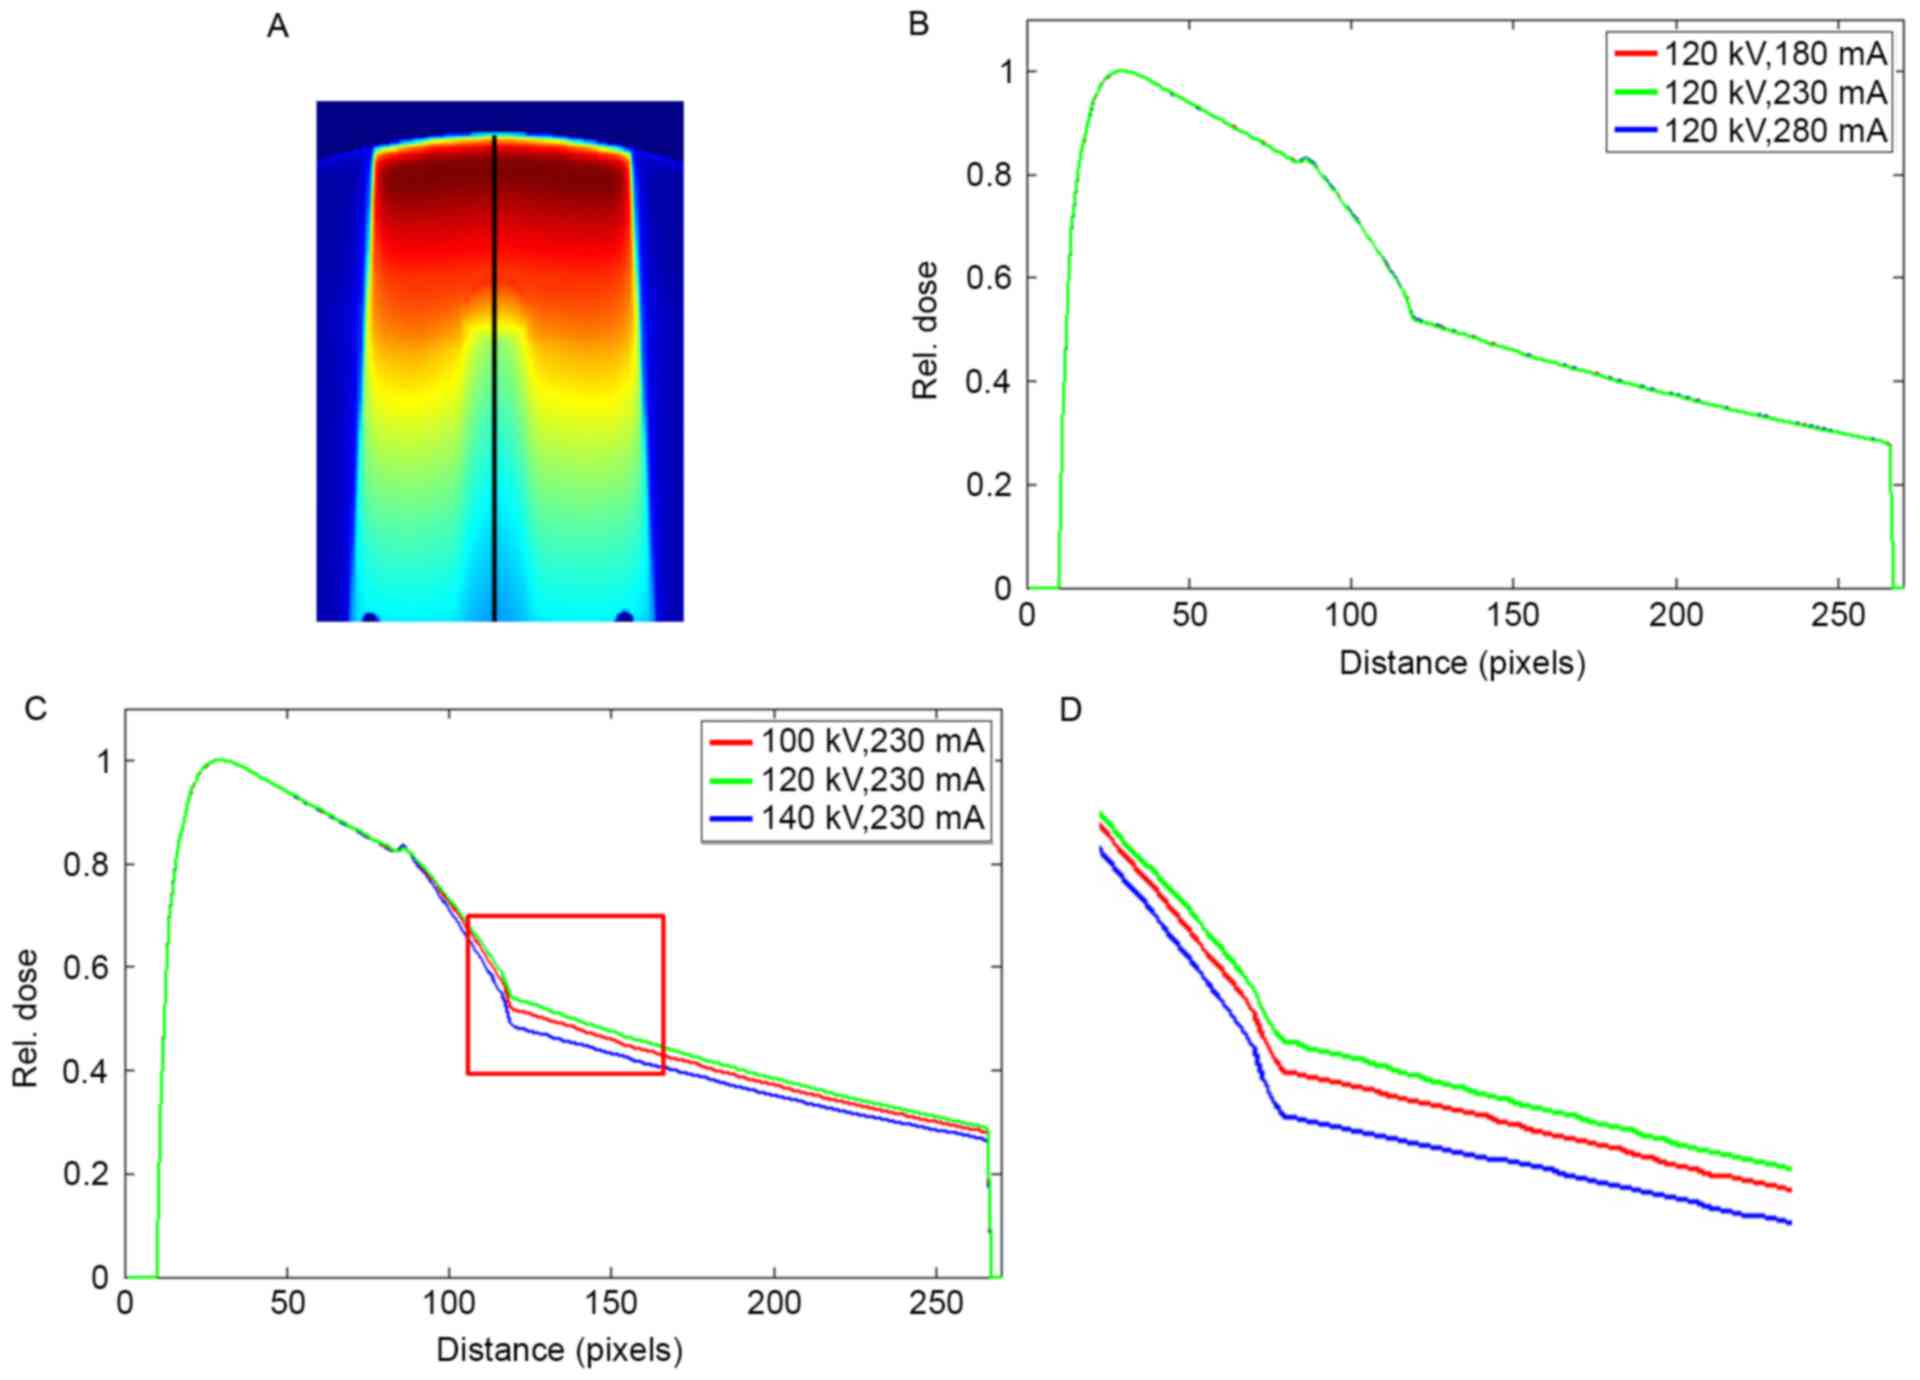
The dose profile in the phantom with titanium rod is
displayed in Fig. 8. Similar to
Fig. 7, the dose profiles almost
overlapped as the tube current changed, and significant differences
in the profiles were attributed to the variations in tube voltages.
The maximum dose errors of 0.61 and 0.09% were observed at 180 and
280 mA, respectively. The CT values of titanium did not vary as the
tube current was changed to 280 mA (Table
I). A dose error of up to 0.09% was a random error, not a
result of the changes in tube current. The maximum dose errors of
6.62 and 4.37% were observed at 100 and 140 kV, respectively. The
mean dose errors in the downstream of the metal rod were 5.26 and
3.31% at 100 and 140 kV, respectively.
Discussion
The dependence of CT values on scanning conditions
has been extensively investigated in normal tissues (14,15). Dose
errors caused by different scanner settings should be considered in
TPS (16). For metal implants,
variations in CT values as a result of different scanning
conditions are larger than those in normal tissues. Consequently,
dose errors are increased.
The present study aimed to evaluate the effects of
different scanning conditions on CT values and dose errors. For
stainless steel and titanium rods, CT values were slightly
influenced by tube currents. Thus, a maximum dose error of less
than 1% was obtained. However, the influence of the changes in tube
voltage on CT values should also be determined. In this study, the
CT values of the metal decreased as the tube voltage increased. As
the tube voltage was changed, the energy of the X-ray photon
emitted by a CT machine was altered. Attenuation coefficients
varied with X-ray energies. As a result, CT values varied. For
high-density materials, a decrease in tube voltage causes a
reduction of X-ray photon energy, and the attenuation coefficient
of a material is increased as CT values increase. For commonly used
implant materials, such as stainless steel and titanium, changes in
tube voltages affected CT values. Thus, evident dose errors were
obtained. The changes in the tube voltage yielded maximum dose
errors of 5.70 and 6.62% for stainless steel and titanium,
respectively. These findings were much larger than those in a
previous study (9), which showed a
maximum dose error of 1.5% in normal tissues.
Metal CT values can be determined through 16-bit CT
imaging. This method can also be applied to distinguish stainless
steel, titanium, and other metal implants with different densities.
The CT value of a metal implant changes significantly and the dose
distributions based on CT images considerably differ when tube
voltage is altered during CT imaging. The CT value of a metal
changes slightly when tube current is altered to a certain extent.
Thus, dose distributions slightly vary. In the radiotherapy of
patients with metal implants, CT scanning should be executed under
a fixed tube voltage to ensure accuracy of the calculated dose. The
tube voltage must be same as the condition under which the CT-ED
relationship was calibrated.
Acknowledgements
The present study was supported by the Natural
Science Foundation of Jiangsu Province Research of China (grant no.
BK20151181), High-Level Medical Talents Training.
Project of Changzhou (grant no: 2016CZLJ004) and the
Municipal Social Development Project of the Changzhou City, Jiangsu
Province, China (grant no. CJ20160029).
References
|
1
|
Keall PJ, Chock LB, Jeraj R, Siebers JV
and Mohan R: Image reconstruction and the effect on dose
calculation for hip prostheses. Med Dosim. 28:113–117. 2003.
View Article : Google Scholar : PubMed/NCBI
|
|
2
|
Keall PJ, Siebers JV, Jeraj R and Mohan R:
Radiotherapy dose calculations in the presence of hip prostheses.
Med Dosim. 28:107–112. 2002. View Article : Google Scholar
|
|
3
|
Glide-Hurst C, Chen D, Zhong H and Chetty
IJ: Changes Realized from extended bit-depth and metal artifact
reduction in CT. Med Phys. 40:0617112013. View Article : Google Scholar : PubMed/NCBI
|
|
4
|
Link TM, Berning W, Scherf S, Joosten U,
Joist A, Engelke K and Daldrup-Link HE: CT of metal implants:
Reduction of artifacts using an extended CT scale technique. J
Comput Assist Tomogr. 24:165–172. 2000. View Article : Google Scholar : PubMed/NCBI
|
|
5
|
Paudel MR, Mackenzie M, Fallone BG and
Rathee S: Evaluation of normalized metal artifact reduction (NMAR)
in kVCT Using MVCT prior images for radiotherapy treatment
planning. Med Phys. 40:0817012013. View Article : Google Scholar : PubMed/NCBI
|
|
6
|
Coolens C and Childs PJ: Calibration of CT
Hounsfield units for radiotherapy treatment planning of patients
with metallic hip prostheses: The use of the extended CT-scale.
Phys Med Biol. 48:1591–1603. 2003. View Article : Google Scholar : PubMed/NCBI
|
|
7
|
Schneider U, Pedroni E and Lomax A: The
calibration of CT hounsfield units for radiotherapy treatment
planning. Phys Med Biol. 41:111–124. 1996. View Article : Google Scholar : PubMed/NCBI
|
|
8
|
Thomas SJ: Relative electron density
calibration of CT scanners for radiotherapy treatment planning. Br
J Radiol. 72:781–786. 1999. View Article : Google Scholar : PubMed/NCBI
|
|
9
|
Zurl B, Tiefling R, Winkler P, Kindl P and
Kapp KS: Hounsfield units variations: Impact on CT-density based
conversion tables and their effects on dose distribution.
Strahlenther Onkol. 190:88–93. 2014. View Article : Google Scholar : PubMed/NCBI
|
|
10
|
Newhauser WD, Giebeler A, Langen KM,
Mirkovic D and Mohan R: Can megavoltage computed tomography reduce
proton range uncertainties in treatment plans for patients with
large metal implants? Phys Med Biol. 53:2327–2344. 2008. View Article : Google Scholar : PubMed/NCBI
|
|
11
|
Ebert MA, Lambert J and Greer PB: CT-ED
conversion on a GE Lightspeed-RT scanner: Influence of scanner
settings. Australas Phys Eng Sci Med. 31:154–159. 2008. View Article : Google Scholar : PubMed/NCBI
|
|
12
|
Saw CB, Loper A, Komanduri K, Combine T,
Huq S and Scicutella C: Determination of CT-to-density conversion
relationship for image-based treatment planning systems. Med Dosim.
30:145–148. 2005. View Article : Google Scholar : PubMed/NCBI
|
|
13
|
Constantinou C, Harrington JC and DeWerd
LA: An electron density calibration phantom for CT-based treatment
planning computers. Med Phys. 19:325–327. 1992. View Article : Google Scholar : PubMed/NCBI
|
|
14
|
Skrzyński W, Zielińska-Dabrowska S,
Wachowicz M, Slusarczyk-Kacprzyk W, Kukołowicz PF and Bulski W:
Computed tomography as a source of electron density information for
radiation treatment planning. Strahlenther Onkol. 186:327–333.
2010. View Article : Google Scholar : PubMed/NCBI
|
|
15
|
Zabel-du Bois A, Ackermann B, Hauswald H,
Schramm O, Sroka-Perez G, Huber P, Debus J and Milker-Zabel S:
Influence of intravenous contrast agent on dose calculation in 3-D
treatment planning for radiosurgery of cerebral arteriovenous
malformations. Strahlenther Onkol. 185:318–324. 2009. View Article : Google Scholar : PubMed/NCBI
|
|
16
|
Ramm U, Damrau M, Mose S, Manegold KH,
Rahl CG and Böttcher HD: Influence of CT contrast agents on dose
calculations in a 3D treatment planning system. Phys Med Biol.
46:2631–2635. 2001. View Article : Google Scholar : PubMed/NCBI
|