Introduction
Glioma is a type of tumor originating in the brain
or spine (1). On the basis of
histological features, gliomas may be divided into subtypes,
including ependymoma, astrocytoma, oligodendroglioma and brainstem
glioma (2). Gliomas of the brain
typically induce headaches, cranial nerve disorders and seizures,
whereas spinal cord gliomas induce pain and numbness in the
extremities (3). Depending on the
location and cell type of the disease, surgery, radiation therapy
and chemotherapy may be combined in glioma treatment (4). However, gliomas are associated with a
poor prognosis (5).
The underlying molecular mechanism for glioma
tumorigenesis has yet to be established, as it is associated with a
number of contributing oncogenes. Therefore, characterizing the
molecular mechanisms of the disease is a popular area for research.
Previous studies have demonstrated that polymorphisms of DNA repair
genes, including excision repair cross-complementing group 1 and 2,
and X-ray repair cross-complementing 1, may be associated with an
increased risk of glioma development (6). Excessive DNA damage may induce the
progression of cancer by causing further mutations that upregulate
glioma proliferation (7). In
addition, it was previously identified that microRNA-181d regulated
the expression of O-6-methylguanine-DNA methyltransferase,
potentially inducing glioma progression (8). Although a number of genes and microRNAs
associated with glioma have been identified, it is not sufficient
to establish a complete strategy for glioma treatment.
Sun et al (9)
produced mRNA microarray expression profile data with tumor samples
collected from glioma patients (GSE4290), which demonstrated that
stem cell factor may be associated with tumor-mediated angiogenesis
and the development of glioma. Using bioinformatics analysis of the
Sun et al (9) study, Wei et
al (10) identified additional
differentially expressed genes (DEGs) and the associated
transcription factors. The molecular mechanisms of different glioma
subtypes were associated with distinct regulatory signaling
pathways (10).
In order to research the common molecular mechanisms
of gliomas, in addition to the specific mechanisms of different
subtypes, the aforementioned GSE4290 gene expression profile was
downloaded and analyzed in the present study. A DEG comparison
between different subtypes was performed. This may lay the
theoretical foundation for novel strategies of glioma
treatment.
Materials and methods
Data acquisition
The gene expression profile collection GSE4290
(9), which included the expression
profile data from 180 samples, was downloaded from the Gene
Expression Omnibus (GEO) database (https://www.ncbi.nlm.nih.gov/geo/). The data had been
generated using the GPL570 (HG-U133_Plus_2) Affymetrix Human Genome
U133 Plus 2.0 microarray platform. The data of 23 samples from the
glial cells of epilepsy patients from GSE4290 were used as
non-tumor control profiles. The remaining 157 tumor expression
profiles included 26 astrocytoma profiles, 50 oligodendroglioma
profiles and 81 glioblastoma profiles. The raw data were obtained
for the subsequent analysis.
Data preprocessing and DEG
screening
The reduced major axis method (11) was used to normalize the raw data with
the Affy package (12) in R. Compared
with non-tumor expression profiles, the DEGs from each glioma
subtype were identified by the T-test method with a linear
regression model from the R package limma (13). The threshold for DEGs was |logFC|
>1.0 and P<0.05.
Gene ontology (GO) and Kyoto
Encyclopedia of Genes and Genomes (KEGG) pathway enrichment
analysis of DEGs
The GO database comprises data concerning gene
annotations, which primarily includes 3 categories: Molecular
function (MF); biological process (BP); and cellular component (CC)
(14). KEGG (www.kegg.jp) is a database for the systematic analysis
of gene functions. The online tool Database for Annotation,
Visualization and Integrated Discovery (DAVID) (15) was used for a KEGG pathway enrichment
analysis of the identified DEGs. P<0.05 was considered to
indicate a significant enrichment.
Protein-protein interaction (PPI)
network construction
STRING is a database of experimentally confirmed and
predicted PPIs (16). A PPI network
was constructed based on STRING and visualized with Cytoscape 2.8.2
(17) with the threshold of combined
score >0.4. The degree of connectivity was used to identify hub
nodes and remove nodes of low significance.
Module analysis and KEGG enrichment
analysis
Modules, i.e., groups of genes with similar
functional properties, of the constructed PPI network were
identified with ClusterONE (18) in
Cytoscape with a threshold of P<0.05. The DEG modules were
subsequently used for KEGG pathway enrichment analysis as
previously described.
DEG comparison of different
subtypes
GeneVenn is an online application for comparing gene
lists using Venn diagrams (19).
GeneVenn software was used for comparing DEGs between the glioma
subtypes.
Results
DEG screening and pathway enrichment
analysis
Astrocytoma
Compared with non-tumor expression profiles, a total
of 863 DEGs, including 624 upregulated and 239 downregulated DEGs,
were screened from the astrocytoma expression profile data. The
upregulated DEGs were enriched in KEGG pathways including
‘neuroactive ligand-receptor interaction’, ‘calcium signaling
pathway’, ‘MAPK signaling pathway’ and ‘gap junction’, whereas
downregulated DEGs were enriched in pathways including ‘cell
adhesion molecules’, ‘complement and coagulation cascades’ and
‘intestinal immune network for IgA production’ (Table I).
 | Table I.Top 10 pathways associated with
upregulated and downregulated DEGs in astrocytoma expression
profiles. |
Table I.
Top 10 pathways associated with
upregulated and downregulated DEGs in astrocytoma expression
profiles.
| Term | DEGs | P-value |
|---|
| Upregulated
pathways |
|
|
| hsa04080:
Neuroactive ligand-receptor interaction | 29 |
1.57×10⁻⁹ |
|
hsa04020:Calcium signaling
pathway | 22 |
4.84×10⁻⁸ |
|
hsa04010:MAPK signaling
pathway | 22 |
4.43×10⁻⁵ |
|
hsa04540:Gap junction | 12 |
6.55×10⁻⁵ |
|
hsa04360:Axon guidance | 14 |
1.23×10⁻⁴ |
|
hsa04720:Long-term
potentiation | 10 |
1.81×10⁻⁴ |
|
hsa04012:ErbB signaling
pathway | 11 |
2.61×10⁻⁴ |
|
hsa04730:Long-term
depression | 8 |
4.56×10⁻³ |
|
hsa05014:Amyotrophic lateral
sclerosis | 6 |
2.13×10⁻² |
|
hsa04666:FcγR-mediated
phagocytosis | 8 |
2.43×10⁻² |
| Downregulated
pathways |
|
|
|
hsa04514:Cell adhesion
molecules | 9 |
1.28×10⁻³ |
|
hsa05222:Small cell lung
cancer | 7 |
2.32×10⁻³ |
|
hsa04610:Complement and
coagulation cascades | 6 |
5.09×10⁻³ |
|
hsa04672:Intestinal immune
network for IgA production | 5 |
8.01×10⁻³ |
|
hsa04310:Wnt signaling
pathway | 8 |
1.11×10⁻² |
|
hsa05216:Thyroid cancer | 4 |
1.13×10⁻² |
|
hsa05310:Asthma | 4 |
1.13×10⁻² |
|
hsa05217:Basal cell
carcinoma | 5 |
1.20×10⁻² |
|
hsa05020:Prion diseases | 4 |
1.89×10⁻² |
|
hsa05330:Allograft
rejection | 4 |
2.03×10⁻² |
Glioblastoma
There were 1,520 DEGs, including 969 upregulated and
551 downregulated DEGs, between non-tumor and glioblastoma
expression profiles. Upregulated DEGs were enriched in KEGG
pathways including ‘calcium signaling pathway’, ‘long-term
potentiation’, ‘neuroactive ligand-receptor interaction’, ‘MAPK
signaling pathway’ and ‘axon guidance’, whereas downregulated DEGs
were associated with the pathways of ‘cell cycle’, ‘ECM-receptor
interaction’, ‘complement and coagulation cascades’, ‘focal
adhesion’ and ‘p53 signaling pathway’ (Table II).
| Table II.Top 10 pathways associated with up-
and downregulated DEGs in glioblastoma expression profiles. |
Table II.
Top 10 pathways associated with up-
and downregulated DEGs in glioblastoma expression profiles.
| Term | DEG | P-value | Genes |
|---|
| Upregulated |
|
|
|
|
hsa04020:Calcium signaling
pathway | 30 |
1.25×10⁻⁹ | DRD1, CAMK2G,
PPP3R1, ITPKA, ATP2B1, ATP2B2, PDE1A, PPP3CB, CAMK2B, PPP3CA,
PRKACB, CAMK2A, SLC8A2, SLC25A4, GRIN1, GRIN2A, PRKCG, ITPR1,
PRKCB, GRM5, GNAL, CAMK4, CHRM3, CHRM1, RYR1, RYR2, CACNA1E, HTR2C,
HTR2A, CACNA1B |
|
hsa04720:Long-term
potentiation | 18 |
6.56×10⁻⁹ | MAP2K1, CAMK2G,
GRIN1, GRIN2A, PPP3R1, PRKCG, ITPR1, PRKCB, GRM5, CAMK4, GRIA2,
GRIA1, PPP1R1A, PPP3CB, CAMK2B, PRKACB, PPP3CA, CAMK2A |
|
hsa04080:Neuroactive
ligand-receptor interaction | 34 |
5.04×10⁻⁸ | GPR83, DRD1,
THRB, GABRB3, GABRB2, GABRB1, OPRK1, GABBR2, LPAR1, VIPR1, PRSS3,
ADRA2A, GABRG1, GABRD, GABRG2, GABRA2, GLRB, GABRA1, GABRA4, RXFP1,
GABRA5, GRIN1, GRIN2A, NPY1R, NTSR2, GRM5, GRM3, CHRM3, GRIA2,
SSTR1, GRIA1, CHRM1, HTR2C, HTR2A |
|
hsa04010:MAPK signaling
pathway | 33 |
4.55×10⁻⁷ | MEF2C, FGF9,
PPP3R1, FGF13, CACNB3, FGF12, ACVR1C, CDC42, BDNF, HSPA2, RASGRP1,
PPP3CB, PPP3CA, PRKACB, PAK1, CACNA2D1, MAP2K1, NLK, PTPN5, MAP2K4,
PTPRR, PRKCG, CACNG3, CACNG2, MAPK10, CACNA2D3, PRKCB, RASGRF2,
ARRB1, MAPK8IP2, MAPK9, CACNA1E, CACNA1B |
|
hsa04730:Long-term
depression | 14 |
1.26×10⁻⁵ | GNAZ, GNAO1,
MAP2K1, GNAI1, PRKCG, ITPR1, PRKCB, GRM5, GRIA2, GRIA1, RYR1, CRH,
GUCY1A3, GUCY1B3 |
|
hsa04360:Axon guidance | 18 |
8.09×10⁻⁵ | NGEF, GNAI1,
NTN4, PPP3R1, L1CAM, SLIT2, PAK6, CDC42, PAK7, EPHB6, RND1, UNC5A,
PAK3, PPP3CB, UNC5D, SEMA4D, PAK1, PPP3CA |
|
hsa05014:Amyotrophic lateral
sclerosis | 11 |
1.28×10⁻⁴ | SLC1A2, GRIA2,
GRIA1, GRIN1, PPP3CB, PPP3R1, GRIN2A, NEFH, PPP3CA, NEFL,
NEFM |
|
hsa04012:ErbB signaling
pathway | 14 |
1.59×10⁻⁴ | NRG3, MAP2K1,
CAMK2G, MAP2K4, PRKCG, MAPK10, PRKCB, PAK6, PAK7, PAK3, MAPK9,
CAMK2B, PAK1, CAMK2A |
|
hsa04540:Gap junction | 14 |
2.01×10⁻⁴ | DRD1, MAP2K1,
GNAI1, PRKCG, LPAR1, ITPR1, PRKCB, GRM5, GUCY1A3, TUBA4A, GUCY1B3,
PRKACB, HTR2C, HTR2A |
|
hsa04310:Wnt signaling
pathway | 16 |
4.05×10⁻³ | NLK, CAMK2G,
PPP3R1, PRKCG, MAPK10, DAAM2, PRKCB, SFRP2, PRICKLE2, PPP3CB,
MAPK9, WIF1, CAMK2B, PRKACB, PPP3CA, CAMK2A |
| Downregulated |
|
|
|
|
hsa04110: Cell cycle | 22 |
8.93×10⁻⁹ | CDK1, DBF4,
TP53, TTK, CDC20, MCM2, PTTG1, CDK4, MCM3, MCM5, WEE1, TGFB2,
CCNB1, MCM7, MAD2L1, CCND2, CDKN2C, PCNA, BUB1B, CCNA2, GADD45A,
MYC |
|
hsa04512: ECM-receptor
interaction | 16 |
5.84×10⁻⁷ | IBSP, COL4A2,
COL4A1, TNC, COL3A1, COL5A2, LAMB2, CD44, ITGA7, COL6A3, COL1A2,
COL6A2, LAMC1, COL1A1, LAMB1, FN1 |
|
hsa04610:Complement and
coagulation cascades | 14 |
1.80×10⁻⁶ | PLAT, C5AR1, C3,
SERPING1, C1R, C1S, C1QC, C1QA, C1QB, SERPINE1, CFI, PROS1, PLAU,
F2R |
|
hsa04510:Focal adhesion | 23 |
8.48×10⁻⁶ | EGFR, IBSP,
CAV1, COL4A2, COL4A1, TNC, COL3A1, COL5A2, FLNA, LAMB2, CCND2,
VEGFA, ITGA7, COL6A3, COL1A2, COL6A2, SHC1, PDGFC, COL1A1, LAMC1,
ZYX, LAMB1, FN1 |
|
hsa04115:p53 signaling
pathway | 11 |
2.58×10⁻⁴ | STEAP3, CCNB1,
CDK1, TP53I3, CCND2, RRM2, SERPINE1, TP53, CDK4, IGFBP3,
GADD45A |
|
hsa04612:Antigen processing
and presentation | 11 |
1.30×10⁻³ | TAP1, HLA-A,
HSPA6, IFI30, HLA-C, HLA-DPA1, HLA-B, HLA-DMA, RFXANK, HLA-G,
HLA-DRA, HLA-F |
|
hsa05330:Allograft
rejection | 7 |
2.37×10⁻³ | HLA-A, HLA-C,
HLA-DPA1, HLA-B, HLA-DMA, HLA-G, HLA-DRA, HLA-F |
|
hsa03030:DNA replication | 7 |
2.37×10⁻³ | MCM7, RFC4,
PCNA, MCM2, MCM3, RNASEH2A, MCM5 |
|
hsa05332:Graft-versus-host
disease | 7 |
3.60×10⁻³ | HLA-A, HLA-C,
HLA-DPA1, HLA-B, HLA-DMA, HLA-G, HLA-DRA, HLA-F |
|
hsa04940:Type I diabetes
mellitus | 7 |
5.25×10⁻³ | HLA-A, HLA-C,
HLA-DPA1, HLA-B, HLA-DMA, HLA-G, HLA-DRA, HLA-F |
Oligodendroglioma
Compared with the non-tumor expression profiles, a
total of 795 DEGs, including 619 upregulated and 176 downregulated
DEGs, were screened from the astrocytoma expression profile data.
The upregulated DEGs were enriched in ‘neuroactive ligand-receptor
interaction’, ‘calcium signaling pathway’, ‘axon guidance’ and ‘gap
junction’, whereas downregulated DEGs were enriched in ‘TGF-β
signaling pathway’, ‘p53 signaling pathway’ and ‘Wnt signaling
pathway’ (Table III).
| Table III.Top 10 pathways of up- and
downregulated DEGs in oligodendroglioma expression profiles. |
Table III.
Top 10 pathways of up- and
downregulated DEGs in oligodendroglioma expression profiles.
| Term | DEGs | P-value | Genes |
|---|
| Upregulated |
|
|
|
|
hsa04080:Neuroactive
ligand-receptor interaction | 27 |
4.15×10⁻⁸ | GPR83, DRD1,
THRB, GABRB2, GABRB1, GABBR2, LPAR1, VIPR1, KISS1R, PRSS3, GABRG1,
GABRD, GABRG2, GABRA2, GLRB, GABRA1, GABRA4, RXFP1, GRIN1, GABRA5,
GRIN2A, NPY1R, GRM3, CHRM3, CHRM1, HTR2C, HTR2A |
|
hsa04020:Calcium signaling
pathway | 20 |
1.32×10⁻⁶ | DRD1, SLC8A2,
GRIN1, GRIN2A, PPP3R1, PRKCG, ITPKA, ITPR1, PRKCB, ATP2B1, CHRM3,
RYR3, CHRM1, PDE1A, RYR2, CAMK2B, HTR2C, CAMK2A, HTR2A,
CACNA1B |
|
hsa04540:Gap junction | 12 |
7.37×10⁻⁵ | DRD1, MAP2K1,
GNAI1, TUBB2A, TUBA4A, GUCY1B3, PRKCG, LPAR1, HTR2C, ITPR1, PRKCB,
HTR2A |
|
hsa04360:Axon guidance | 14 |
1.40×10⁻⁴ | NGEF, GNAI1,
PPP3R1, SLIT2, PAK6, CDC42, EPHA4, PAK7, EPHB6, PAK3, SEMA3E,
UNC5D, PAK1, SEMA4D |
|
hsa04720:Long-term
potentiation | 9 |
1.02×10⁻³ | MAP2K1, GRIN1,
PPP3R1, GRIN2A, PRKCG, CAMK2B, CAMK2A, ITPR1, PRKCB |
|
hsa04010:MAPK signaling
pathway | 19 |
1.23×10⁻³ | MEF2C, MAP2K1,
PTPN5, MAP2K4, PPP3R1, PTPRR, FGF13, PRKCG, CACNG3, CACNB3,
CACNA2D3, ACVR1C, PRKCB, CDC42, BDNF, HSPA2, RASGRF2, PAK1,
CACNA1B |
|
hsa04012:ErbB signaling
pathway | 10 |
1.27×10⁻³ | PAK6, PAK7,
MAP2K1, PAK3, MAP2K4, PRKCG, CAMK2B, PAK1, CAMK2A, PRKCB |
|
hsa04666:FcγR-mediated
phagocytosis | 10 |
2.35×10⁻³ | CDC42, MAP2K1,
PPAP2C, WASF1, PRKCG, PAK1, PRKCD, DNM1, PRKCB, AMPH |
|
hsa05014:Amyotrophic lateral
sclerosis | 6 |
2.24×10⁻² | GRIN1, PPP3R1,
GRIN2A, NEFH, NEFL, NEFM |
|
hsa04912:GnRH signaling
pathway | 8 |
3.01×10⁻² | CDC42, MAP2K1,
MAP2K4, CAMK2B, CAMK2A, PRKCD, ITPR1, PRKCB |
| Downregulated |
|
|
|
|
hsa04350:TGF-beta signaling
pathway | 8 |
3.11×10⁻⁵ | AMH, NOG, BMP2,
ID1, SMAD5, ID4, ID3, MYC |
|
hsa04115:p53 signaling
pathway | 6 |
7.02×10⁻⁴ | BID, CCND1,
RRM2, GADD45G, TP53, CDK4 |
|
hsa05216:Thyroid cancer | 4 |
3.40×10⁻³ | CCND1, TP53,
MYC, TCF7L1 |
|
hsa04310:Wnt signaling
pathway | 7 |
4.94×10⁻³ | CCND1, VANGL2,
TP53, MYC, TCF7L1, PRKX, FZD7 |
|
hsa05219:Bladder cancer | 4 |
9.70×10⁻³ | CCND1, TP53,
CDK4, MYC |
|
hsa04110:Cell cycle | 6 |
1.00×10⁻² | CCND1, MCM7,
GADD45G, TP53, CDK4, MYC |
|
hsa05210:Colorectal
cancer | 5 |
1.17×10⁻² | CCND1, TP53,
MYC, TCF7L1, FZD7 |
|
hsa05213:Endometrial
cancer | 4 |
1.73×10⁻² | CCND1, TP53,
MYC, TCF7L1 |
|
hsa05217:Basal cell
carcinoma | 4 |
2.01×10⁻² | BMP2, TP53,
TCF7L1, FZD7 |
|
hsa05212:Pancreatic
cancer | 4 |
4.04×10⁻² | CCND1, ARHGEF6,
TP53, CDK4 |
PPI network construction and module
analysis
Astrocytoma
With the threshold of combined score >0.4, a PPI
network for astrocytoma was constructed with 1,617 pairs. Once
nodes with a degree <2 were removed, a PPI network for
astrocytoma with 506 nodes and 1,590 edges was obtained. In this
network, the hub nodes with a degree score >25 were SPY,
tumor protein p53 (TP53), brain-derived neurotrophic factor
(BDNF), NPY, SST, TAC1 and SYT1.
Module analysis was subsequently performed for this PPI network.
Modules A-C were screened, with P=2.065×10⁻⁸,
P=3.418×10⁻⁷ and P=7.808×10⁻⁴, respectively.
Module A included 24 nodes and 126 edges; module B included 21
nodes and 120 edges; module C included 10 nodes and 31 edges
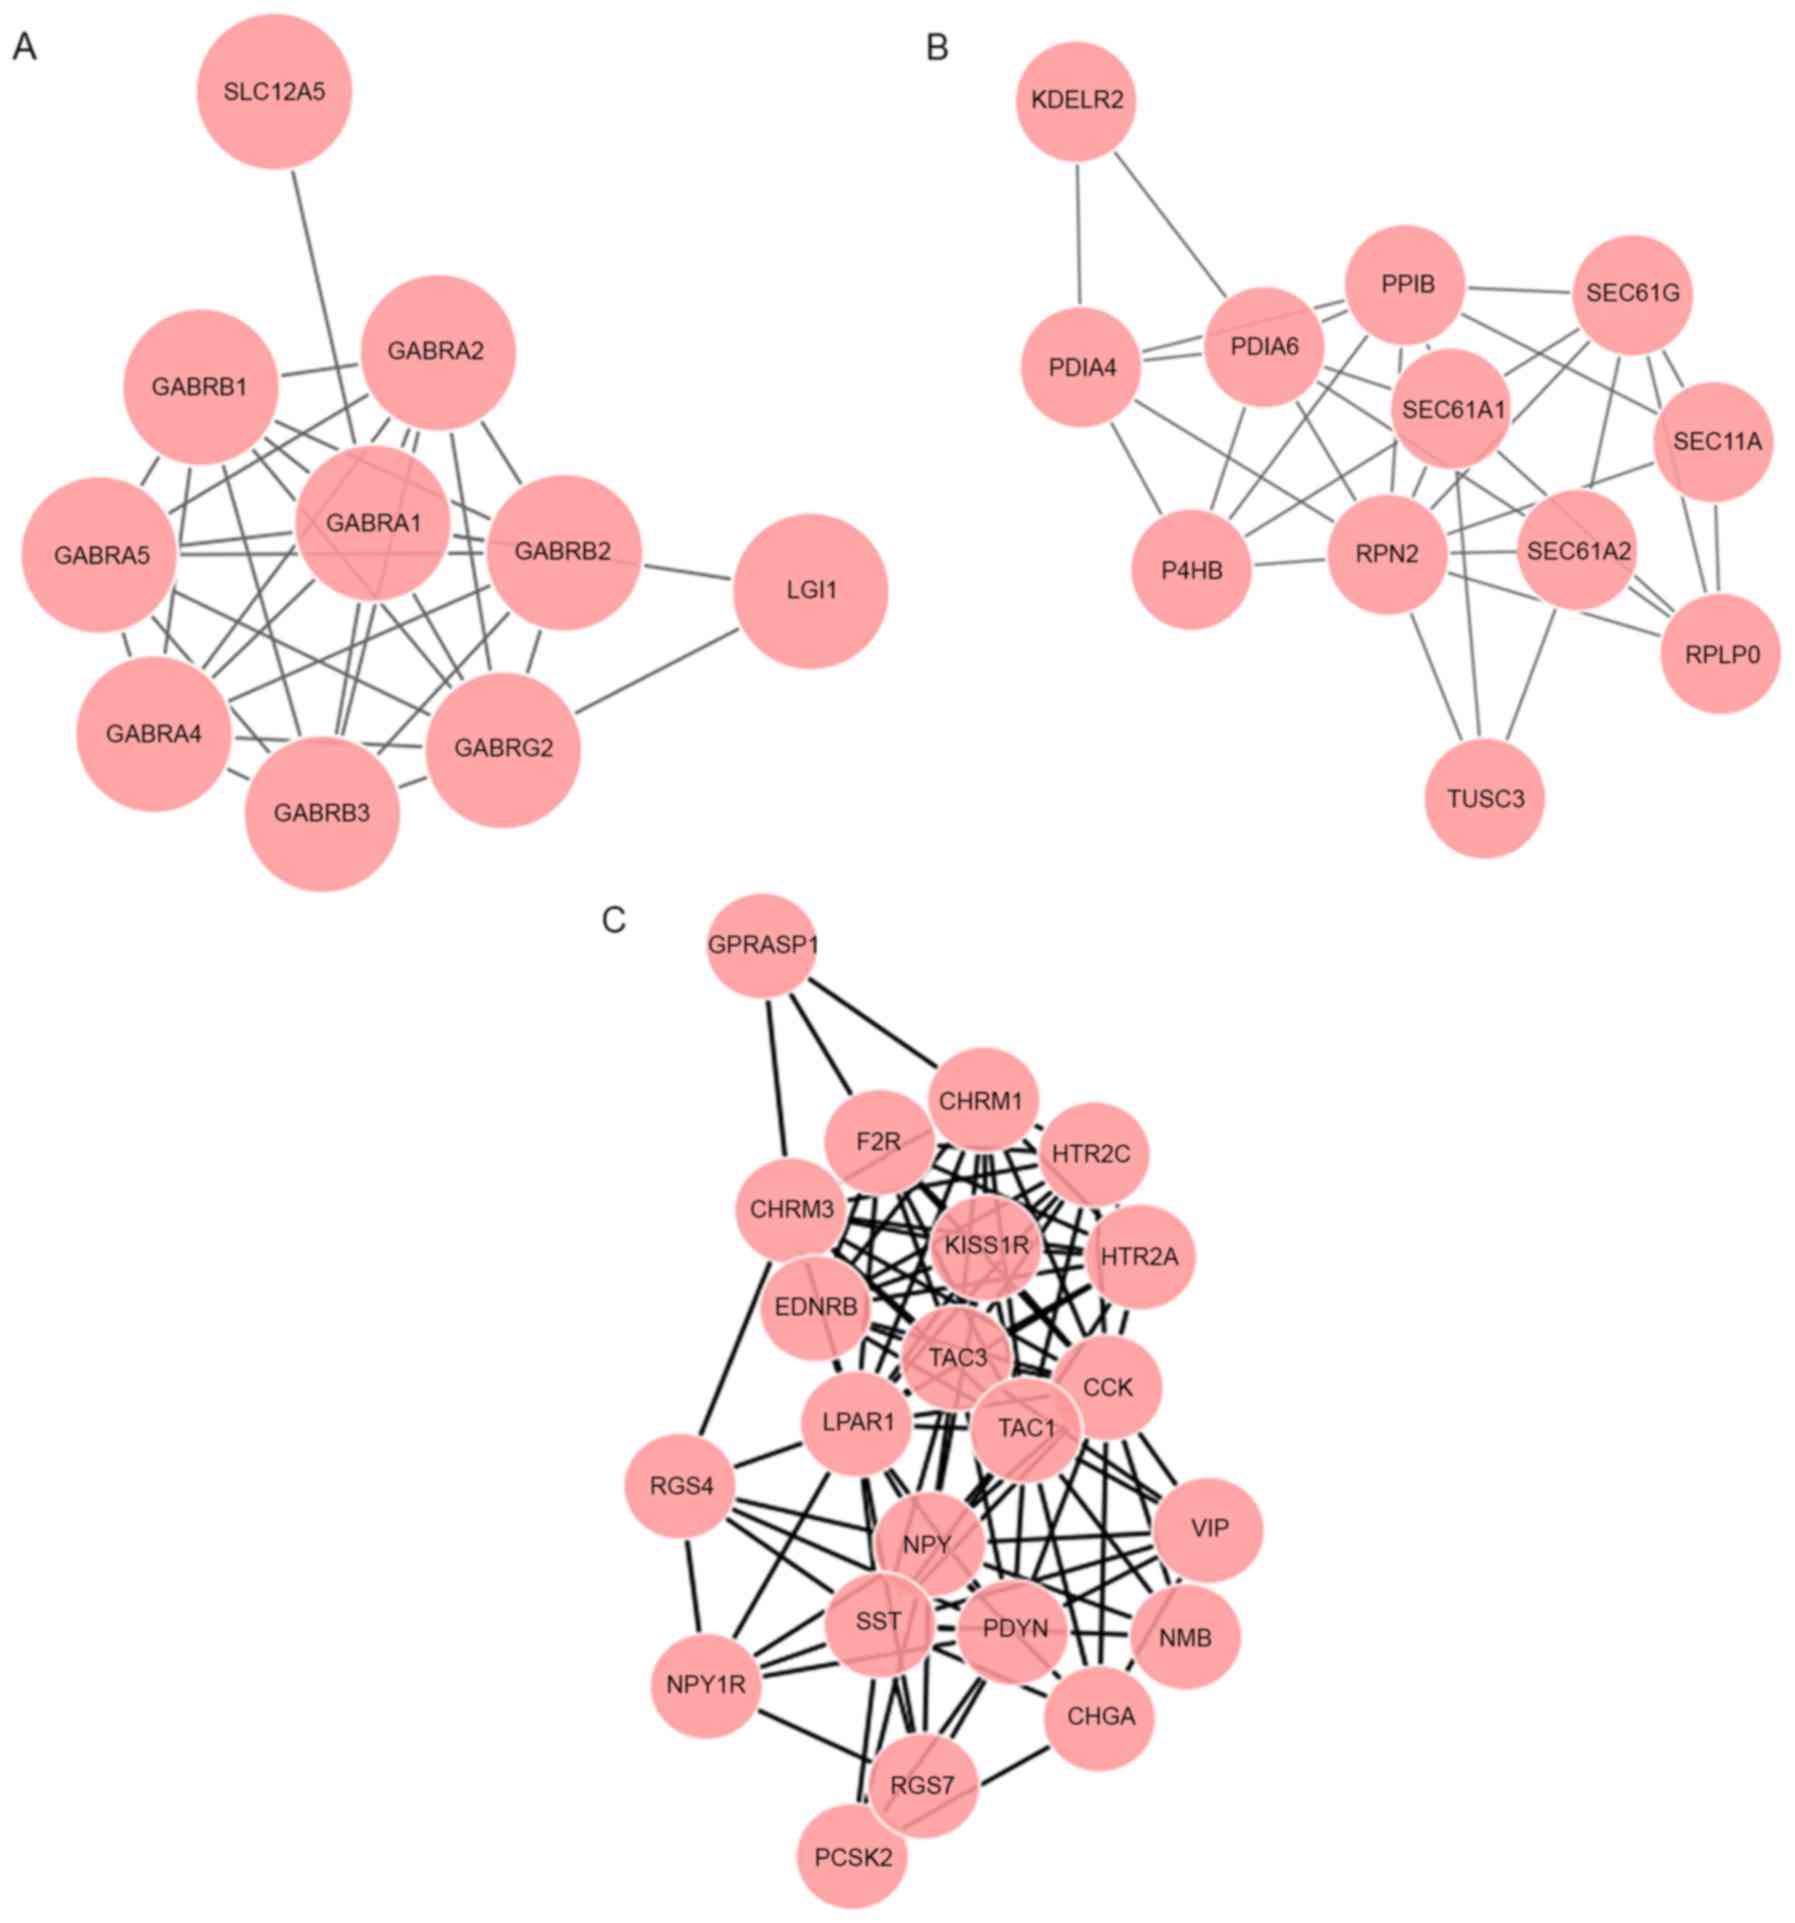
(Fig. 1A). On the basis of the
analysis of modules A-C, 8 genes in these modules were enriched in
the ‘neuroactive ligand-receptor interaction’ pathway.
Glioblastoma
A total of 7,027 pairs were identified in the PPI
network for glioblastoma. Once nodes with a degree <2 were
removed, a PPI network with 1,064 nodes and 7,003 edges was
obtained. Hub nodes with a degree score >90 were
cyclin-dependent kinase 1 (CDK1), PCNA, TP53,
KNTC1 and CCNB1. A total of 4 modules were screened
with P<0.05; modules D-G were screened with P<0.001. Module D
included 27 nodes and 178 edges, module E included 27 nodes and 176
edges, module F included 12 nodes and 33 edges (Fig. 1B), and module G included 7 nodes and
11 edges. Genes in modules D-F were enriched in the ‘protein
processing in endoplasmic reticulum’ pathway
(P=1.13×10⁻¹⁶).
Oligodendroglioma
A total of 1,172 pairs were identified in the PPI
network for oligodendroglioma. Once nodes with a degree <2 were
removed, a PPI network with 419 nodes and 1,040 edges was obtained.
SPY, TP53, BDNF, CDC42, SYN1,
TAC1, NPY, SYT1, SNAP25, MCM7
and ENO2 were identified as hub nodes, with a degree score
>20. With the threshold of P<0.05, only module H was
screened. Module H was associated with P<0.001. Module H
contained 22 nodes and 108 edges (Fig.
1C). The genes in module H were associated with the pathways of
‘neuroactive ligand-receptor interaction’ (P=3.20×10⁻¹⁴)
and ‘calcium signaling pathway’ (P=7.75×10⁻¹⁰).
DEGs comparison of different
subtype
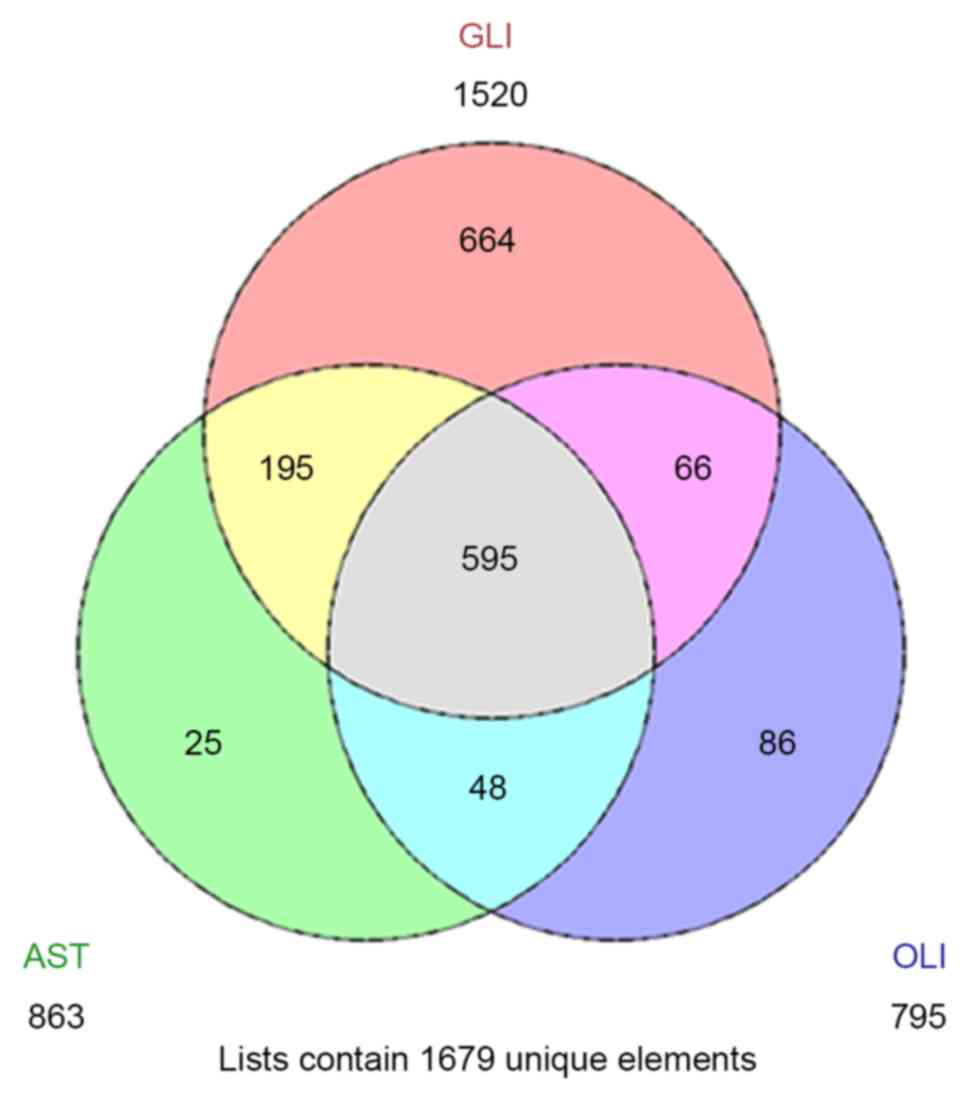
As included in Table
IV, a total of 595 common DEGs were obtained across all three
subtypes of glioma (Fig. 2). The
pathways enriched with these genes were associated with neural
signaling. Furthermore, glioblastoma is a subtype of astrocytoma;
there were 195 common DEGs between the glioblastoma and astrocytoma
datasets that were not also associated with oligodendroglioma,
which were enriched for immune function-associated pathways. The
unique DEGs from astrocytoma, glioblastoma and oligodendroglioma
were generally associated with the development of the nervous
system, the cell cycle and cell matrix components, respectively
(Table IV).
| Table IV.GO term enrichment analysis of unique
DEGs in three types of glioma. |
Table IV.
GO term enrichment analysis of unique
DEGs in three types of glioma.
| A, Astrocytoma
(enrichment score, 2) |
|---|
|
|---|
| GO category | GO term | DEGs | P-value |
|---|
| BP |
GO:0050767:Regulation of neurogenesis | 3 |
7.66×10⁻³ |
| BP |
GO:0051960:Regulation of nervous system
development | 3 |
1.01×10⁻² |
| BP |
GO:0060284:Regulation of cell
development | 3 |
1.15×10⁻² |
| BP | GO:0045596:Negative
regulation of cell differentiation | 3 |
1.27×10⁻² |
|
| B, Glioblastoma
(enrichment score, 7) |
|
| GO
category | GO term | DEGs | P-value |
|
| BP | GO:0022403:Cell
cycle phase | 44 |
4.80×10⁻¹⁰ |
| BP | GO:0000278:Mitotic
cell cycle | 40 |
2.09×10⁻⁹ |
| BP | GO:0022402:Cell
cycle process | 50 |
1.26×10⁻⁸ |
| BP | GO:0000280:Nuclear
division | 27 |
1.14×10⁻⁷ |
| BP |
GO:0007067:Mitosis | 27 |
1.14×10⁻⁷ |
| CC |
GO:0005819:Spindle | 22 |
1.29×10⁻⁷ |
| BP | GO:0000087:M phase
of mitotic cell cycle | 27 |
1.64×10⁻⁷ |
| BP |
GO:0048285:Organelle fission | 27 |
2.54×10⁻⁷ |
| BP | GO:0007049:Cell
cycle | 58 |
2.63×10⁻⁷ |
| BP | GO:0051301:Cell
division | 31 |
3.48×10⁻⁷ |
| BP | GO:0000279:M
phase | 33 |
3.88×10⁻⁷ |
| CC |
GO:0015630:Microtubule cytoskeleton | 38 |
3.98×10⁻⁴ |
|
| C,
Oligodendroglioma (enrichment score, 2) |
|
| GO
category | GO term | DEGs | P-value |
|
| CC |
GO:0044421:Extracellular region part | 12 |
1.40×10⁻³ |
| CC |
GO:0005576:Extracellular region | 16 |
1.19×10⁻² |
| CC |
GO:0005615:Extracellular space | 8 |
2.02×10⁻² |
Discussion
In order to screen for potential therapeutic targets
in different glioma subtypes, the GSE4290 profile was downloaded
from the GEO for a bioinformatics analysis of the associated
molecular mechanisms. In the present study, a total of 595 common
DEGs were identified between the three glioma subtypes. The
pathways enriched by these genes were associated with neural
signaling. There were also a number of unique DEGs and pathways
specifically associated with different subtypes.
TP53 was screened as an overlapped DEG
between the three glioma subtypes. Additionally, it was enriched in
various pathways including the Wnt signaling pathway and the p53
signaling pathway. TP53 is a critical target in the
regulation of malignant progenitor cell renewal, differentiation
and tumorigenic potential (20). In
addition, cellular pathways involving TP53 are frequently
dysregulated in glioma tumors (21).
Dickkopf-1 was previously demonstrated to be an inhibitor of the
Wnt signaling pathway by inducing TP53 tumor suppression
(22). Dysregulation of the
TP53 pathway was also necessary for human astrocytoma by
regulating the G1-S transition (23).
Therefore, alterations to TP53 expression are critical in
glioma via the Wnt and p53 signaling pathways.
Compared with non-tumor expression profiles, notable
genes, including BDNF, were screened from the astrocytoma
expression profiles, which were enriched in the KEGG pathways of
‘cell adhesion molecules’, ‘complement and coagulation cascades’
and ‘Wnt signaling pathway’. BDNF, a member of the nerve
growth factor family, is necessary for the survival of striatal
neurons in the brain; in human glioma, the expression of
BDNF was previously demonstrated to be upregulated and
closely associated with pathological grading (24). In addition, Xiong et al
(25) identified that mature
BDNF could promote the growth of glioma cells in
vitro. The expression of BDNF was confirmed to be
regulated by the Wnt signaling pathway (25). Therefore, BDNF may be a
therapeutic target in astrocytoma.
CDK1 was a hub node of the PPI network for
glioblastoma expression profiles. Chen et al (26) identified that the overexpression of
CDK1 may have promoted the oncogenesis and progression of
glioma, whereas the downregulation of CDK1 inhibited
proliferation. Combined with cyclin B1, CDK1 forms a complex that
induces the G2-M transition in malignant glioma cells (27). In the present study, CDK1 was
associated with the KEGG pathways ‘cell cycle’ and ‘p53 signaling
pathway’. For the treatment of human glioblastoma cells, inducing
G1 cell cycle arrest, as may be mediated by the p53 pathway, is an
effective strategy for suppressing tumorigenicity (28). CDK1 may thus be associated with
the mechanisms of glioblastoma by affecting the cell cycle and the
p53 signaling pathway.
In the present study, pathways enriched by DEGs
common between the three types of glioma were associated with
neural signaling. The unique genes of astrocytoma and
oligodendroglioma were enriched in immune- and cell matrix
component-associated pathways, respectively. The simultaneous
activation of the Ras and Akt pathways has been demonstrated to
induce glioblastoma development in mice (29). Alterations to the immune system were
previously observed to be the primary etiology of adult glioma,
particularly in the brain (30). In
the process of tumor invasion, extracellular matrix proteins,
including fibronectin, may also serve an important function in
intracerebral invasion (31).
In conclusion, the screened DEG TP53 is
likely to be critical for glioma development, including via the Wnt
and p53 signaling pathways. BDNF and CDK1 were also
possibly important in the mechanism of glioma development, and were
associated with the cell cycle and p53 signaling pathways. Immune
system-associated and cell matrix component pathways may be unique
signaling pathways associated with astrocytoma and
oligodendroglioma, respectively. However, further experiments are
required to confirm the results of the present study.
References
|
1
|
Hori M, Fukunaga I, Masutani Y, Taoka T,
Kamagata K, Suzuki Y and Aoki S: Visualizing non-Gaussian
diffusion: Clinical application of q-space imaging and diffusional
kurtosis imaging of the brain and spine. Magn Reson Med Sci.
11:221–233. 2012. View Article : Google Scholar : PubMed/NCBI
|
|
2
|
Chan AS, Leung SY, Wong MP, Yuen ST,
Cheung N, Fan YW and Chung LP: Expression of vascular endothelial
growth factor and its receptors in the anaplastic progression of
astrocytoma, oligodendroglioma, and ependymoma. Am J Surg Pathol.
22:816–826. 1998. View Article : Google Scholar : PubMed/NCBI
|
|
3
|
Pickuth D and Heywang-Köbrunner SH:
Neurosarcoidosis: Evaluation with MRI. J Neuroradiol. 27:185–188.
2000.PubMed/NCBI
|
|
4
|
Stupp R, Mason WP, van den Bent MJ, Weller
M, Fisher B, Taphoorn MJ, Belanger K, Brandes AA, Marosi C, Bogdahn
U, et al: Radiotherapy plus concomitant and adjuvant temozolomide
for glioblastoma. N Engl J Med. 352:987–996. 2005. View Article : Google Scholar : PubMed/NCBI
|
|
5
|
Bruna A, Darken RS, Rojo F, Ocaña A,
Peñuelas S, Arias A, Paris R, Tortosa A, Mora J, Baselga J and
Seoane J: High TGFbeta-Smad activity confers poor prognosis in
glioma patients and promotes cell proliferation depending on the
methylation of the PDGF-B gene. Cancer Cell. 11:147–160. 2007.
View Article : Google Scholar : PubMed/NCBI
|
|
6
|
Wrensch M, Kelsey KT, Liu M, Miike R,
Moghadassi M, Sison JD, Aldape K, McMillan A, Wiemels J and Wiencke
JK: ERCC1 and ERCC2 polymorphisms and adult glioma. Neuro Oncol.
7:495–507. 2005. View Article : Google Scholar : PubMed/NCBI
|
|
7
|
Gurung RL, Lim SN, Khaw AK, Soon JF,
Shenoy K, Mohamed Ali S, Jayapal M, Sethu S, Baskar R and Hande MP:
Thymoquinone induces telomere shortening, DNA damage and apoptosis
in human glioblastoma cells. PLoS One. 5:e121242010. View Article : Google Scholar : PubMed/NCBI
|
|
8
|
Zhang W, Zhang J, Hoadley K, Kushwaha D,
Ramakrishnan V, Li S, Kang C, You Y, Jiang C, Song SW, et al:
miR-181d: A predictive glioblastoma biomarker that downregulates
MGMT expression. Neuro Oncol. 14:712–719. 2012. View Article : Google Scholar : PubMed/NCBI
|
|
9
|
Sun L, Hui AM, Su Q, Vortmeyer A,
Kotliarov Y, Pastorino S, Passaniti A, Menon J, Walling J, Bailey
R, et al: Neuronal and glioma-derived stem cell factor induces
angiogenesis within the brain. Cancer Cell. 9:287–300. 2006.
View Article : Google Scholar : PubMed/NCBI
|
|
10
|
Wei B, Wang L, Du C, Hu G, Wang L, Jin Y
and Kong D: Identification of differentially expressed genes
regulated by transcription factors in glioblastomas by
bioinformatics analysis. Mol Med Rep. 11:2548–2554. 2015.
View Article : Google Scholar : PubMed/NCBI
|
|
11
|
Bohonak AJ and van der Linde K: RMA:
Software for reduced major axis regression, Java version.
2004.http://www.kimvdlinde.com/professional/rma.html
|
|
12
|
Gautier L, Cope L, Bolstad BM and Irizarry
RA: Affy-analysis of Affymetrix GeneChip data at the probe level.
Bioinformatics. 20:307–315. 2004. View Article : Google Scholar : PubMed/NCBI
|
|
13
|
Ritchie ME, Phipson B, Wu D, Hu Y, Law CW,
Shi W and Smyth GK: Limma powers differential expression analyses
for RNA-sequencing and microarray studies. Nucleic Acids Res.
43:e472015. View Article : Google Scholar : PubMed/NCBI
|
|
14
|
Ashburner M, Ball CA, Blake JA, Botstein
D, Butler H, Cherry JM, Davis AP, Dolinski K, Dwight SS, Eppig JT,
et al: Gene Ontology: Tool for the unification of biology. The gene
ontology consortium. Nat Genet. 25:25–29. 2000. View Article : Google Scholar : PubMed/NCBI
|
|
15
|
Dennis G Jr, Sherman BT, Hosack DA, Yang
J, Gao W, Lane HC and Lempicki RA: DAVID: Database for annotation,
visualization, and integrated discovery. Genome Biol. 4:P32003.
View Article : Google Scholar : PubMed/NCBI
|
|
16
|
Szklarczyk D, Franceschini A, Wyder S,
Forslund K, Heller D, Huerta-Cepas J, Simonovic M, Roth A, Santos
A, Tsafou KP, et al: STRING v10: Protein-protein interaction
networks, integrated over the tree of life. Nucleic Acids Res.
43(Database issue): D447–D452. 2015. View Article : Google Scholar : PubMed/NCBI
|
|
17
|
Shannon P, Markiel A, Ozier O, Baliga NS,
Wang JT, Ramage D, Amin N, Schwikowski B and Ideker T: Cytoscape: A
software environment for integrated models of biomolecular
interaction networks. Genome Res. 13:2498–2504. 2003. View Article : Google Scholar : PubMed/NCBI
|
|
18
|
Nepusz T, Yu H and Paccanaro A: Detecting
overlapping protein complexes in protein-protein interaction
networks. Nat Methods. 9:471–472. 2012. View Article : Google Scholar : PubMed/NCBI
|
|
19
|
Pirooznia M, Nagarajan V and Deng Y:
GeneVenn-A web application for comparing gene lists using Venn
diagrams. Bioinformation. 1:420–422. 2007. View Article : Google Scholar : PubMed/NCBI
|
|
20
|
Zheng H, Ying H, Yan H, Kimmelman AC,
Hiller DJ, Chen AJ, Perry SR, Tonon G, Chu GC, Ding Z, et al: p53
and Pten control neural and glioma stem/progenitor cell renewal and
differentiation. Nature. 455:1129–1133. 2008. View Article : Google Scholar : PubMed/NCBI
|
|
21
|
Ishii N, Maier D, Merlo A, Tada M,
Sawamura Y, Diserens AC and Van Meir EG: Frequent co-alterations of
TP53, p16/CDKN2A, p14ARF, PTEN tumor suppressor genes in
human glioma cell lines. Brain Pathol. 9:469–479. 1999. View Article : Google Scholar : PubMed/NCBI
|
|
22
|
Wang J, Shou J and Chen X: Dickkopf-1, an
inhibitor of the Wnt signaling pathway, is induced by p53.
Oncogene. 19:1843–1848. 2000. View Article : Google Scholar : PubMed/NCBI
|
|
23
|
Ichimura K, Bolin MB, Goike HM, Schmidt
EE, Moshref A and Collins VP: Deregulation of the
p14ARF/MDM2/p53 pathway is a prerequisite for human
astrocytic gliomas with G1-S transition control gene abnormalities.
Cancer Res. 60:417–424. 2000.PubMed/NCBI
|
|
24
|
Yan Q, Yu HL and Li JT: Study on the
expression of BDNF in human gliomas. Sichuan Da Xue Xue Bao Yi Xue
Ban. 40:415–417. 2009.(In Chinese). PubMed/NCBI
|
|
25
|
Xiong J, Zhou L, Lim Y, Yang M, Zhu YH, Li
ZW, Zhou FH, Xiao ZC and Zhou XF: Mature BDNF promotes the growth
of glioma cells in vitro. Oncol Rep. 30:2719–2724. 2013. View Article : Google Scholar : PubMed/NCBI
|
|
26
|
Chen H, Huang Q, Zhai DZ, Dong J, Wang AD
and Lan Q: CDK1 expression and effects of CDK1 silencing on the
malignant phenotype of glioma cells. Zhonghua Zhong Liu Za Zhi.
29:484–488. 2007.(In Chinese). PubMed/NCBI
|
|
27
|
Liu WT, Chen C, Lu IC, Kuo SC, Lee KH,
Chen TL, Song TS, Lu YL, Gean PW and Hour MJ: MJ-66 induces
malignant glioma cells G2/M phase arrest and mitotic catastrophe
through regulation of cyclin B1/Cdk1 complex. Neuropharmacology.
86:219–227. 2014. View Article : Google Scholar : PubMed/NCBI
|
|
28
|
Medema RH, Kops GJ, Bos JL and Burgering
BM: AFX-like Forkhead transcription factors mediate cell-cycle
regulation by Ras and PKB through p27kip1. Nature.
404:782–787. 2000. View
Article : Google Scholar : PubMed/NCBI
|
|
29
|
Holland EC, Celestino J, Dai C, Schaefer
L, Sawaya RE and Fuller GN: Combined activation of Ras and Akt in
neural progenitors induces glioblastoma formation in mice. Nat
Genet. 25:55–57. 2000. View
Article : Google Scholar : PubMed/NCBI
|
|
30
|
Rajaraman P, Brenner AV, Butler MA, Wang
SS, Pfeiffer RM, Ruder AM, Linet MS, Yeager M, Wang Z, Orr N, et
al: Common variation in genes related to innate immunity and risk
of adult glioma. Cancer Epidemiol Biomarkers Prev. 18:1651–1658.
2009. View Article : Google Scholar : PubMed/NCBI
|
|
31
|
Enam SA, Rosenblum ML and Edvardsen K:
Role of extracellular matrix in tumor invasion: Migration of glioma
cells along fibronectin-positive mesenchymal cell processes.
Neurosurgery. 42:599–608. 1998. View Article : Google Scholar : PubMed/NCBI
|