Introduction
Among head and neck cancers, nasopharyngeal
carcinoma (NPC) has a distinct natural history, aetiology,
histopathology, and epidemiology. Male and female incidence of
approximately 3:1. Most patients diagnosed with NPC tend to present
with stage III or IV disease as a result of its deep location and
vague symptoms (1–3). Radiation therapy and chemoradiotherapy
are the primary methods of treatment (4), and are administered according to the
clinical stage (5), making early
diagnosis and staging crucial.
Dynamic contrast-enhanced magnetic resonance imaging
(DCE-MRI) has proven useful in characterization of tumour
microcirculation and microvascular density. It can delineate the
tumour margin from the surrounding tissues (6). DCE-MRI was proved useful in field of
differential diagnosis benign and malignant tumours, correlation
with tumour grade and stage, early prediction response, and outcome
to chemotherapy, radiotherapy and antiangiogenic therapy.
Diffusion-weighted imaging (DWI) can indirectly reflect the cell
density and microstructure of living tissue (7). Magnetic resonance imaging may be the
most powerful and versatile modality in the field of oncology for
staging, predicting of treatment response, and identifying disease
relapse, particularly in head and neck cancer (8–13).
Over-staging and under-staging are the drawbacks of both methods.
Various previous studies on bladder and breast cancer demonstrated
that the sensitivity and accuracy could be increased by using
DCE-MRI and DWI together (14,15). To
the best of our knowledge, no study has combined DCE-MRI and DWI
together in the diagnosis and staging of early NPC patients. The
purpose of the present study was to explore the feasibility and
value of DCE-MRI and DWI for early tumour staging in combination
using the volume transfer constant (Ktrans) with
DCE-MRI and the apparent diffusion coefficient (ADC) with DWI in
NPC patients.
Materials and methods
Clinical data
The study protocol was approved by the Regional
Committee for Medical and Health Research Ethics, and all patients
signed written informed consent. Forty-six newly diagnosed squamous
carcinoma NPC patients in our hospital from December 2014 and
October 2015 were included in the study. All underwent DCE-MRI and
DWI examinations of the nasopharynx and neck. Two patients were
excluded from the study due to a serious motion artefact on
pre-treatment MRI exams. Hence, analysis of MRI data was completed
on 44 patients (34 males and 10 females, age range, 18–68, mean
age, 48 years). All patients' TNM statuses were determined by
clinicians according to the International Union Against Cancer
(UICC) tumour node metastasis (TNM) staging system: 11 patients
were determined to be stage II, 18 were stage III, and 15 were
stage IV.
MRI protocols and procedures
In the present study, we used a 3.0 T whole-body
multi-channel phased array scanner system (TrioTim®;
Siemens Healthcare, Forchheim, Germany) and a standard head and
neck coil. T2-weighted images (T2WI) parameters: Spin-echo (SE)
technique: Repetition time 7600 ms, echo time 93 ms, field of view
(FOV) 220 mm, flip angle 90°. DWI were acquired in the axial plane
using a spin-echo single-shot echo-planar imaging sequence [TR/TE:
3000/83 ms, section thickness=5 mm, FOV=240 mm, number of signal
averages (NSA)=10] with six b-values of 50, 200, 400, 600, 800 and
1,000 sec/mm2. A set of ADC maps of 10 sections that
encompassed the primary tumour in each patient was generated for
data analysis.
DCE-MRI protocols
The DCE-MRI used a 3D-T1-fast field echo sequence
axial (T1WI-vibe-axial) scan. Pre-contrast T1WI (multi flip angle)
were acquired with these parameters: Flip angles=5°, 10° and 15°;
FOV=220 mm; section thickness=5 mm; TR/TE=3.42/1.25 ms; NSA: 1; 26
images per one time phase and one time phase per each flip angle.
After the pre-contrast scan, 25 phases of DCE-MRI images were
acquired with a 3D T1WI-vibe-axial protocol and the following
parameters: Flip angle=10° FOV=220 mm, section thickness=5 mm,
TR/TE=3.42/1.25 ms; time resolution=6.0 sec. Total scan time was
<4 min. Gd-DTPA-BMA was injected at the second time phase of the
DCE-MRI protocol with a bolus dose of 0.1 mmol/kg by antecubital
vein at a rate of 2.5 ml/sec by a power injector system, followed
by a 20-ml saline flush at a rate of 2.5 ml per second. The tumour
tissues were compared with the contralateral lateral pterygoid
muscle8.
MRI data analysis
DCE-MRI images were analysed with quantitative
analysis software (Omni Kinetics®; GE Healthcare,
Beijing, China). Multi flip angle data were uploaded in software
for T1 mapping analysis and DCE-MRI data were uploaded for
quantitatively permeability and perfusion analysis. Regions of
interest (ROIs) for arterial input function (AIF) were set by
placing a 3-mm circle over the intracranial internal carotid
artery, obtaining a time-concentration curve for permeability
quantitative analysis. Extended Tofts Linear two compartmental
model was used for permeability analysis, and the volume transfer
constant (Ktrans), the flux rate constant between
extravascular extracellular space and plasma
(Kep), and the volume of extravascular
extracellular space per unit volume of tissue
(Ve) of selected slices were calculated by the
model as well as the colour map of each parameter. ROIs were placed
on the maximum tumour area in the axial plane on the T2-weighted
fast spin (T2WI-FS) images to avoid necrosis, capsule and bleeding.
We placed 80 mm2-100 mm2 ROIs on the opposite
lateral pterygoid muscle and measured Ktrans,
Kep and Ve accordingly. We drew
the same ROIs on the Siemens workstation to obtain ADC values for
comparison with DCE-MRI. All measurements were taken three times
and averaged.
Statistical analysis
Data were analysed using commercial software (SPSS
16.0®; IBM, Armonk NY, USA). A P-value of <0.05 was
considered statistically significant. Experimental data are
presented as arithmetic mean ± standard deviation (SD). The
comparison of means used the independent sample t-test. The
correlation between Ktrans, Kep,
Ve, ADC and clinical staging were analysed by
Pearson rank correlation and linear correlation analysis. The
parameters during the period of different clinical were used
analysis of variance. ROC curve analysis was applied to assess the
sensitivity, specificity and accuracy of Ktrans,
ADC value, or the combination of the two to distinguish between
early and advanced stages of NPC.
Results
DCE-MRI parameters and ADC
Mean Ktrans, Kep,
Ve, and ADC values for the tumours and lateral
pterygoid muscle are displayed in Table
I. NPC presented a higher parameter value than that of normal
muscle tissue in the head and neck detected by DCE-MRI technique.
The parameters Ktrans, Kep and
Ve of the primary tumours were significantly higher
than those of the lateral pterygoid muscle. There were significant
differences between tumour and normal internal pterygoid muscle
(P<0.05). The ADC values of primary tumours were significantly
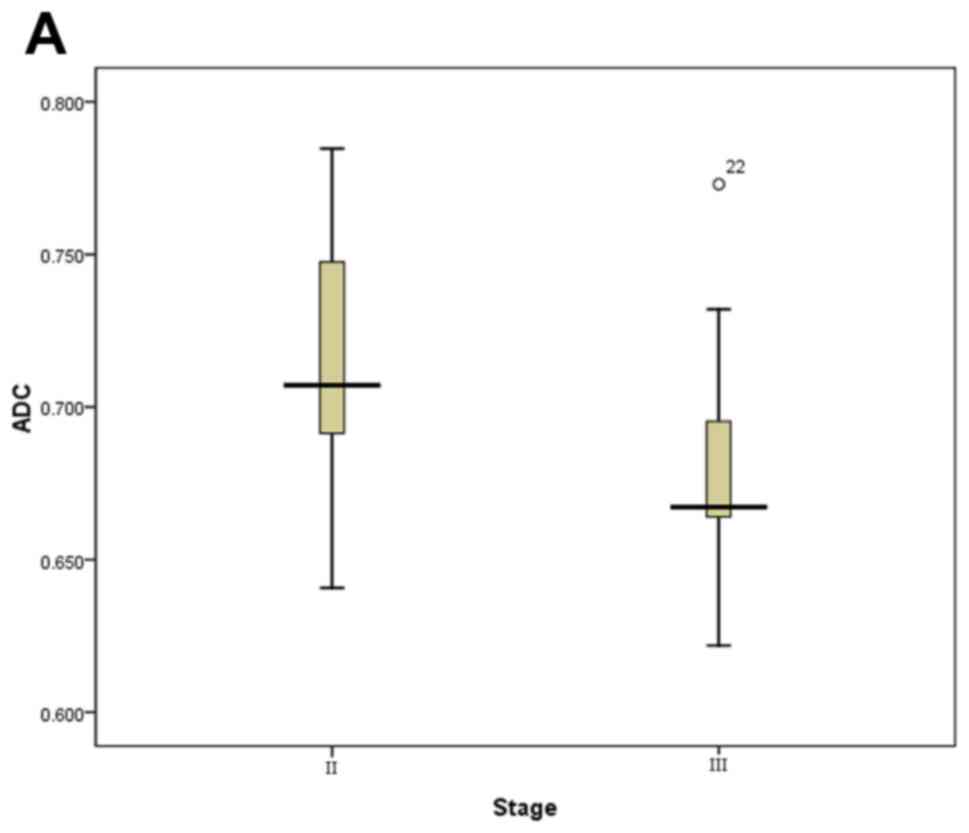
lower than those of the lateral pterygoid muscle. Boxplots
demonstrated the distribution of ADC value and
Ktrans are displayed in Fig. 1. We can see that
Ktrans and ADC showed significant differences
between stage II and III, stage II and stage (III and IV). We can
see that Ktrans and ADC values in stage II were
both significantly lower and higher, respectively, than those in
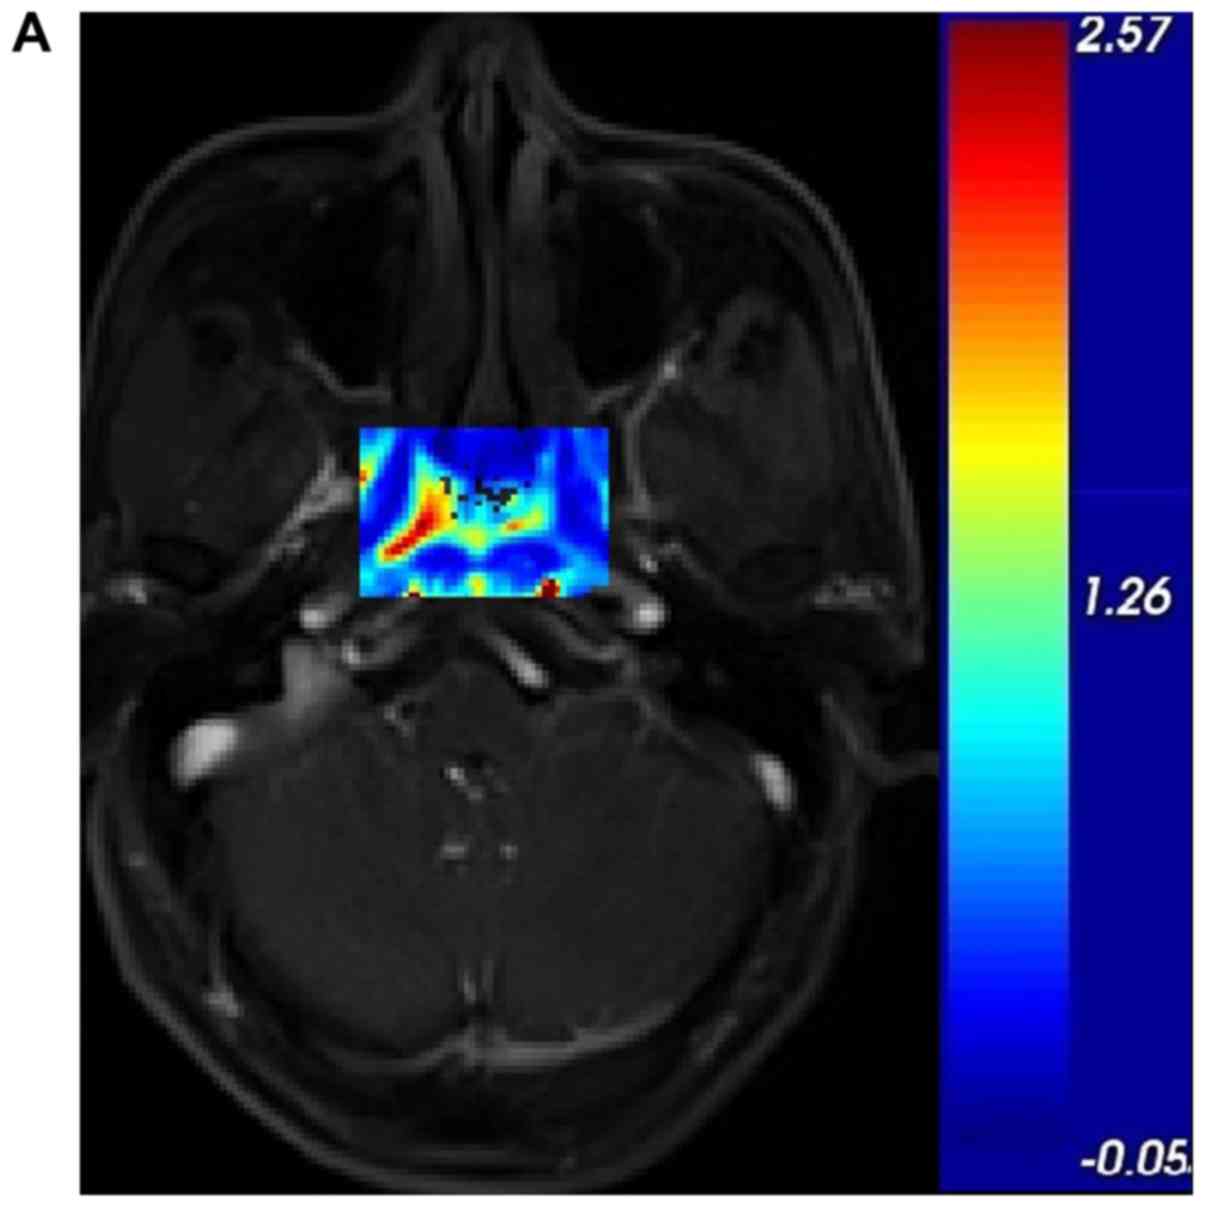
stage III and IV in the Table I. We
also determined that the darker the tumour, the greater the
Ktrans value and the higher the stage, as shown
in Fig. 2.
 | Table I.Dynamic contrast-enhanced magnetic
resonance imaging parameters and ADC of 44 patients with
nasopharyngeal carcinoma. |
Table I.
Dynamic contrast-enhanced magnetic
resonance imaging parameters and ADC of 44 patients with
nasopharyngeal carcinoma.
|
| Primary
tumours |
|
| t-test |
|---|
|
|
|
|
|
|
|---|
| Parameter | II | III | IV | Total | Lateral pterygoid
muscle | t | P-value |
|---|
|
Ktrans | 1.70±0.36 | 2.33±0.39 | 2.61±2.76 | 2.27±0.49 | 0.48±0.33 | 19.93 | 0.004 |
|
Kep | 4.4 3±0.91 | 5.14±1.56 | 6.12±1.12 | 5.30±1.43 | 1.88±1.44 | 2.94 | 0.001 |
|
Ve | 0.61±0.23 | 0.79±3.45 | 0.69±2.25 | 0.71±0.29 | 0.28±0.15 | 8.94 | 0.002 |
| ADC | 0.72±0.05 | 0.68±0.04 | 0.6 5± 0.05 | 0.68±0.05 | 1.25±0.11 | 27.01 | 0.001 |
Correlations analysis
The relationships between DCE-MRI parameters, ADC
and clinical stages are detailed in Table II. Positive correlations were found
between clinical stage and Ktrans (r=0.67,
P<0.05) and Kep (r=0.46, P<0.05). ADC
showed moderate negative correlation with clinical stage (r=−0.57,
P<0.05). Ve revealed no significant
correlation with it. In addition, Ktrans showed
negative correlation with ADC value (r=−0.34, P<0.05).
| Table II.Correlation between independent
tumour DCE-MRI parameters and ADC values. |
Table II.
Correlation between independent
tumour DCE-MRI parameters and ADC values.
| Parameter |
Kep |
Ve | ADC | Stage |
|---|
|
Ktrans | 0.42a | 0.48a | −0.34a | 0.67a |
|
Kep |
| −0.28 | −0.21 | 0.46a |
|
Ve |
|
| −0.20 | 0.12 |
| ADC |
|
|
| −0.57a |
ROC analysis
The sensitivity, specificity, and accuracy obtained
by using Ktrans, ADC and both together to
distinguish stage II from stage III and from stage (III and IV) are
displayed in Table III. We can see
that the sensitivity, specificity, and accuracy obtained by using
Ktrans to distinguish stage II from stage III and
from stage (III and IV) are 88.9%; 81.8%; 0.89 and 93.9%; 72.7%;
0.93, respectively. The sensitivity, specificity, and accuracy
obtained by using ADC to distinguish stage II from stage III and
from stage (III and IV) are 88.9%, 63.6%, 0.79 and 81.8%; 72.7%;
0.83, respectively. The sensitivity, specificity, and accuracy
obtained by using Ktrans and ADC together to
distinguish stage II from stage III and from stage (III and IV) are
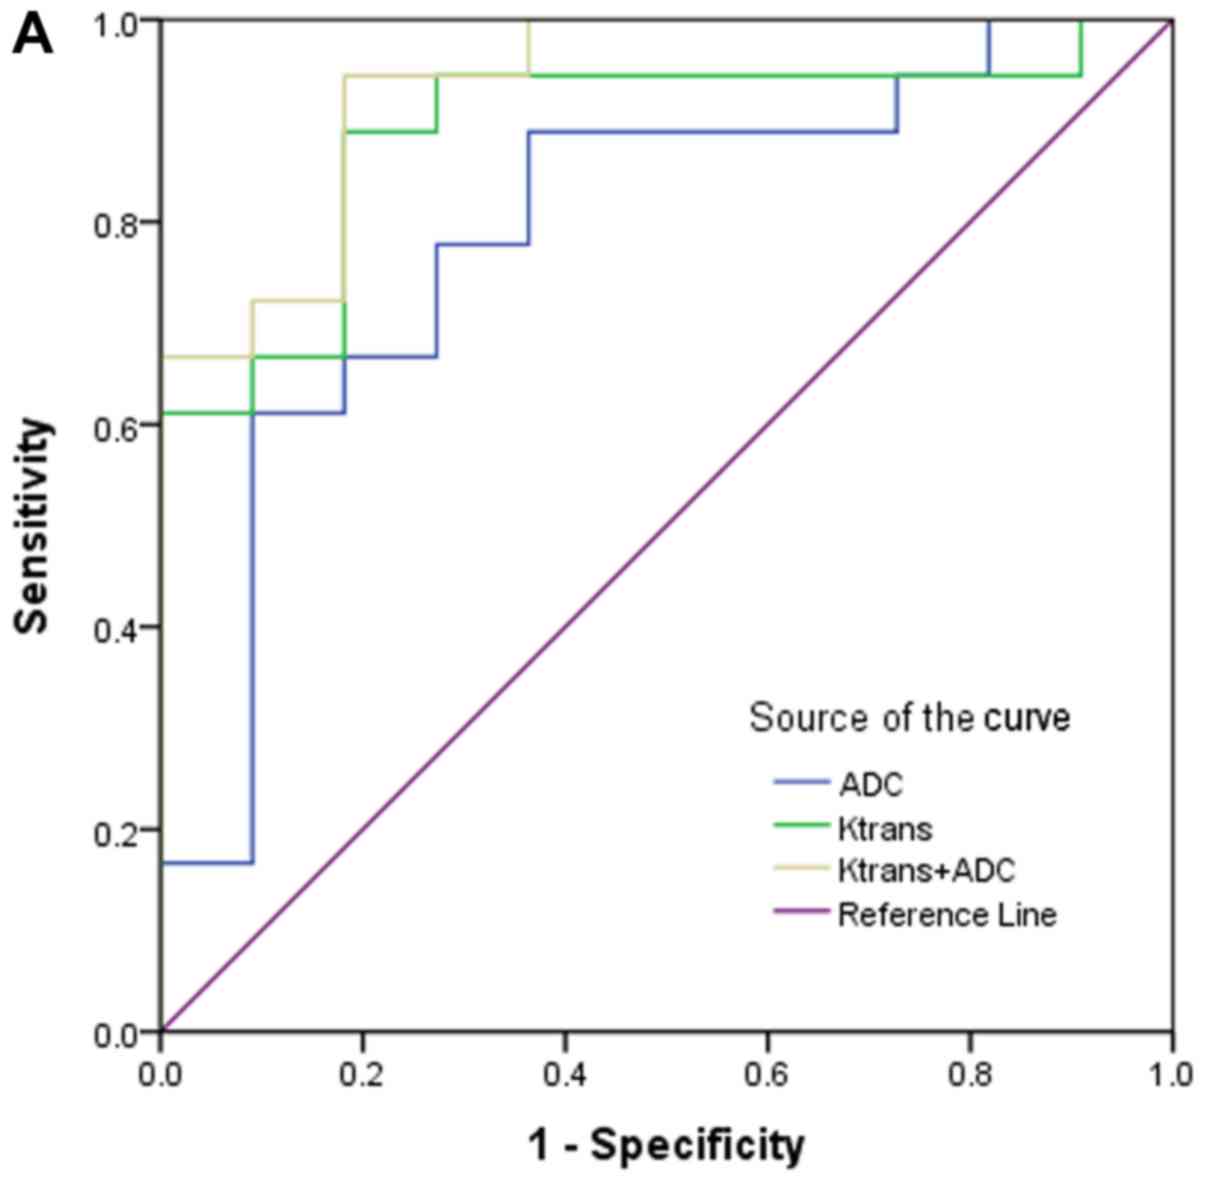
94.4, 81.8, 0.94 and 97.0%; 81.8%; 0.96, respectively. ROC curve
analysis for diagnosing stage II from stage III and stage III + IV
by using Ktrans, ADC and in combination are
displayed in Fig. 3. ROC curves show
the diagnostic accuracy for early stages based on
Ktrans and ADC values, and demonstrate excellent
AUCs of 0.93 and 0.83, respectively. The diagnostic accuracy of
Ktrans and ADC in differentiation of stage II
from stage III were 0.89 and 0.79, respectively. In addition, we
found the diagnostic sensitivity and accuracy of
Ktrans and ADC together were higher than either
alone.
| Table III.Diagnostic sensitivity, specificity
and accuracy for early and advanced stages of NPC using
Ktrans and ADC alone or in combination. |
Table III.
Diagnostic sensitivity, specificity
and accuracy for early and advanced stages of NPC using
Ktrans and ADC alone or in combination.
|
| Stage II and
III | Stage II and III +
IV |
|---|
|
|
|
|
|---|
| Parameter | Sensitivity,
Specificity; AUC | Sensitivity,
Specificity; AUC |
|---|
|
Ktrans | 88.9%; 81.8%;
0.89 | 93.9%; 72.7%;
0.93 |
| ADC | 88.9%; 63.6%;
0.79 | 81.8%; 72.7%;
0.83 |
|
Ktrans plus ADC | 94.4%; 81.8%;
0.94 | 97.0%; 81.8%;
0.96 |
We determined that Ktrans and ADC
presented significant differences between many early and advanced
stages patients. We could see that, with the increase of UICC
stage, Ktrans increased and ADC decreased
gradually, respectively. Compared with Ktrans and
ADC, they are more valuable and more important parameters in
correlating and distinguishing tumour stages.
Discussion
The present study was designed to use
Ktrans and ADC together to improve diagnostic
accuracy in the differentiation of early from advanced NPC in newly
diagnosed, untreated tumours. A significant positive and negative
correlation was found between clinical stage and
Ktrans, and ADC value, respectively. This
suggests that Ktrans and ADC values are
significantly associated with characteristics of NPC. In addition,
the ROC analysis further showed a good diagnostic performance of
Ktrans and ADC value in assessing early tumour
stage.
DWI reflects the random Brownian motion of water
molecules within tissues. Malignant tissues show much more
diffusion restriction and much lower ADC levels than normal tissues
owing to their hypercellularity (16). ADC is a quantitative parameter that
can indirectly indicate microvascular circulation, cell membrane
integrity, and cell density. It has a high sensitivity and
specificity in the diagnosis and staging of tumours (17,18). In
the present study, The ADCs of primary tumours were significantly
lower than those of muscle. The ADC values in early stage tumours
were significantly higher than those in advanced stage tumours
(P<0.05). A significant correlation of ADC value and clinical
stage of NPC was found. The result of the present study is
consistent with the previous findings in other tumours (19–21).
Architectural and functional abnormalities of blood
vessels are a common feature in tumours (22,23).
Estimations of tumour blood volume and permeability obtained with
DCE-MRI have been found to correlate with tumour grade, prognosis,
and treatment response (24).
Previous studies have demonstrated that the increase of vascular
endothelial growth factor (VEGF) can induce the proliferation and
migration of tumour vascular endothelial cells, and increase the
permeability of microvasculature (25). DCE-MRI enables the quantitative
assessment of tumour microcirculation properties, including vessel
size, distribution and permeability6. Tumour tissue is
characterised by abundant blood flow, neovascularity, and increased
microcirculation permeability, resulting in an increased transfer
speed of contrast agent per unit time, such that the
Ktrans values increase with the tumour stage.
DCE-MRI can be applied not only to identification and diagnosis of
benign and malignant tumours, but also can be used to monitor
therapeutic effect and assess prognosis. DCE-MRI is particularly
attractive in NPC patients because, comparing to PET or CT, MRI
technique is an established and commonly used method for staging
and depicting the target volume of NPC patients in China. This
pilot clinical study on NPC revealed that there was inhomogeneous
microcirculation perfusion inside and outside the tumours. The
Ktrans, Kep, Ve of primary
tumours were significantly higher than the values in muscle
(P<0.05). The Spearman test demonstrated that the
Ktrans of tumours shows positive correlation with
clinical stage. These were in concordance with many other studies
on other tumours in vivo, such as breast cancer (26) and glioma (27).
DWI reflects both diffusion and perfusion. Diffusion
is mainly affected by cellularity, presence of oedema, fibrosis,
and necrosis of the tissue. The perfusion effect is seen when a
b-value of <400 s/mm2 is used. Malignant tumours have
higher perfusion rates than benign tumours (28). Perfusion can be reflected by DCE-MRI
parameters Ktrans. In the present study, a
correlation between tumour Ktrans and ADC value
was observed. The results can be explained because malignant
tissues have dense cellularity, large cellular size, and increased
micro vessel density and permeability. For these reasons, the
accuracy of discriminating early stage from advanced stage NPC
using Ktrans and ADC together was improved.
We also showed that Ktrans may be
a good indicator for early staging in NPC. Therefore, our study
demonstrated that both Ktrans and ADC derived
from DCE-MRI and DWI can be helpful tools to discriminate the
clinical stage. This not only provides the basis for optimizing the
scan sequence, but also provides more MR functional parameters to
supplement clinical staging. It can also supplement clinical
staging, to further improve the sensitivity and effectiveness of
early diagnosis. It can prevent false upstaging and the resulting
overtreatment. Guidelines from the National Comprehensive Cancer
Network (NCCN) in the US indicate that early treatment of NPC is
dominated by radiotherapy alone. Advanced treatment options include
concurrent radiotherapy. Simple radiotherapy is not satisfied with
the effect of advanced stage (stage III/IV) NPC. Radiotherapy
concurrent chemotherapy can well control the local recurrence of
tumour lesion and distant metastasis, which can significantly
improve the survival time of patients. Early NPC patients with
satisfactory results of radiotherapy alone, generally do not need
synchronous chemotherapy, can largely help patients reduce the side
effects of chemotherapy drugs and radioactive injury, etc, can well
improve the quality life of patients. Therefore, the early
diagnosis of NPC and accurate clinical stage of its treatment plan
and the prognosis of patients plays a crucial role.
However, the present study has several limitations,
including the small sample size and the lack of comparison between
different types of NPC. Further investigation on more cases may
improve the statistical power. DCE-MRI postprocessing needs high
temporal resolution to improve the accuracy of the maps, but the
slice coverage of a DCE-MRI sequence is limited. In addition, there
are still some challenges to overcome when using DCE-MRI and DWI on
children, elderly, or other special groups who could not endure a
long examination time. Hence, the DCE-MRI and DWI technique may
need further development.
In conclusion, Ktrans derived from
DCE-MRI and ADC derived from DWI have a good potential to
accurately stage early NPC. The two parameters used together offer
the best accuracy.
References
|
1
|
Lee AW, Lin JC and Ng WT: Current
management of nasopharyngeal cancer. Semin Radiat Oncol.
22:233–244. 2012. View Article : Google Scholar : PubMed/NCBI
|
|
2
|
Boscolo-Rizzo P, Tirelli G, Mantovani M,
Baggio V, Lupato V, Spinato G, Gava A and Da Mosto MC: Non-endemic
locoregional advanced nasopharyngeal carcinoma: Long-term outcome
after induction plus concurrent chemoradiotherapy in everyday
clinical practice. Eur Arch Otorhinolaryngol. 272:3491–3498. 2015.
View Article : Google Scholar : PubMed/NCBI
|
|
3
|
Chen Y, Liu X, Zheng D, Xu L, Hong L, Xu Y
and Pan J: Diffusion-weighted magnetic resonance imaging for early
response assessment of chemoradiotherapy in patients with
nasopharyngeal carcinoma. Magn Reson Imaging. 32:630–637. 2014.
View Article : Google Scholar : PubMed/NCBI
|
|
4
|
Yi JL, Gao L, Huang XD, Li SY, Luo JW, Cai
WM, Xiao JP and Xu GZ: Nasopharyngeal carcinoma treated by radical
radiotherapy alone: Ten-year experience of a single institution.
Int J Radiat Oncol Biol Phys. 65:161–168. 2006. View Article : Google Scholar : PubMed/NCBI
|
|
5
|
Spratt DE and Lee N: Current and emerging
treatment options for nasopharyngeal number carcinoma. Onco Targets
Ther. 5:297–308. 2012.PubMed/NCBI
|
|
6
|
Türkbey B, Thomasson D, Pang Y, Bernardo M
and Choyke PL: The role of dynamic contrast-enhanced MRI in cancer
diagnosis and treatment. Diagn Interv Radiol. 16:186–192.
2010.PubMed/NCBI
|
|
7
|
Pan J, Zang L, Zhang Y, Hong J, Yao Y, Zou
C, Zhang L and Chen Y: Early changes in apparent diffusion
coefficients predict radiosensitivity of human nasopharyngeal
carcinoma xenografts. Laryngoscope. 122:839–843. 2012. View Article : Google Scholar : PubMed/NCBI
|
|
8
|
Huang B, Wong CS, Whitcher B, Kwong DL,
Lai V, Chan Q and Khong PL: Dynamic contrast enhanced magnetic
resonance imaging for characterising nasopharyngeal carcinoma:
Comparison of semiquantitative and quantitative parameters and
correlation with tumour stage. Eur Radiol. 23:1495–1502. 2013.
View Article : Google Scholar : PubMed/NCBI
|
|
9
|
Zheng D, Chen Y, Chen Y, Xu L, Chen W, Yao
Y, Du Z, Deng X and Chan Q: Dynamic contrast-enhanced MRI of
nasopharyngeal carcinoma: A preliminary study of the correlations
between quantitative parameters and clinical stage. J Magn Reson
Imaging. 39:940–948. 2014. View Article : Google Scholar : PubMed/NCBI
|
|
10
|
Abdel Razek AA and Kamal E: Nasopharyngeal
carcinoma: Correlation of apparent diffusion coefficient value with
prognostic parameters. Radiol Med. 118:534–539. 2013. View Article : Google Scholar : PubMed/NCBI
|
|
11
|
Vandecaveye V, Dirix P, De Keyzer F, de
Beeck KO, Vander Poorten V, Roebben I, Nuyts S and Hermans R:
Predictive value of diffusion-weighted magnetic resonance imaging
during chemoradiotherapy for head and neck squamous cell carcinoma.
Eur Radiol. 20:1703–1714. 2010. View Article : Google Scholar : PubMed/NCBI
|
|
12
|
Kim S, Loevner LA, Quon H, Kilger A,
Sherman E, Weinstein G, Chalian A and Poptani H: Prediction of
response to chemoradiation therapy in squamous cell carcinomas of
the head and neck using dynamic contrast-enhanced MR imaging. AJNR
Am J Neuroradiol. 31:262–268. 2010. View Article : Google Scholar : PubMed/NCBI
|
|
13
|
Powell C, Schmidt M, Borri M, Koh DM,
Partridge M, Riddell A, Cook G, Bhide SA, Nutting CM, Harrington KJ
and Newbold KL: Changes in functional imaging parameters following
induction chemotherapy have important implications for
individualised patient-based treatment regimens for advanced head
and neck cancer. Radiother Oncol. 106:112–117. 2013. View Article : Google Scholar : PubMed/NCBI
|
|
14
|
Zhou G, Chen X, Zhang J, Zhu J, Zong G and
Wang Z: Contrast-enhanced dynamic and diffusion-weighted MR imaging
at 3.0T to assess aggressiveness of bladder cancer. Eur J Radiol.
83:2013–2018. 2014. View Article : Google Scholar : PubMed/NCBI
|
|
15
|
Kul S, Cansu A, Alhan E, Dinc H, Gunes G
and Reis A: Contribution of diffusion weighted imaging to dynamic
contrast-enhanced MRI in the characterization of breast tumors. AJR
Am J Roentgenol. 196:210–217. 2011. View Article : Google Scholar : PubMed/NCBI
|
|
16
|
Hong J, Yao Y, Zhang Y, Tang T, Zhang H,
Bao D, Chen Y and Pan J: Value of magnetic resonance
diffusion-weighted imaging for the prediction of radio sensitivity
in nasopharyngeal carcinoma. Otolaryngol Head Neck Surg.
149:707–713. 2013. View Article : Google Scholar : PubMed/NCBI
|
|
17
|
Fong D, Bhatia KS, Yeung D and King AD:
Diagnostic accuracy of diffusion weighted MR imaging for
nasopharyngeal carcinoma, head and neck lymphoma and squamous cell
carcinoma at the primary site. Oral Oncol. 46:603–606. 2010.
View Article : Google Scholar : PubMed/NCBI
|
|
18
|
Li H, Liu XW, Geng ZJ, Wang DL and Xie CM:
Diffusion-weighted imaging to differentiate metastatic from
non-metastatic retropharyngeal lymph nodes in nasopharyngeal
carcinoma. Dentomaxillofac Radiol. 44:201401262015. View Article : Google Scholar : PubMed/NCBI
|
|
19
|
Kobayashi S, Koga F, Kajino K, Yoshita S,
Ishii C, Tanaka H, Saito K, Masuda H, Fujii Y, Yamada T and Kihara
K: Apparent diffusion coefficient value reflects invasive and
proliferative potential of bladder cancer. J Magn Reson Imaging.
39:172–178. 2014. View Article : Google Scholar : PubMed/NCBI
|
|
20
|
Langer DL, van der Kwast TH, Evans AJ,
Plotkin A, Trachtenberg J, Wilson BC and Haider MA: Prostate tissue
composition and MR measurements: Investigating the relationships
between ADC, T2, Ktrans, ve and corresponding
histologic features. Radiology. 255:485–494. 2010. View Article : Google Scholar : PubMed/NCBI
|
|
21
|
Lee J, Choi SH, Kim JH, Sohn CH, Lee S and
Jeong J: Glioma grading using apparent diffusion coefficient map:
Application of histogram analysis based on automatic segmentation.
NMR Biomed. 27:1046–1052. 2014. View
Article : Google Scholar : PubMed/NCBI
|
|
22
|
Guo AC, Cummings TJ, Dash RC and
Provenzale JM: Lymphomas and high-grade astrocytomas: Comparison of
water diffusibility and histologic characteristics. Radiology.
224:177–183. 2002. View Article : Google Scholar : PubMed/NCBI
|
|
23
|
Yao WW, Zhang H, Ding B, Fu T, Jia H, Pang
L, Song L, Xu W, Song Q, Chen K and Pan Z: Rectal Cancer: 3D
dynamic contrast-enhanced MRI; correlation with microvascular
density and clinicopathological features. Radiol Med. 116:366–374.
2011. View Article : Google Scholar : PubMed/NCBI
|
|
24
|
Law M, Oh S, Babb JS, Wang E, Inglese M,
Zagzag D, Knopp EA and Johnson G: Low-grade gliomas: Dynamic
susceptibility-weighted contrast-enhanced perfusion MR imaging
prediction of patient clinical response. Radiology. 238:658–667.
2006. View Article : Google Scholar : PubMed/NCBI
|
|
25
|
Möbius C, Freire J, Becker I, Feith M,
Brücher BL, Hennig M, Siewert JR and Stein HJ: VEGF-C expression in
squamous cell carcinoma and adenocarcinoma of the esophagus. World
J Surg. 31:1768–1772. 2007. View Article : Google Scholar : PubMed/NCBI
|
|
26
|
El Khouli RH, Macura KJ, Kamel IR, Jacobs
MA and Bluemke DA: 3-T dynamic contrast-enhanced MRI of the breast:
Pharmacokinetic parameters versus conventional kinetic curve
analysis. AJR Am J Roentgenol. 197:1498–1505. 2011. View Article : Google Scholar : PubMed/NCBI
|
|
27
|
Arevalo-Perez J, Peck KK, Young RJ,
Holodny AI, Karimi S and Lyo JK: Dynamic contrast-enhanced
perfusion MRI and diffusion-weighted imaging in grading of gliomas.
J Neuroimaging. 25:792–798. 2015. View Article : Google Scholar : PubMed/NCBI
|
|
28
|
Woodhams R, Matsunaga K, Kan S, Hata H,
Ozaki M, Iwabuchi K, Kuranami M, Watanabe M and Hayakawa K: ADC
mapping of benign and malignant breast tumors. Magn Reson Med Sci.
4:35–42. 2005. View Article : Google Scholar : PubMed/NCBI
|