Introduction
Multiple myeloma (MM) is a neoplastic plasma cell
disorder with heterogeneous clinical features (1). The pathogenesis of MMs is a multiple
developmental process. However, the underlying molecular mechanism
is largely unknown. Monoclonal gammopathy of undetermined
significance (MGUS) has an incidence of 1% per year for malignant
transformations, and is one of the primary causes of MM. Chromosome
translocations or hyperdiploidly frequently occur in MM and MGUS,
particularly in immunoglobulin heavy chain (IgH) translocation
(2). IgH translocation often results
in the juxtaposition of oncogenes to the IgH promoter, thereby
causing the overexpression of oncogenes including cyclin D (CCND),
V-Maf avian musculoaponeurotic fibrosarcoma, Multiple myeloma SET
domain-containing protein and fibroblast growth factor receptor
(3–5).
A previous study has indicated that transcription factor
Octamer-binding protein 2 (Oct2), also known as POU class 2
homeobox 2, may activate the IgH gene enhancer and consequently
enhance IgH gene expression by directly binding to the consensus
octamer site ATGCAAAT (4). Notably,
CRISP3encoding Cysteine-rich secreted protein 3 (CRISP3) also
possesses the ATGCAAAT sequence, and has been demonstrated to be
activated by Oct2 in mouse B cells (6–8). This
suggests that the deregulation of CRISP3 may contribute to the
pathogenesis of MM, and is a novel potential diagnostic or
therapeutic biomarker for MM.
Gene expression profiling is a powerful way of
understanding the molecular basis of diseases, and has been applied
to explore the unique gene expression patterns and distinctly
expressed genes of MM from different samples including peripheral
blood, bone marrow and isolated cells (9–11). A
number of potential biomarkers pertaining to disease
classifications and therapy responses have been identified
(5). The transcriptional profiling of
peripheral blood from patients with MM has provided not only
genetic alterations, but also useful diagnostic and prognostic
information. However, independent studies (9–11) based on
different working platforms have only provided fragmented genetic
data; and the peripheral blood environment is usually complicated
and affected by numerous factors. Therefore, in order to be
precise, the integrated analysis of the gene expression patterns of
peripheral blood of MM is essential for accurate diagnosis, patient
stratification and prognosis.
Meta-analysis-based computational methods have
provided general information from different studies, and have been
successfully utilized in certain genetic disorders (12). In the present study, the
transcriptional changes of MM peripheral blood from the super array
data derived from different studies (9–11) were
analyzed, and the principal components from this data were
extracted. These data were additionally analyzed by Bayesian probit
regression modeling. Key discriminate genes were additionally
grouped and annotated. As CRISP3 was identified to be upregulated
in other types of cancer, particularly in prostate cancer (PC), the
microarray data of PC human peripheral blood samples and the
corresponding controls were obtained and re-normalized to the super
array data of MM peripheral blood and the control. The selected
Oct2, Alpha-1B-glycoprotein (A1GB), CCND2 and CRISP3were validated
by reverse transcription quantitative polymerase chain reaction
(RT-qPCR) in MM and healthy control peripheral blood samples. These
theoretical and experimental data analyses may provide useful
indications of the process of MM pathogenesis, and assist in the
diagnosis and prognosis determination of MM.
Materials and methods
In silico studies of gene expression
profiling data
Gene expression datasets
All gene expression datasets were searched and
downloaded from the Gene Expression Omnibus (GEO) repository of the
National Center for Biotechnology Information (NCBI) web
(http://www.ncbi.nlm.nih.gov/gds/, 3rd
August 2015) with the keyword ‘multiple myeloma’ through the
searching engine (13). The inclusion
criteria for the present study were datasets comprising Homo
sapiens blood sample types and the commonly used microarray
platforms [including Affymetrix (Thermo Fisher Scientific, Inc.,
Waltham, MA, USA); Agilent (Agilent Technologies, Inc., Santa
Clara, CA, USA); and Illumina (Illumina, Inc., San Diego, CA,
USA)], including different versions of Affymetrix products (Thermo
Fisher Scientific, Inc.), including HG-U133_Plus_2, HuGene-1_0-st
and HG_U95Av2.
Data preprocess
The series matrix file (txt version) of each dataset
was used directly in the data analysis. For the purposes of easier
plotting and reducing the level of variation, all measurements were
Log2-transformed in advance. Probe names of each data
were replaced with their corresponding official gene symbols (gene
names), and the original sample names were renamed according to
their status for ease. As different versions of Affymetrix
platforms possess different numbers of probes, probes were designed
specifically according to the initial experimental objectives of
the analyzed studies (9–11), in the attempt to measure corresponding
genes. In the present study, different microarray data were
combined via selecting common genes together with the corresponding
measurements within different datasets in an attempt to get more
precise discriminated genes from MM and the healthy control whole
blood samples. Median values were used when one gene was repeatedly
detected by >1 probe.
Normalization
In order to allow the data of different studies to
be comparable from each other, the cross-platform normalization
(XPN) method (14) was performed on
preprocessed data. R commands, together with the Bioconductor
package CrOss-platform Normalization in R (CONOR_1.0.1) (the
package is no longer available from the webpage http://alborz.sdsu.edu/conor, but was originally
downloaded 9th March, 2014 and is now available on request from the
corresponding author), were utilized for data normalization
(14,15). During the normalization process, the
sum of the squared Euclidean distance converged to a local minimum,
and data were iteratively clustered. This procedure would not only
eliminate systematic errors among each individual data, but would
also maintain the complete biological information to ensure that
all information of gene expression data was not affected by
normalization.
General expression pattern
prediction
Gene expression of MM are affected by environmental
and genetic factors (16). The
genetic features of the disease states is represented by the
majority of specimens in the form of gene expression patterns, and
has been revealed by a previous study investigating the genetic
lesions of MM (17). A two-way
clustering method (based on hierarchical clustering algorithms that
processed by the Euclidean distance similarity metric and the
complete linkage clustering using the Gene Clustering 3.0 and Java
TreeView software; the open source software is available from the
website, http://bonsai.hgc.jp/~mdehoon/software/cluster/software.htm)
was used to determine differentially expressed genes that
distinguished between MM and the healthy controls. Distinctive
samples that could not be clustered into common conditions were not
considered for additional analyses. In order to identify the
clearly distinguished expression pattern between normal and MM
samples, a student's t-test was also performed on the combined
microarray data. Genes with P<0.05 were considered to be
differentially expressed.
Principal component extraction and
building of the Bayesian probit regression model
Gene expression data possess multiple dimensional
properties. Each gene may have interactions with others, and this
interaction association can be worked out by data mining. In the
present study, the principal components of genes from the MM
peripheral blood data with significantly expressed genes were
extracted, and the expression patterns were characterized. Each
gene has a loading coefficient with each principal component. In
addition, Principal components with a cumulative proportion of 85%
were selected for Bayesian probit regression modeling.
Gene enrichment analysis
Significantly expressed annotations of genes were
obtained through the online Database for Annotation, Visualization
and Integrated Discovery (DAVID) search engine v.6.7 (http://david.abcc.ncifcrf.gov/) (18,19). Genes
were classified according to their known biological functions, and
gene enrichments of each term were also visualized.
CRISP3 expression among MM control and
MM samples, and PC control and PC samples, in whole blood of the
Gene Expression Omnibus (GEO) profiles
CRISP3 gene expression data of different disease
types were obtained through the GEO profile repository (https://www.ncbi.nlm.nih.gov/geoprofiles/) on 3rd of
August 2015. All measurements were normalized by the XPN method,
and gene expression of CRISP3 among different sample types was
compared across different studies.
Selected gene expression validation
Ethics statement
The present study was approved by the Ethics
Committee of Beijing Chao-Yang Hospital, Capital Medical University
(Beijing, China). Written informed consent was obtained from all
patients.
Gene expression validation by
RT-qPCR
Total RNA was extracted from whole blood samples
(including 18 healthy controls and 12 patients with MM) by the
phenol chloroform method. In brief, 250 µl EDTA anti-coagulated
blood was mixed with 750 µl TRIzol® (Life Technologies;
Thermo Fisher Scientific, Inc.) and 1 µl RNA carrier (Beijing
TransGen Biotech Co., Ltd, Beijing, China). Following incubation at
room temperature for 5 min, the mixture was added to 200 µl
chloroform and vortexed rigorously at 200 × g under room
temperature for 30 sec, followed by incubation at room temperature
for 3 min. Subsequent to centrifugation at 12,000 × g for 15 min at
4°C, the supernatant (400–500 µl) was transferred to an RNase-free
tube and incubated with equal volume of isopropanol at room
temperature for 10 min. The mixture was centrifuged at 12,000 × g
for 10 min at 4°C, and the pellet was washed with RNase-free 75%
ethanol, followed by low speed centrifugation at 8,600 × g for 5
min at 4°C. Following the volatilization of almost all the ethanol,
the pellet was mixed with 20 µl RNase-free ddH2O. The
20-µl RNA solution was reverse transcribed into cDNA by mixing with
the 5-µl RT-mix (5X all-in-one RT Master Mix, Abcam, Cambridge, MA,
USA) at 25°C for 10 min, 42°C for 15 min and 85°C for 5 min. The
template cDNA was diluted to 1:20 in ddH2O. RT-qPCR was
performed on ABI7500 in a 20-µl reaction volume containing 2 µl
diluted cDNA, 1 µl forward and reverse specific primers, and 10 µl
qPCR mix (EvaGreen qPCR Master Mix-low ROX; Applied Biological
Materials, Inc., Richmond, Canada). The thermocycling conditions
were as follows: 50°C for 2 min, 95°C for 10 min, followed by 40
cycles of 95°C for 15 sec, 60°C for 30 sec and 72°C for 30 sec. The
expression level of the target gene was normalized to β-actin using
the Cq method (20). All specific
primers are summarized in Table
I.
 | Table I.Primers used in reverse transcription
quantitative polymerase chain reaction. |
Table I.
Primers used in reverse transcription
quantitative polymerase chain reaction.
| Gene | Forward primer | Reverse primer |
|---|
| CRISP3 |
5′-ACCTTGTGCCAGTTGCCCAGA-3′ |
5′-CCCTGACCAACTGATGTTTACAGG-3′ |
| Oct2 |
5′-AGGGAAGCCGGCCAGCTACAG-3′ |
5′-AGGGGATGGAATTGAGGGGGG-3′ |
| A1BG |
5′-CCCAGCACGCCGGCAACTAC-3′ |
5′-TCAGCTTTCTGCCACCAGGAGCTC-3′ |
| CCND2 |
5′-CAGCACTCTTCCCAGACACACAGTC-3′ |
5′-AGGCTATTGAGGAGCACCGCC-3′ |
Statistical analysis
Differentially expressed genes in MM samples
compared with normal samples were elucidated by supervised
classification using the R command based software Significance
Analysis of Microarray (SAM) 4.0 (http://www-stat.stanford.edu/˜tibs/SAM/, software
accessed on 10th of September, 2015 supplied by Stanford
University, CA, USA) on the sample data with a predicted expression
pattern (21). False discovery rates
were calculated for each differently expressed gene. The
T-statistic method predicted significantly and differently
expressed genes, and provided a SAM score for each gene. The higher
the SAM scores, the more significant the distinctive gene. Fold
changes were also calculated as the average of MM gene expression
measurements divided by the average of the healthy control gene
expression measurements.
Differences in gene expression measurements from the
GEO datasets were assessed using an unpaired Student's t-test by
Microsoft Excel software 2007 (Microsoft Corporation, Redmond, WA,
USA), and P<0.05 was considered to indicate a statistically
significant difference. Supervised classification of samples was
analyzed using the T-statistic test by SAM 4.0 software supplied by
Stanford University, CA, USA, and a SAM score <0.05 was
considered to indicate a statistically significant difference. The
principle components of the gene expression data were extracted
using Principle Component Analysis followed with Bayesian probit
regression analysis by pr and arm packages under R command:
Principle components with cumulative proportions up to 80% were
considered as sufficient for data description, a probit of
principle component <0.05 was considered as significant
different, and a gene with loading coefficient >0.8 was
considered as a signature. Changes in gene expression validated by
RT-qPCR were assessed using an unpaired Student's t-test Prism 5
software (GraphPad Software, Inc., La Jolla, CA, USA), and
P<0.05 was considered to indicate a statistically significant
difference.
Results
In silico gene expression analysis
Data selection
Through searches using the keyword ‘multiple
myeloma’ in the GEO datasets, 8,918 records were obtained. Among
these records, 8,655 were concerning Homo sapiens samples.
Within these datasets, 269 intact GSE data contained mostly
complete experimental information including summary, overall
design, contributors, platforms, sample information and
supplementary files. Subsequent to analyzing these published
datasets by title, summary, platform, total transcripts, total
samples, sample source, control (normal) sample number, control
(normal) sample source, data format, dataset contributor and
references, 3 human peripheral blood datasets were obtained
(Table II). All of these were
derived from experiments that were used to compare the gene
expression of MM with normal samples.
| Table II.Gene expression profile datasets used
in data mining. |
Table II.
Gene expression profile datasets used
in data mining.
| Accession
number | Platform | Total
transcripts | Total sample
number | Normal sample
number |
|---|
| GSE7116 | Affymetrix Human
Genome U133 Plus 2.0 Array | 54,675 | 26 | 5 |
| GSE27838 | Affymetrix Human
Genome U133 Plus 2.0 Array | 54,675 | 32 | 16 |
| GSE28107 | Affymetrix Human
Genome U133A Array | 22,283 | 6 | 3 |
Preprocessed raw data
The selected gene expression data were compared with
each other to produce a common gene list. In the present study, a
total of 1,3193 common genes were obtained. In particular,
duplicated measurements concerning special genes, including unique
genes replaced by different probes and designed by different gene
arrays, were combined to calculate their median values.
Super array data
By using the R packages of CONOR, the 3 selected
gene expression data were combined together to generate a super
array data (data not shown). A total of 48 samples (32 MM and 16
normal samples) from different studies and 13,193 common genes,
together with the corresponding measurements, were used to identify
the gene expression pattern of MM.
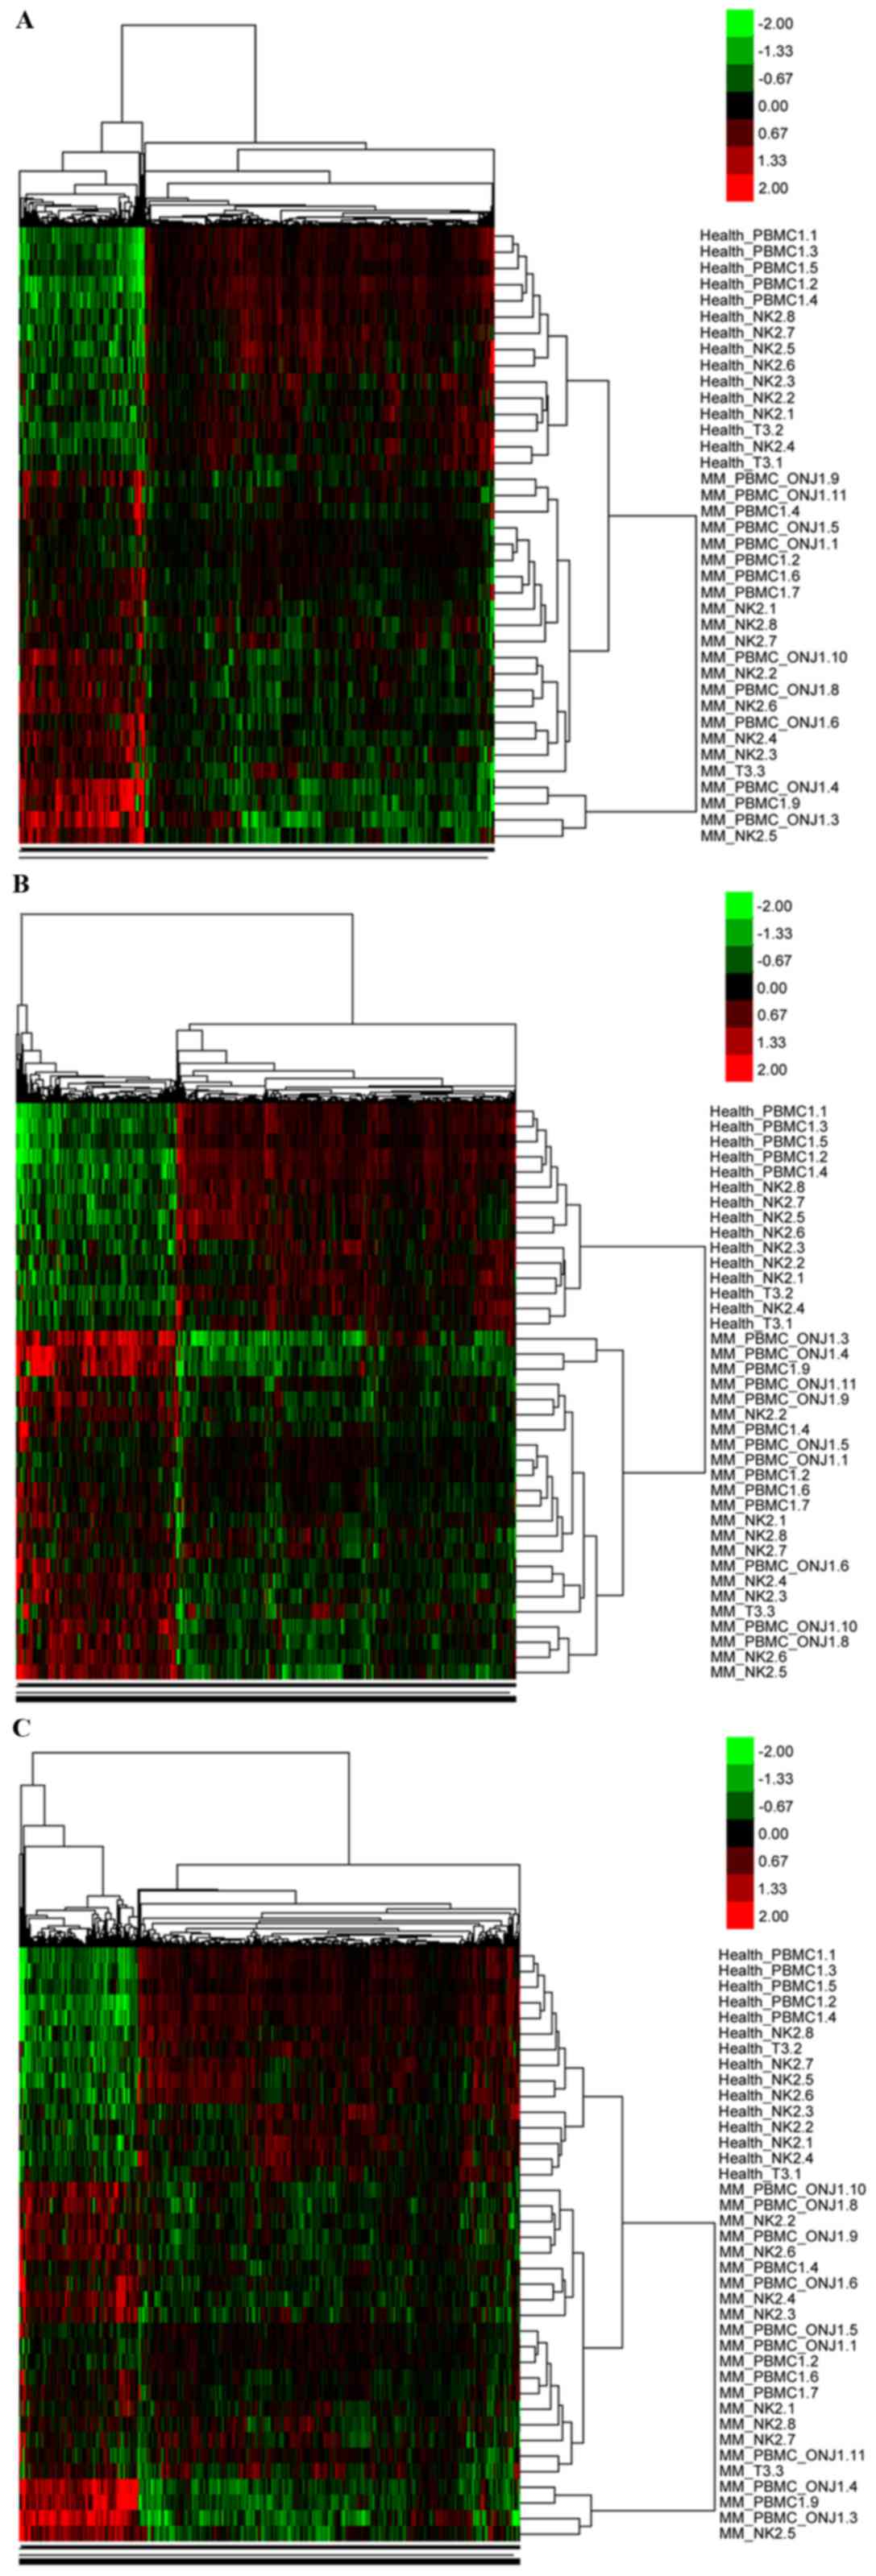
General gene expression pattern
The iterated application of Two-way Clustering and
unpaired student's t-test of these super array data produced the
largest general expression pattern of MM, compared with normal
samples (Fig. 1A). Among the 48
samples, 23 MM and 15 normal samples demonstrated this pattern;
3,823 differently expressed genes out of 13,193 common genes
(P<0.05) may potentially possess such a gene expression
feature.
Significantly and differentially
expressed genes
Within the general expression pattern of the super
array data, 620 genes were identified as significantly expressed
using the SAM software, including 379 up regulated and 241 down
regulated genes (Fig. 1B). In
addition, genes with a higher coefficient above CRISP3 (for CRISP3,
the coefficient was 3.57) conformed to the general expression
pattern predicted by unsupervised clustering and supervised
classification (Fig. 1C).
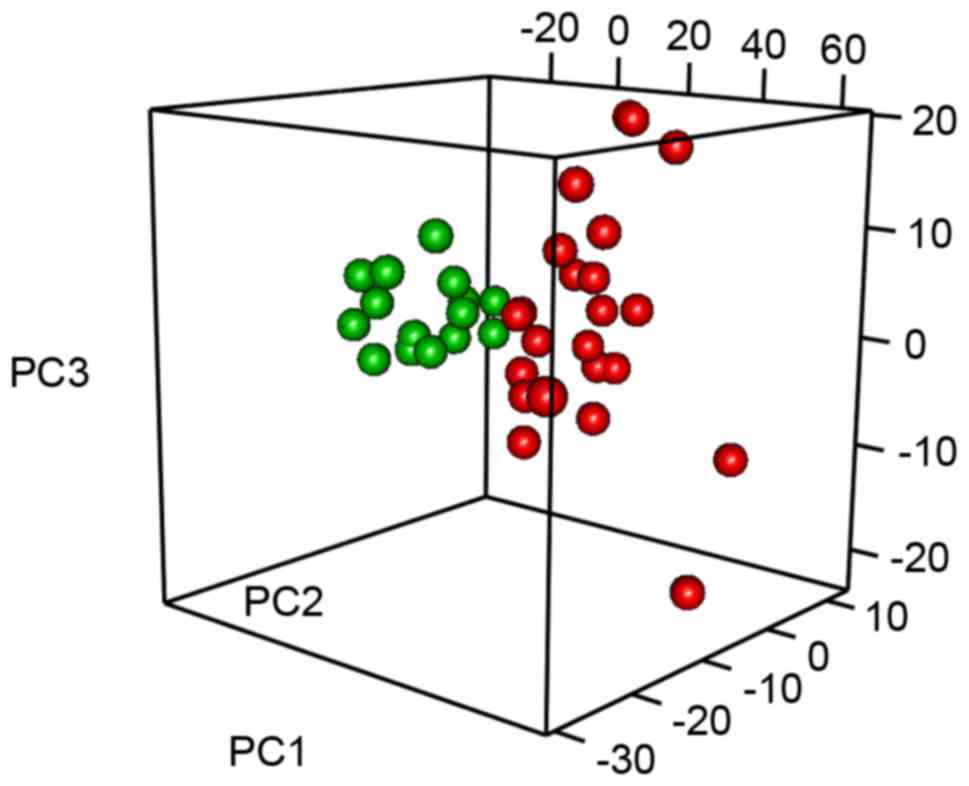
Principal component and Bayesian
probit regression model
In an attempt to identify more valuable clues from
the complicated numeral data, the principal component of the super
array for MM peripheral blood was extracted. Each principal
component has a proportion that may be used for sample
classification, and those components with cumulative proportions
>85% may provide the primary description of the expression
profile of this disease. A total of 19 principal components, with a
cumulative proportion of 85.6%, were obtained. These were then used
to construct a Bayesian probit regression model. In this regression
analysis, only the significant principal component one (P<0.05)
was useful in distinguishing the disease. With this modeling, it
was identified that the MM samples and healthy controls were
clearly classified by the top 3 principal components (Fig. 2).
Gene annotations
Next, the significantly and differently expressed
genes were analyzed using the DAVID software for gene annotation
analysis, and 570 biological terms concerning the functions of
genes were obtained. The top 10 terms are summarized in Table III. The majority of these
significantly and differently expressed genes are involved in gene
expression processes, including acetylation, phosphorylation and
translation elongation.
| Table III.Annotation and functional enrichment
of differentially expressed genes. |
Table III.
Annotation and functional enrichment
of differentially expressed genes.
| Gene number | Category | Term | Count | % | FDR |
|---|
| 1 |
SP_PIR_KEYWORDS | Acetylation | 319 | 1.96 | 3.10E-29 |
| 2 |
SP_PIR_KEYWORDS | Phosphoprotein | 658 | 4.04 | 2.32E-28 |
| 3 |
SP_PIR_KEYWORDS | Ribosome | 36 | 0.22 | 9.95E-20 |
| 4 | GOTERM_BP_FAT |
GO:0006414~translational elongation | 43 | 0.26 | 5.86E-19 |
| 5 |
SP_PIR_KEYWORDS | Protein
biosynthesis | 55 | 0.34 | 1.70E-18 |
| 6 | KEGG_PATHWAY | hsa03010:
Ribosome | 40 | 0.25 | 1.03E-17 |
| 7 | GOTERM_CC_FAT |
GO:0022626~cytosolic ribosome | 36 | 0.22 | 7.29E-17 |
| 8 |
SP_PIR_KEYWORDS |
Ribonucleoprotein | 65 | 0.40 | 1.34E-16 |
| 9 | GOTERM_CC_FAT |
GO:0005829~cytosol | 177 | 1.09 | 1.08E-15 |
| 10 | GOTERM_CC_FAT |
GO:0044445~cytosolic part | 46 | 0.28 | 1.62E-14 |
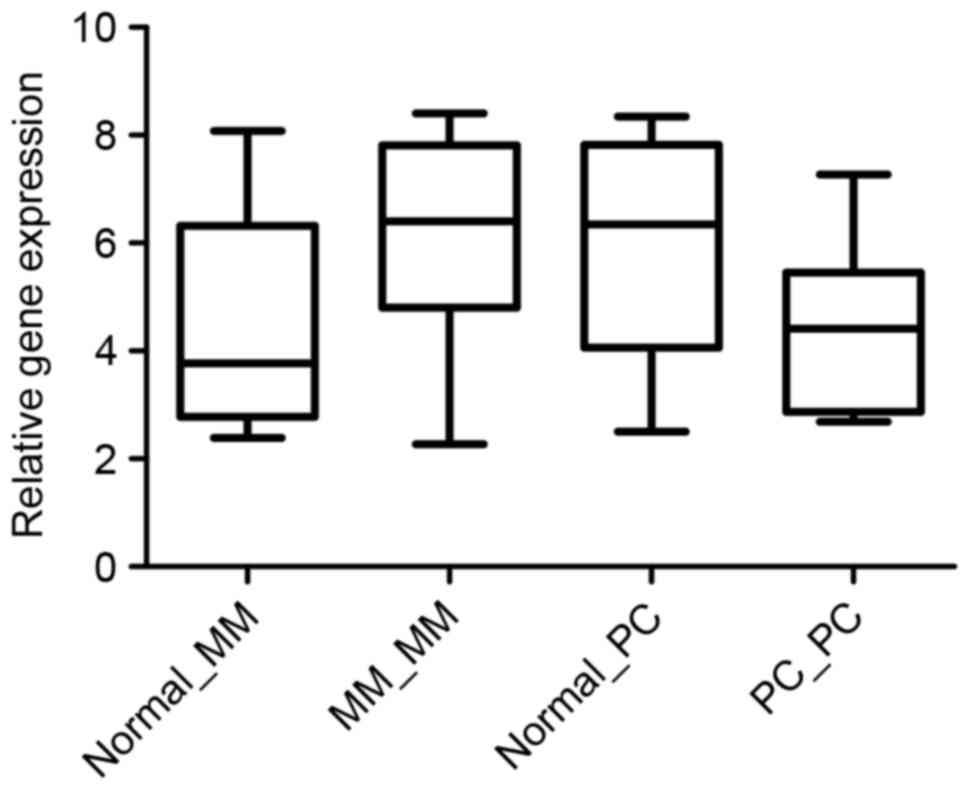
CRISP3gene expression across MM normal
and MM, and PC normal and PC in whole blood samples of the GEO
profiles
In order to validate the gene expression of
crisp3 in other types of cancer, the super array data
comparing MM and the corresponding normal control peripheral blood
samples were re-normalized to the microarray data comparing PC and
the corresponding normal control. The microarray data of PC and
normal peripheral blood samples were downloaded from the GEO
profile data of GSE30174 (22). The
relative gene expression levels of CRISP3 were plotted according to
the normalized gene expression data in each study (Fig. 3). Crisp3 was significantly
upregulated (P<0.05) in MM compared with the corresponding
normal control sample. However, the expression of CRISP3 was not
significantly altered between peripheral blood samples of PC and
the corresponding controls.
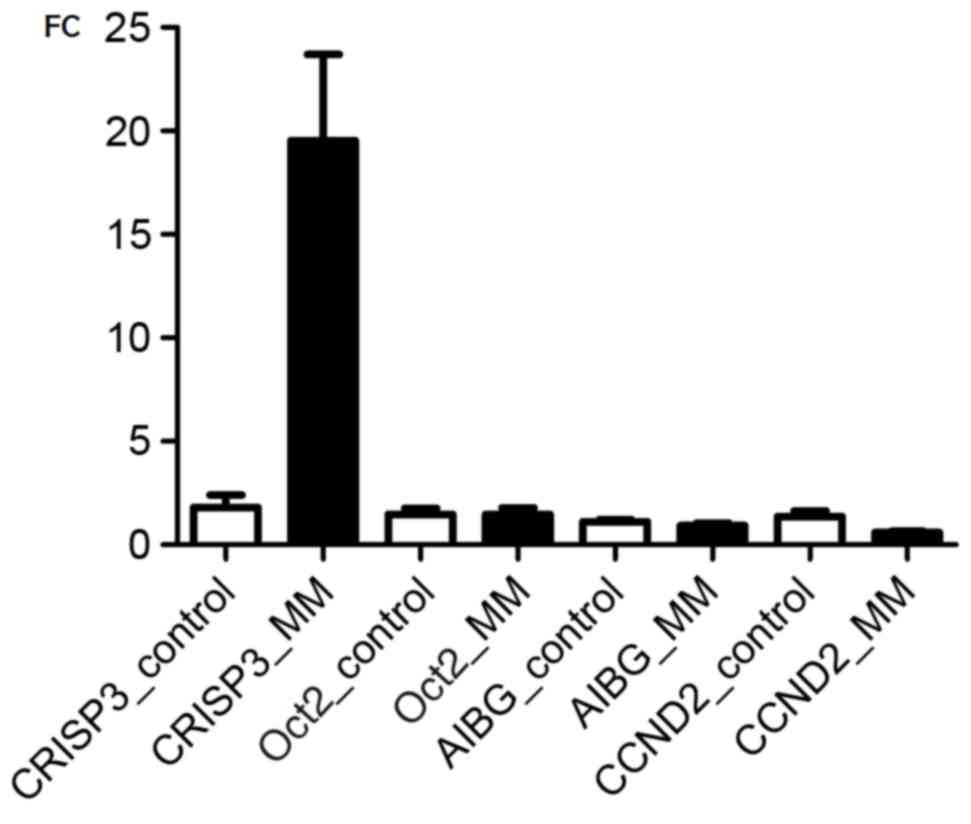
Transcriptional changes of genes
validated by RT-qPCR
CRISP3 possesses the Oct2 binding sequence and is
activated by Oct2 in mouse B cells (6–8). A1BG is a
secreted protein that exhibits a high affinity with CRISP3, and was
identified to be over expressed in cervical intraepithelial
neoplasia (23). CCND2 is a cellular
cyclin that has been previously demonstrated to be upregulated in
MM (24). In the present study, gene
expression of CRISP3, A1BG, CCND2 and Oct2 were additionally
validated in whole peripheral blood samples from healthy controls
and patients with MM by RT-qPCR (Fig.
4). In comparison to that of peripheral blood samples from
healthy controls, CRISP3 was significantly up regulated, with an
~10-fold increase in peripheral blood samples from patients with MM
(P<0.0001), while Oct2 was significantly down regulated
(P<0.05) with an ~2.5-fold decrease. However, there was no
significant difference in the expression of A1BG and Oct2 in
peripheral blood between patients with MM and normal controls.
Discussion
IgH translocation leads to the over expression of
oncogenes juxtaposed to the IgH enhancers (4,25,26). Although it is generally accepted that
IgH translocation occurs frequently either in malignant MM or MGUS
(4), little is known about the exact
mechanism of MM development. The transcriptional factors Oct2 and
B-cell-specific coactivator OBF-1 may activate the expression of
IgH by directly binding to the consensus ATGCAAAT octamer, which
also exists on the CRISP3 gene (6,27).
Previous studies have indicated that the gene expression of CRISP3
was markedly up regulated in prostate carcinoma and closely
associated with neoplastic epithelium (27,28).
Additionally, CRISP3, together with Transcription regulator ERG and
Phosphatase and tensin homolog, defined a molecular subtype of
poorest clinical outcomes (27,28),
suggesting that CRISP3 is a potential biomarker for prostate
cancer. In addition, CRISP3 expression has been demonstrated to be
altered in chronic pancreatitis and oral squamous cell carcinoma
(29,30). Furthermore, it was identified that
CRISP3was activated by Oct2 in mouse B cells (6–8).
Nevertheless, the expression status of CRISP3 and its potential as
a peripheral blood biomarker in human MM remains to be
determined.
Data of human peripheral blood samples from the GEO
repository may be merged together to produce a large sample data,
and this super array data possesses a distinguished expression
pattern, as observed in previous studies that used tissue samples
(31,32). The present study identified that the
gene expression of MM peripheral blood also possessed a marked
pattern, even in the merged data. Particularly, all MM samples
including peripheral blood mononuclear cells, Natural killer cells
or even T cells were clustered together with no bias, compared with
healthy controls. This additionally indicates that such expression
patterns do not change in peripheral blood by sample type. Notably,
the present study revealed that in human peripheral blood samples,
CRISP3 was significantly up regulated in the gene expression
profiling data from the GEO repository and in the clinical samples.
The expression of CRISP3 was significantly up regulated in the
unsupervised clustering and supervised classification, indicating
that this change is stable. In addition, 19 principal components
were extracted from the preprocessed data to produce only 1 marked
component by the Bayesian probit regression analysis, and CRISP3
did have certain proportions on this component. Although the
expression of CRISP3 was identified to be significantly up
regulated in PC tissue in previous studies (28,33), there
was no significant difference in CRISP3 expression between PC and
normal control peripheral blood samples. These results indicate
that CRISP3 may be used as a potential associated biomarker in
peripheral blood. In addition, significantly expressed gene
enrichment revealed characteristics for MM peripheral blood; for
instance, acetylation and phosphorylation. Compared with healthy
controls, these biological features of MM peripheral blood samples
may partially verify that chromosome change is one of the key
events in MM development. However, gene annotation and functional
enrichment analysis did not indicate any evidence of CRISP3
participating in the events associated with MM development, which
is probably due to the limitation of present studies on gene
function. Therefore, future studies on the role of CRISP3 in
chromosome translocation may provide novel insights into the
pathogenesis of MM. Furthermore, the expression pattern of CRISP3
in the merged data did not indicate any indications of features for
disease progression or for patient prognosis. Additional studies on
the role of CRISP3 in different stages of MM will provide novel
insight into the precise mechanism of CRISP3 in MM
pathogenesis.
Additional experimental validation by RT-qPCR
confirmed the observations from the analysis of microarray data.
The gene expression of CRISP3 was significantly up regulated in
clinical samples from patients with MM patient, while the oncogene
CCND2 was down regulated in the MM samples of the present study.
Future investigations are required to determine crisp3 expression
at the protein level and the mechanism of the up regulation of
CRISP3 in bone marrow cells.
To the best of our knowledge, the present study is
the first to investigate the gene expression of human peripheral
blood by combing multiple studies in the GEO repository, and has
identified distinct expression patterns in the principal component
of the merged large sample data, which was additionally validated
by clinical peripheral samples. Most importantly, the present study
has revealed that CRISP3 is significantly over expressed in MM
peripheral blood samples. These data suggest that CRISP3 is an
associated novel peripheral blood biomarker of MM.
Acknowledgements
Not applicable.
Funding
The present study was financially supported by the
Beijing Natural Science Foundation (grant nos. 7154198 and
7162069), the National Natural Science Foundation of China (grant
nos. 81700061 and 81300044), Beijing Municipal Administration of
Hospitals' Youth Programme (grant no. QML20160301) and the open
project of Beijing Key Laboratory of Respiratory and Pulmonary
Circulation Disorders (grant no. 2014HXFB03).
Availability of data and materials
All relevant data, including the combined super
array data and the CONOR_1.0.1 package, are available upon request
from the corresponding author.
Authors' contributions
Designed the study: DL. Performed the experiments:
DL, RM, XH, YW. Analysed the data: DL, RM. Contributed reagents,
materials or analysis tools: DL. Wrote the paper: DL, RM. All
authors have read and approved the content.
Ethics approval and consent to
participate
All experiments were approved by the Ethics
Committee of Beijing Chao-Yang Hospital and written informed
consent to participate in this study was obtained from each
participant.
Consent for publication
Written informed consent was obtained from each
participant.
Competing interests
The authors declare that they have no competing
interests.
References
|
1
|
Leich E, Weißbach S, Klein HU, Grieb T,
Pischimarov J, Stühmer T, Chatterjee M, Steinbrunn T, Langer C,
Eilers M, et al: Multiple myeloma is affected by multiple and
heterogeneous somatic mutations in adhesion- and receptor tyrosine
kinase signaling molecules. Blood Cancer J. 3:e1022013. View Article : Google Scholar : PubMed/NCBI
|
|
2
|
Schmidt-Hieber M, Gutiérrez ML,
Pérez-Andrés M, Paiva B, Rasillo A, Tabernero MD, Sayagués JM,
Lopez A, Bárcena P, Sanchez ML, et al: Cytogenetic profiles in
multiple myeloma and monoclonal gammopathy of undetermined
significance: A study in highly purified aberrant plasma cells.
Haematologica. 98:279–287. 2013. View Article : Google Scholar : PubMed/NCBI
|
|
3
|
Keats JJ, Maxwell CA, Taylor BJ, Hendzel
MJ, Chesi M, Bergsagel PL, Larratt LM, Mant MJ, Reiman T, Belch AR
and Pilarski LM: Overexpression of transcripts originating from the
MMSET locus characterizes all t(4;14)(p16;q32)-positive multiple
myeloma patients. Blood. 105:4060–4069. 2005. View Article : Google Scholar : PubMed/NCBI
|
|
4
|
Toman I, Loree J, Klimowicz AC, Bahlis N,
Lai R, Belch A, Pilarski L and Reiman T: Expression and prognostic
significance of Oct2 and Bob1 in multiple myeloma: Implications for
targeted therapeutics. Leuk Lymphoma. 52:659–667. 2011. View Article : Google Scholar : PubMed/NCBI
|
|
5
|
Szudyszczyrek A, Szczyrek M,
Sorokawojtaszko M and Hus M: New prognostic biomarkers in multiple
myeloma. Postepy Hig Med Dosw (Online). 70:811–819. 2016.
View Article : Google Scholar : PubMed/NCBI
|
|
6
|
Pfisterer P, König H, Hess J, Lipowsky G,
Haendler B, Schleuning WD and Wirth T: CRISP-3, a protein with
homology to plant defense proteins, is expressed in mouse B cells
under the control of Oct2. Mol Cell Biol. 16:6160–6168. 1996.
View Article : Google Scholar : PubMed/NCBI
|
|
7
|
Wirth T, Pfisterer P, Annweiler A,
Zwilling S and König H: Molecular principals of Oct2-mediated gene
activation in B cells. Immunobiology. 193:161–170. 1995. View Article : Google Scholar : PubMed/NCBI
|
|
8
|
Udby L, Cowland JB, Johnsen AH, Sørensen
OE, Borregaard N and Kjeldsen L: An ELISA for SGP28/CRISP-3, a
cysteine-rich secretory protein in human neutrophils, plasma, and
exocrine secretions. J Immunol Methods. 263:43–55. 2002. View Article : Google Scholar : PubMed/NCBI
|
|
9
|
Raje N, Woo SB, Hande K, Yap JT,
Richardson PG, Vallet S, Treister N, Hideshima T, Sheehy N, Chhetri
S, et al: Clinical, radiographic, and biochemical characterization
of multiple myeloma patients with osteonecrosis of the jaw. Clin
Cancer Res. 14:2387–2395. 2008. View Article : Google Scholar : PubMed/NCBI
|
|
10
|
Garg TK, Szmania SM, Khan JA, Hoering A,
Malbrough PA, Moreno-Bost A, Greenway AD, Lingo JD, Li X, Yaccoby
S, et al: Highly activated and expanded natural killer cells for
multiple myeloma immunotherapy. Haematologica. 97:1348–1356. 2012.
View Article : Google Scholar : PubMed/NCBI
|
|
11
|
Kiaii S, Clear AJ, Ramsay AG, Davies D,
Sangaralingam A, Lee A, Calaminici M, Neuberg DS and Gribben JG:
Follicular lymphoma cells induce changes in T-cell gene expression
and function: Potential impact on survival and risk of
transformation. J Clin Oncol. 31:2654–2661. 2013. View Article : Google Scholar : PubMed/NCBI
|
|
12
|
Rhodes DR, Barrette TR, Rubin MA, Ghosh D
and Chinnaiyan AM: Meta-analysis of microarrays: Interstudy
validation of gene expression profiles reveals pathway
dysregulation in prostate cancer. Cancer Res. 62:4427–4433.
2002.PubMed/NCBI
|
|
13
|
Barrett T and Edgar R: Gene expression
omnibus: Microarray data storage, submission, retrieval, and
analysis. Methods Enzymol. 411:352–369. 2006. View Article : Google Scholar : PubMed/NCBI
|
|
14
|
Rudy J and Valafar F: Empirical comparison
of cross-platform normalization methods for gene expression data.
BMC Bioinformatics. 12:4672011. View Article : Google Scholar : PubMed/NCBI
|
|
15
|
Shabalin AA, Tjelmeland H, Fan C, Perou CM
and Nobel AB: Merging two gene-expression studies via
cross-platform normalization. Bioinformatics. 24:1154–1160. 2008.
View Article : Google Scholar : PubMed/NCBI
|
|
16
|
Shain KH and Dalton WS: Genetic and
environmental determinants in multiple myeloma: Implications for
therapy. Springer Netherlands. 14:53–82. 2012.
|
|
17
|
Mattioli M, Agnelli L, Fabris S, Baldini
L, Morabito F, Bicciato S, Verdelli D, Intini D, Nobili L, Cro L,
et al: Gene expression profiling of plasma cell dyscrasias reveals
molecular patterns associated with distinct IGH translocations in
multiple myeloma. Oncogene. 24:2461–2473. 2005. View Article : Google Scholar : PubMed/NCBI
|
|
18
|
Huang da W, Sherman BT and Lempicki RA:
Systematic and integrative analysis of large gene lists using DAVID
bioinformatics resources. Nat Protoc. 4:44–57. 2009. View Article : Google Scholar : PubMed/NCBI
|
|
19
|
Huang da W, Sherman BT and Lempicki RA:
Bioinformatics enrichment tools: Paths toward the comprehensive
functional analysis of large gene lists. Nucleic Acids Res.
37:1–13. 2009. View Article : Google Scholar : PubMed/NCBI
|
|
20
|
Livak KJ and Schmittgen TD: Analysis of
relative gene expression data using real-time quantitative PCR and
the 2(-Delta Delta C(T)) method. Methods. 25:402–408. 2001.
View Article : Google Scholar : PubMed/NCBI
|
|
21
|
Tusher VG, Tibshirani R and Chu G:
Significance analysis of microarrays applied to the ionizing
radiation response. Proc Natl Acad Sci USA. 98:pp. 5116–5121. 2001;
View Article : Google Scholar : PubMed/NCBI
|
|
22
|
Saligan LN, Hsiao CP, Wang D, Wang XM, St
John L, Kaushal A, Citrin D, Barb JJ, Munson PJ and Dionne RA:
Upregulation of alpha-synuclein during localized radiation therapy
signals the association of cancer-related fatigue with the
activation of inflammatory and neuroprotective pathways. Brain
Behav Immun. 27:63–70. 2013. View Article : Google Scholar : PubMed/NCBI
|
|
23
|
Canales NA, Marina VM, Castro JS, Jiménez
AA, Mendoza-Hernández G, McCARRON EL, Roman MB and Castro-Romero
JI: A1BG and C3 are overexpressed in patients with cervical
intraepithelial neoplasia III. Oncol Lett. 8:939–947. 2014.
View Article : Google Scholar : PubMed/NCBI
|
|
24
|
Misiewicz-Krzeminska I, Sarasquete ME,
Vicente-Dueñas C, Krzeminski P, Wiktorska K, Quwaider D, Rojas EA,
Corral R, Corchete LA, Martin AA, et al: Post-Transcriptional
modifications explain the overexpression of CCND2 in multiple
myeloma. Blood. 124:20012014.PubMed/NCBI
|
|
25
|
Scheidereit C, Heguy A and Roeder RG:
Identification and purification of a human lymphoid-specific
octamer-binding protein (OTF-2) that activates transcription of an
immunoglobulin promoter in vitro. Cell. 51:783–793. 1987.
View Article : Google Scholar : PubMed/NCBI
|
|
26
|
Staudt LM, Singh H, Sen R, Wirth T, Sharp
PA and Baltimore D: A lymphoid-specific protein binding to the
octamer motif of immunoglobulin genes. Nature. 323:640–643. 1986.
View Article : Google Scholar : PubMed/NCBI
|
|
27
|
Al Bashir S, Alshalalfa M, Hegazy SA,
Dolph M, Donnelly B and Bismar TA: Cysteine-rich secretory protein
3 (CRISP3), ERG and PTEN define a molecular subtype of prostate
cancer with implication to patients' prognosis. J Hematol Oncol.
7:212014. View Article : Google Scholar : PubMed/NCBI
|
|
28
|
Ribeiro FR, Paulo P, Costa VL,
Barros-Silva JD, Ramalho-Carvalho J, Jerónimo C, Henrique R, Lind
GE, Skotheim RI, Lothe RA and Teixeira MR: Cysteine-rich secretory
protein-3 (CRISP3) is strongly Up-regulated in prostate carcinomas
with the TMPRSS2-ERG fusion gene. PLoS One. 6:e223172011.
View Article : Google Scholar : PubMed/NCBI
|
|
29
|
Liao Q, Kleeff J, Xiao Y, Guweidhi A,
Schambony A, Töpfer-Petersen E, Zimmermann A, Büchler MW and Friess
H: Preferential expression of cystein-rich secretory protein-3
(CRISP-3) in chronic pancreatitis. Histol Histopathol. 18:425–433.
2003.PubMed/NCBI
|
|
30
|
Ko WC, Sugahara K, Sakuma T, Yen CY, Liu
SY, Liaw GA and Shibahara T: Copy number changes of CRISP3 in oral
squamous cell carcinoma. Oncol Lett. 3:75–81. 2012. View Article : Google Scholar : PubMed/NCBI
|
|
31
|
López-Corral L, Corchete LA, Sarasquete
ME, Mateos MV, García-Sanz R, Fermiñán E, Lahuerta JJ, Bladé J,
Oriol A, Teruel AI, et al: Transcriptome analysis reveals molecular
profiles associated with evolving steps of monoclonal gammopathies.
Haematologica. 99:1365–1372. 2014. View Article : Google Scholar : PubMed/NCBI
|
|
32
|
André T, Meuleman N, Stamatopoulos B, De
Bruyn C, Pieters K, Bron D and Lagneaux L: Evidences of early
senescence in multiple myeloma bone marrow mesenchymal stromal
cells. PLoS One. 8:e597562013. View Article : Google Scholar : PubMed/NCBI
|
|
33
|
Grupp K, Kohl S, Sirma H, Simon R, Steurer
S, Becker A, Adam M, Izbicki J, Sauter G, Minner S, et al:
Cysteine-rich secretory protein 3 overexpression is linked to a
subset of PTEN-deleted ERG fusion-positive prostate cancers with
early biochemical recurrence. Mod Pathol. 26:733–742. 2013.
View Article : Google Scholar : PubMed/NCBI
|