Introduction
Hepatocellular carcinoma (HCC) is one of the most
common types of cancer in the world (1), and it was the third leading cause of
cancer-associated mortality worldwide in 2013 (2). A number of effective measures, including
percutaneous ablation, surgical resection and liver
transplantation, have been developed for HCC therapy (3). Although the short-term prognosis of
patients with HCC has improved due to advances in early diagnosis
and treatments, the long-term prognosis remains poor due to
frequent recurrence or metastasis (4).
HCC is a heterogeneous cancer that usually develops
in patients with chronic liver disease, particularly those with
cirrhosis. The progression between chronic liver disease and HCC is
a complex and multistep process. Chronic viral hepatitis caused by
hepatitis C virus (HCV) infection has become one of the main causes
of HCC. A typical HCV-induced HCC progression may undergo the
following five successive stages: Normal; cirrhosis; dysplasia;
early HCC; and advanced HCC (5).
In the development from hepatic lesions to HCC, not
only does the expression level of numerous genes change, but
dynamic changes may also appear in the regulation of different
genes and protein-protein interaction (6). Classical approaches, including
identification of differentially expressed genes, may not reveal
the complex interactions and functional association among genes in
biological processes. Alternatively, gene co-expressed network
analysis may provide a powerful approach for elucidating the
co-regulation and interaction between proteins in biological
processes (7). Comparing with
identification of differentially expressed genes network-based
analysis may provide valuable information for understanding complex
interaction among genes in biological processes (7,8). At
present, a number of studies have identified the altered gene
co-expression associated with tumors (9–11).
HCV is a type of single-stranded RNA virus that
replicates in the cytoplasm of host hepatocytes. HCV viral proteins
are mainly divided into two classes: Structural proteins (CORE,
envelope proteins 1 and 2 and p7) and non-structural (NS) proteins
(NS2, NS3, NS4B, NS5A and NS5B) (12). Multiple important HCV viral proteins,
including CORE, NS3, NS4B and NS5A, were identified to target
important cancer-associated proteins. These proteins can promote
cell growth and cell cycle deregulation and destroy the stable
structure of the host cell genome. These viral proteins were
revealed to potentiate oncogenic transformation (12) and perform crucial roles in HCC
(13).
However, the exact role of HCV in HCC progression
remains to be determined. Therefore, studying the association
between the deregulated biological networks and HCV may help to
understand the molecular mechanisms of HCC development.
Materials and methods
Microarray data and differentially
expressed genes
The HCC gene expression dataset GSE6764 (CEL file)
was downloaded (14) from the Gene
Expression Omnibus database (15).
GSE6764 was based on the GPL570 platform: Affymetrix Human Genome
U133 Plus 2.0 Array (Affymetrix; Thermo Fisher Scientific, Inc.,
Waltham, MA, USA). The dataset contained 75 tissue samples
representing the stepwise carcinogenic process from pre-neoplastic
lesions (cirrhosis and dysplasia) to HCC. The raw sample groups
were categorized into five groups: Normal; cirrhosis; dysplasia,
including low-grade dysplastic nodules and high-grade dysplastic
nodules; early HCC group, including early HCC and extremely early
HCC; and advanced HCC group, including advanced HCC and extremely
advanced HCC. The numbers of samples contained in these groups were
10, 13, 17, 18 and 17, respectively.
The Robust Multichip Analysis (RMA) algorithm in the
‘affy’ package (16) (http://www.bioconductor.org/packages/3.6/bioc/html/affy.html)
in Bioconductor (17) (http://www.bioconductor.org/) was used to perform
background correction, quantile normalization and summarization.
For multiple probe sets matching to the same gene, the probes with
the largest variation were selected. The linear models for
microarray and RNA-sequencing data (LIMMA) software package
(https://bioconductor.org/packages/release/bioc/html/limma.html,
The Walter and Eliza Hall Institute of Medical Research, Melbourne,
Australia, Version 3.24.15) (18) in
Bioconductor was utilized for linear models and testing for
differential expression, and to adjust for multiple testing.
t-tests and F-tests were performed on the matrix. The genes with
2-fold expression change (increase or decrease) (P<0.001) and a
false discovery rate (FDR) <0.05, compared with the normal
group, were selected as differential expression genes (DEGs) in
each disease stage. To reveal the expression dynamic of DEGs across
all stages, the DEGs in each stage were merged into a DEG set for
subsequent analysis.
Analysis of the modules significantly
associated with disease progression
In order to identify the modules of highly
correlated genes involved in disease progression, Weighted Gene
Co-expression Network Analysis (WGCNA) software (https://labs.genetics.ucla.edu/horvath/CoexpressionNetwork/Rpackages/WGCNA/)
(19) was implemented in R language
(https://cran.r-project.org/, version
3.2.2). First, the WGCNA package computed co-expressed association
among genes in the DEG set and inferred the co-expressed networks
in 75 samples. Based on a scale-free topology criterion (20), β=12 was selected as the soft threshold
power in the present study. Deep split was set as 2, cut height was
set as 0.975 and ‘minModuleSize’ was set as 10, and other
parameters were set at default levels.
Module eigengene (ME) is the first principle
component and explains the majority of information of the module
genes. To identify modules that were significantly associated with
disease progression, Spearman's rank correlation coefficient was
used to analyze the association between the ME of each module and
disease stages. Modules that were significantly correlated with
disease progression were labeled as candidate modules (absolute
correlation coefficient |r|>0.8; P<0.01).
Screening for the key genes
significantly associated with disease progression
The present study aimed to identify key genes with
functional similarity and high co-expression over all disease
developmental stages that were significantly associated with
disease progression. The expression pattern of these genes may
reflect the trajectory of disease progression. In candidate
modules, the genes with absolute gene significance value (GS)
>0.75 and modular membership (MM) >0.8 were selected as genes
that were highly associated with disease stages. To exclude the
gene pairs with lower correlation in all disease stages, the
correlation coefficient between all reserved gene pairs were
examined. A threshold of |r|=0.85 (P<0.01) was set as the
screening criterion. The gene pairs with an absolute correlation
coefficient higher than this threshold were retained. The Database
for Annotation, Visualization and Integrated Discovery 6.7 (DAVID,
https://david-d.ncifcrf.gov/) (21) was utilized to assess the function of
these genes. By Gene Ontology (GO) enrichment analysis, the genes
with functions associated with disease progression were retained.
The heatmap and self-organizing tree algorithm (SOTA) (22) in cogena package (http://www.bioconductor.org/packages/3.2/bioc/html/cogena.html)
was implemented for clustering and visualization of expression
patterns of the key genes.
Analysis of the interactions among the
key genes
GeneMANIA (http://genemania.org/) (23,24) is a
web-based tool for the construction of the composite gene-gene
functional interaction network and the prediction of protein
function, based on multiple networks derived from different
databases. The interactions among key genes, including physical and
genetic interactions, pathways, co-expression, co-localization,
shared protein domain and predicted interactions were analyzed
using GeneMANIA.
Differential co-expressed analysis of
the key genes
The genes retained as seeds were used to search for
highly co-expressed genes (absolute correlation coefficient
|r|>0.85, P<0.01) in the DEG set in which seed genes were
ruled out in each stage. The software package DiffCorr (https://sourceforge.net/projects/diffcorr/, Version
0.4.1, Slashdot media and dice, Inc., San Jose, CA, USA) (25) in R language was used to search for the
differential correlation gene pairs between adjacent stages.
Fisher's z-test was used to identify significant differences
between adjacent stages. First, the correlation coefficients for
each of the two adjacent stages were transformed into z by Fisher's
transformation, separately as follows:
z=12log1+r1–r
Then, differences between the two correlation
coefficients were tested using the equation:
Z=za–zb1na–3+1nb–3
na and nb represent the sample
size for each of the disease stages for each gene pair. The gene
pairs with FDR<0.05 and P<0.001 of differential correlations
were considered as differential coexpression between adjacent
phases.
Cytoscape software (http://www.cytoscape.org/, version 3.2; Cytoscape
Consortium, La Jolla, CA, USA) (26)
was used for the construction of a differentially co-expressed
network of the key genes.
Construction of interaction networks
between HCV viral proteins and products of key genes
Search Tool for the Retrieval of Interacting Genes
(STRING) (http://version10.string-db.org/, version 10.0) is an
online protein-protein interaction association database curated
from experimental interactions of proteins and comprehensive
information (27). First, the key
genes were directly mapped to the STRING database to get pairwise
interactions (combined scores >0.4). Next, the HCV viral
proteins and their directly targeted proteins in the key genes set
were extracted from the literature and a comprehensive interaction
dataset containing 481 interaction pairs between HCV viral proteins
and human proteins from yeast two-hybrid experiments (28). Furthermore, the interaction network of
the key genes and the interaction network between HCV and their
targeted proteins were combined to make an interaction network
between HCV viral proteins and key genes, by anchoring the
overlapped proteins of these two networks. The interaction network
between HCV viral proteins and key genes was visualized using
Cytoscape software (26).
Results
DEGs between disease groups and normal
group
Subsequent to performing the RMA algorithm for data
preprocessing, the LIMMA software package (18) was run to obtain 509, 156, 802 and
1,501 DEGs from the cirrhosis, dysplasia, early HCC and advanced
HCC groups, respectively. The DEGs from each disease group were
merged into a gene set, termed the DEG set, which contained a total
of 1,973 genes.
Identified modules associated with the disease
progression. It was hypothesized that there are core gene modules
that can exhibit the disease progression dynamic. It is thought
that genes with similar expression patterns and similar functions
may be regulated by the same mechanisms (29). Therefore, the modules consisting of
genes with similar expression patterns and similar functions were
expected to be identified via WGCNA (19). The expression profile of the DEG set
was used as the input of WGCNA.
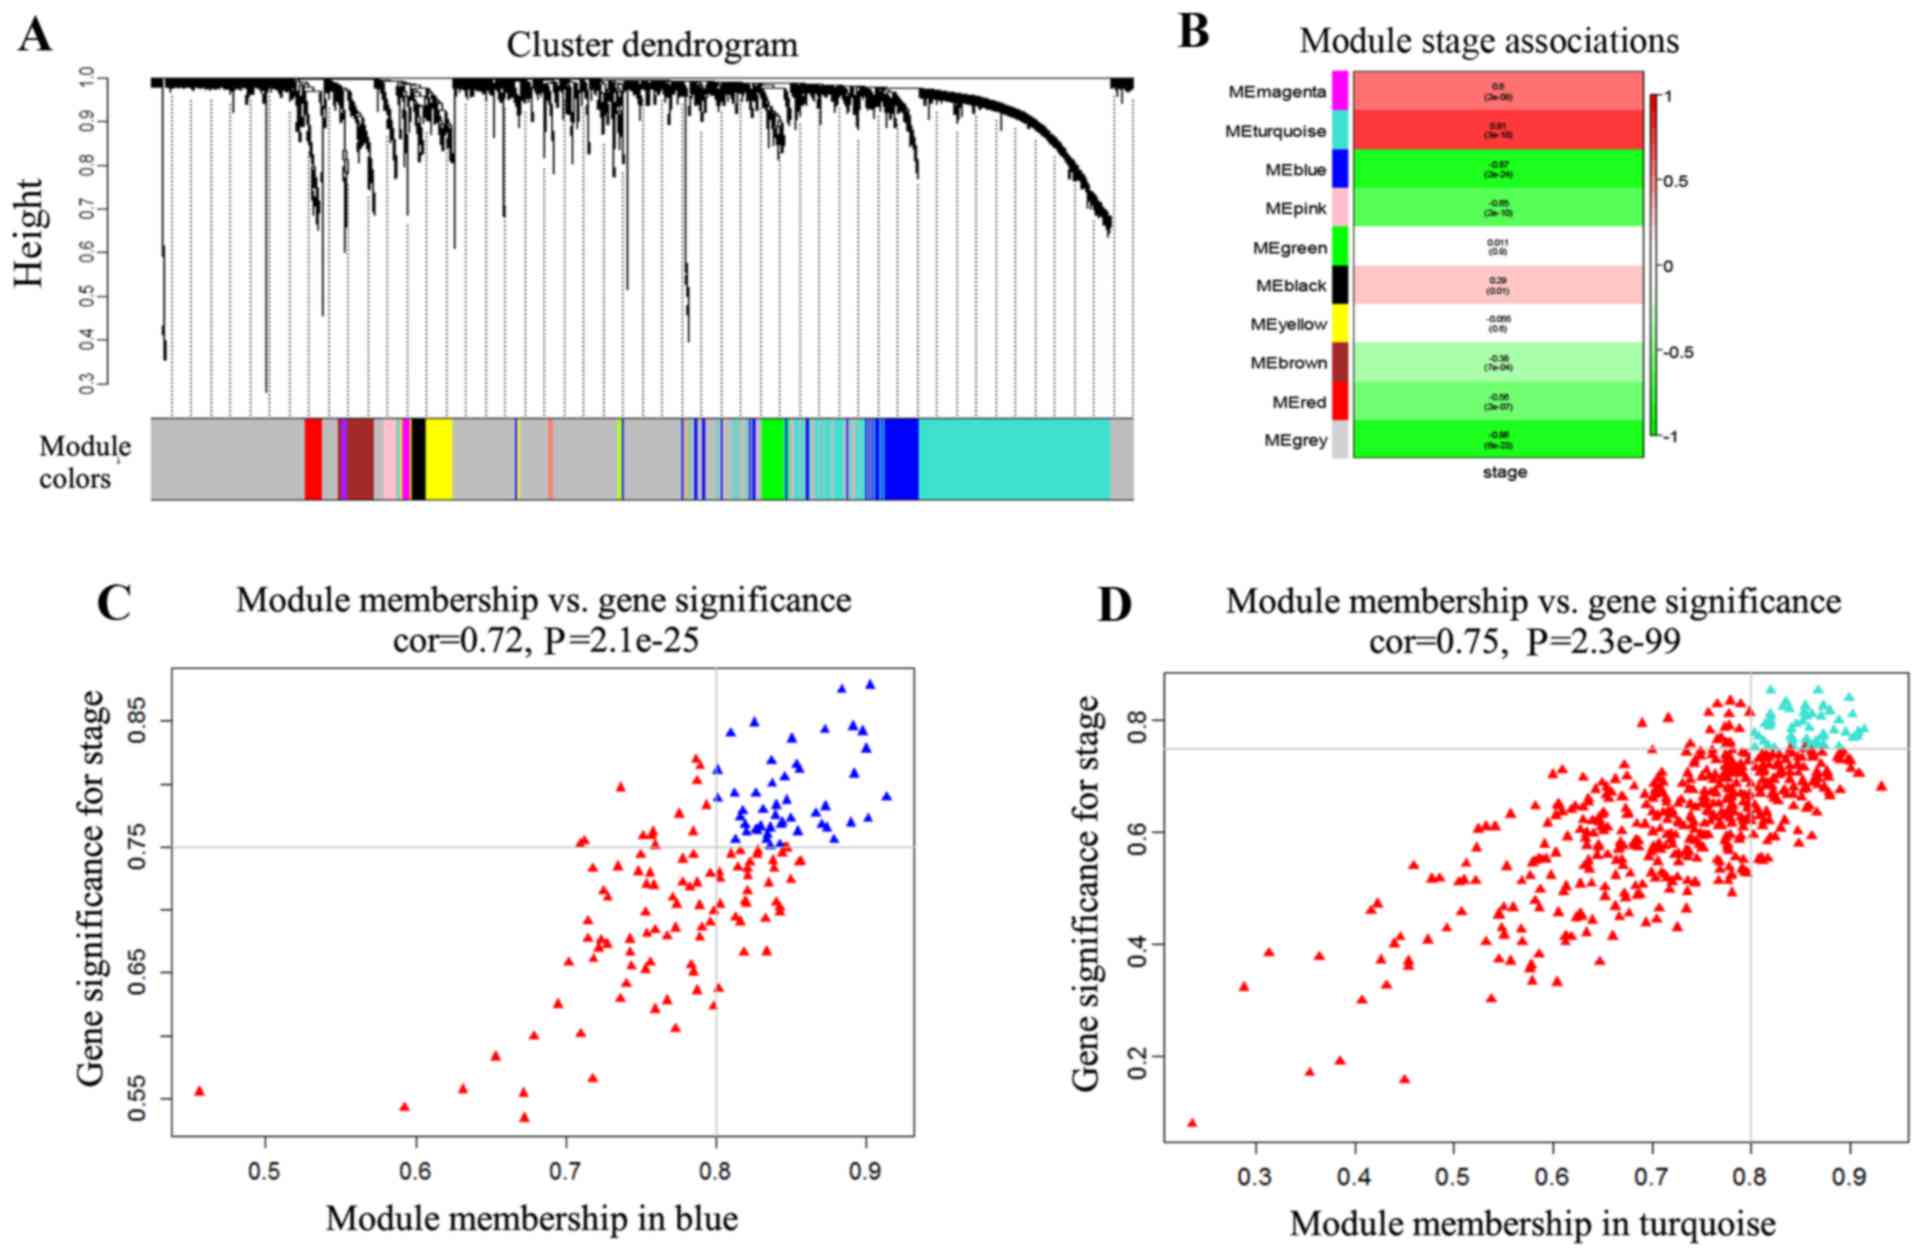
Based on the dissimilarity corresponding to the
Topological Overlap Matrix, hierarchical average linkage clustering
produced a hierarchical clustering tree (dendrogram) of genes. A
total of 10 modules corresponding to the 10 branches of the
dendrogram were obtained (Fig. 1A),
based on provided parameters. The modules were labeled by 10
colors. The sizes of the 10 modules were ranked between 11 and
1,018 genes. The grey module contained the genes with dissimilar
expression patterns.
In order to identify the association between the
modules and disease progression, MEs were utilized, instead of
single genes, as the overall expression levels of the module. The
association between MEs and disease progression obtained was
presented as a heatmap (Fig. 1B). In
the 10 modules, the most strongly associated with the disease stage
modules (|r|>0.8; P<0.01), the turquoise and blue modules,
were selected as the candidate modules. The turquoise module was
positively associated with disease stages, while the blue module
was negatively associated with disease stages.
Key genes associated with disease
development and progression
Since the genes in modules may not have equivalent
contribution to the association of the module with disease stages,
GS and MM were used to identify the genes highly associated with
disease stages in the two candidate modules. The numbers of
retained genes (|GS|>0.75 and |MM|>0.8) were 53 in the
turquoise module and 48 in the blue module (Fig. 1C and D). To yield the consistent
co-expression of genes in modules across all stages, the pairwise
correlation coefficient among genes in the two candidate modules
was examined. The genes that weakly correlated (|r|<0.85 or
P>0.01) with any gene in the same module were removed. Finally,
44 genes in the turquoise module and 31 genes in the blue module
were obtained. The significantly enriched GO terms are shown in
Tables I and II.
 | Table I.Significant functions of genes
retained in the blue module. |
Table I.
Significant functions of genes
retained in the blue module.
| Term | Name | P-value |
|---|
| GO:0030246 | Carbohydrate
binding |
1.78×10⁻⁶ |
| GO:0005529 | Sugar binding |
1.96×10⁻⁵ |
| GO:0016485 | Protein
processing |
7.59×10⁻⁴ |
| GO:0051604 | Protein
maturation |
9.72×10⁻⁴ |
| GO:0006956 | Complement
activation |
2.09×10⁻³ |
| GO:0002541 | Activation of
plasma proteins involved in acute inflammatory response |
2.19×10⁻³ |
| GO:0005509 | Calcium ion
binding |
4.40×10⁻³ |
| GO:0006959 | Humoral immune
response |
7.21×10⁻³ |
| GO:0044421 | Extracellular
region part |
7.35×10⁻³ |
| GO:0005615 | Extracellular
space |
7.91×10⁻³ |
| GO:0051605 | Protein maturation
by peptide bond cleavage |
8.50×10⁻³ |
| GO:0009611 | Response to
wounding |
9.71×10⁻³ |
| GO:0001867 | Complement
activation, lectin pathway |
9.71×10⁻³ |
| Table II.Top 30 significant functions of genes
retained in the turquoise module. |
Table II.
Top 30 significant functions of genes
retained in the turquoise module.
| Term | Name | P-value |
|---|
| GO:0000278 | Mitotic cell
cycle |
1.58×10⁻²³ |
| GO:0000279 | M phase |
6.52×10⁻²³ |
| GO:0022403 | Cell cycle
phase |
1.68×10⁻²² |
| GO:0022402 | Cell cycle
process |
3.53×10⁻²¹ |
| GO:0007067 | Mitosis |
4.37×10⁻²¹ |
| GO:0000280 | Nuclear
division |
4.37×10⁻²¹ |
| GO:0000087 | M phase of mitotic
cell cycle |
5.96×10⁻²¹ |
| GO:0048285 | Organelle
fission |
8.73×10⁻²¹ |
| GO:0007049 | Cell cycle |
1.35×10⁻¹⁹ |
| GO:0051301 | Cell division |
6.69×10⁻¹⁹ |
| GO:0015630 | Microtubule
cytoskeleton |
1.60×10⁻¹⁵ |
| GO:0005819 | Spindle |
4.93×10⁻¹⁵ |
| GO:0044430 | Cytoskeletal
part |
1.94×10⁻¹¹ |
| GO:0005856 | Cytoskeleton |
1.07×10⁻¹⁰ |
| GO:0007346 | Regulation of
mitotic cell cycle |
2.78×10⁻¹⁰ |
| GO:0043228 |
Non-membrane-bounded organelle |
6.31×10⁻¹⁰ |
| GO:0043232 | Intracellular
non-membrane-bounded organelle |
6.31×10⁻¹⁰ |
| GO:0051726 | Regulation of cell
cycle |
1.06×10⁻⁹ |
| GO:0007093 | Mitotic cell cycle
checkpoint |
1.84×10⁻⁹ |
| GO:0007059 | Chromosome
segregation |
2.30×10⁻⁹ |
| GO:0000075 | Cell cycle
checkpoint |
1.82×10⁻⁷ |
| GO:0007017 | Microtubule-based
process |
4.03×10⁻⁷ |
| GO:0000922 | Spindle pole |
2.59×10⁻⁶ |
| GO:0000070 | Mitotic sister
chromatid segregation |
2.92×10⁻⁶ |
| GO:0000819 | Sister chromatid
segregation |
3.27×10⁻⁶ |
| GO:0005694 | Chromosome |
4.74×10⁻⁶ |
| GO:0051276 | Chromosome
organization |
5.86×10⁻⁶ |
| GO:0007051 | Spindle
organization |
7.26×10⁻⁶ |
| GO:0007052 | Mitotic spindle
organization |
9.09×10⁻⁶ |
For those retained genes in the blue module, the GO
terms that were significantly enriched were associated with
carbohydrate binding (GO:0030246), sugar binding (GO:0005529),
protein processing (GO:0016485), protein maturation (GO:0051604),
complement activation (GO:0006956) and activation of plasma
proteins involved in the acute inflammatory response (GO:0002541).
These genes may be involved in energy metabolism and protein
synthesis.
The GO terms that the genes retained in the
turquoise module significantly enriched included mitotic cell cycle
(GO:0000278), M phase (GO:0000279), cell cycle phase (GO:0022403),
cell cycle process (GO:0022402), mitosis (GO:0007067), nuclear
division (GO:0000280) and cell division (GO:0051301). In previous
studies the process of tumorigenesis, cell cycle regulation was
significantly altered and mitosis was significantly faster
(30). The protein associated with
cell cycle and mitosis notably changed along with tumorigenesis
(31). In the turquoise module, the
functions of these genes involved in the process of mitotic cell
cycle and cell division were associated with tumorigenesis.
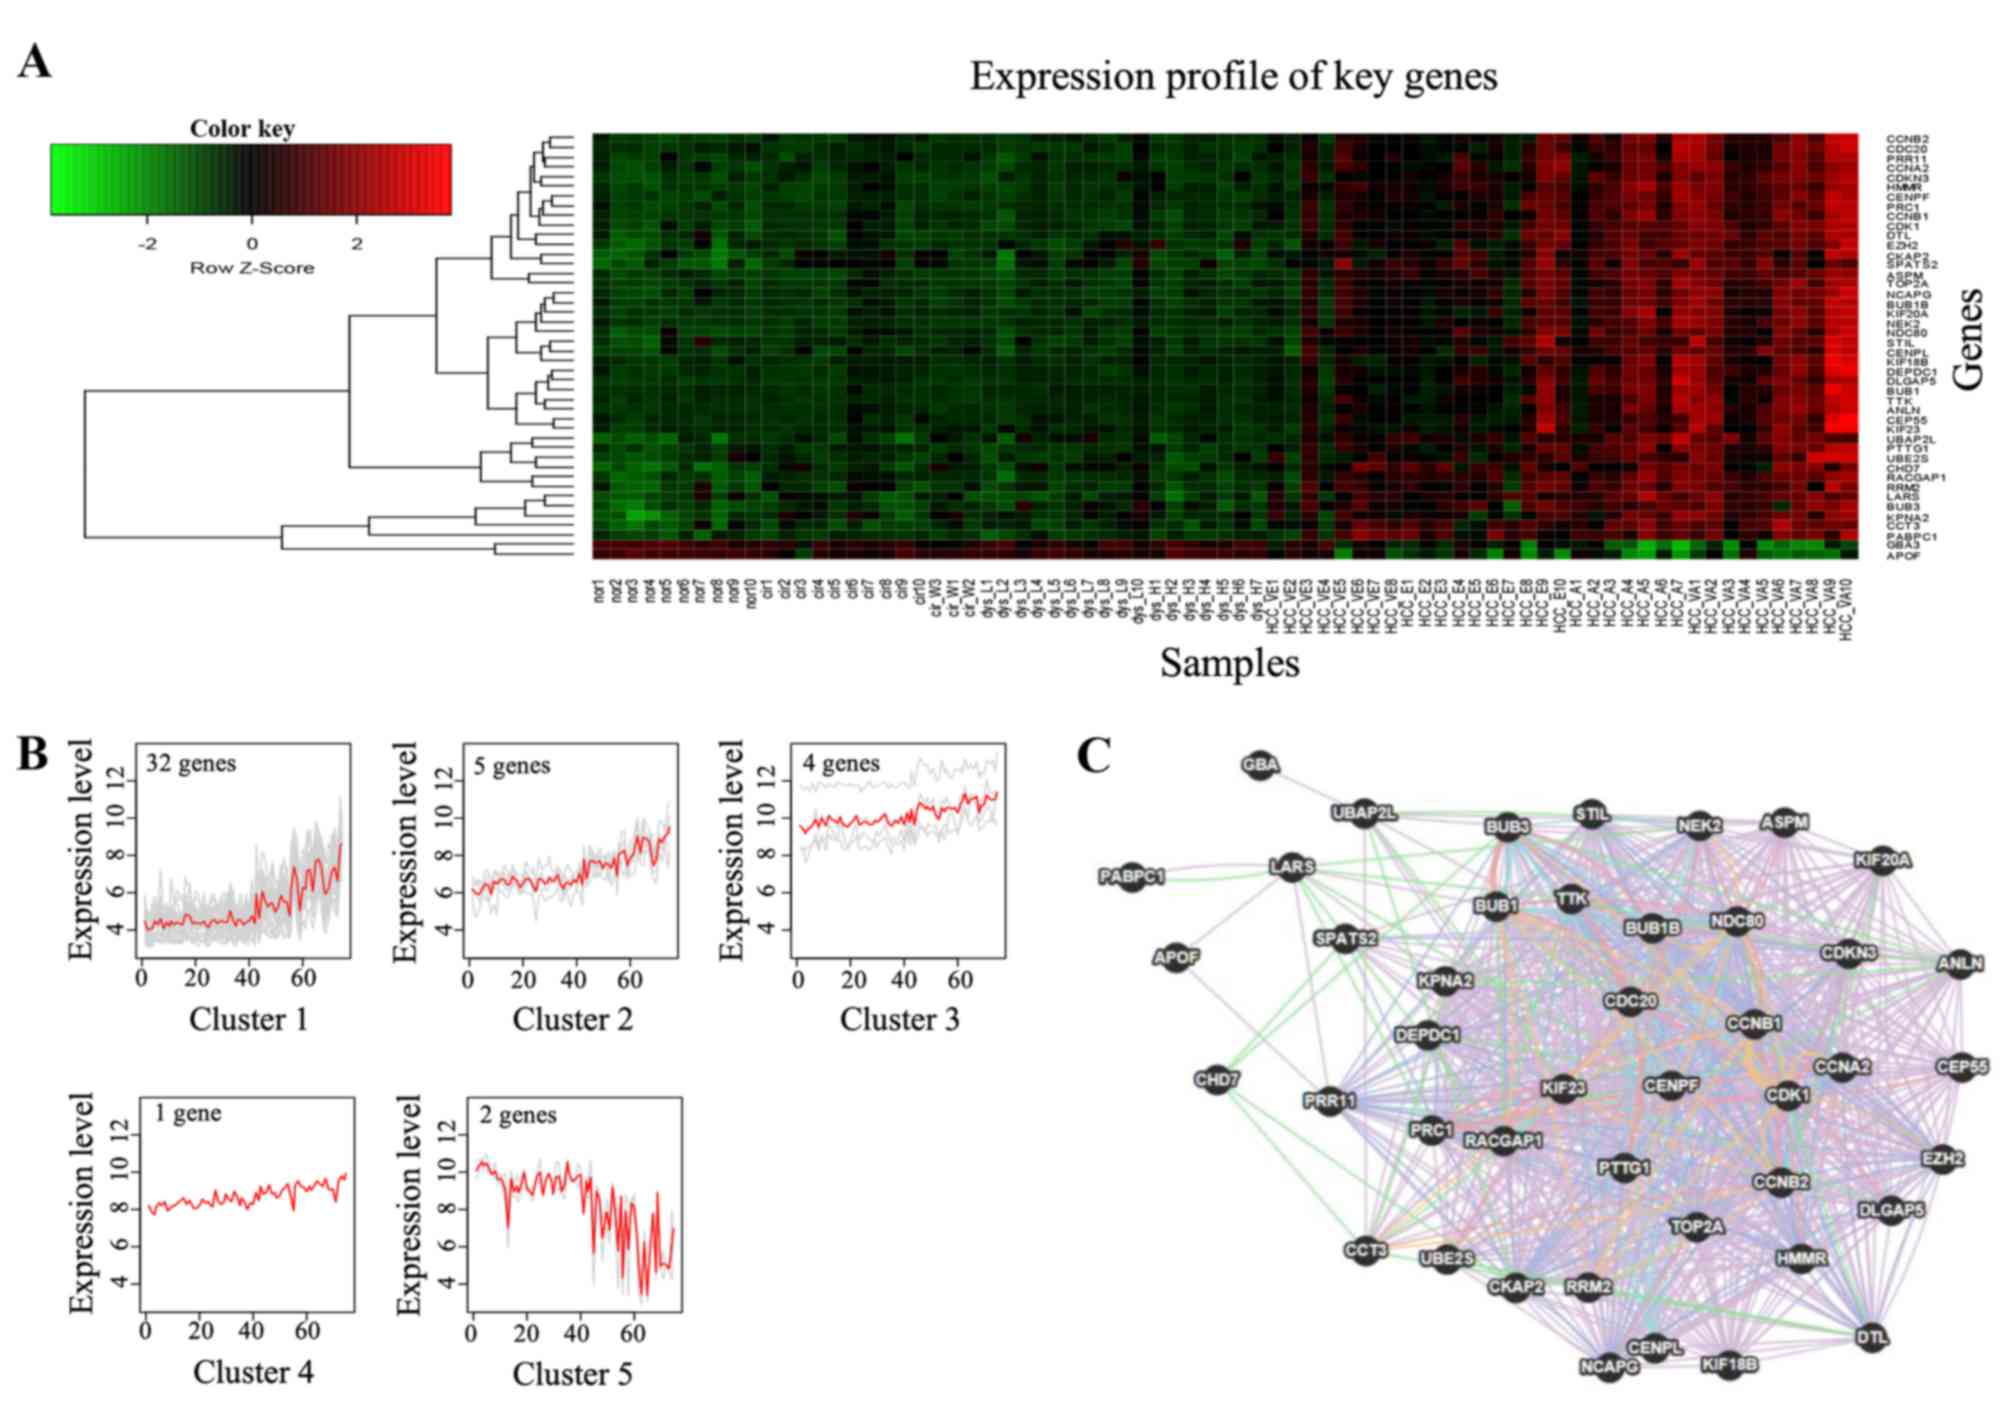
The heatmap showed that the expression of certain
genes changed gradually between the normal stage and HCC;
specifically, between the dysplasia stage and advanced HCC
(Fig. 2A). Furthermore, the
expression intensity of those genes in early HCC was in a
transitional state between the dysplasia stage and advanced HCC.
The expression patterns and clustering of these genes in the
turquoise module are shown in Fig.
2B. A total of 44 genes were grouped into five clusters, with
an evident trend along with the disease progression between the
normal stage and advanced HCC. As the majority of the 44 genes
showed gradually increased expression, they were selected as key
genes of the core module. The interactions between the 44 key genes
were analyzed using GeneMANIA (23,24). The
co-localization, co-expression, pathway, shared protein domains,
genetic, physical and predictive interactions of the 44 key genes
are shown in Fig. 2C.
Altered association of co-expression
with key genes in disease progression
As aforementioned, the changes in expression of the
44 key genes reflected the progression dynamic between the normal
stage and advanced HCC. Therefore, it was inferred that
co-expressed associations among these genes and others may be
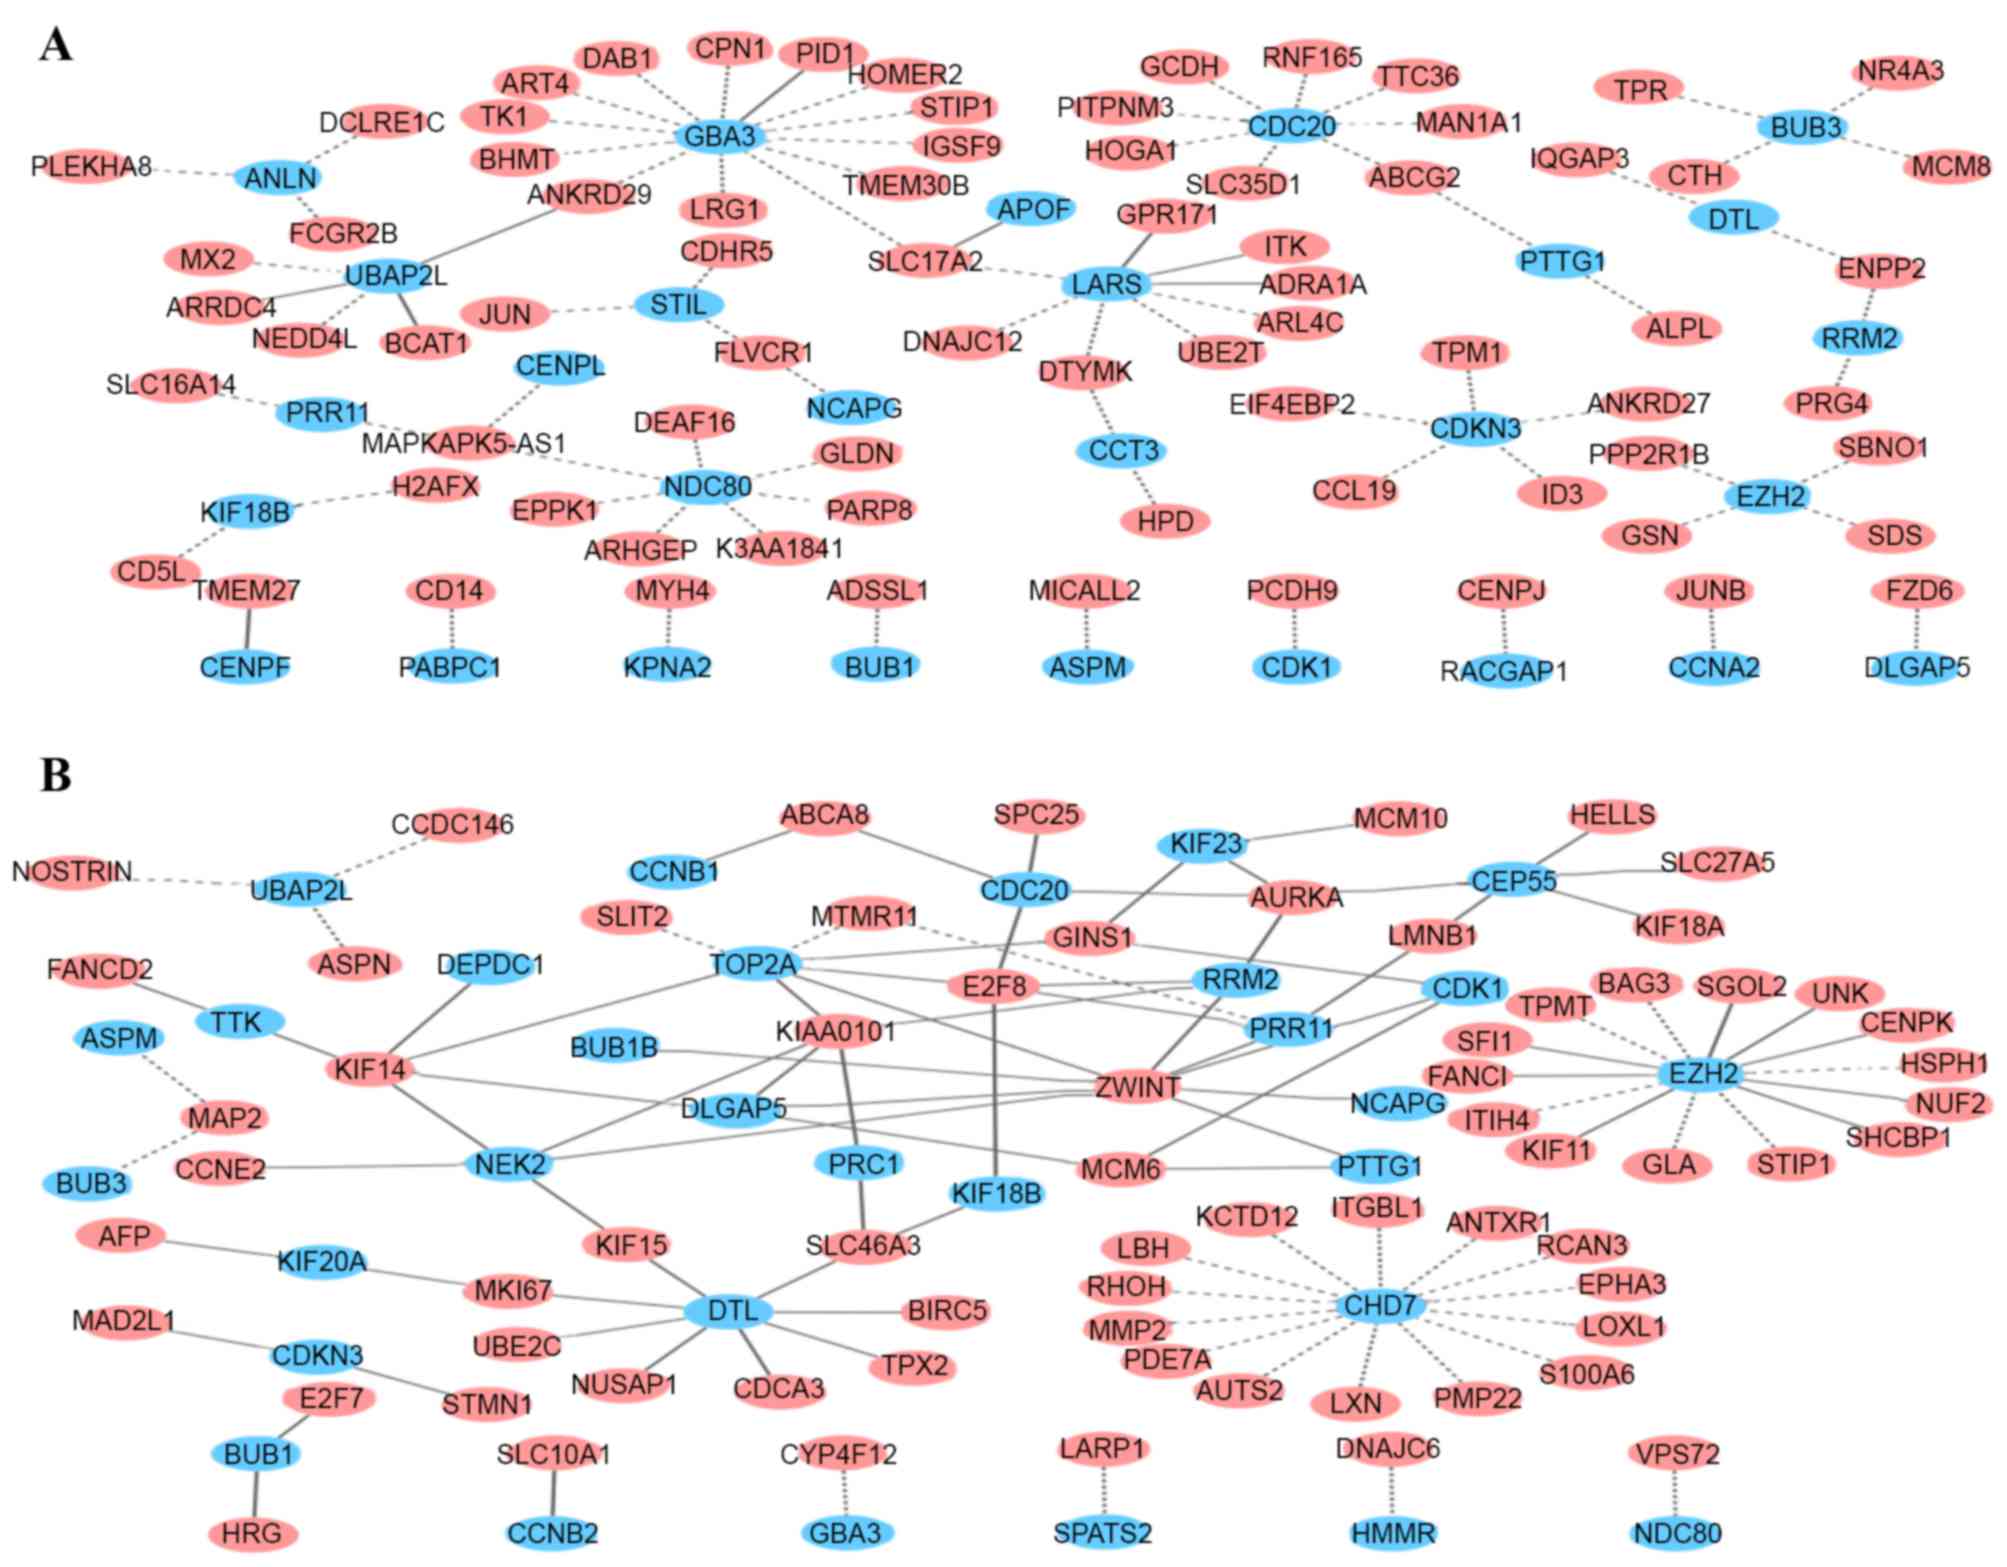
altered correspondingly in this process. The differential
co-expression genes of 44 key genes in disease progression were
investigated. The results showed that the association of
co-expression of 9 gene pairs was enhanced (P<0.01,
FDR<0.05), while for 76 gene pairs it was reduced (P<0.01,
FDR<0.05), between the normal and cirrhosis stages (Fig. 3A). In the cirrhosis-dysplasia stage,
there were only 4 pairs of differentially co-expressed genes. In
total, 103 pairs of genes were differentially co-expressed in
dysplasia-early HCC stages. Among those, the correlations of the 32
gene pairs demonstrated either significant decrease, including the
changes from strong correlation to weak correlation or to no
correlation, or a transformation from positive correlation to
negative correlation (the difference of the correlation
coefficients in the adjacent phases:
r2-r1<0; P<0.01; FDR<0.05). By
contrast, the 71 gene pairs exhibited either significant increase
in correlation, including from weak correlation or no correlation
to strong correlation, or the transformation from negative
correlation to positive correlation
(r2-r1>0; P<0.01; FDR<0.05; Fig. 3B). However, between the early HCC
stage and the advanced HCC stage, no differentially co-expressed
gene pairs were identified. This analysis showed that the
association of co-expression among key genes and other genes had
maximum ratio of change in normal-cirrhosis stages and
dysplasia-early HCC stages.
In normal-cirrhosis stages, genes that were
differentially co-expressed with key genes significantly enriched
the GO terms: Organic acid biosynthetic process (GO:0016053) and
carboxylic acid biosynthetic process (GO:0046394) (P<0.01).
According to the functional annotation of the genes, these genes
are involved in the biological synthesis of the liver. The
differential co-expression indicated the disorder in some of
biosynthesis functions of the liver during the transition from
normal to cirrhosis. In dysplasia-early HCC stages, in cases of
weakened correlation, no GO terms were significantly enriched in
those genes (P<0.01). The genes that enhanced correlation with
key genes, including aurora kinase A (AURKA), marker of
proliferation Ki-67 (MKI67), baculoviral IAP repeat containing 5
(BIRC5), ZW10 interacting kinetochore protein (ZWINT), cell
division cycle associated 3 (CDCA3), cyclin (CCN) E2, kinesin
family member 18A (KIF18A), NUF2 and nucleolar and
spindle-associated protein 1 (NUSAP1), were involved in cell cycle,
nuclear division, mitosis, spindle, microtubule-based process and
spindle (Table III), which were
closely associated with cancer. The differential co-expression
reflected the dysfunction of cell cycle, mitosis and other
associated processes during the development from dysplasia to
HCC.
| Table III.Top 30 significant functions of genes
showed enhanced association with key genes in dysplasia-early
hepatocellular carcinoma stages. |
Table III.
Top 30 significant functions of genes
showed enhanced association with key genes in dysplasia-early
hepatocellular carcinoma stages.
| Term | Name | P-value |
|---|
| GO:0007049 | Cell cycle |
4.43×10⁻²¹ |
| GO:0000279 | M phase |
4.62×10⁻²⁰ |
| GO:0022403 | Cell cycle
phase |
2.29×10⁻¹⁸ |
| GO:0022402 | Cell cycle
process |
4.21×10⁻¹⁶ |
| GO:0000280 | Nuclear
division |
6.09×10⁻¹⁶ |
| GO:0007067 | Mitosis |
6.09×10⁻¹⁶ |
| GO:0000087 | M phase of mitotic
cell cycle |
7.71×10⁻¹⁶ |
| GO:0048285 | Organelle
fission |
1.03×10⁻¹⁵ |
| GO:0000278 | Mitotic cell
cycle |
1.79×10⁻¹⁴ |
| GO:0051301 | Cell division |
2.53×10⁻¹¹ |
| GO:0007059 | Chromosome
segregation |
4.96×10⁻¹⁰ |
| GO:0000775 | Chromosome,
centromeric region |
9.18×10⁻¹⁰ |
| GO:0007017 | Microtubule-based
process |
3.42×10⁻⁹ |
| GO:0005819 | Spindle |
3.56×10⁻⁹ |
| GO:0000226 | Microtubule
cytoskeleton organization |
3.28×10⁻⁸ |
| GO:0000793 | Condensed
chromosome |
3.88×10⁻⁸ |
| GO:0007051 | Spindle
organization |
5.16×10⁻⁸ |
| GO:0005694 | Chromosome |
1.99×10⁻⁷ |
| GO:0000779 | Condensed
chromosome, centromeric region |
7.80×10⁻⁷ |
| GO:0043228 | Non-membrane-bound
organelle |
9.53×10⁻⁷ |
| GO:0043232 | Intracellular
non-membrane-bound organelle |
9.53×10⁻⁷ |
| GO:0015630 | Microtubule
cytoskeleton |
1.02×10⁻⁶ |
| GO:0044427 | Chromosomal
part |
5.86×10⁻⁶ |
| GO:0000777 | Condensed
chromosome kinetochore |
1.60×10⁻⁵ |
| GO:0044430 | Cytoskeletal
part |
2.14×10⁻⁵ |
| GO:0007010 | Cytoskeleton
organization |
4.63×10⁻⁵ |
| GO:0000776 | Kinetochore |
4.92×10⁻⁵ |
| GO:0005876 | Spindle
microtubule |
5.99×10⁻⁵ |
| GO:0005524 | ATP binding |
6.05×10⁻⁵ |
| GO:0032559 | Adenyl
ribonucleotide binding |
6.85×10⁻⁵ |
Interaction networks between HCV viral
proteins and their targeted proteins in the key genes set
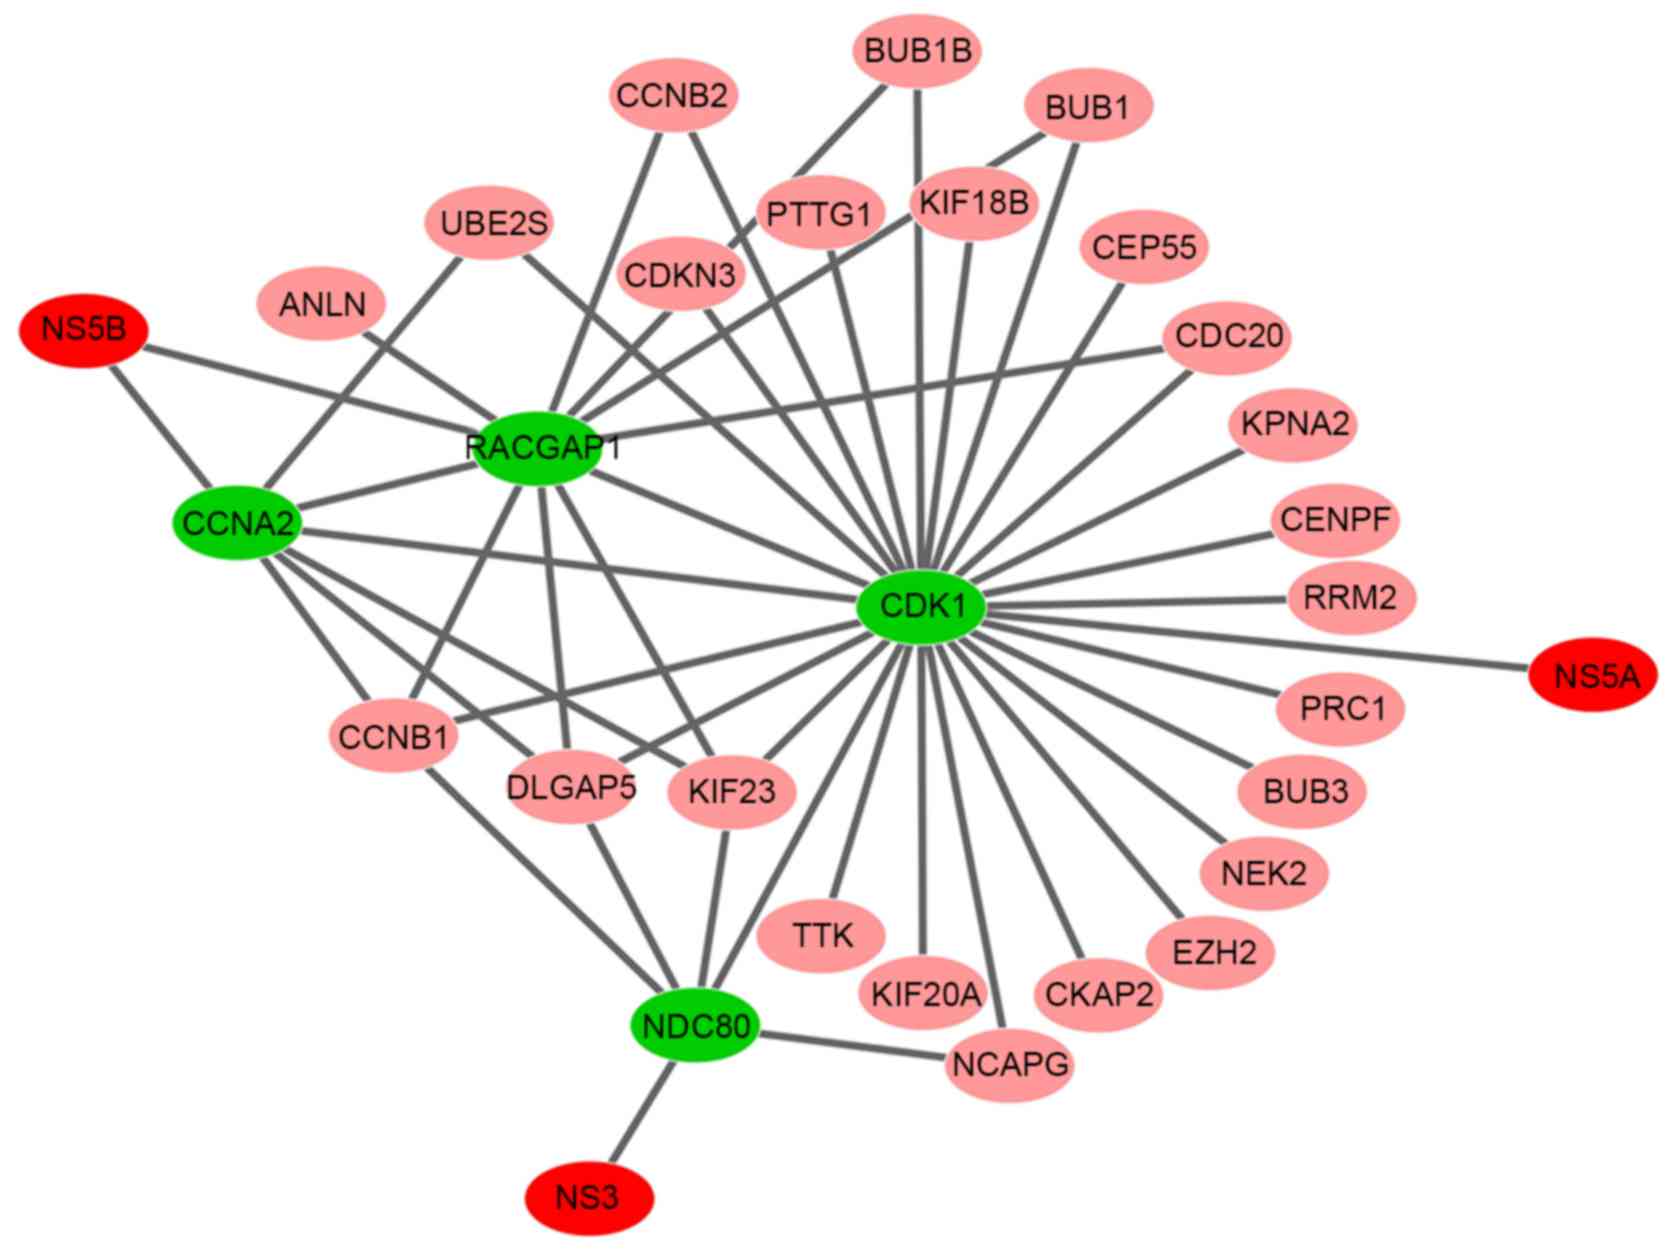
In the HCV-human interactome from Chassey's yeast
two-hybrid experiments (28), HCV
viral proteins NS3 and NS5A were revealed to target the proteins of
NDC80 and cyclin-dependent kinase 1 (CDK1) separately, which were
present in the key gene set. In addition, HCV NS5B was reported to
specifically interact with CCNA2 (32) and Rac GTPase-activating protein 1
(RACGAP1) (33). The interaction
networks between HCV viral proteins (NS3, NS5A and NS5B) and their
targeted proteins in the key genes set are shown in Fig. 4.
Discussion
HCV infection has become one of the predominant
causes of HCC in patients with chronic viral hepatitis (34). The exploration of HCV-induced HCC
progression may help to understand the common developmental
mechanism of HCC induced by other risk factors, including HBV and
alcoholic liver diseases. In the present study, the WGCNA tool was
performed for screening of the module consisting of the key genes
that exhibited HCC progression. The 44 genes identified as key
genes were associated with disease progression. The majority of
these genes had similar expression patterns and were associated and
interconnected with each other. The enriched GO terms were mainly
involved in the cell cycle process, mitotic cell cycle, M phase,
cell cycle phase, mitosis, nuclear division, cell division and
phosphorylation of proteins. This indicated that the dynamic of the
module consisting of these genes may contribute to or be driven by
disease progression. As cell cycle deregulation is one of the
common hallmark traits of cancer (35), dynamic features of this module may
also be associated with numerous other cancer progressions.
In the key genes set, genes including CDK1,
cell-division cycle protein 20 (CDC20), CCNB2, NIMA related kinase
2 (NEK2) and CCNB1 were known to be involved in common regulatory
processes of the cell cycle, mitosis and cell division.
Additionally, a number of the 44 genes were closely associated with
HCC. DLG associated protein 5 (DLGAP5), also termed HURP (hepatoma
upregulated protein), is overexpressed in HCC (36,37).
DLGAP5 activates p38/nuclear factor κ-light chain-enhancer of
activated B cells (NF-κB), and combines NF-κB into the HURP/NF-κB
complex to regulate CCNE1 expression (38). Previous studies have revealed that
silencing or knockdown of DLGAP5 significantly inhibited the
proliferation and invasion of HCC cells (36,37). The
TTK gene encodes a dual specificity protein kinase with the ability
to phosphorylate tyrosine, serine and threonine. TKK is essential
for chromosome alignment at the centromere during mitosis and is
required for centrosome duplication. TTK is upregulated in the
majority of HCC specimens and its overexpression can promote cell
proliferation, anchor-dependent colony formation and resistance to
sorafenib of HCC cells (39). CDKN3
is frequently upregulated in HCC and is associated with poor
prognosis of HCC. Overexpression of CDKN3 can stimulate the
proliferation of HCC cells by promoting G1/S phase transition
(40). In addition, certain genes are
associated with multiple cancers. For example, enhancer of zeste
homolog 2 (EZH2) promotes lung cancer progression via the vascular
endothelial growth factor-A/AKT signaling pathway in non-small cell
lung cancer (41), and it is also
involved in aggressive breast cancer (42,43).
The analysis indicated that the changes in
expression levels of key genes were associated with transition
between chronic liver disease and HCC. These changes may contribute
to or be driven by the dysregulation of the interaction or
regulated associations between certain genes and these key genes in
the disease progression.
Differentially co-expressed analysis identified
several genes that showed enhanced association of co-expression
with key genes in dysplastic-early HCC stages, including AURKA,
MKI67, BIRC5, cell division cycle associated 3 (CDCA3), ZWINT,
NUSAP1, ubiquitin conjugating enzyme E2 C (UBE2C), CCNE2, KIF18A
and NUF2, which were highly associated with cancer. In other
enhanced co-expression genes, the α-fetoprotein (AFP) gene, is a
well-known marker for primary HCC.KIAA0101 (alternative symbol
NS5ATP9) is highly co-expressed with several key genes. A previous
study revealed that KIAA0101 may be involved in the pathogenesis of
HCV-associated HCC and is upregulated by HCV NS5A protein (44). Furthermore, KIAA0101 potentially has
an important role in NS5A-induced hepatocyte autophagy (45). Notably, the correlation coefficient
between ZWINT and NEK2 in the early HCC stage (r=0.904;
P=2.69×10⁻⁷) is significantly increased
(P=1.19×10⁻⁵, FDR=0.022) compared with the dysplastic
stage (r=−0.134). A previous study reported that the functions of
the two genes were associated with chromosomal instability, which
is a major characteristic of numerous cancers (46). Similarly, pituitary tumor transforming
gene 1 (PTTG1), differentially co-expressed with ZWINT, is also
associated with chromosomal instability (46). Therefore, these findings indicated
that chromosomal instability of HCC may be associated with not only
the increasing expression intensity of these genes, but also the
altered interaction among them. Centrosomal protein of 55 kDa
(CEP55) and a DNA helicase/putative stem cell marker HELLS (gene
encoding lymphoid-specific helicase) are downstream targets of the
key oncogene forkhead box M1 (FOXM1). Waseem et al suggested
the proliferation-associated gene set consisting of FOXM1, CEP55
and HELLS shared a progressive expression pattern during the
progression of head and neck squamous cell carcinoma (47). In this analysis, CEP55 and HELLS
showed enhanced correlation in the early HCC stage, compared with
the dysplastic stage. Whether these genes possess a similar
function in HCC, as demonstrated in a previous study (47), is worth additional investigation.
These altered interactive associations among important genes may be
associated with tumorigenesis.
To study the interaction association between the key
genes identified and HCV, an interaction network between HCV viral
proteins and their targeted proteins, which were contained in the
key genes set, was constructed by mining the HCV-human database and
published literature. In the present study, CDK1, NDC80, CCNA2 and
RACGAP1 were revealed to be targets of HCV NS5A, NS3 and NS5B,
respectively. CDK1 is a key regulatory kinase of the cell cycle in
the CDK family. A previous study demonstrated that CDK1 is
upregulated in HCC (48), and serves
a crucial role of the G2/M modulators in the cell cycle and cell
proliferation of HCC (49). As CDK1
activation is required for mitosis, the increase of CDK1 activation
in HCC may indicate the increase of cancer cell proliferation.
NDC80 is a coiled-coil protein critical for cell mitosis, and
performs essential roles in chromosome segregation by interacting
with several proteins that modulate the G2/M phase through its
coiled-coil domains (50). NDC80 is
overexpressed in a variety of human cancers, such as gastric and
breast cancer (51,52), and is associated with multiple cancers
(53,54).
In the key genes set, CCNA2 is a cell cycle
regulatory protein that can bind to and activate CDK1 or CDK2
kinases, and thus promote cell cycle G1/S and G2/M transitions.
NS5B was reported to specifically interact with CCNA2 in
vitro and in vivo (32).
However, unlike NDC80 and CDK1, CCNA2 has dual regulatory roles in
cell cycle and viral propagation. CCNA2 is required for HCV
replication. Small interfering RNA-mediated depletion of CCNA2 may
significantly inhibit HCV replication in HCV subgenomic replicon
cells and HCVcc-infected cells (32).
In addition, RACGAP1 belongs to the GTPase-activating protein
family (55). A previous study
suggested that the level of RACGAP1 is upregulated by HCV infection
in human hepatoma cells to enhance HCV replication by binding to
and affecting NS5B polymerase activity (33). The interaction network between the key
genes and HCV showed that a number of important proteins directly
interacted with CDK1, NDC80, CCNA2 and RACGAP1. Therefore, these
proteins that are targeted by HCV may perform an intermediary role
between the HCV viral proteins and the dysfunctional module. The
results suggested that CDK1, NDC80, RACGAP1 and CCNA2 inhibition or
interference by drugs may have potential as an effective method of
therapy for HCC and prevention of the HCC progression.
Overall, in the present study, using the WGCNA tool,
a core gene module was identified, in which the dynamic
characteristics of the genes were associated with HCV-induced HCC
progression. The marked changes in expression levels and
association of co-expression of the key genes may contribute to or
be driven by progression of HCV-induced HCC. The changes may be
markers of transition from precancerous to HCC states.
Particularly, in the identified core module, CDK1, NDC80, CCNA2 and
RACGAP1 were revealed to be targeted by HCV viral proteins. These
findings confirmed the close link between the identified module and
HCV-induced HCC. The present study may be helpful for understanding
the molecular mechanism that underlies the progression of
HCV-induced HCC and provides valuable information for seeking the
drug targets for the therapy of HCC and prevention of HCC
development.
Acknowledgements
Not applicable.
Funding
No funding was received.
Availability of data and materials
The datasets analyzed during the current study are
available in the Gene Expression Omnibus (GEO) repository
(https://www.ncbi.nlm.nih.gov/geo/query/acc.cgi?acc=GSE6764).
Author's contributions
GB, WZ and WM conceived and designed the
experiments, GB performed the experiments and analyzed the data.
GB, WZ and WM drafted the manuscript.
Ethics approval and consent to
participate
Not applicable.
Consent for publication
Not applicable.
Competing interests
The authors declare that they have no competing
interests.
References
|
1
|
Torre LA, Bray F, Siegel RL, Ferlay J,
Lortet-Tieulent J and Jemal A: Global cancer statistics, 2012. CA
Cancer J Clin. 65:87–108. 2015. View Article : Google Scholar : PubMed/NCBI
|
|
2
|
Global Burden of Disease Cancer
Collaboration, . Fitzmaurice C, Dicker D, Pain A, Hamavid H,
Moradi-Lakeh M, MacIntyre MF, Allen C, Hansen G, Woodbrook R, et
al: The global burden of cancer 2013. JAMA Oncol. 1:505–527. 2015.
View Article : Google Scholar : PubMed/NCBI
|
|
3
|
Yamane B and Weber S: Liver-directed
treatment modalities for primary and secondary hepatic tumors. Surg
Clin North Am. 89:97–113. 2009. View Article : Google Scholar : PubMed/NCBI
|
|
4
|
Ishikawa T: Strategy for improving
survival and reducing recurrence of HCV-related hepatocellular
carcinoma. World J Gastroenterol. 19:6127–6130. 2013. View Article : Google Scholar : PubMed/NCBI
|
|
5
|
Yu H, Lin CC, Li YY and Zhao Z: Dynamic
protein interaction modules in human hepatocellular carcinoma
progression. BMC Syst Biol. 5 7 Suppl:S22013. View Article : Google Scholar
|
|
6
|
Choi JK, Yu U, Yoo OJ and Kim S:
Differential coexpression analysis using microarray data and its
application to human cancer. Bioinformatics. 21:4348–4355. 2005.
View Article : Google Scholar : PubMed/NCBI
|
|
7
|
Lee HK, Hsu AK, Sajdak J, Qin J and
Pavlidis P: Coexpression analysis of human genes across many
microarray data sets. Genome Res. 14:1085–1094. 2004. View Article : Google Scholar : PubMed/NCBI
|
|
8
|
He B, Zhang H and Shi T: A comprehensive
analysis of the dynamic biological networks in HCV induced
hepatocarcinogenesis. PLoS One. 6:e185162011. View Article : Google Scholar : PubMed/NCBI
|
|
9
|
Varelas X, Bouchie MP and Kukuruzinska MA:
Protein N-glycosylation in oral cancer: Dysregulated cellular
networks among DPAGT1, E-cadherin adhesion and canonical Wnt
signaling. Glycobiology. 24:579–591. 2014. View Article : Google Scholar : PubMed/NCBI
|
|
10
|
Mentzen WI, Floris M and de la Fuente A:
Dissecting the dynamics of dysregulation of cellular processes in
mouse mammary gland tumor. BMC Genomics. 10:6012009. View Article : Google Scholar : PubMed/NCBI
|
|
11
|
Southworth LK, Owen AB and Kim SK: Aging
mice show a decreasing correlation of gene expression within
genetic modules. PLoS Genet. 5:e10007762009. View Article : Google Scholar : PubMed/NCBI
|
|
12
|
Banerjee A, Ray RB and Ray R: Oncogenic
potential of hepatitis C virus proteins. Viruses. 2:2108–2133.
2010. View
Article : Google Scholar : PubMed/NCBI
|
|
13
|
McGivern DR and Lemon SM: Virus-specific
mechanisms of carcinogenesis in hepatitis C virus associated liver
cancer. Oncogene. 30:1969–1983. 2011. View Article : Google Scholar : PubMed/NCBI
|
|
14
|
Wurmbach E, Chen YB, Khitrov G, Zhang W,
Roayaie S, Schwartz M, Fiel I, Thung S, Mazzaferro V, Bruix J, et
al: Genome-wide molecular profiles of HCV-induced dysplasia and
hepatocellular carcinoma. Hepatology. 45:938–947. 2007. View Article : Google Scholar : PubMed/NCBI
|
|
15
|
Barrett T, Troup DB, Wilhite SE, Ledoux P,
Rudnev D, Evangelista C, Kim IF, Soboleva A, Tomashevsky M,
Marshall KA, et al: NCBI GEO: Archive for high-throughput
functional genomic data. Nucleic Acids Res. 37:(Database Issue).
D885–D890. 2009. View Article : Google Scholar : PubMed/NCBI
|
|
16
|
Gautier L, Cope L, Bolstad BM and Irizarry
RA: affy-analysis of Affymetrix GeneChip data at the probe level.
Bioinformatics. 20:307–315. 2004. View Article : Google Scholar : PubMed/NCBI
|
|
17
|
Gentleman RC, Carey VJ, Bates DM, Bolstad
B, Dettling M, Dudoit S, Ellis B, Gautier L, Ge Y, Gentry J, et al:
Bioconductor: Open software development for computational biology
and bioinformatics. Genome Biol. 5:R802004. View Article : Google Scholar : PubMed/NCBI
|
|
18
|
Smyth GK: Linear models and empirical
bayes methods for assessing differential expression in microarray
experiments. Stat Appl Genet Mol Biol. 3:Article32004. View Article : Google Scholar : PubMed/NCBI
|
|
19
|
Langfelder P and Horvath S: WGCNA: An R
package for weighted correlation network analysis. BMC
Bioinformatics. 9:5592008. View Article : Google Scholar : PubMed/NCBI
|
|
20
|
Zhang B and Horvath S: A general framework
for weighted gene co-expression network analysis. Stat Appl Genet
Mol Biol. 4:Article172005. View Article : Google Scholar : PubMed/NCBI
|
|
21
|
Huang da W, Sherman BT and Lempicki RA:
Systematic and integrative analysis of large gene lists using DAVID
bioinformatics resources. Nat Protoc. 4:44–57. 2009. View Article : Google Scholar : PubMed/NCBI
|
|
22
|
Herrero J, Valencia A and Dopazo J: A
hierarchical unsupervised growing neural network for clustering
gene expression patterns. Bioinformatics. 17:126–136. 2001.
View Article : Google Scholar : PubMed/NCBI
|
|
23
|
Warde-Farley D, Donaldson SL, Comes O,
Zuberi K, Badrawi R, Chao P, Franz M, Grouios C, Kazi F, Lopes CT,
et al: The GeneMANIA prediction server: Biological network
integration for gene prioritization and predicting gene function.
Nucleic Acids Res. 38:W214–W220. 2010. View Article : Google Scholar : PubMed/NCBI
|
|
24
|
Zuberi K, Franz M, Rodriguez H, Montojo J,
Lopes CT, Bader GD and Morris Q: GeneMANIA prediction server 2013
update. Nucleic Acids Res. 41:W115–W122. 2013. View Article : Google Scholar : PubMed/NCBI
|
|
25
|
Fukushima A: DiffCorr: An R package to
analyze and visualize differential correlations in biological
networks. Gene. 518:209–214. 2013. View Article : Google Scholar : PubMed/NCBI
|
|
26
|
Shannon P, Markiel A, Ozier O, Baliga NS,
Wang JT, Ramage D, Amin N, Schwikowski B and Ideker T: Cytoscape: A
software environment for integrated models of biomolecular
interaction networks. Genome Res. 13:2498–2504. 2003. View Article : Google Scholar : PubMed/NCBI
|
|
27
|
Szklarczyk D, Franceschini A, Kuhn M,
Simonovic M, Roth A, Minguez P, Doerks T, Stark M, Muller J, Bork
P, et al: The STRING database in 2011: Functional interaction
networks of proteins, globally integrated and scored. Nucleic Acids
Res. 39:(Database Issue). D561–D568. 2011. View Article : Google Scholar : PubMed/NCBI
|
|
28
|
de Chassey B, Navratil V, Tafforeau L,
Hiet MS, Aublin-Gex A, Agaugué S, Meiffren G, Pradezynski F, Faria
BF, Chantier T, et al: Hepatitis C virus infection protein network.
Mol Syst Biol. 4:2302008. View Article : Google Scholar : PubMed/NCBI
|
|
29
|
Allocco DJ, Kohane IS and Butte AJ:
Quantifying the relationship between co-expression, co-regulation
and gene function. BMC Bioinformatics. 5:182004. View Article : Google Scholar : PubMed/NCBI
|
|
30
|
Mas VR, Maluf DG, Archer KJ, Yanek K, Kong
X, Kulik L, Freise CE, Olthoff KM, Ghobrial RM, McIver P and Fisher
R: Genes involved in viral carcinogenesis and tumor initiation in
hepatitis C virus-induced hepatocellular carcinoma. Mol Med.
15:85–94. 2009. View Article : Google Scholar : PubMed/NCBI
|
|
31
|
De Giorgi V, Buonaguro L, Worschech A,
Tornesello ML, Izzo F, Marincola FM, Wang E and Buonaguro FM:
Molecular signatures associated with HCV-induced hepatocellular
carcinoma and liver metastasis. PLoS One. 8:e561532013. View Article : Google Scholar : PubMed/NCBI
|
|
32
|
Pham LV, Ngo HT, Lim YS and Hwang SB:
Hepatitis C virus non-structural 5B protein interacts with cyclin
A2 and regulates viral propagation. J Hepatol. 57:960–966. 2012.
View Article : Google Scholar : PubMed/NCBI
|
|
33
|
Wu MJ, Ke PY and Horng JT:
RacGTPase-activating protein 1 interacts with hepatitis C virus
polymerase NS5B to regulate viral replication. Biochem Biophys Res
Commun. 454:19–24. 2014. View Article : Google Scholar : PubMed/NCBI
|
|
34
|
Koike K, Moriya K and Kimura S: Role of
hepatitis C virus in the development of hepatocellular carcinoma:
Transgenic approach to viral hepatocarcinogenesis. J Gastroenterol
Hepatol. 17:394–400. 2002. View Article : Google Scholar : PubMed/NCBI
|
|
35
|
Chan KS, Koh CG and Li HY:
Mitosis-targeted anti-cancer therapies: Where they stand. Cell
Death Dis. 3:e4112012. View Article : Google Scholar : PubMed/NCBI
|
|
36
|
Kuo TC, Chang PY, Huang SF, Chou CK and
Chao CC: Knockdown of HURP inhibits the proliferation of
hepacellular carcinoma cells via downregulation of gankyrin and
accumulation of p53. Biochem Pharmacol. 83:758–768. 2012.
View Article : Google Scholar : PubMed/NCBI
|
|
37
|
Liao W, Liu W, Yuan Q, Liu X, Ou Y, He S,
Yuan S, Qin L, Chen Q, Nong K, et al: Silencing of DLGAP5 by siRNA
significantly inhibits the proliferation and invasion of
hepatocellular carcinoma cells. PLoS One. 8:e807892013. View Article : Google Scholar : PubMed/NCBI
|
|
38
|
Chen JM, Chiu SC, Wei TY, Lin SY, Chong
CM, Wu CC, Huang JY, Yang ST, Ku CF, Hsia JY and Yu CT: The
involvement of nuclear factor-kappaB in the nuclear targeting and
cyclin E1 upregulating activities of hepatoma upregulated protein.
Cell Signal. 27:26–36. 2015. View Article : Google Scholar : PubMed/NCBI
|
|
39
|
Liang XD, Dai YC, Li ZY, Gan MF, Zhang SR,
Yin-Pan, Lu HS, Cao XQ, Zheng BJ, Bao LF, et al: Expression and
function analysis of mitotic checkpoint genes identifies TTK as a
potential therapeutic target for human hepatocellular carcinoma.
PLoS One. 9:e977392014. View Article : Google Scholar : PubMed/NCBI
|
|
40
|
Xing C, Xie H, Zhou L, Zhou W, Zhang W,
Ding S, Wei B, Yu X, Su R and Zheng S: Cyclin-dependent kinase
inhibitor 3 is overexpressed in hepatocellular carcinoma and
promotes tumor cell proliferation. Biochem Biophys Res Commun.
420:29–35. 2012. View Article : Google Scholar : PubMed/NCBI
|
|
41
|
Geng J, Li X, Zhou Z, Wu CL, Dai M and Bai
X: EZH2 promotes tumor progression via regulating VEGF-A/AKT
signaling in non-small cell lung cancer. Cancer Lett. 359:275–287.
2015. View Article : Google Scholar : PubMed/NCBI
|
|
42
|
Collett K, Eide GE, Arnes J, Stefansson
IM, Eide J, Braaten A, Aas T, Otte AP and Akslen LA: Expression of
enhancer of zeste homologue 2 is significantly associated with
increased tumor cell proliferation and is a marker of aggressive
breast cancer. Clin Cancer Res. 12:1168–1174. 2006. View Article : Google Scholar : PubMed/NCBI
|
|
43
|
Kleer CG, Cao Q, Varambally S, Shen R, Ota
I, Tomlins SA, Ghosh D, Sewalt RG, Otte AP, Hayes DF, et al: EZH2
is a marker of aggressive breast cancer and promotes neoplastic
transformation of breast epithelial cells. Proc Natl Acad Sci USA.
100:11606–11611. 2003. View Article : Google Scholar : PubMed/NCBI
|
|
44
|
Shi L, Zhang SL, Li K, Hong Y, Wang Q, Li
Y, Guo J, Fan WH, Zhang L and Cheng J: NS5ATP9, a gene up-regulated
by HCV NS5A protein. Cancer Lett. 259:192–197. 2008. View Article : Google Scholar : PubMed/NCBI
|
|
45
|
Quan M, Liu S, Li G, Wang Q, Zhang J,
Zhang M, Li M, Gao P, Feng S and Cheng J: A functional role for
NS5ATP9 in the induction of HCV NS5A-mediated autophagy. J Viral
Hepat. 21:405–415. 2014. View Article : Google Scholar : PubMed/NCBI
|
|
46
|
Brendle A, Brandt A, Johansson R, Enquist
K, Hallmans G, Hemminki K, Lenner P and Försti A: Single nucleotide
polymorphisms in chromosomal instability genes and risk and
clinical outcome of breast cancer: A Swedish prospective
case-control study. Eur J Cancer. 45:435–442. 2009. View Article : Google Scholar : PubMed/NCBI
|
|
47
|
Waseem A, Ali M, Odell EW, Fortune F and
Teh MT: Downstream targets of FOXM1: CEP55 and HELLS are cancer
progression markers of head and neck squamous cell carcinoma. Oral
Oncol. 46:536–542. 2010. View Article : Google Scholar : PubMed/NCBI
|
|
48
|
Li KK, Ng IO, Fan ST, Albrecht JH,
Yamashita K and Poon RY: Activation of cyclin-dependent kinases
CDC2 and CDK2 in hepatocellular carcinoma. Liver. 22:259–268. 2002.
View Article : Google Scholar : PubMed/NCBI
|
|
49
|
Ito Y, Takeda T, Sakon M, Monden M,
Tsujimoto M and Matsuura N: Expression and prognostic role of
cyclin-dependent kinase 1 (cdc2) in hepatocellular carcinoma.
Oncology. 59:68–74. 2000. View Article : Google Scholar : PubMed/NCBI
|
|
50
|
Chen Y, Riley DJ, Zheng L, Chen PL and Lee
WH: Phosphorylation of the mitotic regulator protein Hec1 by Nek2
kinase is essential for faithful chromosome segregation. J Biol
Chem. 277:49408–49416. 2002. View Article : Google Scholar : PubMed/NCBI
|
|
51
|
Qu Y, Li J, Cai Q and Liu B: Hec1/Ndc80 is
overexpressed in human gastric cancer and regulates cell growth. J
Gastroenterol. 49:408–418. 2014. View Article : Google Scholar : PubMed/NCBI
|
|
52
|
Bièche I, Vacher S, Lallemand F,
Tozlu-Kara S, Bennani H, Beuzelin M, Driouch K, Rouleau E,
Lerebours F, Ripoche H, et al: Expression analysis of mitotic
spindle checkpoint genes in breast carcinoma: Role of NDC80/HEC1 in
early breast tumorigenicity, and a two-gene signature for
aneuploidy. Mol Cancer. 10:232011. View Article : Google Scholar : PubMed/NCBI
|
|
53
|
Chen Y, Riley DJ, Chen PL and Lee WH: HEC,
a novel nuclear protein rich in leucine heptad repeats specifically
involved in mitosis. Mol Cell Biol. 17:6049–6056. 1997. View Article : Google Scholar : PubMed/NCBI
|
|
54
|
Glinsky GV, Berezovska O and Glinskii AB:
Microarray analysis identifies a death-from-cancer signature
predicting therapy failure in patients with multiple types of
cancer. J Clin Invest. 115:1503–1521. 2005. View Article : Google Scholar : PubMed/NCBI
|
|
55
|
Liang Y, Liu M, Wang P, Ding X and Cao Y:
Analysis of 20 genes at chromosome band 12q13: RACGAP1 and MCRS1
overexpression in nonsmall-cell lung cancer. Genes Chromosomes
Cancer. 52:305–315. 2013. View Article : Google Scholar : PubMed/NCBI
|