Introduction
Bladder cancer (BC) is a heterogeneous disease with
a variable disease history and is one of the most common
genitourinary malignancies worldwide (1). A total of 72,570 new cases of urinary BC
were diagnosed in the United States and 15,210 patients succumbed
to BC in 2013 (2). The most common
pathological type of BC is urothelial cell carcinoma, and the
5-year survival rate of BC is ~77% in the United States (3). BC is a disease with multifactorial
etiology; radical cystectomy with pelvic lymphadenectomy is
considered to be standard therapy (4), although the use of radiotherapy is
considered as an alternative, particularly in more frail patients
(5). However, these therapies are
limited in their effectiveness, as BC has high recurrence and
mortality rates, meaning that greater understanding of the course
of BC development is urgently required.
A previous study suggested that different mechanisms
have evolved to respond to specific phenotypic alterations in genes
and cellular pathways involved in BC, and certain genetic
variations in major tumor-associated pathways were proven to induce
BC (6). Shen et al (6) assessed the differentially expressed
genes (DEGs) and interacting pathways in BC using bioinformatics
analysis, given that the genes encoding activator protein 1 (AP-1)
and nuclear factor of activated T cells were key in BC. Zhou et
al (7) analyzed the gene
expression in human BC samples using the GSE42089 microarray
dataset, identifying a set of genes associated with mitotic spindle
checkpoint dysfunction as being key in BC. However, the fact that
only one microarray dataset was used by each of the above studies
may prove to be a limitation to the analysis described.
In the present study, the gene expression profiles
examined had to use the same platform as GSE42089 (Affymetrix
GeneChip Human Genome U133 Plus 2.0 Array) and had to be samples
composed of bladder cancer specimens and normal bladder tissue. The
only other dataset that fit these criteria was GSE24152. Therefore,
two microarray profiles, GSE24152 and GSE42089, were used for
integrated analysis of gene expression modification in BC in the
present study; the use of the two gene expression profiles enabled
a more reliable conclusion to be drawn. DEGs were identified, and
gene ontology (GO) and Kyoto Encyclopedia of Genes and Genomes
(KEGG) analyses were performed. Protein-protein interaction (PPI)
networks and sub-networks were also constructed to identify the key
genes and main pathways involved in BC. Using the aforementioned
bioinformatics methods, the modification of gene expression in BC
was analyzed by identifying significant DEGs and pathways, which
may provide novel insight for the etiology and treatment research
of BC.
Materials and methods
Microarray data
Two gene expression profiles, GSE24152 (8) and GSE42089 (7), were downloaded from the Gene Expression
Omnibus database in National Center for Biotechnology Information
(http://www.ncbi.nlm.nih.gov/geo/), based
on the GPL6791 and GPL9828 platforms in the Affymetrix GeneChip
Human Genome U133 Plus 2.0 Array, respectively. The GSE24152
dataset included 17 samples, of which 10 were fresh tumor tissue
samples collected from patients with urothelial carcinoma of the
bladder and 7 were benign mucosa samples from the bladder. The
microarray GSE42089 dataset consisted of 18 samples, of which 10
samples were tissues from urothelial cell carcinoma and 8 were
normal bladder tissue.
Data preprocessing and DEGs
analysis
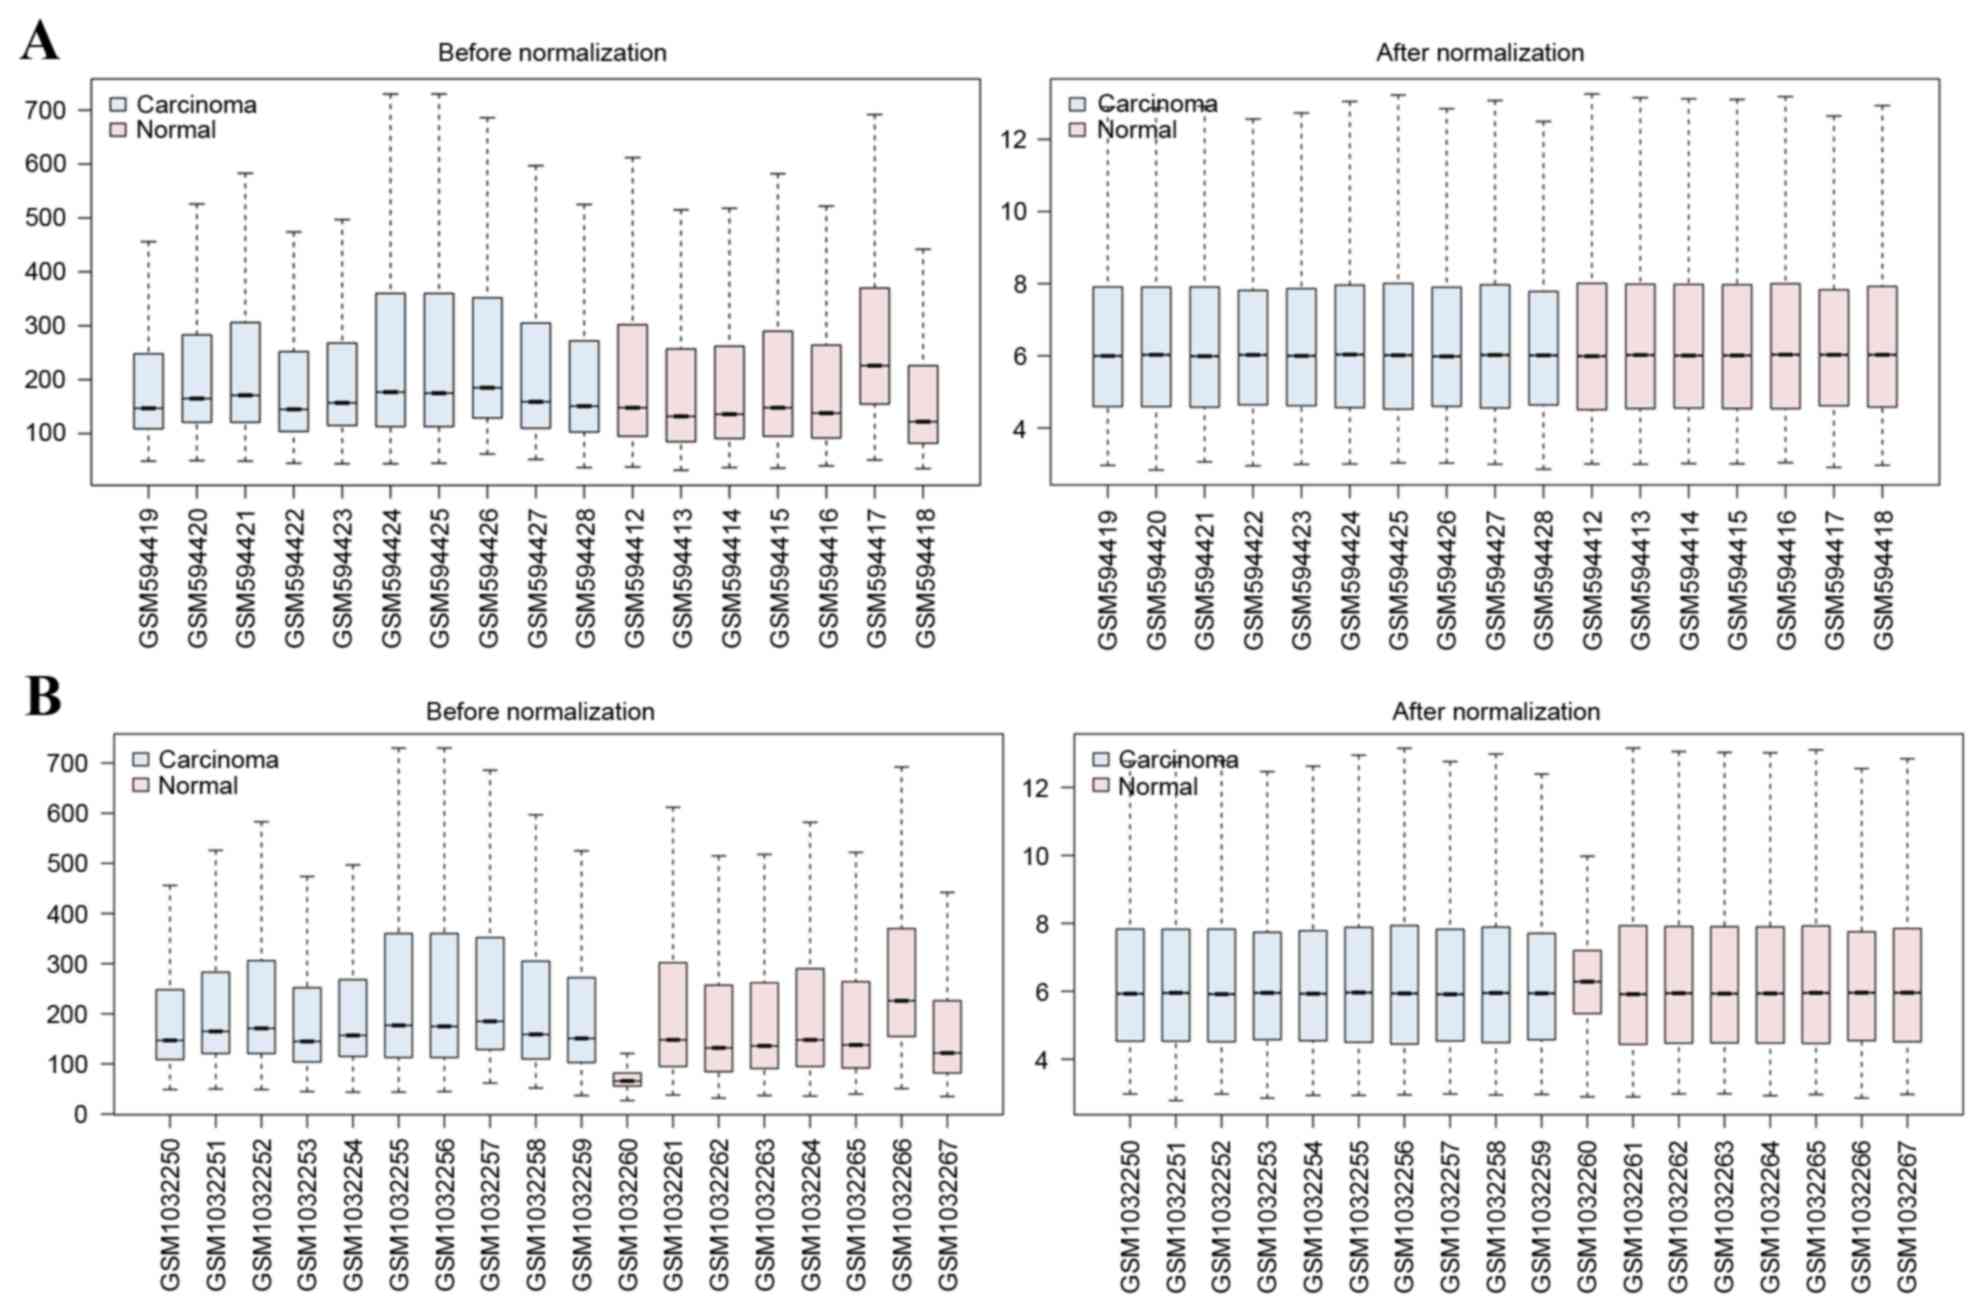
The robust multiple average algorithm in the affy
package (9) was used to normalize the
microarray data and box plots were then generated. The microarray
data from GSE24152 and GSE42089 were divided into two groups, a
bladder carcinoma group and a normal group. Using the Limma package
(10), the probe-level data of two
sets were converted into expression measures and DEGs were
identified in the bladder carcinoma group compared with the control
group in GSE24152 and GSE42089. A Venn diagram was generated using
VennDiagram package (11) to screen
common DEGs in GSE24152 and GSE42089 for further analysis. A false
discovery rate <0.01 and a |log2FC (fold-change)
|>0.5 was used as the threshold. Heat maps were generated using
the heatmap.2 function in ggplot 2 (12) to display the relative expression
differences of DEGs. In addition, the cor.test function was used to
evaluate the correlation coefficient of two groups of DEGs.
GO and pathway enrichment
analysis
GO terms analysis is a widely used approach for
studying large-scale genomic or transcriptomic data in function
that consists of three terms: Biological process, cellular
component and molecular function categories (13). KEGG is a widely used collection of
online databases that deals with genomes, enzymatic pathways, and
biological chemicals (14). In the
present study, GO analysis and KEGG pathway enrichment were
performed on the three categories of the screened DEGs using the
DAVID (15) analysis tool, with a
statistically significant cut-off of P<0.01.
PPI network and sub-network
construction
Cytoscape (16) is an
open-source bioinformatics software platform used for the
visualization of molecular interaction networks and integrating
with gene expression profiles and other state data. In the present
study, Biosgenet in Cytoscape (17)
was used to predict and visualize the interactions between selected
DEGs and proteins using the BIND database (18) with a statistically significant cut-off
of P<0.05. Significant sub-networks (clusters) were extracted
from the PPI network using ClusterOne in Cytoscape (19) with a statistically significant cut-off
of P<0.01. GO terms analysis was also performed for the selected
clusters.
Results
DEGs selection
The variations in raw expression data were
normalized following preprocessing (Fig.
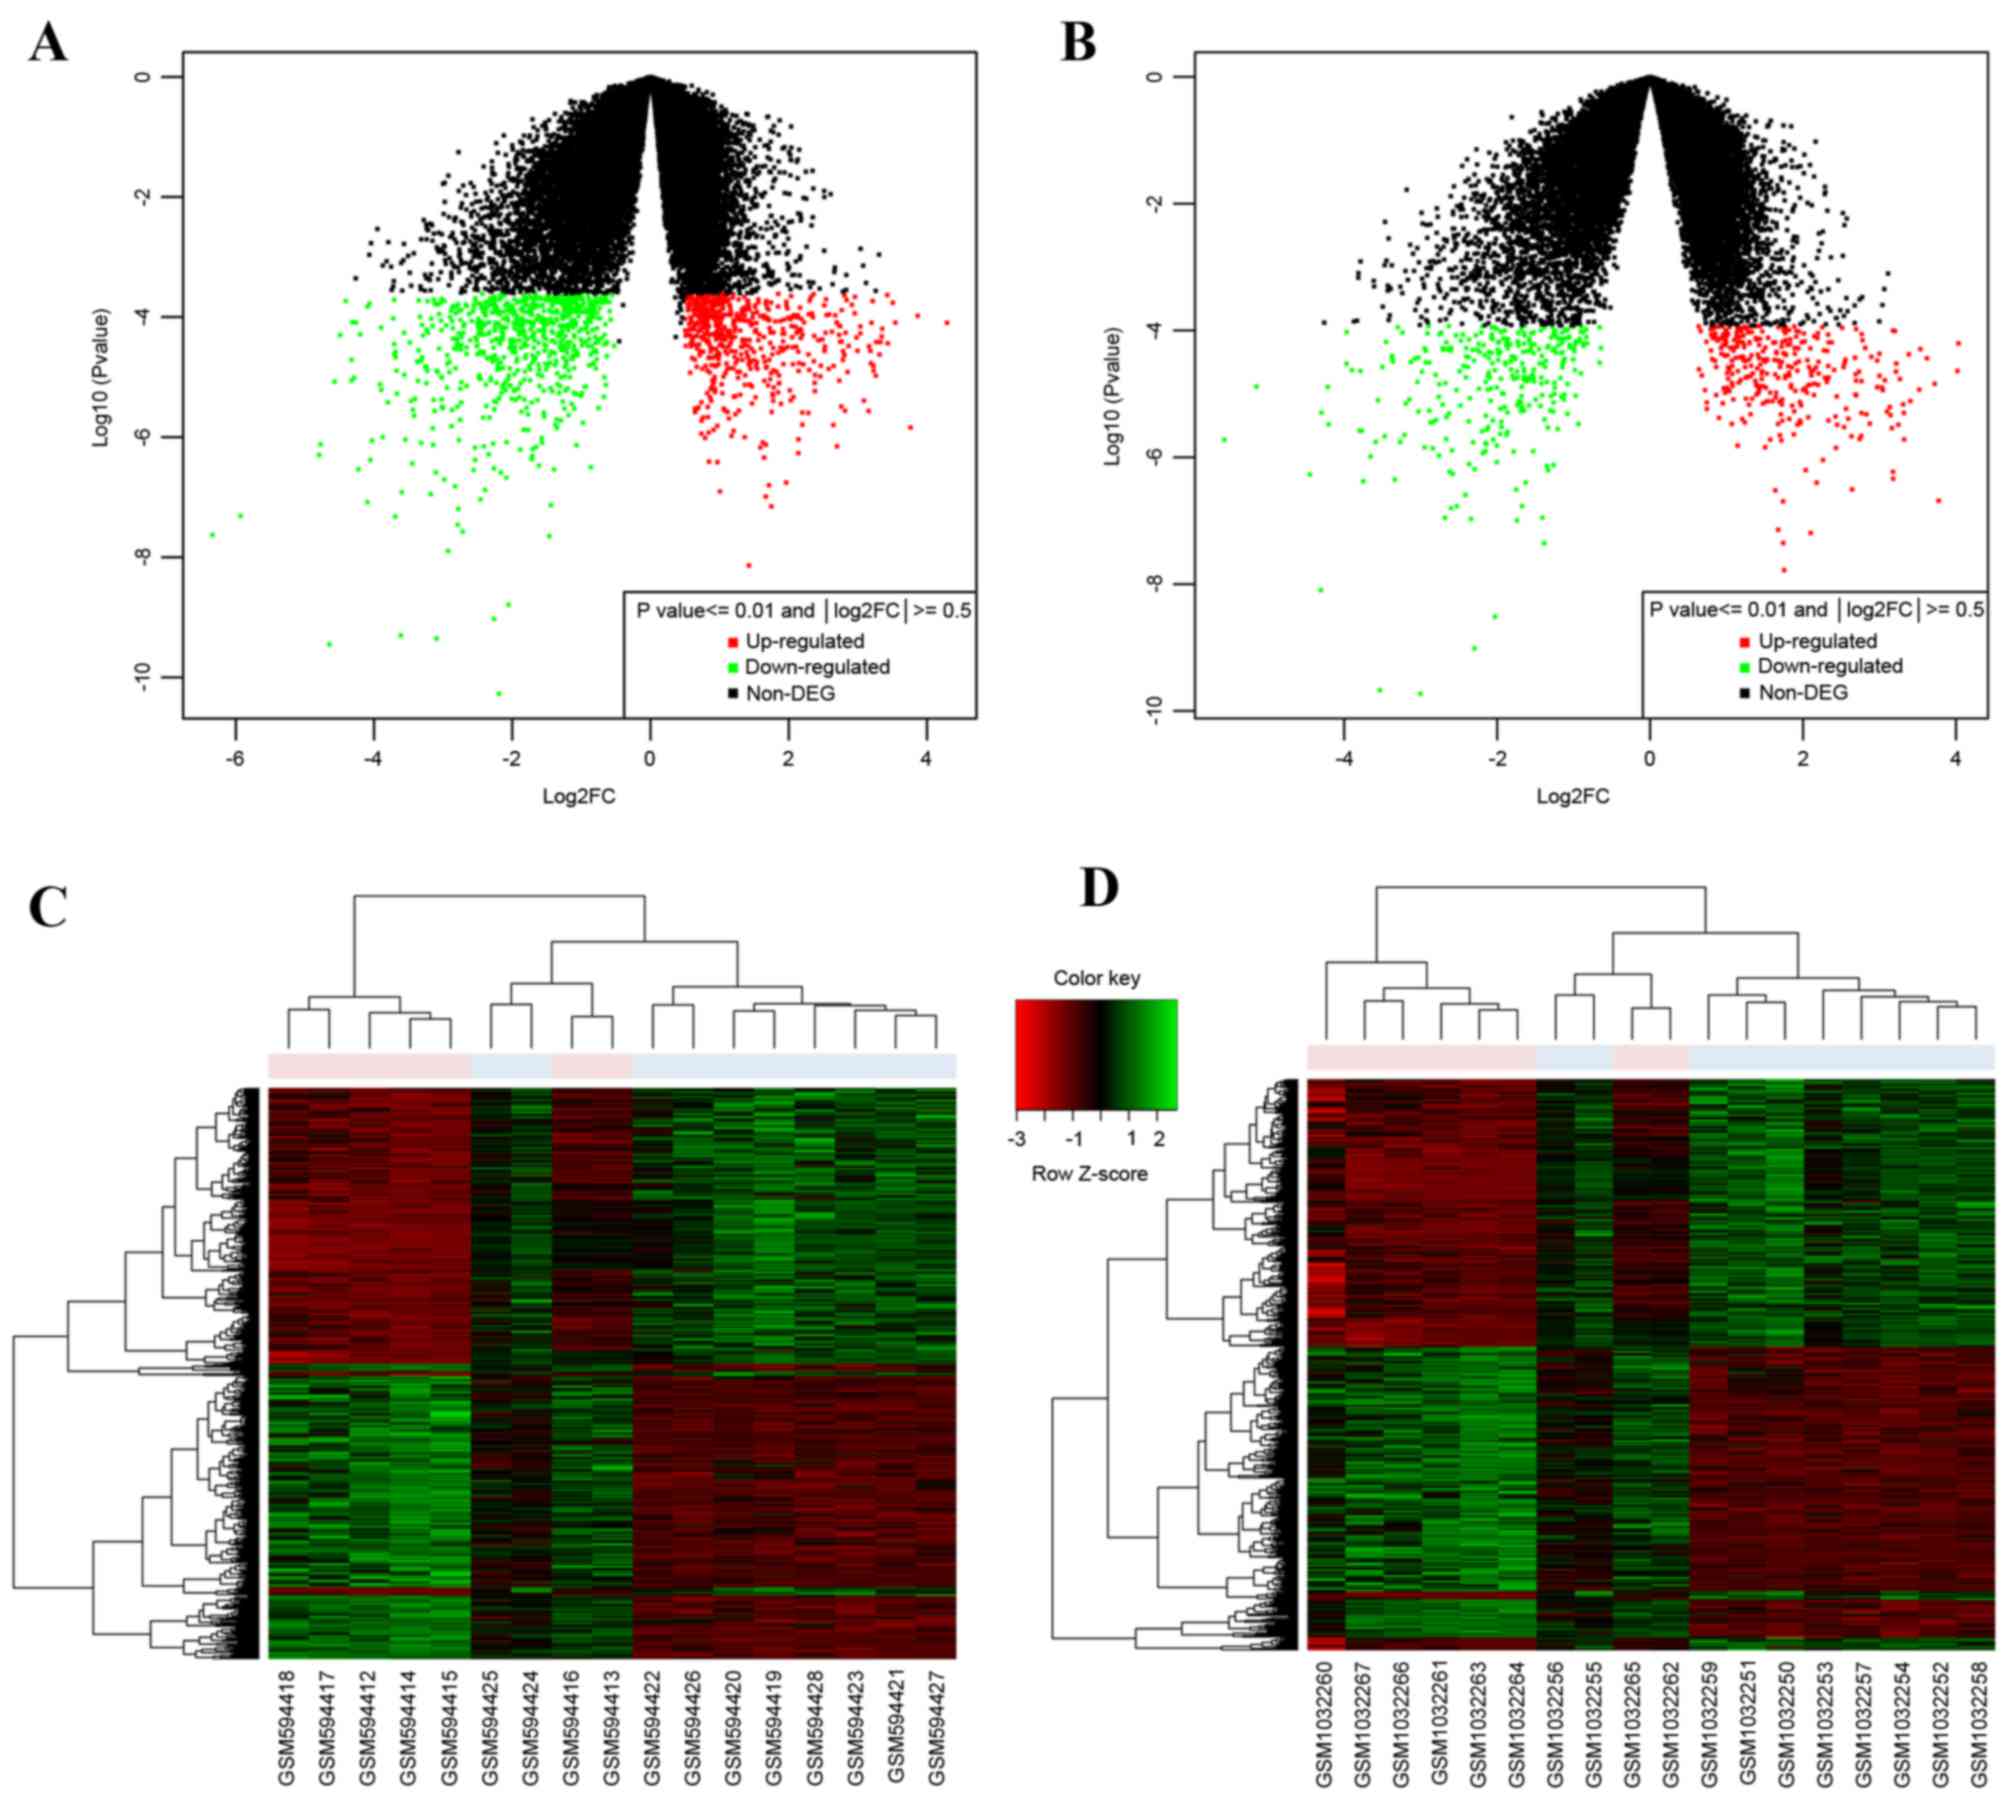
1). A total of 1,325 DEGs were screened from the GSE24152
dataset and 637 DEGs were screened from the GSE42089 dataset
(Fig. 2A and B depicts volcano plots
of the two microarrays). A total of 619 common DEGs were identified
by a Venn diagram, including 313 upregulated genes and 306
downregulated genes. From the heat maps of the 619 common DEGs
generated (Fig. 2C and D), the DEGs
could significantly distinguish the bladder carcinoma dataset from
normal dataset.
GO and KEGG enrichment analysis of
DEGs
GO and KEGG enrichment analysis were performed with
a cut-off of P<0.01, obtaining 74 GO terms and 4 KEGG pathways
were obtained. The main GO terms and KEGG pathways of 619 common
DEGs are listed in Table I. According
to the results, DEGs were mainly enriched in chromosomal assembly
and cell cycle pathways, including DNA replication, and the main GO
terms were also associated with mitosis, including mitotic sister
chromatid segregation and spindle checkpoint.
 | Table I.Functional enrichment of
differentially expressed genes. |
Table I.
Functional enrichment of
differentially expressed genes.
| Category | Term | P-value | Fold
enrichment |
|---|
| BP | Mitotic sister
chromatid segregation |
1.90×10⁻⁴ | 9.8 |
| BP | Negative regulation
of cell cycle process |
1.90×10⁻³ | 11.0 |
| BP | Spindle
checkpoint |
9.70×10⁻³ | 16.3 |
| CC | Condensed
chromosome, centromeric region |
1.70×10⁻⁹ | 9.8 |
| CC | Condensed
chromosome kinetochore |
2.90×10⁻⁹ | 10.5 |
| CC | Midbody |
1.20×10⁻³ | 13.5 |
| MF | Chromatin
binding |
4.50×10⁻³ | 3.8 |
| MF | Microtubule motor
activity |
5.30×10⁻³ | 5.2 |
| MF | Damaged DNA
binding |
1.70×10⁻³ | 7.3 |
| KEGG |
Progesterone-mediated oocyte
maturation |
1.80×10⁻⁴ | 5.5 |
| KEGG | Cell cycle |
1.10×10⁻⁸ | 6.1 |
| KEGG | DNA
replication |
1.70×10⁻⁴ | 9.1 |
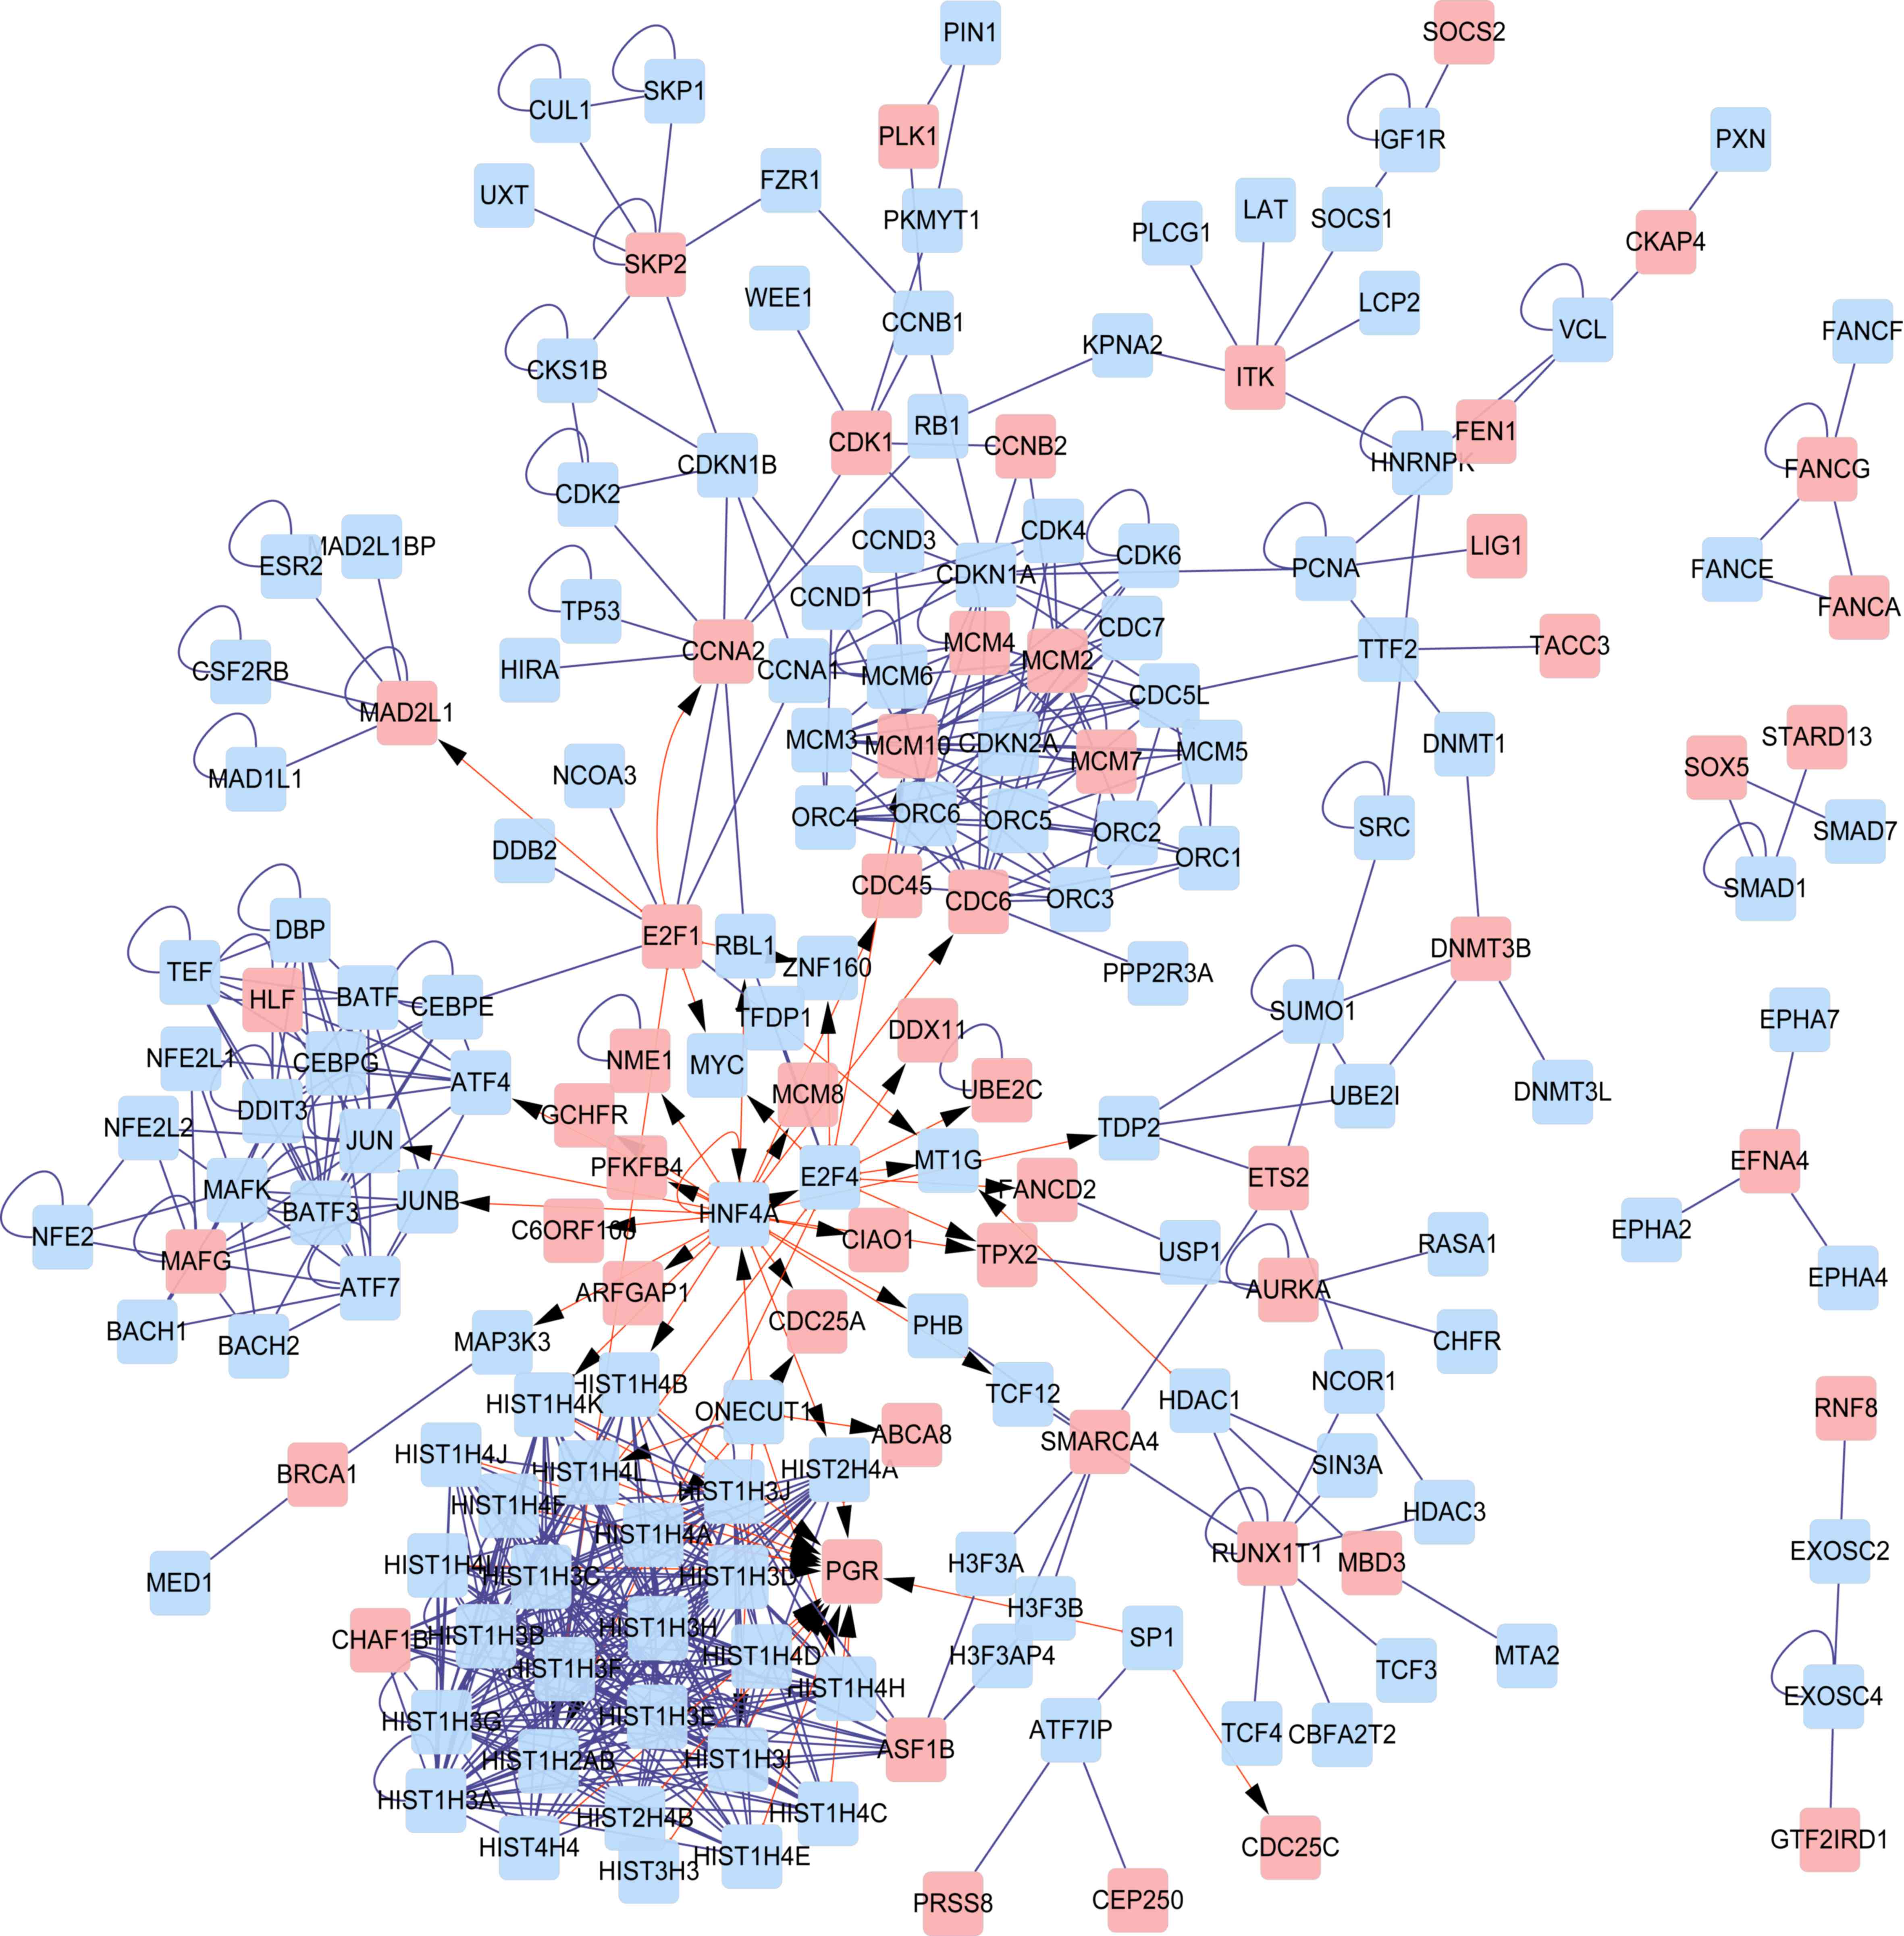
PPI network and sub-network
construction
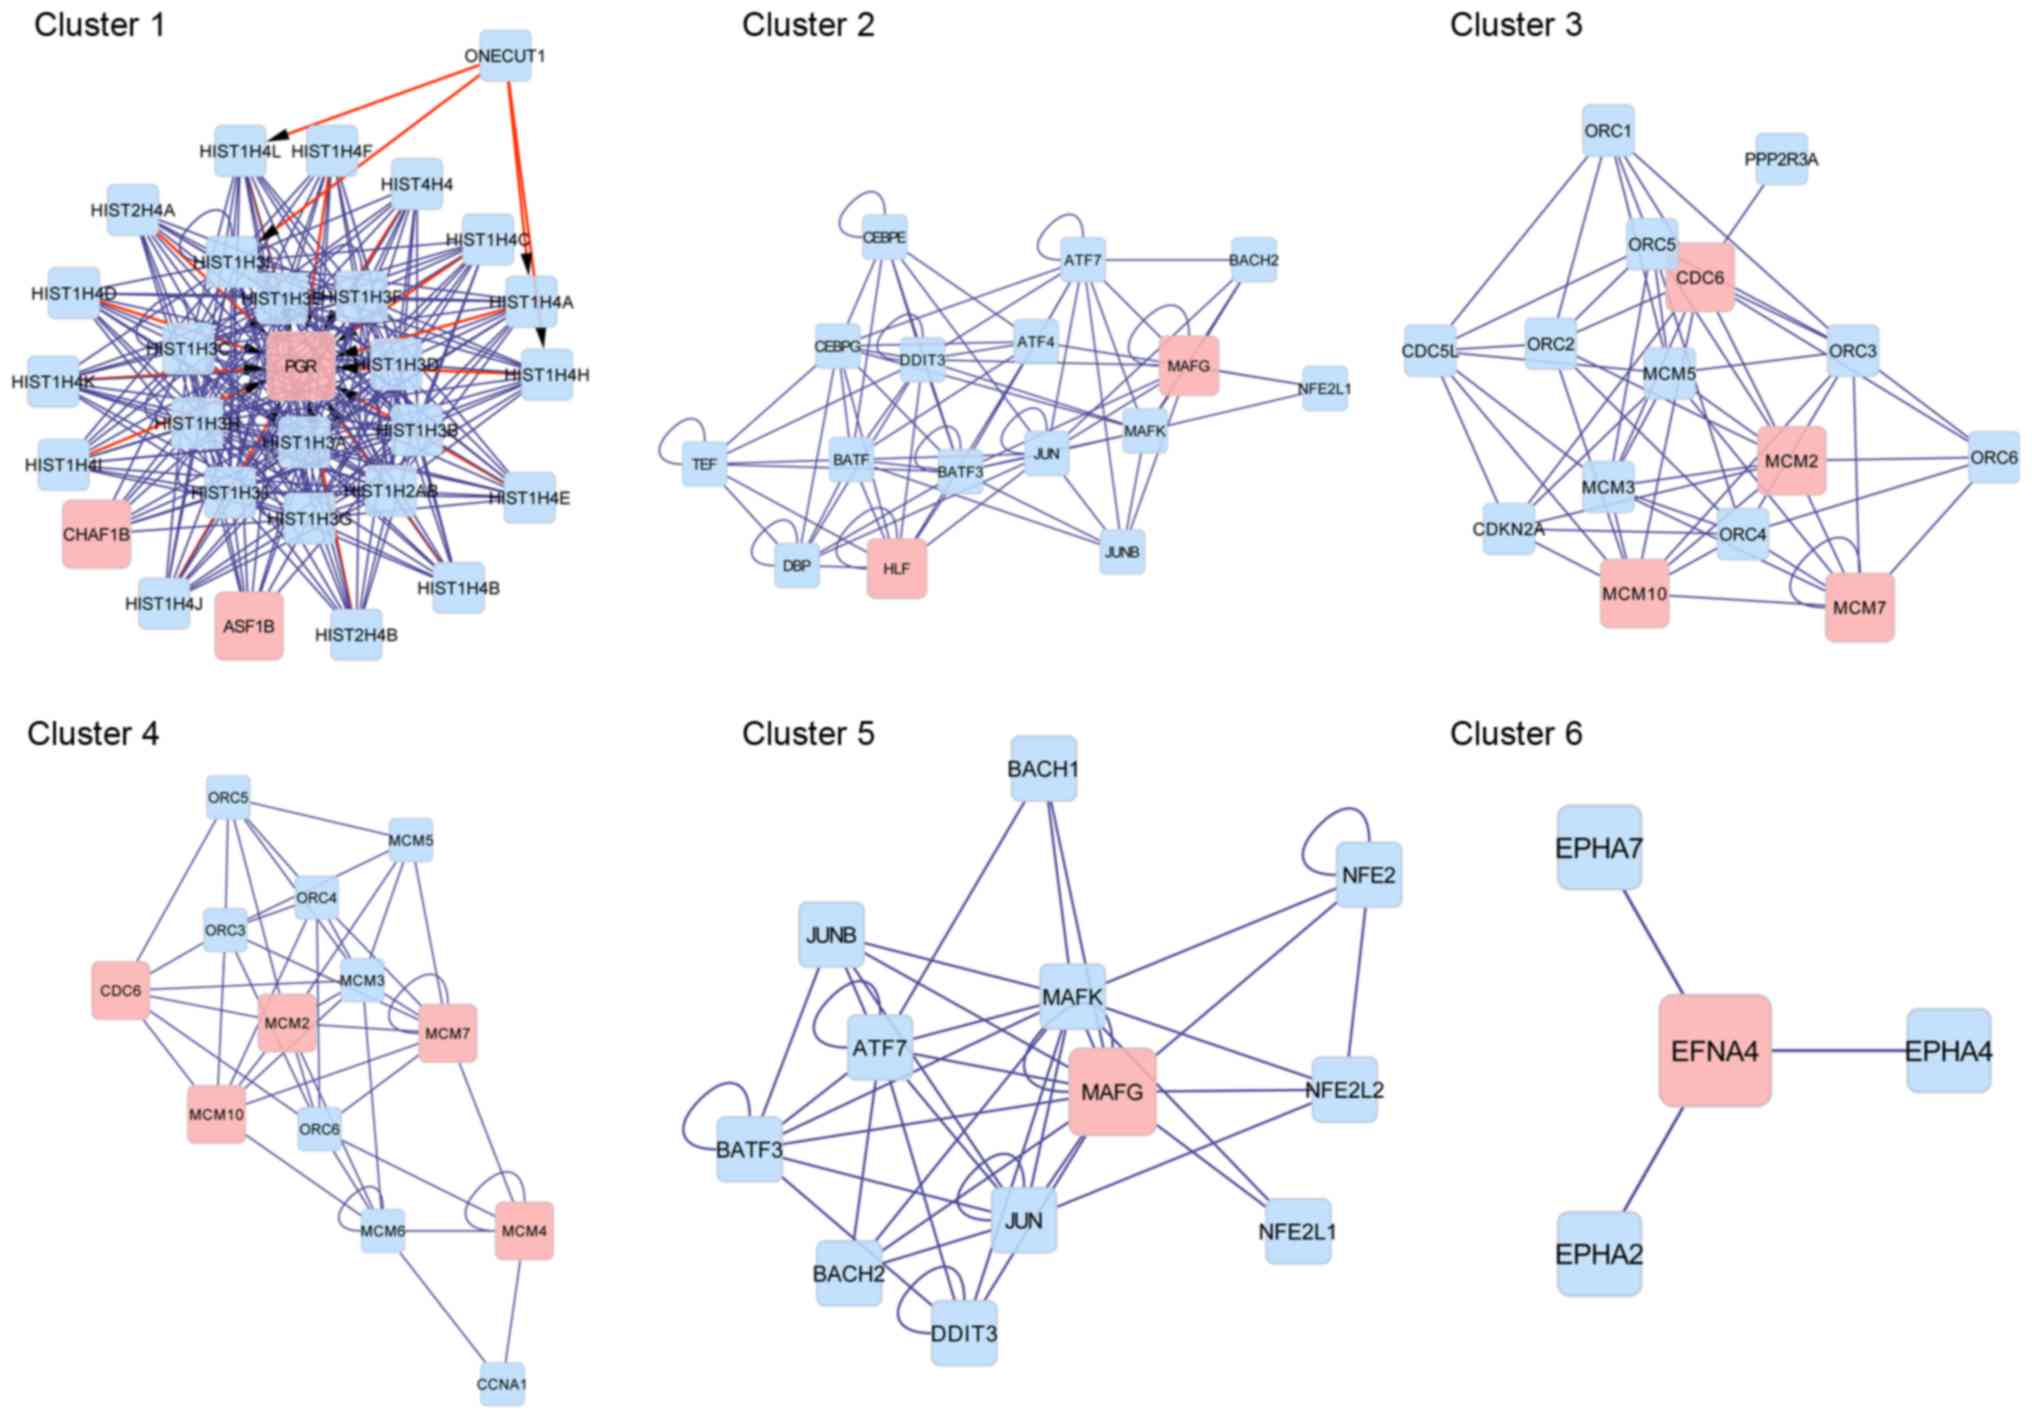
A PPI network was constructed for all DEGs (Fig. 3) and clustering analysis was performed
based on this PPI network. In total, 6 sub-networks (clusters) were
obtained (Table II and Fig. 4). Progesterone receptor (PGR)
was a key gene in cluster 1 and the proteins enriched in cluster 1
were all histone proteins. In cluster 2, MAF bZIP transcription
factor G (MAFG) was identified as a key gene and it was also
detected in cluster 5. Cell division cycle 6 (CDC6) was a
key gene in clusters 3 and 4. Minichromosome maintenance complex
component (MCM) family members, including MCM2, MCM4,
MCM7 and MCM10, were also key genes in clusters 3 and 4.
Nucleosome assembly and sequence-specific DNA binding were
significant GO terms in cluster 1 and cluster 2, respectively. No
GO terms were obtained for clusters 3–6.
| Table II.Sub-networks obtained by clustering
analysis. |
Table II.
Sub-networks obtained by clustering
analysis.
| Cluster | Nodes | Density | Quality | P-value | DEGs | Significant GO
term |
|---|
| 1 | 29 | 0.608 | 0.946 | <0.001 | PGR, CHAF1B,
ASF1B, | Nucleosome
assembly |
| 2 | 16 | 0.653 | 0.842 |
9.18×10⁻⁵ | HLF, MAFG | Sequence-specific
DNA binding |
| 3 | 15 | 0.514 | 0.635 |
4.41×10⁻⁵ | CDC6, MCM2, MCM7,
MCM10 | None found |
| 4 | 13 | 0.513 | 0.494 |
2.00×10⁻³ | CDC6, MCM2, MCM10,
MCM7, MCM4 | None found |
| 5 | 12 | 0.515 | 0.576 |
3.00×10⁻³ | MAFG | None found |
| 6 | 4 | 0.500 | 1.000 |
1.00×10⁻² | EFNA4 | None found |
Discussion
BC is a common malignancy that requires a high
degree of surveillance, owing to the frequency of recurrence and
the poor clinical outcome of invasive disease (20). Bioinformatic analysis of BC cells at
the gene level can provide novel insights into this disease. In the
present study, using the microarray datasets GSE24152 and GSE42089,
significant DEGs in BC were identified. In the significant
extracted sub-networks, PGR, MAFG, CDC6 and members of the
MCM family were identified as key genes in BC; histones were
also considered to have major functions in BC. The main GO terms
and pathways were those associated with the cell cycle and
chromosome assembly, including nucleosome assembly, spindle
checkpoint and DNA replication.
PGR encodes a member of the steroid receptor
superfamily, which mediates the physiological effects of
progesterone (21). In the present
study, PGR was an important gene in a cluster that was
regulated by a set of transcription factors, revealing the
potential significance of PGR in BC. Men are more frequently
affected by BC than women, indicating that hormones and their
receptors may function as regulatory factors (6). Miyamoto et al (22) clarified that the androgen receptor
(AR) was involved in BC. As AR and PGR are determinant modulators
of gonadal sex hormones, PGR may perform similar functions in BC
with AR, via the progesterone-mediated oocyte maturation pathway,
which was enriched in this study (23).
Histones are the main structural proteins associated
with DNA in eukaryotic cells. Histones are divided into two groups,
core histones and the nucleosomal histones (24). Core histones are some of the most
highly conserved proteins in eukaryotes and have key roles in the
organization of DNA folding (25).
The altered patterns of histone modifications in various human
cancer types have been studied extensively in recent years
(26). Schneider et al
(27) demonstrated that global
histone modification levels were lower in BC than in normal urinary
tissue. The conserved histone H2A has been reported to be
overexpressed in BC cells and contributes to the activation of
cancer-associated transcription pathways (28). In the present study, a set of core
histones was clustered in cluster 1, the main GO term of which was
associated with nucleosome assembly. Considering the function of
histones in mitosis, it was concluded that the nucleosome and
chromatin assembly may be modified in BC.
MAF encodes a nuclear
transcription-regulating protein characterized by a basic region
and leucine zipper domain; it has crucial roles in a variety of
cellular processes (29). MAFG is a
small member of the MAF protein family that consists of little more
than the DNA binding and dimerization motif (30), which is able to partially co-localize
with FBJ murine osteosarcoma viral oncogene homolog (FOS) in the
nucleus and heterodimize with it (31). Members of the AP-1 family of
transcription factors are dimeric complexes involved in cellular
proliferation, transformation and death (32), and contains the FOS, jun
proto-oncogene (JUN) and activating transcription factor (ATF)
protein families, of which FOS is a major member. AP-1 family
members are immediate early genes induced by a variety of stress
signals and control the stress response including cell
proliferation, apoptosis and tumorigenesis (33). By forming heterodimers, FOS proteins
aid the binding of AP-1 to DNA and exert oncogene activity, leading
to tumorigenesis (34). Previous
reports demonstrated that the genes encoding AP-1 participate in
the cancer-associated immune and inflammation pathways in BC
(6). The data from the present study
revealed that the expression of MAFG in BC was upregulated,
which may increase tumorigenesis by promoting the formation of FOS
dimers and the AP-1 complex.
CDC6 is an essential regulator of DNA
replication in eukaryotic cells that assembles pre-replicative
complexes at origins of replication during the G1 phase
of the cell division cycle (35).
MCM family members encode highly conserved proteins that act
as enzymatically active helicases (36). MCMs drive the formation of
pre-replicative complexes (PRCs), the formation of which is the
first key event during the G1 phase of the cell cycle
(37). MCMs and CDC6 are key proteins
in the mechanism of DNA replication and are functionally associated
with each other during the cell cycle (38). CDC6 is responsible for the loading of
MCM proteins onto origins of replication and, with the presence of
CDC6, MCMs bind to the chromatin specifically during the
G1 phase of the cell cycle (35). The increased expression of CDC6
and MCM has been observed in dysplastic cells and
CDC6 and MCM are consequently considered to be
specific biomarkers of proliferating cells (38). Recent studies have revealed the
proto-oncogenic activity of CDC6, with its overexpression
interfering with the expression of certain tumor suppressor genes
and potentially promoting DNA hyper-replication, inducing a
senescence response similar to that caused by oncogene activation
(39,40). Some members of the MCM family, such as
MCM7, were also overexpressed and amplified in a variety of human
malignancies (41). In the present
study, the expression of CDC6 was found to be upregulated,
revealing that in BC cells, DNA replication is aberrant.
In conclusion, the present study reveals that the
genes PGR, MAFG, CDC6 and MCMs, and a set of histones
are important factors in BC and have key roles in mitotic
processes, including nucleosome assembly, spindle checkpoint and
DNA replication. However, the small size of the microarray sample
and the lack of experimental variation are limitations. Thus,
further studies with larger sample size and experimental
verification should be performed to confirm the conclusions of the
current study.
References
|
1
|
Ploeg M, Aben KK and Kiemeney LA: The
present and future burden of urinary bladder cancer in the world.
World J Urol. 27:289–293. 2009. View Article : Google Scholar : PubMed/NCBI
|
|
2
|
Siegel R, Naishadham D and Jemal A: Cancer
statistics, 2013. CA Cancer J Clin. 63:11–30. 2013. View Article : Google Scholar : PubMed/NCBI
|
|
3
|
Karavitakis M, Msaouel P, Michalopoulos V
and Koutsilieris M: Pattern of somatostatin receptors expression in
normal and bladder cancer tissue samples. Anticancer Res.
34:2937–2942. 2014.PubMed/NCBI
|
|
4
|
Eisenberg MS, Boorjian SA, Cheville JC,
Thompson RH, Thapa P, Kaushik D and Frank I: The SPARC score: A
multifactorial outcome prediction model for patients undergoing
radical cystectomy for bladder cancer. J Urol. 190:2005–2010. 2013.
View Article : Google Scholar : PubMed/NCBI
|
|
5
|
James ND, Hussain SA, Hall E, Jenkins P,
Tremlett J, Rawlings C, Crundwell M, Sizer B, Sreenivasan T,
Hendron C, et al: Radiotherapy with or without chemotherapy in
muscle-invasive bladder cancer. N Engl J Med. 366:1477–1488. 2012.
View Article : Google Scholar : PubMed/NCBI
|
|
6
|
Shen Y, Wang X, Jin Y, Lu J, Qiu G and Wen
X: Differentially expressed genes and interacting pathways in
bladder cancer revealed by bioinformatic analysis. Mol Med Rep.
10:1746–1752. 2014. View Article : Google Scholar : PubMed/NCBI
|
|
7
|
Zhou N, Singh K, Mir MC, Parker Y, Lindner
D, Dreicer R, Ecsedy JA, Zhang Z, Teh BT, Almasan A and Hansel DE:
The investigational aurora kinase a inhibitor MLN8237 induces
defects in cell viability and cell-cycle progression in malignant
bladder cancer cells in vitro and in vivo. Clin Cancer Res.
19:1717–1728. 2013. View Article : Google Scholar : PubMed/NCBI
|
|
8
|
Zhang Z, Furge KA, Yang XJ, Teh BT and
Hansel DE: Comparative gene expression profiling analysis of
urothelial carcinoma of the renal pelvis and bladder. BMC Med
Genomics. 3:582010. View Article : Google Scholar : PubMed/NCBI
|
|
9
|
Gautier L, Cope L, Bolstad BM and Irizarry
RA: Affy-analysis of Affymetrix GeneChip data at the probe level.
Bioinformatics. 20:307–315. 2004. View Article : Google Scholar : PubMed/NCBI
|
|
10
|
Smyth GK: Limma: Linear models for
microarray dataBioinformatics and computational biology solutions
using R and Bioconductor. Springer; New York, NY: pp. 397–420.
2005, View Article : Google Scholar
|
|
11
|
Chen H and Boutros PC: VennDiagram: A
package for the generation of highly-customizable Venn and Euler
diagrams in R. BMC Bioinformatics. 12:352011. View Article : Google Scholar : PubMed/NCBI
|
|
12
|
Wickham H: ggplot2: Elegant graphics for
data analysis. Springer; New York, NY: 2009, View Article : Google Scholar
|
|
13
|
Hulsegge I, Kommadath A and Smits MA:
Globaltest and GOEAST: Two different approaches for Gene Ontology
analysis. BMC Proc. 3 Suppl 4:S102009. View Article : Google Scholar : PubMed/NCBI
|
|
14
|
Galperin MY and Fernández-Suárez XM: The
2012 nucleic acids research database issue and the online molecular
biology database collection. Nucleic Acids Res. 40:(Database
Issue). D1–D8. 2012. View Article : Google Scholar : PubMed/NCBI
|
|
15
|
Huang da W, Sherman BT and Lempicki RA:
Bioinformatics enrichment tools: Paths toward the comprehensive
functional analysis of large gene lists. Nucleic Acids Res.
37:1–13. 2009. View Article : Google Scholar : PubMed/NCBI
|
|
16
|
Smoot ME, Ono K, Ruscheinski J, Wang PL
and Ideker T: Cytoscape 2.8: New features for data integration and
network visualization. Bioinformatics. 27:431–432. 2011. View Article : Google Scholar : PubMed/NCBI
|
|
17
|
Martin A, Ochagavia ME, Rabasa LC, Miranda
J, Fernandez-de-Cossio J and Bringas R: BisoGenet: A new tool for
gene network building, visualization and analysis. BMC
Bioinformatics. 11:912010. View Article : Google Scholar : PubMed/NCBI
|
|
18
|
Bader GD, Betel D and Hogue CW: BIND: The
biomolecular interaction network database. Nucleic Acids Res.
31:248–250. 2003. View Article : Google Scholar : PubMed/NCBI
|
|
19
|
Nepusz T, Yu H and Paccanaro A: Detecting
overlapping protein complexes in protein-protein interaction
networks. Nat Methods. 9:471–472. 2012. View Article : Google Scholar : PubMed/NCBI
|
|
20
|
Jemal A, Siegel R, Ward E, Hao Y, Xu J,
Murray T and Thun MJ: Cancer statistics, 2008. CA Cancer J Clin.
58:71–96. 2008. View Article : Google Scholar : PubMed/NCBI
|
|
21
|
Mulac-Jericevic B and Conneely OM:
Reproductive tissue selective actions of progesterone receptors.
Reproduction. 128:139–146. 2004. View Article : Google Scholar : PubMed/NCBI
|
|
22
|
Miyamoto H, Yang Z, Chen YT, Ishiguro H,
Uemura H, Kubota Y, Nagashima Y, Chang YJ, Hu YC, Tsai MY, et al:
Promotion of bladder cancer development and progression by androgen
receptor signals. J Natl Cancer Inst. 99:558–568. 2007. View Article : Google Scholar : PubMed/NCBI
|
|
23
|
De León-Nava MA, Nava K, Soldevila G,
López-Griego L, Chávez-Ríos JR, Vargas-Villavicencio JA and
Morales-Montor J: Immune sexual dimorphism: Effect of gonadal
steroids on the expression of cytokines, sex steroid receptors, and
lymphocyte proliferation. J Steroid Biochem Mol Biol. 113:57–64.
2009. View Article : Google Scholar : PubMed/NCBI
|
|
24
|
Loyola A and Almouzni G: Histone
chaperones, a supporting role in the limelight. Biochim Biophys
Acta. 1677:3–11. 2004. View Article : Google Scholar : PubMed/NCBI
|
|
25
|
Vaquero A, Loyola A and Reinberg D: The
constantly changing face of chromatin. Sci Aging Knowledge Environ.
2003:RE42003. View Article : Google Scholar : PubMed/NCBI
|
|
26
|
Esteller M: Cancer epigenomics: DNA
methylomes and histone-modification maps. Nat Rev Genet. 8:286–298.
2007. View
Article : Google Scholar : PubMed/NCBI
|
|
27
|
Schneider AC, Heukamp LC, Rogenhofer S,
Fechner G, Bastian PJ, von Ruecker A, Müller SC and Ellinger J:
Global histone H4K20 trimethylation predicts cancer-specific
survival in patients with muscle-invasive bladder cancer. BJU Int.
108:E290–E296. 2011. View Article : Google Scholar : PubMed/NCBI
|
|
28
|
Kim K, Punj V, Choi J, Heo K, Kim JM,
Laird PW and An W: Gene dysregulation by histone variant H2A.Z in
bladder cancer. Epigenetics Chromatin. 6:342013. View Article : Google Scholar : PubMed/NCBI
|
|
29
|
Motohashi H, O'Connor T, Katsuoka F, Engel
JD and Yamamoto M: Integration and diversity of the regulatory
network composed of Maf and CNC families of transcription factors.
Gene. 294:1–12. 2002. View Article : Google Scholar : PubMed/NCBI
|
|
30
|
Kyo M, Yamamoto T, Motohashi H, Kamiya T,
Kuroita T, Tanaka T, Engel JD, Kawakami B and Yamamoto M:
Evaluation of MafG interaction with Maf recognition element arrays
by surface plasmon resonance imaging technique. Genes Cells.
9:153–164. 2004. View Article : Google Scholar : PubMed/NCBI
|
|
31
|
Shimokawa N, Kumaki I, Qiu CH, Ohmiya Y,
Takayama K and Koibuchi N: Extracellular acidification enhances DNA
binding activity of MafG-FosB heterodimer. J Cell Physiol.
205:77–85. 2005. View Article : Google Scholar : PubMed/NCBI
|
|
32
|
Shaulian E and Karin M: AP-1 as a
regulator of cell life and death. Nat Cell Biol. 4:E131–E136. 2002.
View Article : Google Scholar : PubMed/NCBI
|
|
33
|
Avouac J, Palumbo K, Tomcik M, Zerr P,
Dees C, Horn A, Maurer B, Akhmetshina A, Beyer C, Sadowski A, et
al: Inhibition of activator protein 1 signaling abrogates
transforming growth factor β-mediated activation of fibroblasts and
prevents experimental fibrosis. Arthritis Rheum. 64:1642–1652.
2012. View Article : Google Scholar : PubMed/NCBI
|
|
34
|
Gopalakrishnan A and Kong Tony AN:
Anticarcinogenesis by dietary phytochemicals: Cytoprotection by
Nrf2 in normal cells and cytotoxicity by modulation of
transcription factors NF-kappa B and AP-1 in abnormal cancer cells.
Food Chem Toxicol. 46:1257–1270. 2008. View Article : Google Scholar : PubMed/NCBI
|
|
35
|
Borlado LR and Méndez J: CDC6: From DNA
replication to cell cycle checkpoints and oncogenesis.
Carcinogenesis. 29:237–243. 2008. View Article : Google Scholar : PubMed/NCBI
|
|
36
|
Brun C, Guénoche A and Jacq B: Approach of
the functional evolution of duplicated genes in Saccharomyces
cerevisiae using a new classification method based on
protein-protein interaction data. J Struct Funct Genomics.
3:213–224. 2003. View Article : Google Scholar : PubMed/NCBI
|
|
37
|
Korkolopoulou P, Givalos N, Saetta A,
Goudopoulou A, Gakiopoulou H, Thymara I, Thomas-Tsagli E and
Patsouris E: Minichromosome maintenance proteins 2 and 5 expression
in muscle-invasive urothelial cancer: A multivariate survival study
including proliferation markers and cell cycle regulators. Human
Pathol. 36:899–907. 2005. View Article : Google Scholar
|
|
38
|
Murphy N, Ring M, Heffron CC, King B,
Killalea AG, Hughes C, Martin CM, McGuinness E, Sheils O and
O'Leary JJ: p16INK4A, CDC6, and MCM5: Predictive biomarkers in
cervical preinvasive neoplasia and cervical cancer. J Clin Pathol.
58:525–534. 2005. View Article : Google Scholar : PubMed/NCBI
|
|
39
|
Borlado LR and Méndez J: CDC6: From DNA
replication to cell cycle checkpoints and oncogenesis.
Carcinogenesis. 29:237–243. 2008. View Article : Google Scholar : PubMed/NCBI
|
|
40
|
Yao Z and Mishra L: Cancer stem cells and
hepatocellular carcinoma. Cancer Biol Ther. 8:1691–1698. 2009.
View Article : Google Scholar : PubMed/NCBI
|
|
41
|
Luo JH: Oncogenic activity of MCM7
transforming cluster. World J Clin Oncol. 2:120–124. 2011.
View Article : Google Scholar : PubMed/NCBI
|