Introduction
Meningiomas are common intracranial tumors that
account for ~36% of all primary central nervous system tumors
(1). According to the World Health
Organization classification (2),
meningiomas may be divided into three grades, including benign
(Grade I), atypical (Grade II) and anaplastic (Grade III)
meningiomas. Although the majority of meningiomas are benign tumors
that are curable by surgery, atypical and anaplastic tumors remain
therapeutically challenging due to the high risk of tumor relapse
(3,4).
Furthermore, even after complete resection, relapse occurs in
>5% of benign meningiomas (5,6).
The pathogenesis of meningioma is a complex process
associated with an accumulation of various genetic and epigenetic
alterations that occur during the initiation and progression of the
tumor (7). Monosomy 22, 22q deletion
and/or mutation of the neurofibromatosis type 2 gene have been
identified as important initiating events and represent the most
common genetic alterations in meningiomas (8–10). Other
common chromosomal alterations include deletions of 1p, 6q, 10q and
14q, and insertions of 1q, 9q, 12q, 15q, 17q and 20q (7,11,12). However, there is insufficient evidence
to verify the capability of these chromosomal alterations to
predict tumor recurrence and progression.
Several gene expression profiling studies have been
conducted on meningiomas, and several candidate genes have been
proposed as recurrence-associated predictors or
progression-associated biomarkers of meningiomas among the
differentially expressed genes (DEGs), including KLF4, GAB2, TRAF7,
LMO3, SMO and TSLC1 (13–16). Additionally, the prognostic
capabilities of CKS2, PTTG1 and the leptin receptor have also been
indicated by mixed transcriptome analyses (17,18).
However, research has mainly focused on identifying candidate genes
that may be potential novel biomarkers for meningioma, while the
possible intrinsic links among DEGs have not been extensively
investigated. Studies aimed at identifying the key pathways and
characteristics of the biology involved in this tumor remain
limited (11,14,17,18).
Traditional biology research can reveal molecular
mechanisms based on the variation and function of an individual
gene, mRNA or protein; however, it only describes the biological
phenomenon of a disease from a partial viewpoint, rather than
describing it in the context of the entire system. Bioinformatics
analysis is a powerful tool that provides a novel platform to study
the characteristics of biology at a more holistic perspective and
elaborate the association of different functional elements
(7,15,18).
In the present study, bioinformatics analysis was
conducted to determine several potential biomarkers of meningioma
(namely JUN, PIK3R1, FOS, AGT and MYC), as well as to identify
relevant pathways (including the AGE-RAGE signaling pathway in
diabetic complications, PI3K-Akt signaling pathway, ECM-receptor
interaction and cell adhesion among others), which are potentially
involved in the onset and progression of meningioma. Furthermore,
clinical evidence exists to verify the capability of these
aforementioned biomarkers and pathways in the prediction of
meningioma recurrence and progression. In conclusion, the findings
of the present study provide further insight into the pathogenesis
of meningiomas and provide potential therapeutic targets for
further studies.
Materials and methods
Source of data
Initially, the microarray expression profile of the
GSE43290 data set was downloaded from the Gene Expression Omnibus
(GEO) database (19). The GSE43290
data set, which includes 47 meningioma samples and 4 normal
meningeal samples, was submitted by Tabernero et al
(20). The platform of these
microarray data, GPL96 [HG-U133A] Affymetrix Human Genome U133A
Array, was also downloaded from the GEO database. Using the affy
package in R software (version 3.25; www.r-project.org) (21), the obtained raw data were
preprocessed, which involved background correction, quartile
normalization and probe summarization.
Extraction of differentially expressed
genes (DEGs)
A Student's t-test in the Limma package in R
software (22) was performed to
identify the DEGs between the meningioma and normal meningeal
(control) samples. All genes that met the following criteria were
selected as DEGs: P-value of <0.05 and |log2(fold
change)| of >1. A heat map of the extracted DEGs was then
created through the gplots package in R, in order to visualize the
expression values of genes in the different samples.
Functional enrichment analysis of
DEGs
Following extraction of the DEGs, Gene Ontology (GO)
and Kyoto Encyclopedia Genes and Genomes (KEGG) pathway enrichment
analyses were conducted. GO analysis is a common bioinformatics
method for identifying characteristic biological attributes in
large-scale genomic and transcriptomic data (23). KEGG is a database for the systematic
analysis of genetic functions that links genomic information with
higher order functional information (24). In the present study, the GO analysis
was conducted via the Database for Annotation, Visualization and
Integrated Discovery (DAVID; https://david.ncifcrf.gov), a web-based tool for
systematic functional analysis (25).
The GO categories selected included ‘biological process’,
‘molecular function’ and ‘cellular component’. The KEGG pathway
analysis of the DEGs was conducted through the ClusterProfiler
package in R software. A P-value of <0.05 was selected as the
cut-off criterion.
Integration of protein-protein
interaction (PPI) network and module analysis
PPI network analysis is a method for identifying the
associations among various proteins. To acquire further insights
into the molecular mechanisms of meningioma, the list of DEGs was
entered into the Search Tool for the Retrieval of Interacting Genes
(STRING) database, which is an online database designed to evaluate
PPI information (26). Using this
tool, gene-gene interactions with a combined score of >0.9 were
selected to construct the PPI network. Cytoscape software (version
3.4.0) was then used to visualize the obtained PPI network
(27).
All genes with a connectivity degree (defined as the
number of other genes that directly interact with that particular
gene) of >20 were selected as hub genes in the network. The core
genes were the most likely to be involved in meningioma and to be
potential biomarkers of tumor development and progression. In
addition, significant modules of the PPI network were identified
using the Molecular Complex Detection (MCODE) Cytoscape plug-in. An
MCODE score (indicating the density of nodes) of >10 and node
number of >10 were selected as the significance threshold
criteria. Next, KEGG pathway enrichment analysis of the DEGs in
these modules was performed using DAVID aiming to evaluate the
genetic functions at the molecular level. A P-value of P<0.05
was selected as the cut-off criterion for identifying the
significant pathways associated with these modules.
Results
DEGs in meningioma vs. normal
meningeal tissues
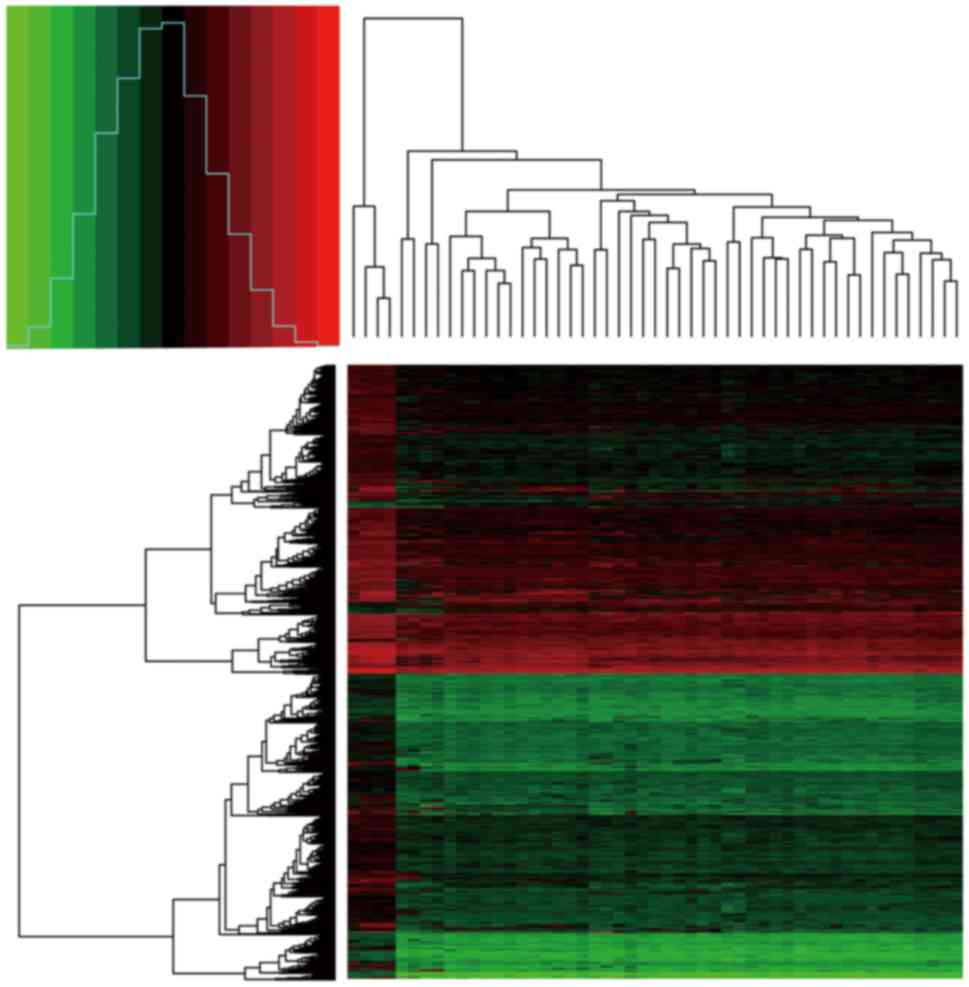
According to the t-test analysis of the DEGs in the
47 tumor samples compared with the 4 normal meningeal samples, a
total of 1,683 DEGs were identified, including 66 upregulated and
1,617 downregulated genes. The heat map of DEG expression is shown
in Fig. 1.
Enriched GO terms and KEGG pathways of
the identified DEGs
In the present study, a total of 649 enriched GO
terms and 34 KEGG pathways were identified. The top 30 enriched GO
terms of the DEGs according to the P-value threshold (P<0.05)
are shown in Table I. The
downregulated genes were significantly associated with ‘protein
binding’, ‘cytoplasm’, ‘extracellular matrix (ECM) organization’
and ‘cell adhesion’, whereas there were no GO terms that were
significantly enriched among the upregulated DEGs. The enriched
KEGG pathways of the DEGs are shown in Table II. A number of the enriched KEGG
pathways were directly associated with cancer, including the
‘pathways in cancer’ and ‘small cell lung cancer’ pathways.
Furthermore, there was enrichment of certain other pathways that
are potentially involved in the development and progression of
meningiomas via various biological processes, including the
‘AGE-RAGE signaling pathway in diabetic complications’, ‘PI3K-Akt
signaling pathway’, ‘ECM-receptor interaction’ and ‘cell adhesion
molecules’.
 | Table I.GO analysis of differentially
expressed genes associated with meningioma. |
Table I.
GO analysis of differentially
expressed genes associated with meningioma.
| Category | Term | Count | P-value |
|---|
|
GOTERM_MF_DIRECT | Protein
binding | 931 |
5.26×10⁻¹⁵ |
|
GOTERM_CC_DIRECT | Cytoplasm | 587 | 1.36×10⁻¹³ |
|
GOTERM_BP_DIRECT | Extracellular
matrix organization | 53 |
1.22×10⁻¹² |
|
GOTERM_CC_DIRECT | Cytosol | 397 | 2.33×10⁻¹² |
|
GOTERM_BP_DIRECT | Cell adhesion | 91 |
2.85×10⁻¹² |
|
GOTERM_CC_DIRECT | Extracellular
exosome | 344 | 8.41×10⁻¹² |
|
GOTERM_CC_DIRECT | Extracellular
matrix | 61 |
5.24×10⁻¹⁰ |
|
GOTERM_CC_DIRECT | Focal adhesion | 73 | 9.24×10⁻¹⁰ |
|
GOTERM_CC_DIRECT | Z disc | 34 |
1.06×10⁻⁹ |
|
GOTERM_BP_DIRECT | Angiogenesis | 51 | 2.10×10⁻⁹ |
|
GOTERM_CC_DIRECT | Extracellular
space | 181 |
2.87×10⁻⁹ |
|
GOTERM_BP_DIRECT | Signal
transduction | 166 | 5.42×10⁻⁹ |
|
GOTERM_BP_DIRECT | Positive regulation
of transcription from RNA polymerase II promoter | 140 |
1.15×10⁻⁷ |
|
GOTERM_CC_DIRECT | Extracellular
region | 201 | 1.16×10⁻⁷ |
|
GOTERM_MF_DIRECT | Transcription
factor binding | 54 |
2.02×10⁻⁷ |
|
GOTERM_CC_DIRECT | Stress fiber | 19 | 3.71×10⁻⁷ |
|
GOTERM_BP_DIRECT | Positive regulation
of angiogenesis | 30 |
3.72×10⁻⁷ |
|
GOTERM_MF_DIRECT | Identical protein
binding | 109 | 3.97×10⁻⁷ |
|
GOTERM_CC_DIRECT | Integral component
of plasma membrane | 178 |
4.34×10⁻⁷ |
|
GOTERM_CC_DIRECT | Cell surface | 83 | 6.11×10⁻⁷ |
|
GOTERM_BP_DIRECT | Type I interferon
signaling pathway | 21 |
6.20×10⁻⁷ |
|
GOTERM_BP_DIRECT | Negative regulation
of cell proliferation | 68 | 6.72×10⁻⁷ |
|
GOTERM_BP_DIRECT | Immune
response | 71 |
7.37×10⁻⁷ |
|
GOTERM_BP_DIRECT | Response to
hypoxia | 38 | 7.54×10⁻⁷ |
|
GOTERM_CC_DIRECT | Myelin sheath | 34 |
7.94×10⁻⁷ |
|
GOTERM_CC_DIRECT | Membrane raft | 41 | 1.24×10⁻⁶ |
|
GOTERM_CC_DIRECT | Neuron
projection | 45 |
1.34×10⁻⁶ |
|
GOTERM_CC_DIRECT | Actin filament | 20 | 1.73×10⁻⁶ |
|
GOTERM_BP_DIRECT | Positive regulation
of apoptotic process | 54 |
2.63×10⁻⁶ |
|
GOTERM_CC_DIRECT | Proteinaceous
extracellular matrix | 48 | 3.10×10⁻⁶ |
| Table II.Enriched Kyoto Encyclopedia of Genes
and Genomes pathways of differentially expressed genes associated
with meningioma. |
Table II.
Enriched Kyoto Encyclopedia of Genes
and Genomes pathways of differentially expressed genes associated
with meningioma.
| Pathway ID | Description | Gene count | P-value |
|---|
| hsa04933 | AGE-RAGE signaling
pathway in diabetic complications | 32 |
7.86×10⁻⁹ |
| hsa04151 | PI3K-Akt signaling
pathway | 70 | 3.98×10⁻⁸ |
| hsa04668 | TNF signaling
pathway | 32 |
7.73×10⁻⁸ |
| hsa04512 | ECM-receptor
interaction | 26 | 1.98×10⁻⁷ |
| hsa04510 | Focal adhesion | 46 |
3.84×10⁻⁷ |
| hsa05410 | Hypertrophic
cardiomyopathy | 23 | 1.28×10⁻⁵ |
| hsa04066 | HIF-1 signaling
pathway | 26 |
2.21×10⁻⁵ |
| hsa04210 | Apoptosis | 32 | 2.36×10⁻⁵ |
| hsa05146 | Amoebiasis | 25 |
2.62×10⁻⁵ |
| hsa05414 | Dilated
cardiomyopathy | 23 | 5.30×10⁻⁵ |
| hsa05200 | Pathways in
cancer | 67 |
9.01×10⁻⁵ |
| hsa05144 | Malaria | 15 | 1.21×10⁻⁴ |
| hsa05222 | Small cell lung
cancer | 21 |
2.22×10⁻⁴ |
| hsa05134 | Legionellosis | 15 | 4.93×10⁻⁴ |
| hsa05031 | Amphetamine
addiction | 17 |
6.46×10⁻⁴ |
| hsa04657 | IL-17 signaling
pathway | 21 | 6.90×10⁻⁴ |
| hsa05161 | Hepatitis B | 29 |
7.24×10⁻⁴ |
| hsa04978 | Mineral
absorption | 14 | 8.68×10⁻⁴ |
| hsa04068 | FoxO signaling
pathway | 27 |
8.68×10⁻⁴ |
| hsa04010 | MAPK signaling
pathway | 44 | 9.13×10⁻⁴ |
| hsa04064 | NF-κB signaling
pathway | 21 |
9.27×10⁻⁴ |
| hsa04060 | Cytokine-cytokine
receptor interaction | 46 | 9.30×10⁻⁴ |
| hsa05416 | Viral
myocarditis | 15 |
1.10×10⁻³ |
| hsa05412 | Arrhythmogenic
right ventricular cardiomyopathy | 17 | 1.29×10⁻³ |
| hsa05202 | Transcriptional
misregulation in cancer | 33 |
1.39×10⁻³ |
| hsa04514 | Cell adhesion
molecules | 28 | 1.40×10⁻³ |
| hsa05166 | HTLV–I
infection | 43 |
2.10×10⁻³ |
| hsa04261 | Adrenergic
signaling in cardiomyocytes | 28 | 2.14×10⁻³ |
| hsa04022 | cGMP-PKG signaling
pathway | 30 |
3.39×10⁻³ |
| hsa04145 | Phagosome | 28 | 3.51×10⁻³ |
| hsa04610 | Complement and
coagulation cascades | 17 |
3.71×10⁻³ |
| hsa04621 | NOD-like receptor
signaling pathway | 30 | 4.06×10⁻³ |
| hsa05162 | Measles | 25 |
4.86×10⁻³ |
| hsa04921 | Oxytocin signaling
pathway | 28 | 5.09×10⁻³ |
Module screening from the PPI
network
Based on the STRING data, a PPI network of 807 nodes
and 2,598 edges was obtained. Nodes with a connectivity degree of
>20 were determined as hub genes (Table III). Among them, the top five genes
according to their connectivity degree were JUN, PIKR1, FOS, AGT
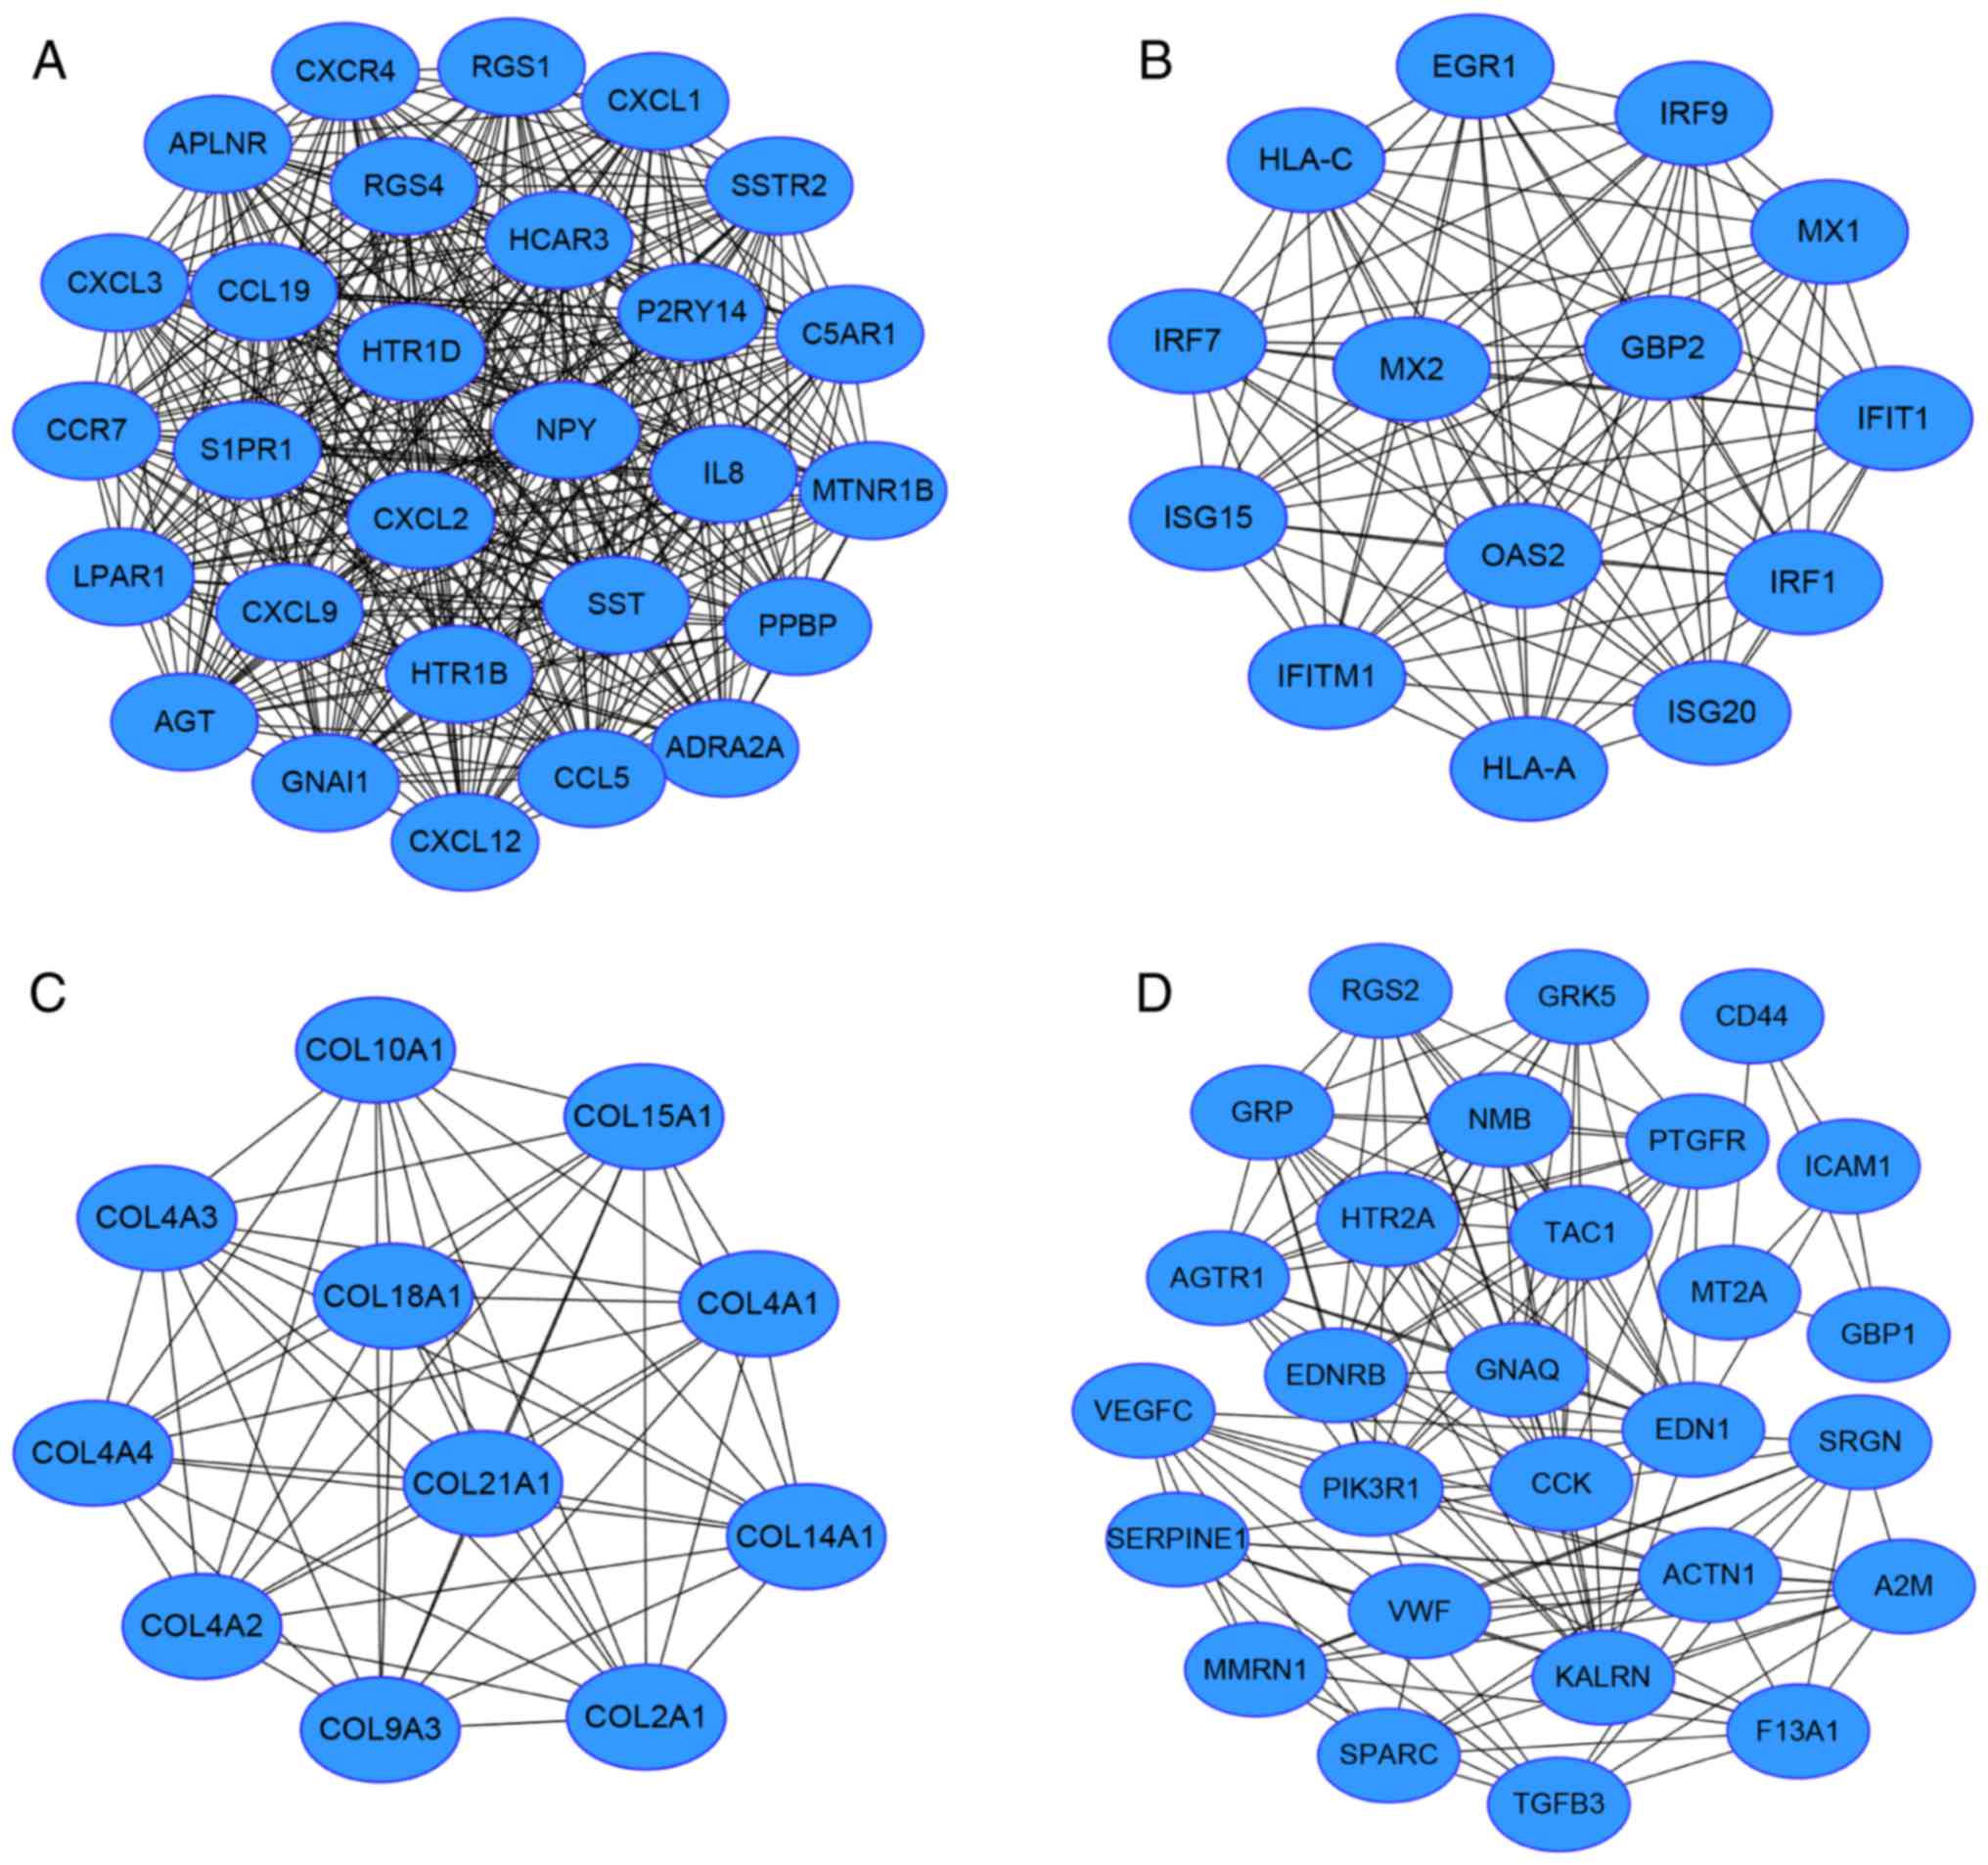
and MYC. In addition, according to the connectivity degree of nodes
in modules. The top 4 modules with MCODE score of >10 and node
number of >10 were obtained (Fig.
2). Functional annotation results revealed that the genes in
modules 1, 2 and 4 were mainly associated with the ‘chemokine
signaling pathway’, ‘cytokine-cytokine receptor interaction’,
‘allograft rejection’, and ‘complement and coagulation cascades’,
while there were no enriched pathways associated with the DEGs in
module 3 (Table IV).
| Table III.Hub genes and their corresponding
degree. |
Table III.
Hub genes and their corresponding
degree.
| Gene symbol | Degree |
|---|
| JUN | 79 |
| PIK3R1 | 56 |
| FOS | 53 |
| AGT | 53 |
| MYC | 50 |
| STAT3 | 47 |
| LPAR1 | 47 |
| IL8 | 44 |
| HSP90AA1 | 41 |
| CXCL12 | 41 |
| NFKB1 | 41 |
| RPS27A | 40 |
| GNAI1 | 39 |
| PPBP | 37 |
| CXCR4 | 35 |
| HIF1A | 33 |
| NPY | 32 |
| S1PR1 | 32 |
| CCL5 | 31 |
| SST | 30 |
| IL6 | 30 |
| EDN1 | 30 |
| EGR1 | 28 |
| STAT1 | 28 |
| IRF1 | 28 |
| CCR7 | 28 |
| CXCL2 | 28 |
| SSTR2 | 27 |
| CCL19 | 27 |
| RGS1 | 27 |
| RGS4 | 27 |
| CXCL9 | 27 |
| CXCL1 | 27 |
| ADRA2A | 27 |
| HTR1B | 27 |
| HTR1D | 27 |
| CXCL3 | 27 |
| C5AR1 | 27 |
| MTNR1B | 27 |
| APLNR | 27 |
| P2RY14 | 27 |
| HCAR3 | 27 |
| ICAM1 | 25 |
| CDKN1A | 24 |
| CCND1 | 23 |
| PTEN | 23 |
| NOS3 | 23 |
| ACTN1 | 23 |
| IRF7 | 23 |
| KALRN | 23 |
| IRF9 | 22 |
| HLA-A | 22 |
| YWHAE | 22 |
| SIRT1 | 21 |
| CDH1 | 21 |
| GNAQ | 21 |
| ISG15 | 20 |
| Table IV.Enriched Kyoto Encyclopedia of Genes
and Genomes pathways of four modules. |
Table IV.
Enriched Kyoto Encyclopedia of Genes
and Genomes pathways of four modules.
| Pathway term | P-value | Nodes |
|---|
| Module 1 |
|
|
|
Chemokine signaling
pathway |
1.14×10⁻¹⁰ | CXCL1, CCR7, PPBP,
IL8, GNAI1, CXCR4, CXCL3, CXCL2, CXCL9, CCL19, CCL5, CXCL12 |
|
Cytokine-cytokine receptor
interaction | 7.02×10⁻⁸ | CXCL1, CCR7, PPBP,
IL8, CXCR4, CXCL3, CXCL2, CXCL9, CCL19, CCL5, CXCL12 |
|
Neuroactive ligand-receptor
interaction |
7.93×10⁻⁷ | APLNR, HTR1B,
SSTR2, C5AR1, S1PR1, P2RY14, ADRA2A, MTNR1B, LPAR1, HTR1D |
| Module 2 |
|
|
|
Allograft rejection | 0.0418 | HLA-A, HLA-C |
|
Graft-versus-host disease | 0.0452 | HLA-A, HLA-C |
| Type I
diabetes mellitus | 0.0486 | HLA-A, HLA-C |
| Module 3 |
|
|
| No
record | – | – |
| Module 4 |
|
|
|
Complement and coagulation
cascades | 0.0012 | VWF, A2M, F13A1,
SERPINE1 |
| Calcium
signaling pathway | 0.0018 | AGTR1, EDNRB, GNAQ,
PTGFR, HTR2A |
| Renal
cell carcinoma | 0.0198 | VEGFC, TGFB3,
PIK3R1 |
Discussion
Although previous studies have proposed numerous
potential biomarkers associated with the progression and recurrence
of meningiomas, the knowledge regarding the molecular mechanisms of
meningioma remains relatively limited (13,16–18). In
the present study, a comprehensive analysis of the gene expression
profiles of meningiomas and normal meninges was conducted using a
combined bioinformatics approach. A total of 1,683 DEGs (66
upregulated and 1,617 downregulated) were identified. Functional
enrichment analysis revealed that these DEGs were mainly involved
in ECM organization, cell adhesion, angiogenesis and signal
transduction. By constructing a PPI network, a number of hub genes
were identified as potential prognostic biomarkers for
meningioma.
The gene expression data of 47 meningioma samples
and 4 normal controls included in the present study were downloaded
from the GEO database with the accession number GSE43290. The 47
tumor samples were composed of 18 diploid tumors, 12 tumors with
monosomy 22/del (22q) alone, 4 tumors with del (1p36) alone, and 13
with complex karyotypes associated with del (1p36) and/or del
(14q), which are the most frequently altered cytogenetic subgroups
of meningiomas in clinical practice (5,12).
The approach used in the current study identified
1,683 DEGs, including 1,617 downregulated and 66 upregulated genes,
in meningioma samples as compared with those in normal meninges.
These results indicated that gene expression in meningiomas was
generally downregulated, which may be attributed to the loss of
chromosomal material in meningioma. In addition, GO analysis
revealed that the enriched ontological categories among the DEGs
mainly included ECM organization, cell adhesion, angiogenesis,
signal transduction and negative regulation of cell proliferation.
Previous studies have revealed that matrix metalloproteinases
(MMPs), which are mediators of invasion and angiogenesis, may serve
important roles in the invasion and recurrence of meningioma
(28,29). Indeed, cumulative evidence has
demonstrated that the contribution of MMPs to tumor progression may
be associated with the regulation of cell adhesion, the control of
apoptosis via the release of factors associated with cell death or
survival, and the proteolysis of the ECM (28,30,31).
Previous studies have demonstrated that the aforementioned GO terms
are potentially important events in meningioma development and
tumor progression. Furthermore, the KEGG pathway analysis results
in the present study revealed that ‘ECM-receptor interaction’,
‘apoptosis’ and ‘cell adhesion molecules’ were among the
significantly enriched pathways associated with the DEGs. These
findings were consistent with those of a study by Keller et
al (32), which also suggested
that ‘ECM-receptor interaction’ and ‘cell adhesion molecules’ were
significantly dysregulated pathways in meningioma. Therefore,
monitoring these biological processes and pathways may aid in the
prediction of meningioma development and progression. Furthermore,
31 other enriched pathways were identified in the current study,
including ‘AGE-RAGE signaling pathway in diabetic complications’,
‘PI3K-Akt signaling pathway’, ‘TNF signaling pathway’ and ‘focal
adhesion’. The PI3K-Akt signaling pathway is an intracellular
signaling pathway that is important in regulating the cell cycle
progression, cell death and cell growth (33). Alterations in this pathway are
frequently identified as being involved in the development of
various types of cancer (34,35).
The top five hub genes identified from a PPI network
constructed from the DEGs in the present study were JUN, PIK3R1,
FOS, AGT and MYC. Among these hub genes, JUN, a protein-coding
gene, exhibited the highest degree of connectivity. JUN is an
important component of activator protein 1 (AP-1), a transcription
factor that recognizes the specific DNA sequence TGAC/GTCA. This
gene modulates numerous biological functions involved in the
regulation of cell proliferation, apoptosis and transformation
(36). The aberrant expression of JUN
has been reported in various types of cancer, including
glioblastoma and hepatocellular carcinoma (37,38).
Furthermore, FOS is a member of the Fos family that encodes leucine
zipper proteins that form heterodimers with the JUN family,
resulting in the formation of AP-1 (39). Thus, this gene also serves important
roles in cell proliferation, differentiation and transformation
(40). Significant associations
between FOS and various tumors have also been identified in
previous studies (41,42).
PIK3R1, another hub gene identified in the present
study, is a critical mediator of insulin sensitivity, and mutation
of this gene is associated with insulin resistance, which is an
important mechanism involved in human obesity (43,44).
McCurdy et al (45) reported
that, in diet-induced obese mice, attenuated PIK3R1 expression was
able to prevent insulin resistance. Recently, a large case-control
study further suggested that obesity was positively associated with
a risk of meningioma (46).
The AGT gene, also identified in the current study,
is a member of the renin-angiotensin system-associated gene family,
which is physiologically important for blood pressure regulation
and may be involved in the pathogenesis of hypertension (47). Accumulating evidence has demonstrated
that increased blood pressure is an independent and additive risk
factor for the development of brain tumors, particularly
meningiomas (46).
Another hub gene, MYC, is located on chromosome 8
and has been closely correlated with cell growth, apoptosis and
cellular transformation (48).
Mutation, overexpression, rearrangement and translocation of this
gene have been detected in a variety of tumors, including Burkitt's
lymphoma, medulloblastoma and hepatocellular carcinoma among others
(49–51).
In the present study, module analysis of the PPI
network revealed that the development of meningioma was possibly
associated with the chemokine signaling pathway, cytokine-cytokine
receptor interaction, allograft rejection, and complement and
coagulation cascades. This is consistent with the observations of
the study by Keller et al (32), which analyzed the expression profiles
of 24 meningiomas and identified ‘cytokine-cytokine receptor
interaction’ and ‘complement pathway and coagulation cascades’ as
two of the main pathways enriched among the downregulated
genes.
In conclusion, by applying a comprehensive
bioinformatics analysis of DEGs, the present study identified
several hub genes, including JUN, PIK3R1, FOS, AGT and MYC, that
may be functionally relevant to the pathogenesis of meningioma. The
functional analysis results also revealed a number of potentially
significant pathways that may participate in meningioma development
and progression, including ‘AGE-RAGE signaling pathway in diabetic
complications’, ‘PI3K-Akt signaling pathway’, ‘ECM-receptor
interaction’ and ‘cell adhesion molecules’. These results provided
further insight into the underlying molecular mechanisms of
meningioma. Further experimental studies are required to confirm
these observations and to determine their potential as molecular
targets in the development of novel therapeutic approaches for
meningioma.
Acknowledgements
Not applicable.
Funding
The present study was supported by a grant from the
Shanghai Jiao Tong University Medicine and Engineering Cross Fund
(grant no. YG 2015MS25).
Availability of data and materials
The datasets analyzed during the current study
(GSE43290) were downloaded from a public dataset webset from the
Gene Expression Omnibus (https://www.ncbi.nlm.nih.gov/geo/query/acc.cgi?acc=GSE43290).
Authors' contributions
JD analyzed and interpreted the microarray data
regarding meningomas. YM and SC renalyzed the data and confirmed
the results' authenticity. NL and JC designed this bioinformatic
study and wrote the manuscript. YW was responsible for making
tables, drawing the fgures, and helped JD to interprete the
findings from the study. All authors read and approved the final
manuscript.
Ethics approval and consent to
participate
Not applicable.
Consent for publication
Not applicable.
Competing interests
The authors declare that they have no competing
interests.
References
|
1
|
Ostrom QT, Blank PMD, Kruchko C, Petersen
CM, Liao P, Finlay JL, Stearns DS, Wolff JE, Wolinsky Y, Letterio
JJ and Barnholtz-Sloan JS: Alex's lemonade stand foundation infant
and childhood primary brain and central nervous system tumors
diagnosed in the united states in 2007–2011. Neuro Oncol. 16 Suppl
10:x1–x36. 2015. View Article : Google Scholar : PubMed/NCBI
|
|
2
|
Louis DN, Ohgaki H, Wiestler OD, Cavenee
WK, Burger PC, Jouvet A, Scheithauer BW and Kleihues P: The 2007
WHO classification of tumours of the central nervous system. Acta
Neuropathol. 114:97–109. 2007. View Article : Google Scholar : PubMed/NCBI
|
|
3
|
Yang SY, Park CK, Park SH, Kim DG, Chung
YS and Jung HW: Atypical and anaplastic meningiomas: Prognostic
implications of clinicopathological features. J Neurol Neurosurg
Psychiatry. 79:574–580. 2008. View Article : Google Scholar : PubMed/NCBI
|
|
4
|
Riemenschneider MJ, Perry A and
Reifenberger G: Histological classification and molecular genetics
of meningiomas. Lancet Neurol. 5:1045–1054. 2006. View Article : Google Scholar : PubMed/NCBI
|
|
5
|
Maillo A, Orfao A, Espinosa AB, Sayagués
JM, Merino M, Sousa P, Lara M and Tabernero MD: Early recurrences
in histologically benign/grade I meningiomas are associated with
large tumors and coexistence of monosomy 14 and del(1p36) in the
ancestral tumor cell clone. Neuro Oncol. 9:438–446. 2007.
View Article : Google Scholar : PubMed/NCBI
|
|
6
|
Perry A, Scheithauer BW, Stafford SL,
Lohse CM and Wollan PC: ‘Malignancy‘ in meningiomas: A
clinicopathologic study of 116 patients, with grading implications.
Cancer. 85:2046–2056. 1999. View Article : Google Scholar : PubMed/NCBI
|
|
7
|
Mawrin C and Perry A: Pathological
classification and molecular genetics of meningiomas. J Neurooncol.
99:379–391. 2010. View Article : Google Scholar : PubMed/NCBI
|
|
8
|
Lomas J, Bello MJ, Arjona D, Alonso ME,
Martinez-Glez V, Lopez-Marin I, Amiñoso C, de Campos JM, Isla A,
Vaquero J and Rey JA: Genetic and epigenetic alteration of the NF2
gene in sporadic meningiomas. Genes Chromosomes Cancer. 42:314–319.
2005. View Article : Google Scholar : PubMed/NCBI
|
|
9
|
Harada T, Irving RM, Xuereb JH, Barton DE,
Hardy DG, Moffat DA and Maher ER: Molecular genetic investigation
of the neurofibromatosis type 2 tumor suppressor gene in sporadic
meningioma. J Neurosurg. 84:847–851. 1996. View Article : Google Scholar : PubMed/NCBI
|
|
10
|
Ng HK, Lau KM, Tse JY, Lo KW, Wong JH,
Poon WS and Huang DP: Combined molecular genetic studies of
chromosome 22q and the neurofibromatosis type 2 gene in central
nervous system tumors. Neurosurgery. 37:764–773. 1995. View Article : Google Scholar : PubMed/NCBI
|
|
11
|
Choy W, Kim W, Nagasawa D, Stramotas S,
Yew A, Gopen Q, Parsa AT and Yang I: The molecular genetics and
tumor pathogenesis of meningiomas and the future directions of
meningioma treatments. Neurosurg Focus. 30:E62011. View Article : Google Scholar : PubMed/NCBI
|
|
12
|
Lamszus K, Kluwe L, Matschke J, Meissner
H, Laas R and Westphal M: Allelic losses at 1p, 9q, 10q, 14q, and
22q in the progression of aggressive meningiomas and
undifferentiated meningeal sarcomas. Cancer Genet Cytogenet.
110:103–110. 1999. View Article : Google Scholar : PubMed/NCBI
|
|
13
|
Clark VE, Ersonomay EZ, Serin A, Yin J,
Cotney J, Ozduman K, Avşar T, Li J, Murray PB, Henegariu O, et al:
Genomic analysis of non-NF2 meningiomas reveals mutations in TRAF7,
KLF4, AKT1, and SMO. Science. 339:1077–1080. 2013. View Article : Google Scholar : PubMed/NCBI
|
|
14
|
Chang X, Shi L, Gao F, Russin J, Zeng L,
He S, Chen TC, Giannotta SL, Weisenberger DJ, Zada G, et al:
Genomic and transcriptome analysis revealing an oncogenic
functional module in meningiomas. Neurosurg Focus. 35:E32013.
View Article : Google Scholar : PubMed/NCBI
|
|
15
|
Serna E, Morales JM, Mata M,
Gonzalez-Darder J, Miguel San T, Gil-Benso R, Lopez-Gines C,
Cerda-Nicolas M and Monleon D: Gene expression profiles of
metabolic aggressiveness and tumor recurrence in benign meningioma.
PLoS One. 8:e672912013. View Article : Google Scholar : PubMed/NCBI
|
|
16
|
Surace EI, Lusis E, Murakami Y,
Scheithauer BW, Perry A and Gutmann DH: Loss of tumor suppressor in
lung cancer-1 (TSLC1) expression in meningioma correlates with
increased malignancy grade and reduced patient survival. J
Neuropathol Exp Neurol. 63:1015–1027. 2004. View Article : Google Scholar : PubMed/NCBI
|
|
17
|
Schmidt M, Mock A, Jungk C, Sahm F, Ull
AT, Warta R, Lamszus K, Gousias K, Ketter R, Roesch S, et al:
Transcriptomic analysis of aggressive meningiomas identifies PTTG1
and LEPR as prognostic biomarkers independent of WHO grade.
Oncotarget. 7:14551–14568. 2016. View Article : Google Scholar : PubMed/NCBI
|
|
18
|
Francesca M, Orzan FN, Eoli M, Farinotti
M, Maderna E, Pisati F, Bianchessi D, Valletta L, Lodrini S, Galli
G, et al: DNA microarray analysis identifies CKS2 and LEPR as
potential markers of meningioma recurrence. Oncologist.
16:1440–1450. 2011. View Article : Google Scholar : PubMed/NCBI
|
|
19
|
Barrett T, Wilhite SE, Ledoux P,
Evangelista C, Kim IF, Tomashevsky M, Marshall KA, Phillippy KH,
Sherman PM, Holko M, et al: NCBI GEO: Archive for functional
genomics data sets-update. Nucleic Acids Res. 41:(Database Issue).
D991–D995. 2013. View Article : Google Scholar : PubMed/NCBI
|
|
20
|
Tabernero MD, Maillo A, Gilbellosta CJ,
Castrillo A, Sousa P, Merino M and Orfao A: Gene expression
profiles of meningiomas are associated with tumor cytogenetics and
patient outcome. Brain Pathol. 19:409–420. 2009. View Article : Google Scholar : PubMed/NCBI
|
|
21
|
Gautier L, Cope L, Bolstad BM and Irizarry
RA: affy-analysis of Affymetrix GeneChip data at the probe level.
Bioinformatics. 20:307–315. 2004. View Article : Google Scholar : PubMed/NCBI
|
|
22
|
Smyth GK: Limma: Linear models for
microarray data. In: Bioinformatics and Computational Biology
Solutions Using R and BioconductorStatistics for Biology and
Health. Gentleman R, Carey V, Huber W, Irizarry RA and Dudoit S:
Springer; New York, NY: pp. 397–420. 2005, View Article : Google Scholar
|
|
23
|
Gene Ontology Consortium: The gene
ontology project in 2008. Nucleic Acids Res. 36:(Database Issue).
D440–D444. 2008. View Article : Google Scholar : PubMed/NCBI
|
|
24
|
Ogata H, Goto S, Sato K, Fujibuchi W, Bono
H and Kanehisa M: KEGG: Kyoto encyclopedia of genes and genomes.
Nucleic Acids Res. 27:29–34. 1999. View Article : Google Scholar : PubMed/NCBI
|
|
25
|
Huang da W, Sherman BT and Lempicki RA:
Systematic and integrative analysis of large gene lists using DAVID
bioinformatics resources. Nature Protocol. 4:44–57. 2009.
View Article : Google Scholar
|
|
26
|
Franceschini A, Szklarczyk D, Frankild S,
Kuhn M, Simonovic M, Roth A, Lin J, Minguez P, Bork P, von Mering C
and Jensen LJ: STRING v9.1: Protein-protein interaction networks,
with increased coverage and integration. Nucleic Acids Res.
41:(Database Issue). D808–D815. 2013. View Article : Google Scholar : PubMed/NCBI
|
|
27
|
Smoot ME, Ono K, Ruscheinski J, Wang PL
and Ideker T: Cytoscape 2.8: New features for data integration and
network visualization. Bioinformatics. 27:431–432. 2011. View Article : Google Scholar : PubMed/NCBI
|
|
28
|
Rooprai HK, Martin AJ, King A, Appadu UD,
Jones H, Selway RP, Gullan RW and Pilkington GJ: Comparative gene
expression profiling of ADAMs, MMPs, TIMPs, EMMPRIN, EGF-R and
VEGFA in low grade meningioma. Int J Oncol. 49:2309–2318. 2016.
View Article : Google Scholar : PubMed/NCBI
|
|
29
|
Kirches E, Grunewald J, Von-Bossanyi P,
Szibor R, Plate I, Krüger S, Warich-Kirches M and Dietzmann K:
Expression of matrix metalloproteinases in a series of 12
meningiomas. Clin Neuropathol. 20:26–30. 2001.PubMed/NCBI
|
|
30
|
Roy R, Zhang B and Moses MA: Making the
cut: Protease-mediated regulation of angiogenesis. Exp Cell Res.
312:608–622. 2006. View Article : Google Scholar : PubMed/NCBI
|
|
31
|
Bourboulia D and Stetler-Stevenson WG:
Matrix metalloproteinases (MMPs) and tissue inhibitors of
metalloproteinases (TIMPs): Positive and negative regulators in
tumor cell adhesion. Semin Cancer Biol. 20:161–168. 2010.
View Article : Google Scholar : PubMed/NCBI
|
|
32
|
Keller A, Ludwig N, Backes C, Romeike BF,
Comtesse N, Henn W, Steudel WI, Mawrin C, Lenhof HP and Meese E:
Genome wide expression profiling identifies specific deregulated
pathways in meningioma. Int J Cancer. 124:346–351. 2009. View Article : Google Scholar : PubMed/NCBI
|
|
33
|
Vara Fresno JA, Casado E, de Castro J,
Cejas P, Belda-Iniesta C and González-Barón M: PI3K/Akt signalling
pathway and cancer. Cancer Treat Rev. 30:193–204. 2004. View Article : Google Scholar : PubMed/NCBI
|
|
34
|
Ma YY, Wei SJ, Lin YC, Lung JC, Chang TC,
Whang-Peng J, Liu JM, Yang DM, Yang WK and Shen CY: PIK3CA as an
oncogene in cervical cancer. Oncogene. 19:2739–2744. 2000.
View Article : Google Scholar : PubMed/NCBI
|
|
35
|
Shayesteh L, Lu Y, Kuo WL, Baldocchi R,
Godfrey T, Collins C, Pinkel D, Powell B, Mills GB and Gray JW:
PIK3CA is implicated as an oncogene in ovarian cancer. Nat Genet.
21:99–102. 1999. View
Article : Google Scholar : PubMed/NCBI
|
|
36
|
Chen F: JUN (V-Jun sarcoma virus 17
oncogene homolog (avian)). Atlas Genet Cytogenet Oncol Haematol.
7:85–86. 2003.
|
|
37
|
Wei C, Xiao W, Zhang K, Yin X, Lai J,
Liang L and Chen D: Activation of c-Jun predicts a poor response to
sorafenib in hepatocellular carcinoma: Preliminary clinical
evidence. Sci Rep. 6:229762016. View Article : Google Scholar : PubMed/NCBI
|
|
38
|
Blau L, Knirsh R, Ben-Dror I, Oren S,
Kuphal S, Hau P, Proescholdt M, Bosserhoff AK and Vardimon L:
Aberrant expression of c-Jun in glioblastoma by internal ribosome
entry site (IRES)-mediated translational activation. Proc Natl Acad
Sci USA. 109:E2875–E2884. 2012. View Article : Google Scholar : PubMed/NCBI
|
|
39
|
Ameyar M, Wisniewska M and Weitzman JB: A
role for AP-1 in apoptosis: The case for and against. Biochimie.
85:747–752. 2003. View Article : Google Scholar : PubMed/NCBI
|
|
40
|
Shaulian E and Karin M: AP-1 in cell
proliferation and survival. Oncogene. 20:2390–2400. 2001.
View Article : Google Scholar : PubMed/NCBI
|
|
41
|
Huhe M, Liu S, Zhang Y, Zhang Z and Chen
Z: Expression levels of transcription factors c-Fos and c-Jun and
transmembrane protein HAb18G/CD147 in urothelial carcinoma of the
bladder. Mol Med Rep. 15:2991–3000. 2017. View Article : Google Scholar : PubMed/NCBI
|
|
42
|
Mahner S, Baasch C, Schwarz J, Hein S,
Wölber L, Jänicke F and Milde-Langosch K: C-Fos expression is a
molecular predictor of progression and survival in epithelial
ovarian carcinoma. Brit J Cancer. 99:1269–1275. 2008. View Article : Google Scholar : PubMed/NCBI
|
|
43
|
Winnay JN, Solheim MH, Dirice E, Sakaguchi
M, Noh HL, Kang HJ, Takahashi H, Chudasama KK, Kim JK, Molven A, et
al: PI3-kinase mutation linked to insulin and growth factor
resistance in vivo. J Clin Invest. 126:1401–1412. 2016. View Article : Google Scholar : PubMed/NCBI
|
|
44
|
Thauvin-Robinet C, Auclair M, Duplomb L,
Caron-Debarle M, Avila M, St-Onge J, Le Merrer M, Le Luyer B, Héron
D, Mathieu-Dramard M, et al: PIK3R1 mutations cause syndromic
insulin resistance with lipoatrophy. Am J Hum Genet. 93:141–149.
2013. View Article : Google Scholar : PubMed/NCBI
|
|
45
|
McCurdy CE, Schenk S, Holliday MJ, Philp
A, Houck JA, Patsouris D, MacLean PS, Majka SM, Klemm DJ and
Friedman JE: Attenuated Pik3r1 expression prevents insulin
resistance and adipose tissue macrophage accumulation in
diet-induced obese mice. Diabetes. 61:2495–2505. 2012. View Article : Google Scholar : PubMed/NCBI
|
|
46
|
Seliger C, Meier CR, Becker C, Jick SS,
Proescholdt M, Bogdahn U, Hau P and Leitzmann MF: Metabolic
syndrome in relation to risk of meningioma. Oncotarget.
8:2284–2292. 2017. View Article : Google Scholar : PubMed/NCBI
|
|
47
|
Williamson CR, Khurana S, Nguyen P, Byrne
CJ and Tai TC: Comparative analysis of renin-angiotensin system
(RAS)-related gene expression between hypertensive and normotensive
rats. Med Sci Monit Basic Res. 23:20–24. 2017. View Article : Google Scholar : PubMed/NCBI
|
|
48
|
Campisi J, Gray HE, Pardee AB, Dean M and
Sonenshein GE: Cell-cycle control of c-myc but not c-ras expression
is lost following chemical transformation. Cell. 36:241–247. 1984.
View Article : Google Scholar : PubMed/NCBI
|
|
49
|
Fei X, Yuan Y, Xie L, Ran P, Xiang X,
Huang Q, Qi G, Guo X, Xiao C and Zheng S: miRNA-320a inhibits tumor
proliferation and invasion by targeting c-Myc in human
hepatocellular carcinoma. Onco Targets Ther. 10:885–894. 2017.
View Article : Google Scholar : PubMed/NCBI
|
|
50
|
Staal JA, Pei Y and Rood BR: A
proteogenomic approach to understanding MYC function in metastatic
medulloblastoma tumors. Int J Mol Sci. 17:pii: E1744. 2016.
View Article : Google Scholar : PubMed/NCBI
|
|
51
|
Finver SN, Nishikura K, Finger LR, Haluska
FG, Finan J, Nowell PC and Croce CM: Sequence analysis of the MYC
oncogene involved in the t(8;14)(q24;q11) chromosome translocation
in a human leukemia T-cell line indicates that putative regulatory
regions are not altered. Proc Natl Acad Sci USA. 85:3052–3056.
1988. View Article : Google Scholar : PubMed/NCBI
|