Introduction
Renal cell carcinoma (RCC), which accounts for 2–3%
of all adult malignancies, is a relatively common malignancy with
an incidence rate that is increasing at a rate of 2% each year
(1). Clear cell renal cell carcinoma
(ccRCC), which accounts for ~90% of RCC cases (2), is the most common histological subtype
of RCC and exhibits a 5-year disease-specific survival rate of
50–69% (3). RCC is notoriously
refractory to radiation therapy and standard chemotherapy. If
detected at an early stage, ccRCC can be cured by surgery. However,
~25% of patients with RCC are identified with lymph node metastasis
or distant metastasis at first diagnosis, and 30–40% of patients
experience recurrence or metastasis even following surgery
(4). Currently, the primary
prognostic index for ccRCC is the Fuhrman nuclear grade and disease
staging at the time of surgery (5).
Thus, it is important to develop new biomarkers to screen out
high-risk patients for additional appropriate postoperative therapy
and surveillance.
Forkhead-box (FOX) family proteins are involved in
the regulation of cell growth and differentiation as well as
embryogenesis and tissue development. These proteins are
characterized by a conserved FOX domain and extra-FOX
protein-protein interaction domains (6). The FOX domain is ~100 amino acids in
length and is involved in DNA binding (6–8). The
extra-FOX regions are involved in interactions with transcriptional
activators, transcriptional repressors or DNA repair complexes
(6,7).
Previous studies have demonstrated an association between the
expression of FOX family genes and the prognosis of different types
of cancer, including lung cancer, basal cell carcinoma, esophageal
cancer, pancreatic cancer, rhabdomyosarcoma, acute myeloblastic
leukemia and acute lymphocytic leukemia (9). However, the role of FOX family genes in
ccRCC has not been described.
The present study examined the expression of FOX
family genes in 525 ccRCC cases from The Cancer Genome Atlas (TCGA)
database with the aim of potentially identifying a prognostic
marker for ccRCC. The associations between FOX family-related gene
expression and clinicopathological characteristics were also
investigated.
Materials and methods
Patients and data
The expression levels of FOX family genes, FOX
family-related genes, and associated clinical data were downloaded
from the TCGA data portal, which is available from the Cancer
Genomics Browser of the University of California Santa Cruz
(https://genome-cancer.ucsc.edu/). A
total of 51 gene members of the FOX family were studied in 525
primary ccRCC tumors from patients with detailed FOX family gene
expression data, and related clinical follow-up data was selected
from the updated TCGA data portal. Patients included a total of 184
females and 341 males (age range, 26–90 years; median age, 61
years). All patients had received partial or radical nephrectomy.
The enrolled patients had not received pretreatment and had fully
characterized tumors, complete RNA sequencing information and
intact overall survival (OS) and disease-free survival (DFS)
information. Appropriate genes were selected to construct gene
networks according to the standards described in a previous study
(10). Furthermore,
clinicopathological characteristics, including sex, age, tumor
diameter, laterality, tumor-node-metastasis, tumor grade, American
Joint Committee on Cancer (AJCC) stage (11), levels of white blood cells, platelets
and hemoglobin, OS and DFS, were also collected. A network of
prognostic FOX genes was obtained from the cBioPortal (http://www.cbioportal.org), and the following criteria
were used to construct the network: ‘In the same complex’,
‘interacted with each other’ and ‘more than 12% changes’. Unigene
accession numbers were obtained from https://www.ncbi.nlm.nih.gov/unigene.
Statistical analysis
Duration of DFS was calculated from the date of
diagnosis to the date of first recurrence or mortality. Duration of
OS was calculated from the date of diagnosis to the date of
mortality or last follow-up which undertaken for a median of 35.95
months. Patients without recurrence or did not succumb to disease
were marked as censored at the time of the last follow-up. The
Kaplan-Meier method was used for survival analysis, and the
log-rank test was used for comparing cumulative survival. The
association between overall survival and FOX gene expression was
analyzed by performing univariate and multivariate analysis using
Cox proportional-hazards regression. All the statistical tests were
performed using SPSS (version 22.0; IBM SPSS, Armonk, NY, USA).
P<0.05 was considered to indicate a statistically significant
difference.
Results
Clinical characteristics of patients
with ccRCC in the TCGA cohort
A total of 525 patients were enrolled in the present
study. The patients included 184 females and 341 males with a range
of 26–90 years and a median of 61 years. Among the 525 patients,
45.7% of the patients had low-grade (grade 1 and 2) ccRCC, 52.8%
had high-grade ccRCC and only 8 cases were of undetermined grade.
The clinicopathological characteristics of the enrolled patients
are summarized in Table I. Follow-up
was undertaken for a median of 35.95 months. At the end of the
follow-up, 31.6% of patients had succumbed to disease
(166/525).
 | Table I.Clinical characteristics of 525
patients with clear cell renal cell carcinoma in The Cancer Genome
Atlas cohort. |
Table I.
Clinical characteristics of 525
patients with clear cell renal cell carcinoma in The Cancer Genome
Atlas cohort.
| Variables | Patients |
|---|
| Age, median
(range) | 61 (26.0–90.0) |
| Sex, n (%) |
|
|
Male | 341 (65.0) |
|
Female | 184 (35.0) |
| Grade, n (%) |
|
| 1 | 12 (2.3) |
| 2 | 228 (43.4) |
| 3 | 202 (38.5) |
| 4 | 75 (14.3) |
| Gx | 8 (1.5) |
| Tumor diameter,
mean (range) | 1.67 (0.4–4.0) |
| pT, n (%) |
|
| T1 | 266 (50.7) |
| T2 | 68 (13.0) |
| T3 | 179 (34.1) |
| T4 | 11 (2.1) |
| N, n (%) |
|
| N0 | 237 (45.1) |
| N1 | 17 (3.2) |
| Nx | 271 (51.6) |
| M, n (%) |
|
| M0 | 406 (77.3) |
| M1 | 78 (14.9) |
| Mx | 25 (4.8) |
| Stagea, n (%) |
|
| I | 262 (49.9) |
| II | 56 (10.7) |
|
III | 126 (24) |
| IV | 81 (15.4) |
| Laterality, n
(%) |
|
|
Left | 247 (47.0) |
|
Right | 277 (52.8) |
|
Bilateral | 1 (0.2) |
| Hb, n (%) |
|
|
Low | 258 (49.1) |
|
Normal | 181 (34.5) |
|
Elevated | 5 (1.0) |
|
Unavailable | 81 (15.4) |
| WBC, n (%) |
|
|
Low | 45 (8.6) |
|
Normal | 261 (49.7) |
|
Elevated | 162 (30.9) |
|
Unavailable | 94 (17.9) |
| PLT, n (%) |
|
|
Low | 45 (8.6) |
|
Normal | 352 (67.0) |
|
Elevated | 37 (7.0) |
|
Unavailable | 91 (17.3) |
Selection of independent prognostic
factors for OS in the TCGA cohort among FOX gene family
members
The median follow-up duration of the patients was
35.95 months, and 166 patients succumbed to disease during the
follow-up period. The results of univariate analysis and
multivariate analysis of the potential prognostic factors are shown
in Table II. Age, AJCC stage and
Fuhrman grade and 37 FOX genes were determined to be potential
prognostic factors for OS according to univariate Cox proportional
hazards ratio analysis (P<0.05; Table
II).
| Table II.Univariate and multivariate Cox
proportional hazards analysis of FOX gene expression and overall
survival of patients with clear cell renal cell carcinoma in The
Cancer Genome Atlas cohort. |
Table II.
Univariate and multivariate Cox
proportional hazards analysis of FOX gene expression and overall
survival of patients with clear cell renal cell carcinoma in The
Cancer Genome Atlas cohort.
|
| Univariate | Multivariate |
|---|
|
|
|
|
|---|
| Variables | HR (95% CI) | P-value | HR (95% CI) | P-value |
|---|
| Age | 1.03
(1.01–1.04) | <0.001 | 1.03
(1.02–1.05) | <0.01 |
| Sex | 0.95
(0.69–1.30) | 0.75 | 1.00
(0.64–1.58) | 0.99 |
| Stagea | 1.95
(1.71–2.24) | <0.001 | 1.29
(0.65–2.57) | 0.47 |
| Gradeb | 2.40
(1.94–2.97) | <0.001 | 1.23
(0.86–1.75) | 0.25 |
| Hb | 0.56
(0.40–0.79) | <0.001 | 0.79
(0.51–1.23) | 1.29 |
| WBC | 0.67
(0.48–0.92) | 0.01 | 0.92
(0.59–1.45) | 0.73 |
| PLT | 1.71
(1.16–2.53) | 0.01 | 1.12
(0.73–1.71) | 0.60 |
| Tumor diameter | 1.22
(0.98–1.50) | 0.07 | 0.72
(0.52–0.99) | 0.04 |
|
Positionc | 0.70
(0.51–0.94) | 0.02 | 0.85
(0.56–1.27) | 0.42 |
| TNM stage |
|
|
|
|
|
Tumor | 2.00
(1.69–2.36) | <0.001 | 1.12
(0.58–2.16) | 0.75 |
|
Node | 1.00
(0.56–1.75) | 0.98 | 0.57
(0.28–1.19) | 0.13 |
|
Metastasis | 4.55
(3.31–6.26) | <0.001 | 3.13
(1.15–8.48) | 0.03 |
| FOX family of
genes |
|
|
|
|
|
FOXL2 | 1.25
(1.08–1.45) | <0.001 | 1.27
(0.95–1.70) | 0.11 |
|
FOXL1 | 1.22
(1.07–1.39) | <0.001 | 1.26
(1.01–1.57) | 0.04 |
|
FOXS1 | 1.16
(1.03–1.30) | 0.01 | 0.93
(0.71–1.21) | 0.57 |
|
FOXN1 | 1.20
(0.99–1.45) | 0.06 |
|
|
|
FOXN2 | 0.78
(0.61–0.99) | 0.03 | 0.62
(0.39–0.98) | 0.04 |
|
FOXN3 | 0.59
(0.47–0.74) | <0.001 | 1.07
(0.63–1.80) | 0.81 |
|
FOXH1 | 1.29
(1.16–1.44) | <0.001 | 0.85
(0.68–1.05) | 0.13 |
|
FOXG1 | 1.22
(1.11–1.34) | <0.001 | 1.00
(0.84–1.18) | 0.96 |
|
FOXP2 | 1.01
(0.94–1.07) | 0.88 |
|
|
|
FOXD1 | 1.26
(1.14–1.39) | <0.001 | 0.83
(0.70–0.99) | 0.04 |
|
FOXC2 | 0.95
(0.86–1.05) | 0.30 |
|
|
|
FOXC1 | 1.10
(0.93–1.30) | 0.29 |
|
|
|
FOXF1 | 0.94
(0.82–1.08) | 0.41 |
|
|
|
FOXF2 | 1.13
(1.00–1.27) | 0.05 | 0.94
(0.79–1.14) | 0.54 |
|
FOXE1 | 1.21
(1.12–1.31) | <0.001 | 1.13
(0.99–1.30) | 0.08 |
|
FOXO3B | 0.77
(0.59–1.01) | 0.06 |
|
|
|
FOXB2 | 0.76
(0.51–1.13) | 0.18 |
|
|
|
FOXR1 | 1.16
(0.60–2.23) | 0.66 |
|
|
|
FOXN4 | 1.20
(1.06–1.36) | <0.001 | 0.82
(0.61–1.10) | 0.18 |
|
FOXM1 | 1.62
(1.43–1.83) | <0.001 | 0.87
(0.66–1.15) | 0.32 |
|
FOXP3 | 1.25
(1.14–1.38) | <0.001 | 0.99
(0.86–1.15) | 0.94 |
|
FOXP1 | 1.34 (1.09
−1.64) | 0.01 | 1.20
(0.78–1.85) | 0.41 |
|
FOXP4 | 2.02
(1.57–2.59) | <0.001 | 1.49
(0.91–2.44) | 0.11 |
|
FOXO3 | 0.73
(0.56–0.94) | 0.01 | 0.64
(0.39–1.07) | 0.09 |
|
FOXO1 | 0.67
(0.53–0.85) | <0.001 | 0.99
(0.62–1.57) | 0.96 |
|
FOXO4 | 0.62
(0.46–0.84) | <0.001 | 0.73
(0.40–1.37) | 0.33 |
|
FOXR2 | 1.31
(0.80–2.16) | 0.29 |
|
|
|
FOXI1 | 0.98
(0.92–1.03) | 0.41 |
|
|
|
FOXI3 | 1.25
(0.76–2.07) | 0.38 |
|
|
|
FOXI2 | 0.85
(0.77–0.93) | <0.001 | 1.07
(0.92–1.25) | 0.37 |
|
FOXRED2 | 1.12
(0.91–1.38) | 0.28 |
|
|
|
FOXRED1 | 1.23
(0.95–1.59) | 0.12 |
|
|
|
FOXD4L5 | 0.99
(0.61–1.61) | 0.98 |
|
|
|
FOXD4L6 | 1.31
(1.10–1.57) | <0.001 | 0.91
(0.66–1.26) | 0.57 |
|
FOXD4L1 | 1.35
(1.16–1.58) | <0.001 | 0.79
(0.56–1.13) | 0.20 |
|
FOXD4L2 | 1.26
(1.08–1.46) | <0.001 | 1.40
(1.10–1.79) | 0.01 |
|
FOXD4L3 | 1.37
(0.92–2.04) | 0.13 |
|
FOXB1 | 1.18
(1.02–1.37) | 0.03 | 0.97
(0.73–1.28) | 0.80 |
|
FOXK2 | 2.90
(2.02–4.14) | <0.001 | 2.71
(1.29–5.71) | 0.01 |
|
FOXK1 | 0.98
(0.77–1.26) | 0.89 |
|
|
|
FOXD3 | 1.29
(1.05–1.58) | 0.02 | 1.01
(0.74–1.39) | 0.93 |
|
FOXA1 | 1.19
(1.13–1.27) | <0.001 | 1.12
(1.01–1.24) | 0.03 |
|
FOXA3 | 1.05
(0.96–1.14) | 0.29 |
|
|
|
FOXA2 | 1.18
(1.10–1.25) | <0.001 | 1.13
(1.02–1.26) | 0.02 |
|
FOXJ1 | 1.13
(1.05–1.21) | <0.001 | 0.98
(0.86–1.112) | 0.71 |
|
FOXJ2 | 1.02
(0.69–1.52) | 0.91 |
|
|
|
FOXJ3 | 0.96
(0.84–1.11) | 0.59 |
|
|
|
FOXE3 | 1.72
(1.41–2.09) | <0.001 | 1.34
(0.97–1.86) | 0.07 |
|
FOXQ1 | 1.01
(0.91–1.12) | 0.93 |
|
|
|
FOXD4 | 1.16
(1.00–1.34) | 0.04 | 1.17
(0.87–1.57) | 0.30 |
|
FOXD2 | 1.21
(1.01–1.44) | 0.04 | 0.87
(0.58–1.30) | 0.49 |
These factors were then analyzed by the multivariate
Cox proportional hazards ratio model for analysis of OS (Table II). Following adjustment for all
potential prognostic factors, the results indicated that age [odds
ratio (OR)=1.034, 95% confidence interval (CI), 1.015–1.052], tumor
diameter (OR, 0.718; 95% CI, 0.523–0.986), metastasis stage (OR,
3.129; 95% CI, 1.154–8.484), FOXA1 (OR, 1.120; 95% CI,
1.014–1.236), FOXA2 (OR, 1.131; 95% CI, 1.018–1.256),
FOXD1 (OR, 0.829; 95% CI, 0.695–0.987), FOXD4L2 (OR,
1.404; 95% CI, 1.104–1.786), FOXK2 (OR, 2.712; 95% CI,
1.288–5.713), FOXL1 (OR, 1.260; 95% CI, 1.008–1.574) and
FOXN2 (OR, 0.621; 95% CI, 0.393–0.981) were independent
prognostic factors for OS (all P<0.05; Table II).
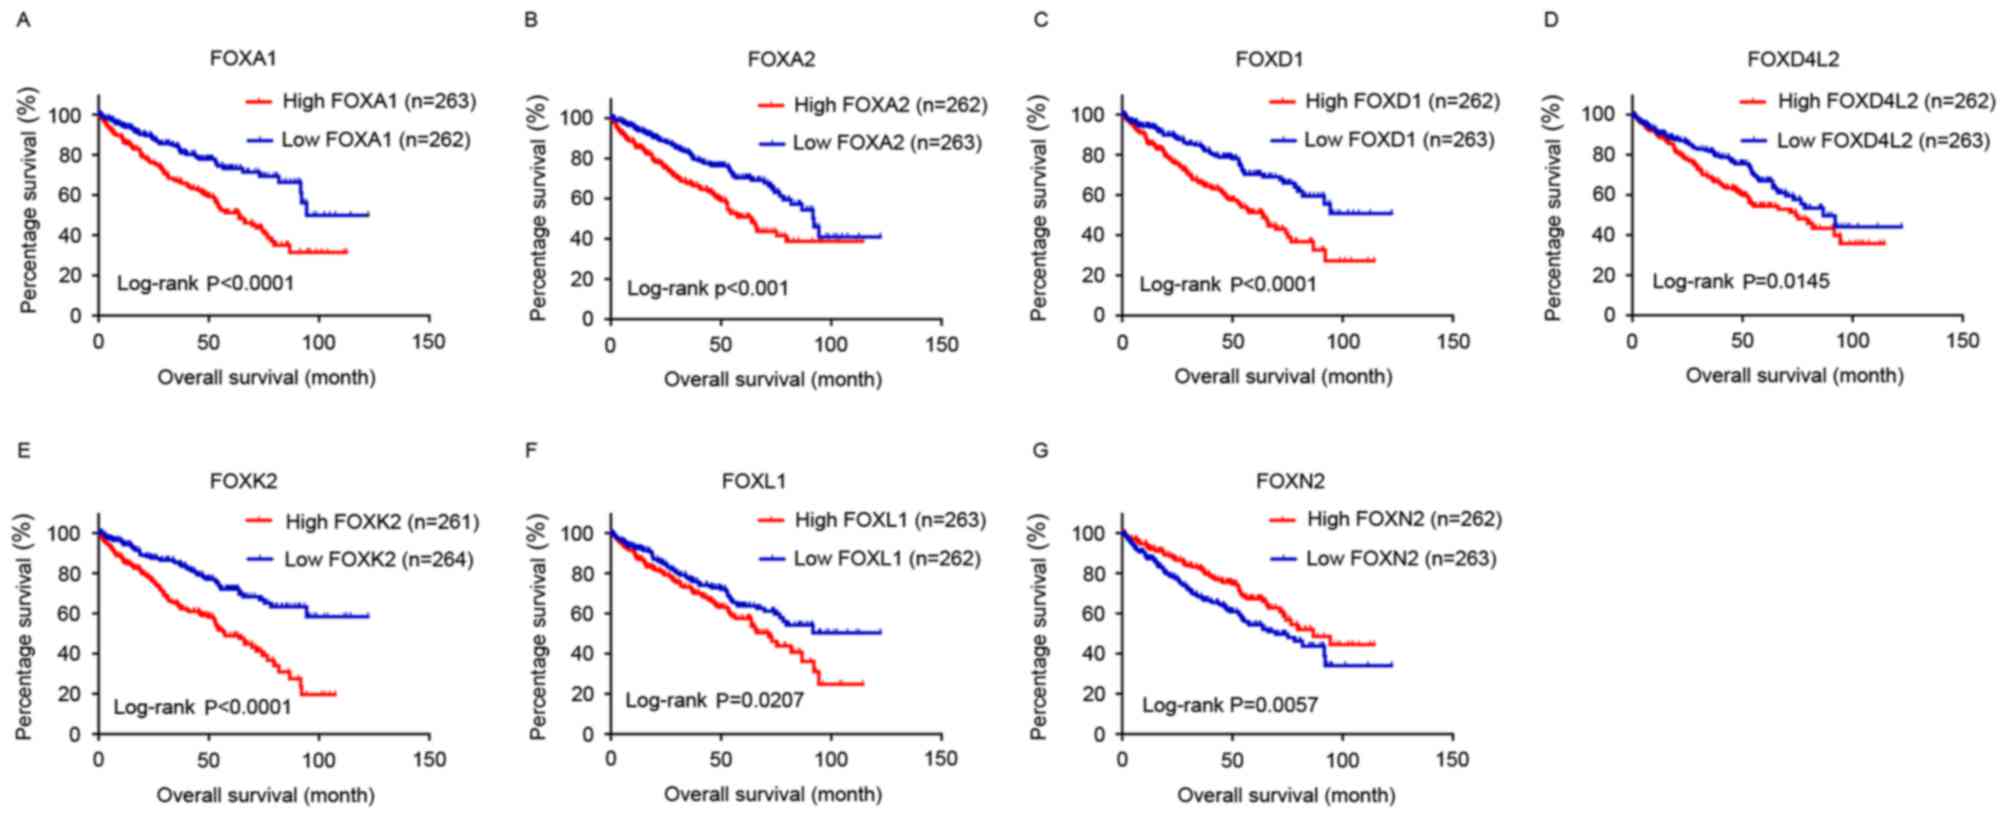
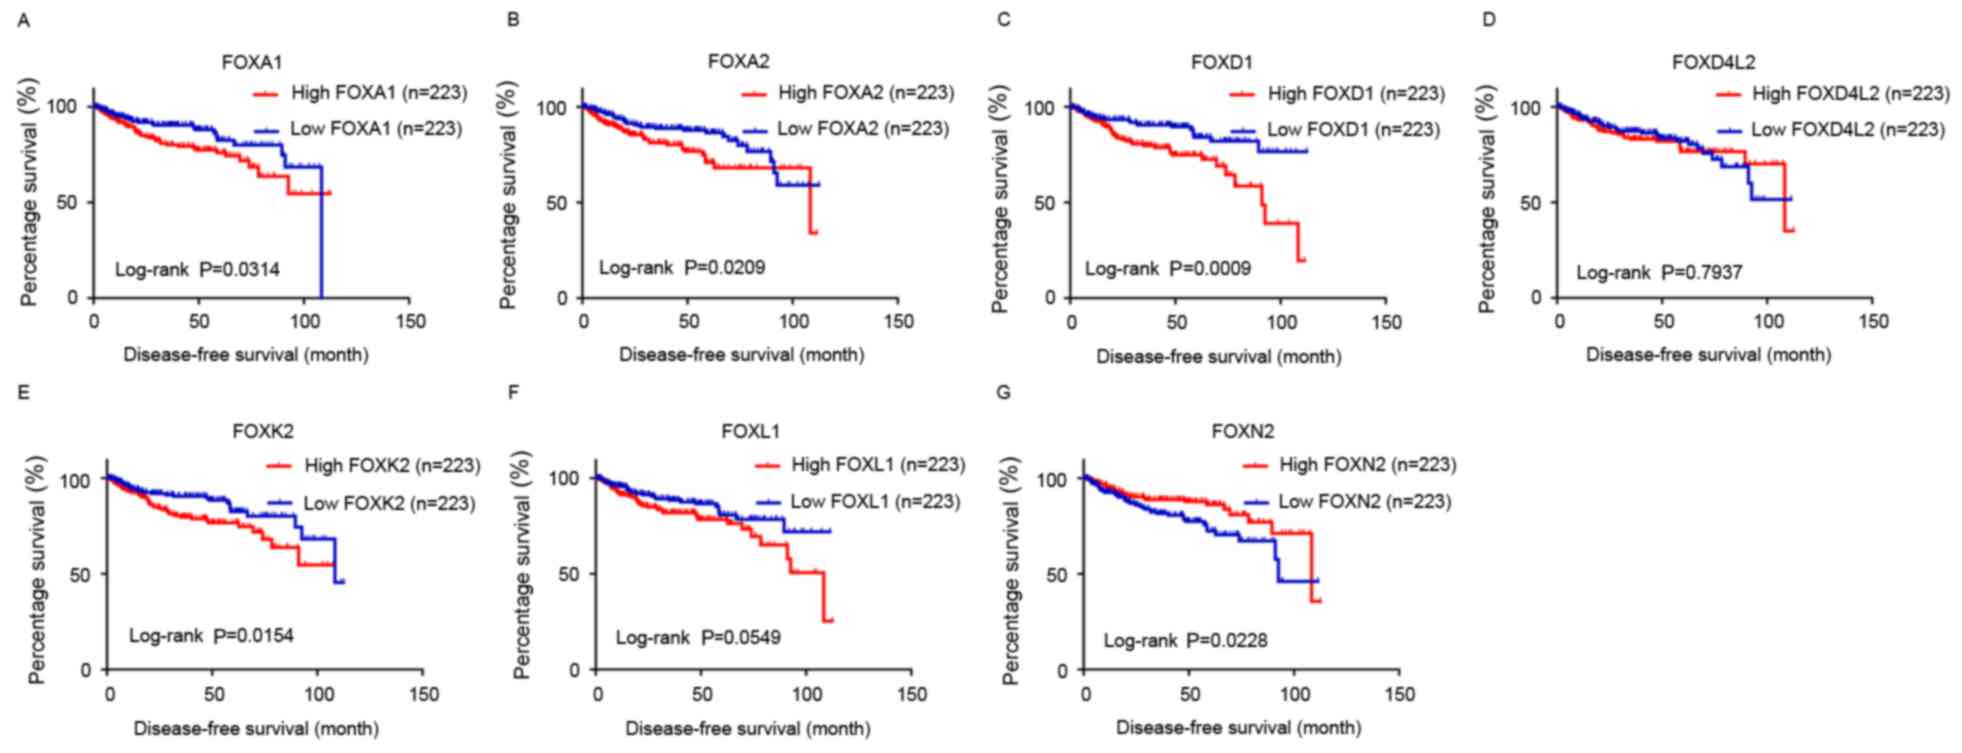
Kaplan-Meier analysis was performed with the cut-off
set at the median expression level of each FOX family gene. The
results revealed that low levels of FOXA1, FOXA2, FOXD1 and
FOXK2 were associated with longer OS and DFS (P<0.05),
while a high level of FOXN2 was associated with longer OS
and DFS (P<0.05; Figs. 1 and
2). A low level of FOXL1 and
FOXD4L2 was only associated with longer OS and not DFS
(P<0.05; Figs. 1 and 2).
To investigate the association between FOX gene
expression and clinical factors, multivariate logistic regression
analysis was performed. The results indicated that FOXA1
expression was significantly associated with tumor stage
(P<0.001, OR, 1.32; 95% CI, 1.10–1.59) and grade (P=0.01, OR,
1.51; 95% CI, 1.12–2.04) (Table
III). FOXA2 was associated with gender (P=0.04, OR, 0.66; 95%
CI, 0.44–0.99) and stage (P=0.02, OR, 1.25, 95% CI, 1.03–1.50)
(Table III). FOXD1 was only
associated with grade (P<0.001, OR, 1.65; 95% CI, 1.22–2.23).
FOXK2 was associated with gender (P<0.001, OR, 0.54; 95%
CI, 0.36–0.81) and tumor grade (P=0.02, OR, 1.44; 95% CI,
1.07–1.94). FOXL1 was associated with gender (P=0.04, OR,
1.53; 95% CI, 1.03–2.26). However, no significant association was
observed between FOXD4L2, FOXN2 and clinical variables
(Tables IV and V).
| Table III.Multivariate logistic regression
analysis of factors that may affect the expression of FOXA1
and FOXA2 in The Cancer Genome Atlas cohort with clear cell
renal cell carcinoma. |
Table III.
Multivariate logistic regression
analysis of factors that may affect the expression of FOXA1
and FOXA2 in The Cancer Genome Atlas cohort with clear cell
renal cell carcinoma.
| A,
FOXA1 |
|---|
|
|---|
| Variables | OR (95% CI) | P-value |
|---|
| Age | 1.01
(0.99–1.02) | 0.57 |
| Sex | 1.02
(0.68–1.53) | 0.93 |
| Stageb | 1.32
(1.10–1.59) |
<0.001a |
| Gradec | 1.51
(1.12–2.04) | 0.01a |
| Tumor diameter | 0.96
(0.71–1.29) | 0.78 |
| Position | 1.06
(0.72–1.55) | 0.77 |
|
| B,
FOXA2 |
|
|
Variable | OR (95%
CI) | P-value |
|
| Age | 1.00
(0.98–1.01) | 0.68 |
| Sex | 0.66
(0.44–0.99) | 0.04a |
| Stageb | 1.25
(1.03–1.50) | 0.02a |
| Gradec | 1.18
(0.88–1.58) | 0.28 |
| Tumor diameter | 1.10
(0.82–1.48) | 0.54 |
| Position | 1.13
(0.78–1.65) | 0.51 |
| Table IV.Multivariate logistic regression
analysis of factors that may affect the expression of FOXD1
and FOXD4L1 in The Cancer Genome Atlas cohort with clear
cell renal cell carcinoma. |
Table IV.
Multivariate logistic regression
analysis of factors that may affect the expression of FOXD1
and FOXD4L1 in The Cancer Genome Atlas cohort with clear
cell renal cell carcinoma.
| A,
FOXD1 |
|---|
|
|---|
| Variable | OR (95% CI) | P-value |
|---|
| Age | 1.01
(0.99–1.02) | 0.32 |
| Sex | 1.43
(0.96–2.15) | 0.08 |
| Stageb | 1.12
(0.93–1.34) | 0.25 |
| Gradec | 1.65
(1.22–2.23) |
<0.001a |
| Tumor diameter | 1.02
(0.76–1.38) | 0.89 |
| Position | 1.15
(0.79–1.67) | 0.48 |
|
| B,
FOXD4L1 |
|
|
Variable | OR (95%
CI) | P-value |
|
| Age | 1.01
(0.99–1.02) | 0.37 |
| Sex | 0.75
(0.50–1.11) | 0.15 |
| Stageb | 1.20
(1.00–1.44) | 0.05 |
| Gradec | 1.11
(0.83–1.49) | 0.48 |
| Tumor diameter | 1.18
(0.88–1.58) | 0.28 |
| Position | 0.72
(0.49–1.04) | 0.08 |
| Table V.Multivariate logistic regression
analysis of factors that may affect the expression of FOXK2,
FOXL1 and FOXN2 in The Cancer Genome Atlas cohort with
clear cell renal cell carcinoma. |
Table V.
Multivariate logistic regression
analysis of factors that may affect the expression of FOXK2,
FOXL1 and FOXN2 in The Cancer Genome Atlas cohort with
clear cell renal cell carcinoma.
| A,
FOXK2 |
|---|
|
|---|
| Variable | OR (95% CI) | P-value |
|---|
| Age | 1.00
(0.98–1.01) | 0.56 |
| Sex | 0.54
(0.36–0.81) |
<0.001a |
| Stageb | 1.10
(0.92–1.33) | 0.30 |
| Gradec | 1.44
(1.07–1.94) | 0.02a |
| Tumor diameter | 1.03
(0.77–1.39) | 0.82 |
| Position | 1.00
(0.69–1.45) | 0.99 |
|
| B,
FOXL1 |
|
|
Variable | OR (95%
CI) | P-value |
|
| Age | 1.00
(0.99–1.02) | 0.97 |
| Sex | 1.53
(1.03–2.26) | 0.04a |
| Stageb | 1.13
(0.94–1.35) | 0.20 |
| Gradec | 1.00
(0.75–1.34) | 0.99 |
| Tumor diameter | 0.87
(0.65–1.16) | 0.34 |
| Position | 0.84
(0.58–1.22) | 0.35 |
|
| C,
FOXN2 |
|
|
Variable | OR (95%
CI) | P-value |
|
| Age | 0.99
(0.97–1.00) | 0.13 |
| Sex | 1.20
(0.80–1.79) | 0.38 |
| Stageb | 0.85
(0.71–1.03) | 0.09 |
| Gradec | 0.89
(0.67–1.20) | 0.46 |
| Tumor diameter | 0.79
(0.59–1.06) | 0.12 |
| Position | 1.46
(1.01–2.12) | 0.05 |
FOX gene network revealed nuclear
receptor coactivator (NCOA)1, NADH dehydrogenase (ubiquinone)
flavoprotein (NDUFV)3, phosphatidylserine decarboxylase (PISD) and
pyruvate kinase, liver and red blood cell (PKLR) are independent
prognostic factors for OS in the TCGA cohort
It was investigated whether the expression level of
FOX family-associated genes had an effect on patient OS in TCGA
cohort. The gene network is shown in Fig.
3, and details of the genes in the network are shown in
Table VI. The data from univariate
Cox proportional hazards ratio analysis indicated that the
expression levels of acyl-coenzyme A dehydrogenase, C-4 to C-12
straight chain, androgen receptor, α-fetoprotein, bone
morphogenetic protein receptor type II, CCAAT/enhancer-binding
protein β, engrailed homeobox 2, hydroxyacyl-coenzyme A
dehydrogenase, 3-hydroxy-3-methylglutaryl-coenzyme A synthase 1,
hepatocyte nuclear factor 4α, insulin-like growth factor binding
protein 1, interleukin-2 (IL-2), potassium
inwardly-rectifying channel subfamily J member 11, NCOA1, NCOA3,
NDUFV3, PISD, PKLR and uncoupling protein 2 were associated
with OS. Multivariate analysis for prognostic factors was performed
by the Cox proportional hazards ratio analysis and revealed that
the expression of NCOA1, NDUFV3, PISD and PKLR were
independent prognostic factors for OS in the TCGA cohort (Table VII).
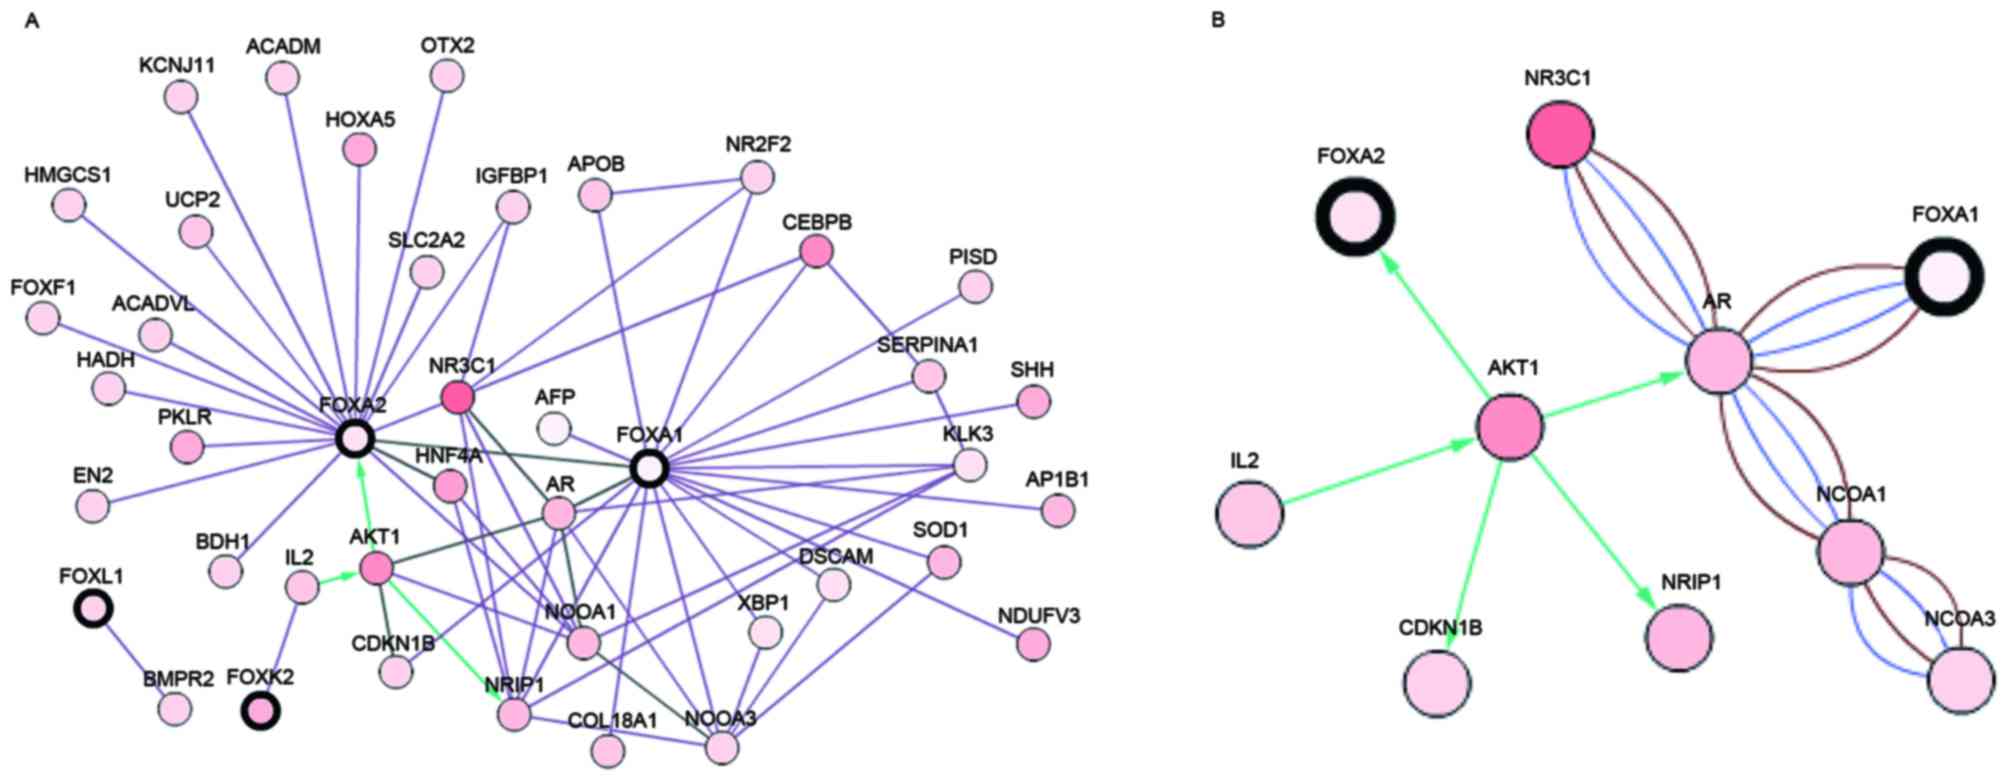 | Figure 3.Gene network of prognosis-associated
FOX genes. Gene network was drawn with the independent prognosis
predictors FOXA1, FOXA2, FOXD1, FOXD4L2, FOXK2, FOXL1 and
FOXN2 genes. A total of three criteria were selected for
construction of the network: ‘Interacts with’, ‘state change’ and
‘in the same component’. The threshold of state change was set as
12%. The network was plotted using the cBioPortal website
(www.cbioportal.org). (A) FOXN2,
FOXD1 and FOXD4L2 were absent in the network since they
were not connected with any genes. A network involving FOXA1,
FOXA2, FOXK2 and FOXL1 was constructed with the aforementioned
conditions. Connecting lines meant an association between the two
connected genes. (B) Most significant associations between
FOXA1 and FOXA2 were drawn. Brown line, genes in in
the same component, blue line, gene interactions; green line,
co-expression. |
| Table VI.List of FOX family-associated genes
as revealed by gene network analysis. |
Table VI.
List of FOX family-associated genes
as revealed by gene network analysis.
| Gene | Full gene name |
UniGenea |
|---|
| FOXK2 | Forkhead box
K2 | Hs.591140 |
| XBP1 | X-box binding
protein 1 | Hs.437638 |
| FOXL1 | Forkhead box
L1 | Hs.533830 |
| EN2 | Engrailed homeobox
2 | Hs.134989 |
| FOXA2 | Forkhead box
A2 | Hs.155651 |
| FOXF1 | Forkhead box
F1 | Hs.155591 |
| CEBPB |
CCAAT/enhancer-binding protein β | Hs.517106,
Hs.716248 |
| FOXA1 | Forkhead box
A1 | Hs.163484 |
| HADH |
Hydroxyacyl-coenzyme A dehydrogenase | Hs.438289 |
| BDH1 | 3-hydroxybutyrate
dehydrogenase, type 1 | Hs.274539 |
| ACADM | Acyl-coenzyme A
dehydrogenase, C-4 to C-12 straight chain | Hs.445040 |
| ACADVL | Acyl-coenzyme A
dehydrogenase, very long chain | Hs.463928,
Hs.437178 |
| AP1B1 | Adaptor-related
protein complex 1, β1 subunit | Hs.368794 |
| HMGCS1 |
3-hydroxy-3-methylglutaryl-coenzyme A
synthase 1 (soluble) | Hs.397729 |
| BMPR2 | Bone morphogenetic
protein receptor type II (serine/threonine kinase) | Hs.471119 |
| NR3C1 | Nuclear receptor
subfamily 3, group C, member 1 (glucocorticoid receptor) | Hs.122926 |
| KCNJ11 | Potassium
inwardly-rectifying channel subfamily J member 11 | Hs.248141 |
| SHH | Sonic hedgehog
homolog (Drosophila) | Hs.164537 |
| AKT1 | V-Akt murine
thymoma viral oncogene homolog 1 | Hs.525622 |
| APOB | Apolipoprotein B
(including Ag(x) antigen) | Hs.120759 |
| HOXA5 | Homeobox A5 | Hs.655218 |
| SLC2A2 | Solute carrier
family 2 (facilitated glucose transporter), member 2 | Hs.167584 |
| SERPINA1 | Serpin peptidase
inhibitor, clade A (α-1 antiproteinase, antitrypsin), member 1 | Hs.525557 |
| NR2F2 | Nuclear receptor
subfamily 2, group F, member 2 | Hs.657455,
Hs.347991 |
| DSCAM | Down syndrome cell
adhesion molecule | Hs.397800 |
| COL18A1 | Collagen, type
XVIII, α1 | Hs.517356 |
| AR | Androgen
receptor | Hs.496240 |
| KLK3 | Kallikrein-related
peptidase 3 | Hs.171995 |
| OTX2 | Orthodenticle
homeobox 2 | Hs.288655 |
| PISD | Phosphatidylserine
decarboxylase | Hs.420559 |
| SOD1 | Superoxide
dismutase 1, soluble | Hs.443914 |
| NRIP1 | Nuclear receptor
interacting protein 1 | Hs.155017 |
| NDUFV3 | NADH dehydrogenase
(ubiquinone) flavoprotein 3, 10 kDa | Hs.473937 |
| AFP | α-fetoprotein | Hs.518808 |
| NCOA1 | Nuclear receptor
coactivator 1 | Hs.596314 |
| CDKN1B | Cyclin-dependent
kinase inhibitor 1B (p27, Kip1) | Hs.238990 |
| NCOA3 | Nuclear receptor
coactivator 3 | Hs.592142 |
| HNF4A | Hepatocyte nuclear
factor 4α | Hs.116462 |
| UCP2 | Uncoupling protein
2 (mitochondrial, proton carrier) | Hs.80658 |
| PKLR | Pyruvate kinase,
liver and red blood cell | Hs.95990 |
| IL-2 | Interleukin 2 | Hs.89679 |
| Table VII.Cox proportional hazards analysis of
FOX family genes, related gene network, clinical parameters and
overall survival for The Cancer Genome Atlas clear cell renal cell
carcinoma cohort. |
Table VII.
Cox proportional hazards analysis of
FOX family genes, related gene network, clinical parameters and
overall survival for The Cancer Genome Atlas clear cell renal cell
carcinoma cohort.
|
| Univariate | Multivariate |
|---|
|
|
|
|
|---|
| Variables | HR (95% CI) | P-value | HR (95% CI) | P-value |
|---|
| Demographic
parameters |
|
|
|
|
|
Age | 1.028
(1.015–1.041) | <0.0001 | 1.046
(1.024–1.068) | <0.0001 |
| Sex
(male vs. female) | 0.950
(0.693–1.302) | 0.752 | 0.722
(0.390–1.336) | 0.300 |
| Clinical
parameters |
|
|
|
|
|
Stagea (I–IV) | 1.954
(1.707–2.236) | <0.0001 |
|
|
|
Gradeb (I–IV) | 2.399
(1.941–2.965) | <0.0001 | 1.717
(1.104–2.672) | 0.016 |
| Tumor diameter | 1.215
(0.983–1.502) | 0.071 | 0.600
(0.412–0.873) | 0.008 |
|
Laterality (left vs.
right) | 0.695
(0.512–0.944) | 0.020 | 0.665
(0.412–1.074) | 0.096 |
| pT
(T1/T2/T3) | 1.992
(1.685–2.355) | <0.0001 | 1.337
(0.954–1.874) | 0.092 |
| pN (N1
vs. N2) | 0.992
(0.562–1.752) | 0.978 | 0.552
(0.236–1.292) | 0.171 |
| pM (M0
vs. M1) | 4.548
(3.305–6.257) | <0.0001 | 6.362
(3.172–12.757) | <0.0001 |
| Hb
(low/normal/elevated) | 0.563
(0.400–0.792) | 0.001 | 0.665
(0.391–1.131) | 0.132 |
| WBC
(low/normal/elevated) | 0.668
(0.483–0.923) | 0.014 | 0.766
(0.434–1.354) | 0.360 |
| PLT
(low/normal/elevated) | 1.709
(1.156–2.526) | 0.007 | 1.443
(0.912–2.285) | 0.117 |
| FOX family
genes |
|
|
|
|
|
FOXL2 | 1.250
(1.076–1.452) | 0.004 | 1.882
(1.283–2.760) | 0.001 |
|
FOXL1 | 1.219
(1.071–1.387) | 0.003 | 1.418
(1.056–1.904) | 0.020 |
|
FOXS1 | 1.160
(1.031–1.303) | 0.013 | 0.648
(0.436–0.964) | 0.032 |
|
FOXN1 | 1.200
(0.992–1.451) | 0.060 |
|
|
|
FOXN2 | 0.775
(0.614–0.978) | 0.032 | 0.253
(0.103–0.618) | 0.003 |
|
FOXN3 | 0.589
(0.470–0.740) | <0.0001 | 0.515
(0.228–1.163) | 0.110 |
|
FOXH1 | 1.292
(1.156–1.444) | <0.0001 | 0.825
(0.603–1.130) | 0.231 |
|
FOXG1 | 1.217
(1.110–1.335) | <0.0001 | 0.825
(0.658–1.034) | 0.095 |
|
FOXP2 | 1.005
(0.942–1.072) | 0.875 |
|
|
|
FOXD1 | 1.261
(1.142–1.392) | <0.0001 | 0.703
(0.554–0.891) | 0.004 |
|
FOXC2 | 0.948
(0.855–1.050) | 0.304 |
|
|
|
FOXC1 | 1.095
(0.926–1.296) | 0.288 |
|
|
|
FOXF1 | 0.942
(0.819–1.084) | 0.406 |
|
|
|
FOXF2 | 1.129
(1.000–1.274) | 0.050 | 0.942
(0.741–1.197) | 0.625 |
|
FOXE1 | 1.212
(1.120–1.312) | <0.0001 | 1.175
(0.983–1.405) | 0.077 |
|
FOXO3B | 0.774
(0.591–1.012) | 0.061 |
|
|
|
FOXB2 | 0.762
(0.513–1.130) | 0.177 |
|
|
|
FOXR1 | 1.160
(0.604–2.228) | 0.655 |
|
|
|
FOXN4 | 1.200
(1.062–1.357) | 0.003 | 0.615
(0.421–0.899) | 0.012 |
|
FOXM1 | 1.618
(1.433–1.827) | <0.0001 | 0.950
(0.638–1.414) | 0.800 |
|
FOXP3 | 1.252
(1.141–1.375) | <0.0001 | 0.926
(0.713–1.203) | 0.565 |
|
FOXP1 | 1.336
(1.089–1.639) | 0.006 | 1.761
(0.820–3.781) | 0.147 |
|
FOXP4 | 2.018
(1.572–2.591) | 0.000 | 1.695
(0.900–3.191) | 0.102 |
|
FOXO3 | 0.726
(0.562–0.938) | 0.014 | 0.393
(0.199–0.779) | 0.007 |
|
FOXO1 | 0.671
(0.529–0.851) | 0.001 | 1.978
(0.973–4.021) | 0.059 |
|
FOXO4 | 0.624
(0.464–0.840) | 0.002 | 0.521
(0.228–1.194) | 0.123 |
|
FOXR2 | 1.310
(0.795–2.160) | 0.290 |
|
|
|
FOXI1 | 0.976
(0.920–1.034) | 0.409 |
|
|
|
FOXI3 | 1.253
(0.757–2.074) | 0.379 |
|
|
|
FOXI2 | 0.848
(0.772–0.930) | 0.001 | 0.999
(0.816–1.222) | 0.990 |
|
FOXRED2 | 1.121
(0.909–1.383) | 0.284 |
|
|
|
FOXRED1 | 1.231
(0.950–1.594) | 0.115 |
|
|
|
FOXD4L5 | 0.994
(0.612–1.614) | 0.980 |
|
|
|
FOXD4L6 | 1.312
(1.100–1.566) | 0.003 | 0.909
(0.607–1.362) | 0.644 |
|
FOXD4L1 | 1.352
(1.158–1.578) | <0.0001 | 0.841
(0.546–1.296) | 0.433 |
|
FOXD4L2 | 1.256
(1.082–1.458) | 0.003 | 1.450
(1.059–1.986) | 0.021 |
|
FOXD4L3 | 1.366
(0.91–2.036) | 0.126 |
|
|
|
FOXB1 | 1.183
(1.017–1.375) | 0.029 | 0.954
(0.652–1.394) | 0.806 |
|
FOXK2 | 2.895
(2.023–4.142) | <0.0001 | 1.164
(0.356–3.798) | 0.802 |
|
FOXK1 | 0.982
(0.765–1.260) | 0.885 |
|
|
|
FOXD3 | 1.286
(1.049–1.577) | 0.016 | 0.930
(0.637–1.358) | 0.708 |
|
FOXA1 | 1.194
(1.127–1.266) | <0.0001 | 1.224
(1.066–1.405) | 0.004 |
|
FOXA3 | 1.047
(0.962–1.140) | 0.290 |
|
|
|
FOXA2 | 1.175
(1.103–1.253) | <0.0001 | 1.153
(1.010–1.316) | 0.035 |
|
FOXJ1 | 1.126
(1.046–1.213) | 0.002 | 1.074
(0.914–1.316) | 0.383 |
|
FOXJ2 | 1.024
(0.688–1.524) | 0.907 |
|
|
|
FOXJ3 | 0.963
(0.838–1.106) | 0.591 |
|
|
|
FOXE3 | 1.715
(1.409–2.088) | <0.0001 | 1.374
(0.923–2.045) | 0.118 |
|
FOXQ1 | 1.005
(0.905–1.115) | 0.929 |
|
|
|
FOXD4 | 1.159
(1.004–1.337) | 0.044 | 1.063
(0.735–1.538) | 0.744 |
|
FOXD2 | 1.206
(1.011–1.440) | 0.038 | 0.960
(0.543–1.697) | 0.889 |
| Network genes |
|
|
|
|
|
BDH1 | 1.047
(0.955–1.148) | 0.331 | 0.945
(0.777–1.149) | 0.570 |
|
EN2 | 1.258
(1.173–1.350) | <0.0001 | 0.930
(0.800–1.080) | 0.341 |
|
PKLR | 0.898
(0.852–0.947) | <0.0001 | 0.794
(0.659–0.955) | 0.015 |
|
ACADVL | 1.211
(0.949–1.546) | 0.123 | 0.774
(0.388–1.546) | 0.468 |
|
UCP2 | 1.292
(1.108–1.508) | 0.001 | 1.217
(0.791–1.871) | 0.372 |
|
KCNJ11 | 1.108
(1.000–1.226) | 0.049 | 0.936
(0.698–1.256) | 0.661 |
|
HOXA5 | 0.985
(0.842–1.153) | 0.854 | 1.748
(1.214–2.518) | 0.003 |
|
OTX2 | 1.263
(0.970–1.646) | 0.083 | 0.740
(0.466–1.176) | 0.202 |
|
NR3C1 | 0.823
(0.642–1.054) | 0.123 | 0.861
(0.421–1.763) | 0.683 |
|
HNF4A | 0.916
(0.866–0.969) | 0.002 | 1.011
(0.831–1.229) | 0.916 |
|
IL2 | 1.339
(1.100–1.631) | 0.004 | 0.874
(0.589–1.298) | 0.506 |
|
CDKN1B | 0.750
(0.557–1.010) | 0.058 | 2.720
(1.215–6.093) | 0.015 |
|
AR | 0.798
(0.744–0.857) | <0.0001 | 1.023
(0.795–1.317) | 0.860 |
|
NCOA1 | 0.523
(0.385–0.711) | <0.0001 | 3.901
(1.399–10.875) | 0.009 |
|
COL18A1 | 1.143
(0.933–1.400) | 0.196 | 1.024
(0.611–1.715) | 0.929 |
|
HMGCS1 | 0.524
(0.386–0.711) | <0.0001 | 0.962
(0.519–1.783) | 0.903 |
|
ACADM | 0.537
(0.454–0.634) | <0.0001 | 1.011
(0.561–1.822) | 0.971 |
|
SLC2A2 | 0.926
(0.879–0.976) | 0.004 | 1.045
(0.882–1.237) | 0.614 |
|
AKT1 | 1.442
(0.943–2.204) | 0.091 | 1.924
(0.612–6.044) | 0.263 |
|
BMPR2 | 0.608
(0.475–0.777) | <0.0001 | 0.929
(0.369–2.337) | 0.875 |
|
XBP1 | 1.032
(0.826–1.289) | 0.783 | 0.647
(0.410–1.023) | 0.062 |
|
DSCAM | 1.076
(0.971–1.191) | 0.162 | 1.262
(1.047–1.520) | 0.014 |
|
NDUFV3 | 1.560
(1.144–2.126) | 0.005 | 2.021
(1.080–3.785) | 0.028 |
|
SOD1 | 1.280
(0.954–1.718) | 0.100 | 1.191
(0.494–2.871) | 0.697 |
|
CEBPB | 1.525
(1.336–1.741) | <0.0001 | 0.905
(0.627–1.305) | 0.592 |
|
NCOA3 | 0.701
(0.534–0.920) | 0.011 | 1.128
(0.407–3.126) | 0.816 |
|
AP1B1 | 1.023
(0.728–1.436) | 0.897 | 0.502
(0.203–1.305) | 0.134 |
|
KLK3 | 0.990
(0.892–1.099) | 0.853 | 0.895
(0.630–1.272) | 0.537 |
|
SHH | 0.990
(0.893–1.098) | 0.855 | 0.930
(0.765–1.130) | 0.463 |
|
PISD | 2.048
(1.617–2.595) | <0.0001 | 3.389
(1.722–6.667) | <0.0001 |
|
AFP | 1.124
(1.035–1.221) | 0.006 | 0.974
(0.822–1.155) | 0.765 |
|
IGFBP1 | 1.095
(1.052–1.141) | <0.0001 | 0.970
(0.872–1.080) | 0.581 |
|
APOB | 1.001
(0.948–1.057) | 0.970 | 1.087
(0.962–1.228) | 0.183 |
|
NR2F2 | 0.985
(0.765–1.266) | 0.903 | 0.558
(0.317–0.983) | 0.043 |
|
SERPINA1 | 1.027
(0.940–1.122) | 0.552 | 1.139
(0.899–1.442) | 0.281 |
|
HADH | 0.375
(0.264–0.533) | <0.0001 | 0.560
(0.235–1.335) | 0.191 |
Discussion
In the present study, it was revealed that FOXA1,
FOXA2, FOXD1, FOXD4L2, FOXK2 and FOXL1 genes were risk
factors for clinical outcome of ccRCC. However, high expression of
the FOXN2 gene was associated with longer survival in the
TCGA cohort. Furthermore, in a network of FOX family-related genes,
NCOA1, NDUFV3, PISD and PKLR were identified as
independent prognostic factors for OS in patients with ccRCC.
FOXA1 and FOXA2 are two members of the FOXA
transcription factor family. FOXA1, also termed HNF-3, has an
important role in the progression of bladder, prostate and breast
cancer (12–15). A previous study has demonstrated that
downregulation of FOXA1 is associated with poor OS in human bladder
cancer (12). FOXA1 may also be a
potential treatment target of breast and prostate cancer due to its
effects on chromatin remodeling via androgen and estrogen receptors
(16). FOXA2 is involved in
proliferation, differentiation and maintenance of cancer stem cells
(17–19). However, FOXA2 may have different roles
in different tissues. FOXA2 is associated with the prognosis of
human gastric cancer, and patients with high FOXA2 expression level
had longer OS compared with patients with low FOXA2 expression
(19). However, one study conducted
in breast carcinoma revealed that FOXA2 promotes the development of
triple-negative/basal-like tumors (18).
FOXD1 performs an essential role in numerous
biological processes, including proliferation, differentiation and
tumorigenesis (20,21). Upregulation of FOXD1 is associated
with the development of resistance to chemotherapy in patients with
prostate and ovarian cancer (22).
Another study reported that FOXD1 is upregulated in breast cancer,
and the depletion or overexpression of FOXD1 may cause changes in
proliferation and chemoresistance (20). FOXK2, also termed ILF or ILF1, was
first identified as a regulator of IL-2 transcription. FOXK2
upregulates activator protein-1 (AP-1)-dependent gene expression
through its interaction with AP-1 and accelerates the binding of
AP-1 to chromatin (23). FOXL1 is
associated with pancreatic carcinoma and has an important
inhibitory role in pancreatic tumor progression (24). However, to the best of our knowledge,
no study has examined FOXD4L2 to date, and the findings of the
present study suggest that FOXD4L2 should be investigated further
in future studies. In addition, it was observed in the present
study that high FOXN2 mRNA expression was associated with
longer OS, and this is consistent with previous results in
glioblastoma multiforme (25).
Previous studies have shown that FOX genes have an
essential role in the progression of several types of tumors,
including ccRCC (9,12–14,19,21).
However, to the best of our knowledge, the present study is the
first to comprehensively examine the association between the
outcome of ccRCC and the gene expression of the entire FOX gene
family. The detailed mechanisms remain unknown and would need to be
investigated in future studies.
The present study also investigated the association
between FOX-related genes and prognosis of patients with ccRCC. The
results indicated that the FOX-associated genes NCOA1, NDUFV3,
PISD and PKLR are associated with OS of patients with
ccRCC. It has been previously demonstrated that the nuclear
co-activator NCOA1 (SRC-1) is able to promote breast cancer
metastasis through directly targeting macrophage colony-stimulating
factor 1 expression (26).
Overexpression of NCOA1 is associated with resistance to endocrine
therapy and disease recurrence (26).
The NDUFV3 gene is located at chromosome 21q22.3 and may be
associated with the occurrence of Down syndrome (27). Although limited information is known
about PISD, one study reported that PISD was associated with
tumorigenesis and tumor growth (28).
The PKLR gene is considered to be involved in pyruvate
kinase-deficient hemolytic anemia (29).
The major strength of the present study is that it
is the first comprehensive evaluation of the association between
FOX genes and the prognosis of patients with ccRCC. The study
involved a large cohort, and the clinical follow-up was long. These
findings will help provide the foundation to elucidate the
mechanisms of FOX genes and their function in ccRCC.
However, the present study also has a number of
limitations. Firstly, only data from TCGA database was analyzed and
further validation is required. Secondly, the present study did not
investigate the specific mechanisms of action of FOX genes in
patients with ccRCC. Additionally, the FOX gene signature
may not be sufficient to predict the prognosis of ccRCC, since
other factors (tumor stage, surgical procedures, state of
nutrition, economic issues, response to sunitinib, comorbidities
and lifestyle factors), can also affect the prognosis of ccRCC
(5,9,11,30). Therefore, additional study is required
to examine the association between FOX genes and ccRCC.
Findings of the present study suggest that the
expression of FOX family genes FOXA1, FOXA2, FOXD1, FOXD4L2,
FOXK2, FOXL1 and FOXN2 and FOX family-related genes
NCOA1, NDUFV3, PISD and PKLR are associated with
survival in patients with ccRCC. Findings of the present study and
the specific underlying require further investigation.
Acknowledgements
The authors would like to thank The Cancer Genome
Atlas Group and cancer browser website (https://genome-cancer.ucsc.edu/) for the collection
of, and the open access to all data.
Funding
The present study was supported by the International
Cooperation and Exchange of Science and Technology Commission of
Shanghai Municipality (grant no. 12410709300), the Guide Project of
Science and Technology Commission of Shanghai Municipality (grant
no. 124119a7300), the Outstanding Young Talent Training Plan of
Shanghai Municipal Commission of Health and Family Planning (grant
no. XYQ2013102), the National Nature Science Foundation of China
(grant nos. 81001131 and 81472377), the Shanghai Municipal
Commission of Health and Family Planning grant (grant no.
2014zyjb0102) and the National Science Foundation for Young
Scientists of China (grant no. 81202004).
Availability of data and materials
The datasets generated and analyzed during the
current study are available from the Cancer Genomics Browser of
University of California Santa Cruz (https://genome-cancer.ucsc.edu/), and the datasets are
available on reasonable request from the corresponding author.
Authors' contributions
ZWJ and FNW conceived the present study, collected
and analyzed the clinical data, and drafted the manuscript. BD and
DWY designed and supervised this study. YZ and GHS contributed to
the collection of the clinical data, and HLZ helped to analyze the
data. All authors reviewed and approved the manuscript.
Ethics approval and consent to
participate
The datasets we used in this article were generated
and analyzed from The Cancer Genome Atlas Group, which had been
approved by Memorial Sloan-Kettering Cancer Center institutional
review board (31), and the informed
consent was provided at the same time.
Consent for publication
Not applicable.
Competing interests
All authors declare that they have no competing
interests.
References
|
1
|
Motzer RJ, Agarwal N, Beard C, Bhayani S,
Bolger GB, Carducci MA, Chang SS, Choueiri TK, Hancock SL, Hudes
GR, et al: Kidney cancer. J Natl Compr Canc Netw. 9:960–977. 2011.
View Article : Google Scholar : PubMed/NCBI
|
|
2
|
Ljungberg B, Campbell SC, Cho HY, Jacqmin
D, Lee JE, Weikert S and Kiemeney LA: The epidemiology of renal
cell carcinoma. Eur Urol. 60:615–621. 2011. View Article : Google Scholar : PubMed/NCBI
|
|
3
|
Gudbjartsson T, Hardarson S, Petursdottir
V, Thoroddsen A, Magnusson J and Einarsson GV: Histological
subtyping and nuclear grading of renal cell carcinoma and their
implications for survival: A retrospective nation-wide study of 629
patients. Eur Urol. 48:593–600. 2005. View Article : Google Scholar : PubMed/NCBI
|
|
4
|
Parkin DM, Bray F, Ferlay J and Pisani P:
Global cancer statistics, 2002. CA Cancer J Clin. 55:74–108. 2005.
View Article : Google Scholar : PubMed/NCBI
|
|
5
|
Han S, Wang T, Jiang D, Yu Y, Wang Y, Yan
W, Xu W, Cheng M, Zhou W and Xiao J: Surgery and survival outcomes
of 30 patients with neurological deficit due to clear cell renal
cell carcinoma spinal metastases. Eur Spine J. 24:1786–1791. 2015.
View Article : Google Scholar : PubMed/NCBI
|
|
6
|
Almeida M, Han L, Martin-Millan M, O'Brien
CA and Manolagas SC: Oxidative stress antagonizes Wnt signaling in
osteoblast precursors by diverting beta-catenin from T cell
factor-to Forkhead Box O-mediated transcription. J Biol Chem.
282:27298–27305. 2007. View Article : Google Scholar : PubMed/NCBI
|
|
7
|
Brenkman AB, van den Broek NJF, de Keizer
PLJ, van Gent DC and Burgering BM: The DNA damage repair protein
Ku70 interacts with FOXO4 to coordinate a conserved cellular stress
response. FASEB J. 24:4271–4280. 2010. View Article : Google Scholar : PubMed/NCBI
|
|
8
|
Roesch A, Mueller AM, Stempfl T, Moehle C,
Landthaler M and Vogt T: RBP2-H1/JARID1B is a transcriptional
regulator with a tumor suppressive potential in melanoma cells. Int
J Cancer. 122:1047–1057. 2008. View Article : Google Scholar : PubMed/NCBI
|
|
9
|
Katoh M and Katoh M: Human FOX gene family
(Review). Int J Oncol. 25:1495–1500. 2004.PubMed/NCBI
|
|
10
|
Lu X, Wan F, Zhang H, Shi G and Ye D:
ITGA2B and ITGA8 are predictive of prognosis in clear cell renal
cell carcinoma patients. Tumour Biol. 37:253–262. 2016. View Article : Google Scholar : PubMed/NCBI
|
|
11
|
Paner GP, Stadler WM, Hansel DE, Montironi
R, Lin DW and Amin MB: Updates in the eighth edition of the
tumor-node-metastasis staging classification for urologic cancers.
Eur Urol: pii: S0302-2838. 2018.
|
|
12
|
Reddy OL, Cates JM, Gellert LL, Crist HS,
Yang Z, Yamashita H, Taylor JA III, Smith JA Jr, Chang SS, Cookson
MS, et al: Loss of FOXA1 drives sexually dimorphic changes in
Urothelial differentiation and is an independent predictor of poor
prognosis in bladder cancer. Am J Pathol. 185:1385–1395. 2015.
View Article : Google Scholar : PubMed/NCBI
|
|
13
|
Guo W, Keener AL, Jing Y, Cai L, Ai J,
Zhang J, Fisher AL, Fu G and Wang Z: FOXA1 modulates EAF2
regulation of AR transcriptional activity, cell proliferation and
migration in prostate cancer cells. Prostate. 75:976–987. 2015.
View Article : Google Scholar : PubMed/NCBI
|
|
14
|
Zheng L, Qian B, Tian D, Tang T, Wan S,
Wang L, Zhu L and Geng X: FOXA1 positively regulates gene
expression by changing gene methylation status in human breast
cancer MCF-7 cells. Int J Clin Exp Pathol. 8:96–106.
2015.PubMed/NCBI
|
|
15
|
Dou C, Wang Y, Li C, Liu Z, Jia Y, Li Q,
Yang W, Yao Y, Liu Q and Tu K: MicroRNA-212 suppresses tumor growth
of human hepatocellular carcinoma by targeting FOXA1. Oncotarget.
6:13216–13228. 2015. View Article : Google Scholar : PubMed/NCBI
|
|
16
|
Yang YA and Yu J: Current perspectives on
FOXA1 regulation of androgen receptor signaling and prostate
cancer. Genes Dis. 2:144–151. 2015. View Article : Google Scholar : PubMed/NCBI
|
|
17
|
Gosalia N, Yang R, Kerschner JL and Harris
A: FOXA2 regulates a network of genes involved in critical
functions of human intestinal epithelial cells. Physiol Genomics.
47:290–297. 2015. View Article : Google Scholar : PubMed/NCBI
|
|
18
|
Perez-Balaguer A, Ortiz-Martínez F,
García-Martínez A, Pomares-Navarro C, Lerma E and Peiró G: FOXA2
mRNA expression is associated with relapse in patients with
triple-negative/basal-like breast carcinoma. Breast Cancer Res
Treat. 153:465–474. 2015. View Article : Google Scholar : PubMed/NCBI
|
|
19
|
Zhu C, Wang J, Shi B, Hu P, Ning B, Zhang
Q, Chen F, Chen WS, Zhang X and Xie WF: The transcription factor
FOXA2 suppresses gastric tumorigenesis in vitro and in vivo. Digest
Dis Sci. 60:109–117. 2015. View Article : Google Scholar : PubMed/NCBI
|
|
20
|
Zhao YF, Zhao JY, Yue H, Hu KS, Shen H,
Guo ZG and Su XJ: FOXD1 promotes breast cancer proliferation and
chemotherapeutic drug resistance by targeting p27. Biochem Biophys
Res Commun. 456:232–237. 2015. View Article : Google Scholar : PubMed/NCBI
|
|
21
|
Nakayama S, Soejima K, Yasuda H, Yoda S,
Satomi R, Ikemura S, Terai H, Sato T, Yamaguchi N, Hamamoto J, et
al: FOXD1 expression is associated with poor prognosis in non-small
cell lung cancer. Anticancer Res. 35:261–268. 2015.PubMed/NCBI
|
|
22
|
Van der Heul-Nieuwenhuijsen L, Dits NF and
Jenster G: Gene expression of forkhead transcription factors in the
normal and diseased human prostate. BJU Int. 103:1574–1580. 2009.
View Article : Google Scholar : PubMed/NCBI
|
|
23
|
Ji Z, Donaldson IJ, Liu J, Hayes A, Zeef
LA and Sharrocks AD: The forkhead transcription factor FOXK2
promotes AP-1-mediated transcriptional regulation. Mol Cell Biol.
32:385–398. 2012. View Article : Google Scholar : PubMed/NCBI
|
|
24
|
Zhang G, He P, Gaedcke J, Ghadimi BM, Ried
T, Yfantis HG, Lee DH, Hanna N, Alexander HR and Hussain SP: FOXL1,
a novel candidate tumor suppressor, inhibits tumor aggressiveness
and predicts outcome in human pancreatic cancer. Cancer Res.
73:5416–5425. 2013. View Article : Google Scholar : PubMed/NCBI
|
|
25
|
Robertson E, Perry C, Doherty R and
Madhusudan S: Transcriptomic profiling of Forkhead box
transcription factors in adult glioblastoma multiforme. Cancer
Genomics Proteomics. 12:103–112. 2015.PubMed/NCBI
|
|
26
|
Qin L, Wu YL, Toneff MJ, Li D, Liao L, Gao
X, Bane FT, Tien JC, Xu Y, Feng Z, et al: NCOA1 directly targets
M-CSF1 expression to promote breast cancer metastasis. Cancer Res.
74:3477–3488. 2014. View Article : Google Scholar : PubMed/NCBI
|
|
27
|
De Coo RF, Buddiger P, Smeets HJ and van
Oost BA: Molecular cloning and characterization of the human
mitochondrial NADH: Oxidoreductase 10-kDa gene (NDUFV3). Genomics.
45:434–437. 1997. View Article : Google Scholar : PubMed/NCBI
|
|
28
|
Kim JC, Kim SY, Roh SA, Cho DH, Kim DD,
Kim JH and Kim YS: Gene expression profiling: Canonical molecular
changes and clinicopathological features in sporadic colorectal
cancers. World J Gastroenterol. 43:6662–6672. 2008. View Article : Google Scholar
|
|
29
|
Park-Hah JO, Kanno H, Kim WD and Fujii H:
A novel homozygous mutation of PKLR gene in a
pyruvate-kinase-deficient korean family. Acta Haematol.
113:208–211. 2005. View Article : Google Scholar : PubMed/NCBI
|
|
30
|
Li P, Wong YN, Jahnke J, Pettit AR and
Doshi JA: Association of high cost sharing and targeted therapy
initiation among elderly Medicare patients with metastatic renal
cell carcinoma. Cancer Med. 1:75–86. 2018. View Article : Google Scholar
|
|
31
|
Hakimi AA, Reznik E, Lee CH, Creighton CJ,
Brannon AR, Luna A, Aksoy BA, Liu EM, Shen R, Lee W, et al: An
integrated metabolic atlas of clear cell renal cell carcinoma.
Cancer Cell. 1:104–116. 2016. View Article : Google Scholar
|