Introduction
Based on the 2014 World Health Organization report,
breast cancer has the second highest incidence of mortality for
females in China (1). Breast cancer
is a heterogeneous disease; numerous frequent gene copy number
variations (CNVs) have been identified, including gene
amplification of fibroblast growth factor receptor 1 (FGFR1)
(2), human epidermal growth factor
receptor 1 (HER1), human epidermal growth factor 2
(HER2), GATA3, PIK3CA, MAP3K1, TBX3,
RUNX1, CBFB, AFF2, PIK3R1,
PTPN22, PTPRD, NF1, SF3B1 and
CCND3 (3). Preliminary data
from the next-generation genome sequencing of primary breast cancer
has confirmed that CNVs may occur in a large selection of genes
(3), and indicate that these
variations may lead to different clinical consequences.
HER1 (also known as EGFR or ErbB1) and HER2 (also
known as ErbB2) belong to the ErbB family of signaling proteins,
which comprises four members: HER1, HER2, ErbB3 and ErbB4. ErbB
receptors are often amplified, mutated and/or overexpressed in
breast cancer (4,5). Between 15 and 20% of newly diagnosed
invasive breast carcinomas overexpress HER2 or exhibit HER2 gene
amplification (6). The frequency of
HER1 overexpression in breast cancer is variable, reportedly
ranging from 7 to 43% (7–13).
Activation of the ErbB family of receptor tyrosine
kinases via their cognate epidermal growth factor-like peptide
ligands constitutes a major event in the signaling pathways that
control the proliferation, survival, angiogenesis and metastasis of
breast cancer cells (14). Therefore,
ErbB family member receptors are attractive potential therapeutic
targets in breast cancer. At present, numerous tyrosine kinase
inhibitors that target ErbBs have been successfully developed and
approved to treat cancer patients. Trastuzumab (also known as
Herceptin), a humanized monoclonal antibody against the
extracellular portion of the HER2 protein, is in widespread
clinical use (15). Notably,
interactions between HER2 and other ErbB receptors, including HER1
and ErbB3, have been suggested as a possible mechanism for the
resistance to trastuzumab. Once activated by the binding of its
specific ligands, HER1 is the preferred heterodimerization partner
for HER2; HER1/HER2 heterodimers are more stable than HER1
homodimers, and binding of HER1 with HER2 can potentiate and
amplify the growth signals from HER1 activation (16–18).
FGFR1 has also been investigated and may be
amplified in 8–15% of all cases of breast cancer (19–21). FGFR1
is a member of the FGFR family, which exhibit a highly conserved
structure between members and throughout evolution. FGFRs are
receptors for fibroblast growth factors; the interaction between
fibroblast growth factors and FGFRs is associated with the
regulation of cell proliferation, survival, migration and
differentiation during development and adult life. The mutation and
amplification of FGFRs causes the aberrant activation of downstream
pathways, promoting cell cycle progression and mesenchymal
transformation while inhibiting apoptosis. Amplification of the
FGFR1 gene (at 8p11-12) is the most common alteration to
FGFR1 (22–24). FGFR1 amplification may also
drive resistance to endocrine therapy (25).
FGFR and EGFR signaling may mediate the downstream
phosphoinositide-3-kinase/Akt serine/threonine kinase (PI3K/AKT)
pathway. In this pathway, activated EGFR binds GRB2-associated
binding protein 1 together with growth factor receptor-bound
protein 2 to recruit PI3K (26). In
addition, FGFRs commonly mediate the PI3K/AKT pathway via FGFR
substrate 2a and other adaptor molecules (27). Major pathways downstream of activated
EGFRs/FGFRs, besides PI3K/AKT, include extracellular
signal-regulated kinase/mitogen-activated protein kinase 1
(ERK/MAPK) and protein kinase C/phospholipase C (PKC/PLC) pathways.
All of these pathways serve an important role in cell
proliferation, migration, differentiation and the inhibition of
apoptosis.
In the present study, the gene amplification
statuses of HER1, HER2 and FGFR1 were evaluated in 75
cases of invasive ductal breast cancer (IDC). Quantitative
polymerase chain reaction (qPCR) and fluorescence in situ
hybridization (FISH) were used to assess the gene CNV. A
statistical analysis revealed an association between CNVs and the
clinical prognosis.
Materials and methods
Patients and tissue samples
The records of the Department of Pathology of West
China Hospital (Chengdu, China) were retrospectively examined and
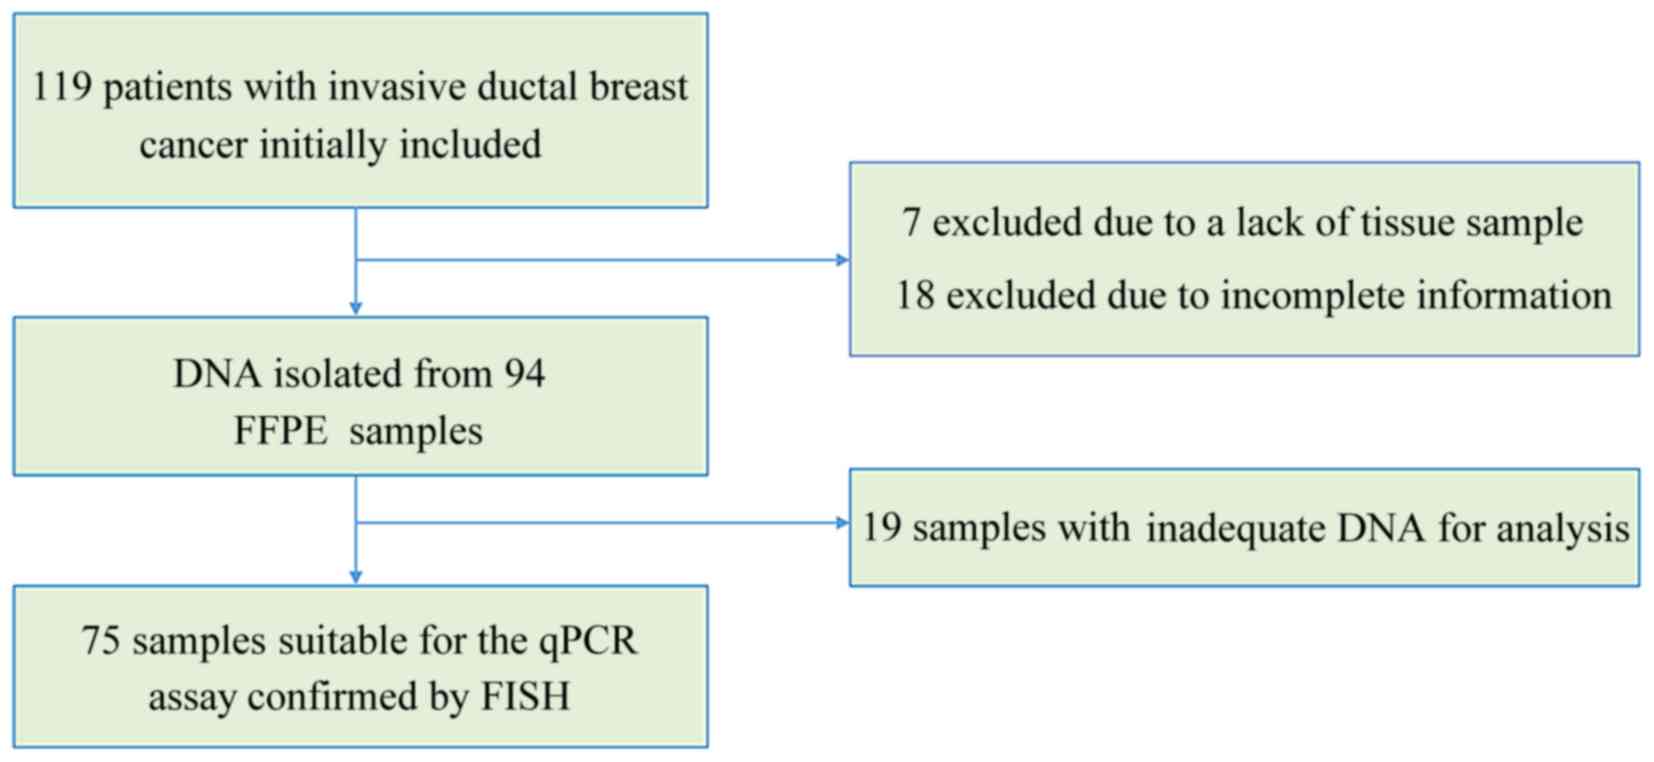
119 records of IDC cases were initially included in the study
(Fig. 1). Of the 119 cases, 7 were
excluded as there was no tissue specimen available and 18 were
excluded due to incomplete information. Of the remaining 94
formalin-fixed paraffin-embedded (FFPE) IDC tissue samples, 75 were
suitable for qPCR detection. The samples qualified for qPCR if IDC
was >70% of the FFPE sample and if they were acquired prior to
systemic treatment. Data regarding clinical characteristics were
gathered while preserving patient anonymity. The expression status
of ER and PR were obtained from clinical pathology reports. The
tumors were regarded as estrogen or progesterone receptor-positive
if ≥1% of tumor cells were stained positively, according to
previously reported criteria (28).
The study was approved by the Ethics Committee of West China
Hospital (no. 2013-191) and written informed consent was obtained
from all patients.
DNA isolation and qPCR
The tumor areas of each IDC sample were identified
on slides stained with hematoxylin and eosin, and matched with
corresponding FFPE tumor tissues. DNA was extracted from 4-µm-thick
FFPE tissue sections using the QIAamp DNA FFPE Tissue Kit (Qiagen
GmbH, Hilden, Germany). DNA was quantified with the Nanodrop2000
(Thermo Fisher Scientific, Inc., Wilmington, DE, USA) and samples
with A260/280 absorbance ratios <1.70, or ≥1.95, were excluded.
qPCR was performed with the Bio-Rad CFX96 system with SsoFast
Evagreen Supermix (both Bio-Rad, Hercules, CA, USA) and quantified
using the 2−ΔΔCq method (29). A total of 100 ng DNA was used per
reaction and each reaction was performed at 98°C for 2 min, 98°C
for 5 sec and 60°C for 10 sec, for 40 cycles. Primer sequences are
included in Table I. Transferrin
receptor and GAPDH were used as reference genes. Additionally, 50
normal samples were used as a control group, which were also
obtained from Department of Pathology of West China Hospital and
reported to possess no tumor cells in the initial pathologist
reports. The relative amplification levels of FGFR1, HER1
and HER2 were normalized to the mean of the reference genes
in order to calculate the relative CNV, compared with the control
samples, using the 2−ΔΔCq method. A gene was considered
to be amplified where the fold-change compared to the control group
was ≥2.
 | Table I.Primers used for the quantitative
polymerase chain reaction detection of TFRC, GAPDH, FGFR1,
HER1 and HER2. |
Table I.
Primers used for the quantitative
polymerase chain reaction detection of TFRC, GAPDH, FGFR1,
HER1 and HER2.
| Gene | GenBank no. | Oligo type | Oligo sequence | Target size
(bp) |
|---|
| TFRC | NC_000003.12 | Forward |
5′-ACTTCCTCTCTCCCTACGTATC-3′ | 105 |
|
|
| Reverse |
5′-GCAGTTTCAAGTTCTCCAGTAAAG-3′ |
|
| GAPDH | NG_007073.2 | Forward |
5′-CCTCAAGATCATCAGCAATGCCTC-3′ | 100 |
|
|
| Reverse |
5′-GTGGTCATGAGTCCTTCCACGATA-3′ |
|
| FGFR1 | NC_000008.11 | Forward |
5′-AGGCTGTGCTGTTGCACCTA-3′ | 128 |
|
|
| Reverse |
5′-ATCCGGGGCAGTTGCTAGTC-3′ |
|
| HER1 | NG_007726.3 | Forward |
5′-CGGGACGTTTCGTTCTTCGG-3′ | 130 |
|
|
| Reverse |
5′-GAAAGTTGGGAGCGGTTCGG-3′ |
|
| HER2 | NG_007503.1 | Forward |
5′-ATGAGCTACCTGGAGGATGT-3′ | 103 |
|
|
| Reverse |
5′-CCAGCCCGAAGTCTGTAATTT-3′ |
|
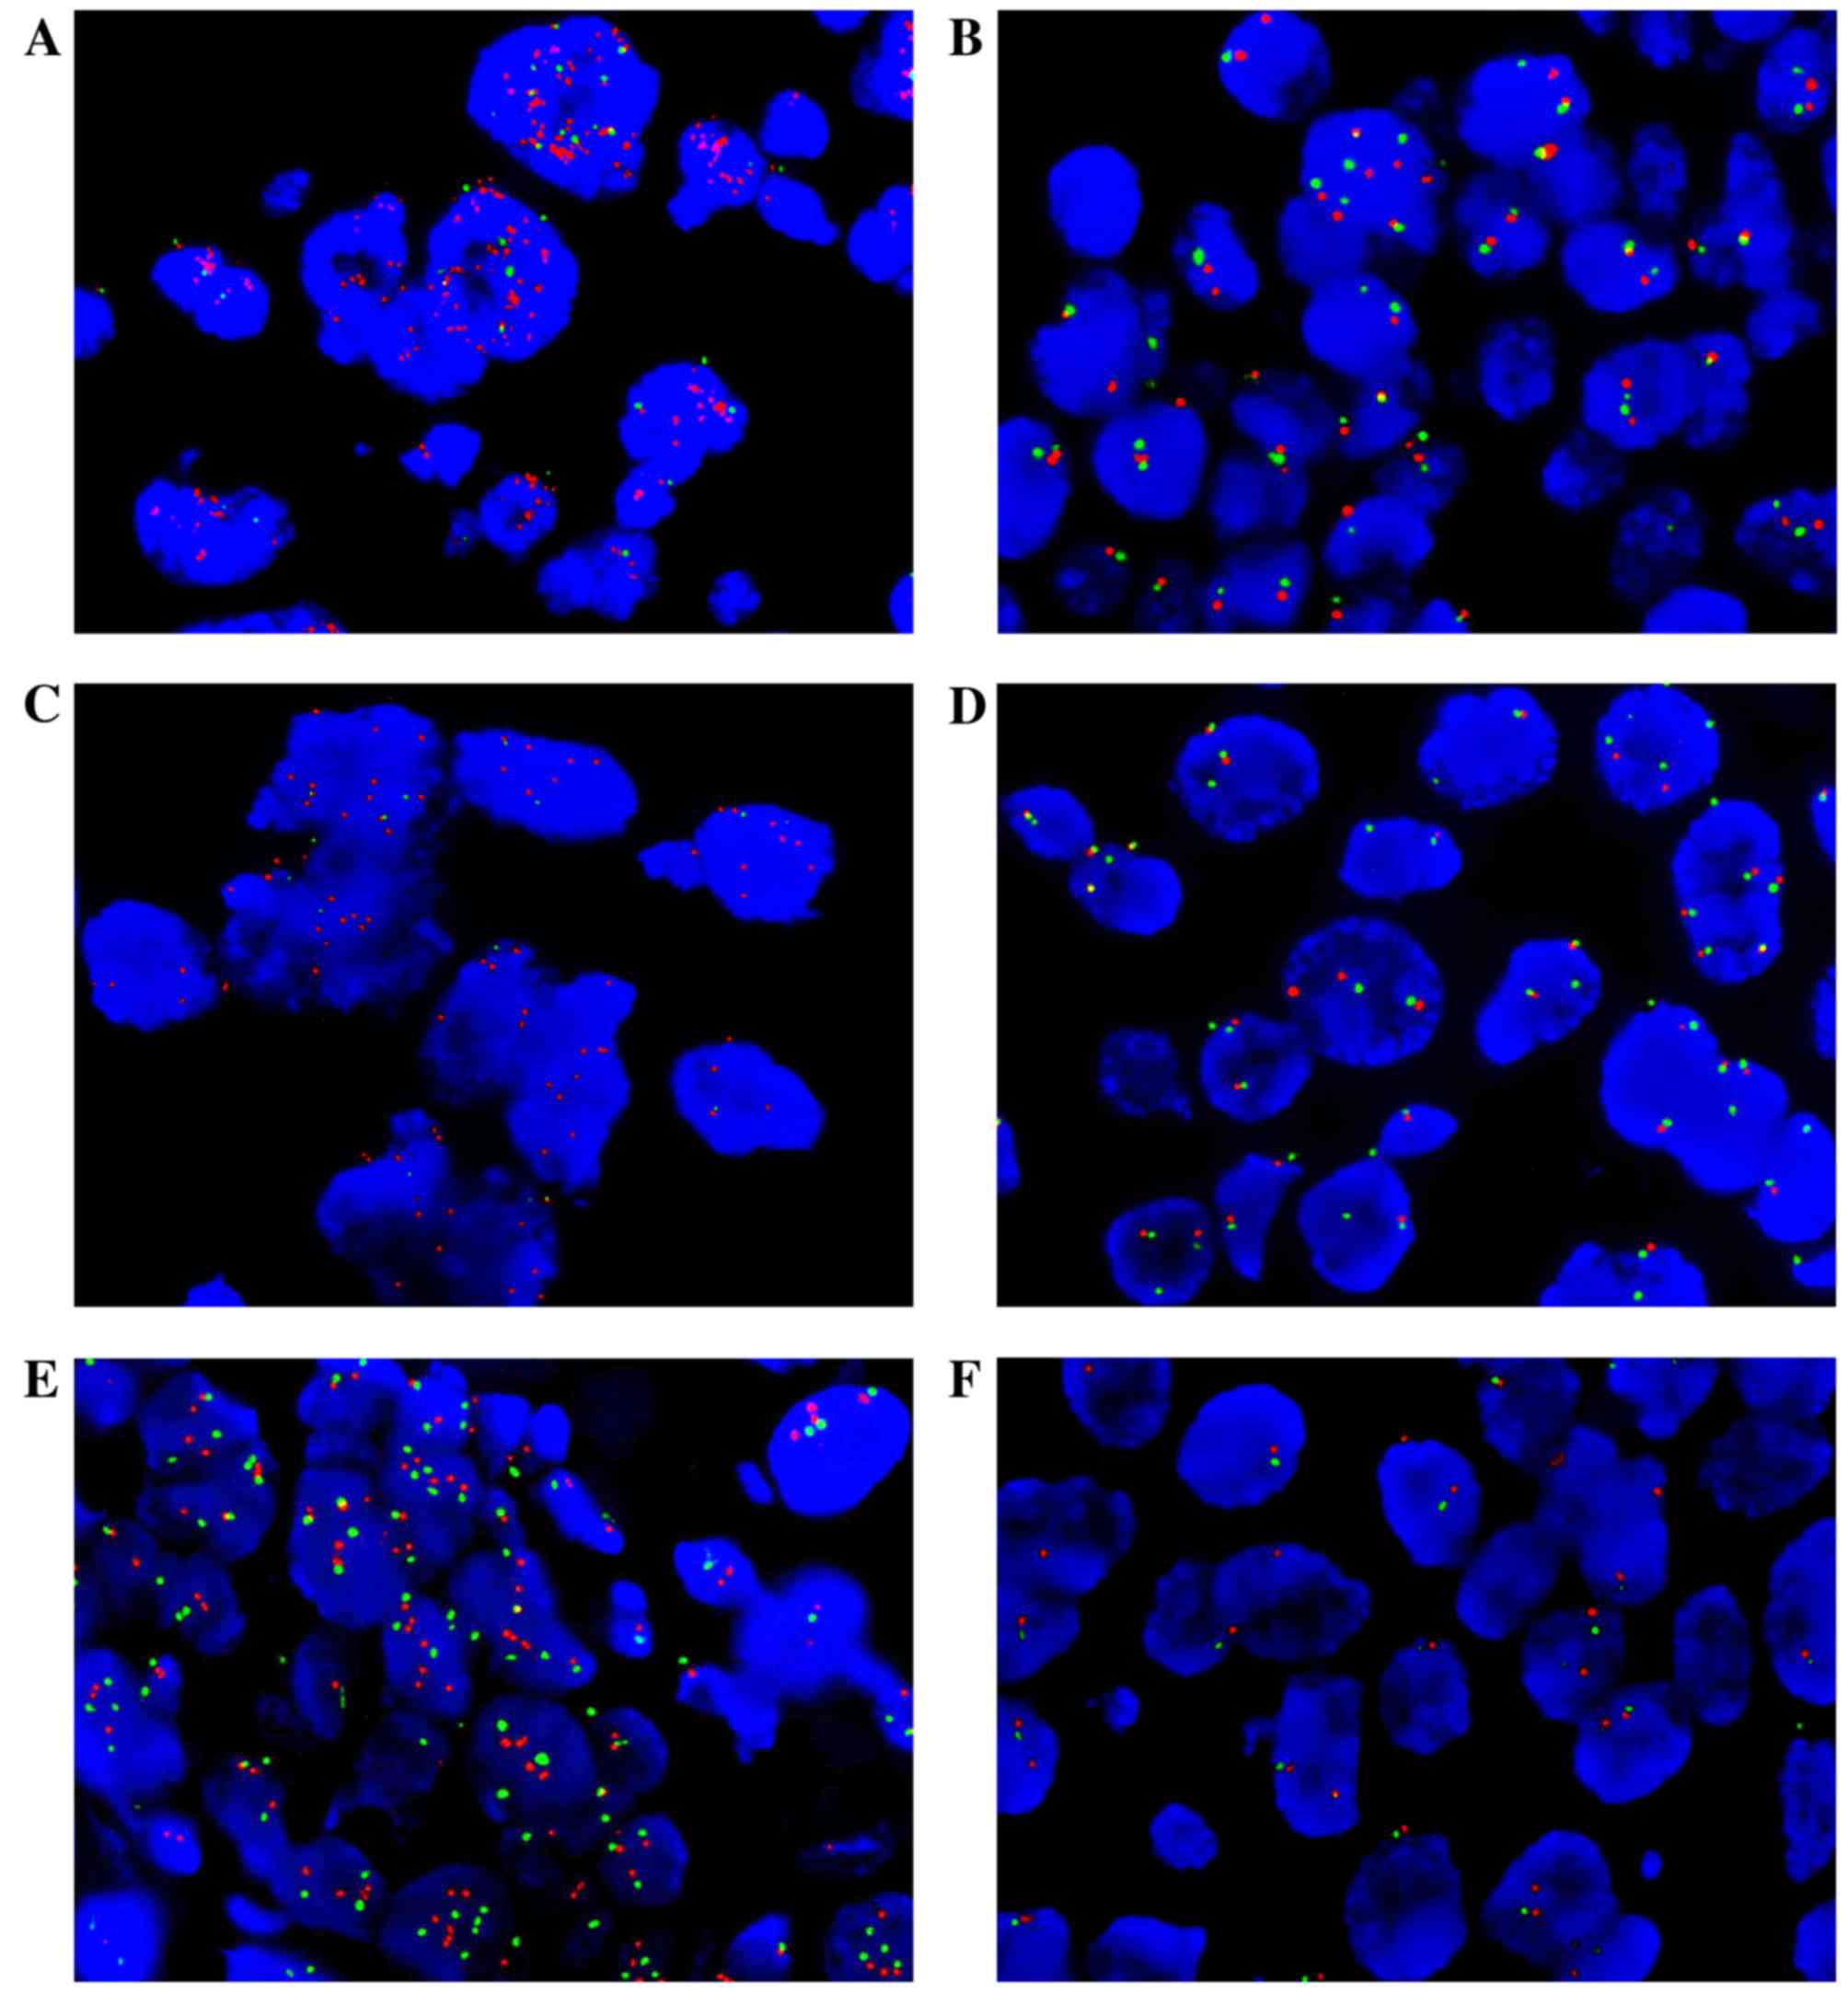
FISH assays
FISH was performed on the tumor tissue samples with
the following commercially available locus-specific and chromosome
enumeration probes: HER1 (EGFR Spectrum Orange) with
centromere 7 (CEP 7 Spectrum Green); HER2 (EGFR Spectrum
Orange) with centromere 17 (CEP 17 Spectrum Green; all from LBP
Medicine Science & Technology, Co., Ltd., Guangzhou, China);
and FGFR1 (Orange) with centromere 8 (CEP 8 Spectrum Green;
Empire Genomics, Buffalo, NY, USA). De-paraffinized 4-mm tumor
sections were heated in antigen retrieval solution (sodium citrate,
pH 6.0) in the microwave for 16 min, then in pepsin solution (LBP
Medicine Science & Technology, Co., Ltd.) for 20 min at 43°C.
The slides were dehydrated with 70, 85 and 100% ethanol. The tissue
sections with probes for EGFR/CEP 7 or HER2/CEP 17 were denatured
in a ThermoBrite hybridization chamber (IRIS International, Inc.,
Norwood, MA, USA) at 85°C for 5 min, followed by 20 h hybridization
at 43°C. The tissue sections with probes for FGFR1/CEP 8
were denatured at 85°C for 5 min, followed by 20 h hybridization at
40°C. Following hybridization, washes were performed according to
the supplier protocols. Slides were counterstained with 0.2 µmol/l
4′,6-diamidino-2-phenylindole in an anti-fade solution, and viewed
with a fluorescence microscope. From each slide, a total of 60
tumor cells were evaluated; the gene and centromere copy number,
and average predominant gene as defined by the mean ratio of the
gene copy number vs. centromere copy number of each slide were
estimated. A oncogene-to-centromere signal ratio ≥2 was considered
to indicate amplification (30,31).
Statistical analysis
Statistical significance was assessed using SPSS
software version 22.0 for Windows (IBM SPSS, Armonk, NY, USA).
P<0.05 was considered to indicated a statistically significant
difference. The association between clinical characteristics and
gene CNV were analyzed using χ2 tests. Kaplan-Meier
survival curves were plotted, and the significance of differences
between survival curves was determined using the log-rank test.
Results
CNV status of FGFR1, HER1 and
HER2
The CNV status of FGFR1, HER1 and HER2
were detected by qPCR and confirmed by FISH analysis for 75
patients with primary IDC (Table II;
Fig. 2). It was demonstrated that
16.0% of the samples exhibited FGFR1 amplification (12 of
75), 26.7% HER1 amplification (20 of 75), 37.3% HER2
amplification (28 of 75), 50.7% HER1/2 amplification
(38 of 75), 8.0% FGFR1 and HER1/2 co-amplification (6
of 75) and 42.7% samples exhibited no amplification (32 of 75). All
samples detected by qPCR were positively confirmed by FISH analysis
(100%).
| Table II.Clinicopathological characteristics
of invasive ductal breast cancer with FGFR1 amplification,
HER1/2 amplification, FGFR1 and HER1/2
co-amplification or no amplification. |
Table II.
Clinicopathological characteristics
of invasive ductal breast cancer with FGFR1 amplification,
HER1/2 amplification, FGFR1 and HER1/2
co-amplification or no amplification.
|
| FGFR1
amplification, n (%) | HER1/2
amplificationa, n
(%) | FGFR1 and HER1/2
co-amplification, n (%) | FGFR1 or HER1/2
amplification, n (%) |
|---|
|
|
|
|
|
|
|---|
| Parameter | + | − | P-value | + | − | P-value | + | − | P-value | + | − | P-value |
|---|
| Total | 12 (16.0) | 63 (84.0) |
| 38 (50.7) | 37 (49.3) |
| 6 (8.0) | 69 (92.0) | – | 43 (57.3) | 32 (42.7) |
|
| Age, years |
|
| 0.223 |
|
| 0.688 |
|
| 0.411 |
|
| 0.304 |
|
≤50 | 6 (50.0) | 43 (68.3) |
| 24 (63.2) | 25 (67.6) |
| 3 (50.0) | 46 (66.7) |
| 17 (39.5) | 9 (28.1) |
|
|
>50 | 6 (50.0) | 20 (31.7) |
| 14 (36.8) | 12 (32.4) |
| 3 (50.0) | 23 (33.3) |
| 26 (60.5) | 23 (71.9) |
|
| Tumor size |
|
| 0.312 |
|
| 0.174 |
|
| 0.495 |
|
| 0.289 |
|
T0-T2 | 12 (100.0) | 58 (92.1) |
| 34 (89.5) | 36 (97.3) |
| 6 (100.0) | 64 (92.8) |
| 39 (90.7) | 31 (96.9) |
|
|
T3-T4 | 0 (0.0) | 5 (7.9) |
| 4 (10.5) | 1 (2.7) |
| 0 (0.0) | 5 (7.2) |
| 4 (9.3) | 1 (3.1) |
|
| Nodal status |
|
| 0.324 |
|
| 0.569 |
|
| 0.274 |
|
| 0.486 |
| N0 | 5 (41.7) | 36 (57.1) |
| 22 (53.7) | 19 (46.3) |
| 2 (33.3) | 39 (56.5) |
| 25 (58.1) | 16 (50.0) |
|
|
N1-N3 | 7 (58.3) | 27 (42.9) |
| 16 (47.1) | 18 (52.9) |
| 4 (66.7) | 30 (43.5) |
| 18 (41.9) | 16 (50.0) |
|
| Menopausal
status |
|
| 0.084 |
|
| 0.289 |
|
| 0.244 |
|
| 0.147 |
|
Menopausal | 8 (66.7) | 25 (39.7) |
| 19 (50.0) | 14 (37.8) |
| 4 (66.7) | 29 (42.0) |
| 22 (51.2) | 11 (34.4) |
|
|
Premenopausal | 4 (33.3) | 38 (60.3) |
| 19 (50.0) | 23 (62.2) |
| 2 (33.3) | 40 (58.0) |
| 21 (48.8) | 21 (65.6) |
|
| Clinical stage |
|
| 0.588 |
|
| 0.188 |
|
| 0.714 |
|
| 0.485 |
|
I–II | 10 (83.3) | 48 (76.2) |
| 27 (71.1) | 31 (83.8) |
| 5 (83.3) | 53 (76.8) |
| 32 (74.4) | 26 (81.3) |
|
|
III–IV | 2 (16.7) | 15 (23.8) |
| 11 (28.9) | 6 (16.2) |
| 1 (16.7) | 16 (23.2) |
| 11 (25.6) | 6 (18.7) |
|
| ER Status |
|
| 0.642 |
|
| 0.007b |
|
| 0.438 |
|
| 0.003b |
|
ER+ | 9 (75.0) | 43 (68.3) |
| 21 (55.3) | 31 (83.8) |
| 5 (83.3) | 47 (68.1) |
| 19 (44.2) | 4 (12.5) |
|
|
ER- | 3 (25.0) | 20 (31.7) |
| 17 (44.7) | 6 (16.2) |
| 1 (16.7) | 22 (31.9) |
| 24 (55.8) | 28 (87.5) |
|
| PR Status |
|
| 0.223 |
|
| 0.063 |
|
| 0.086 |
|
| 0.045b |
|
PR+ | 6 (50.0) | 43 (68.3) |
| 21 (44.7) | 28 (75.7) |
| 2 (33.3) | 47 (68.1) |
| 19 (44.2) | 7 (21.9) |
|
|
PR- | 6 (50.0) | 20 (31.7) |
| 17 (55.3) | 9 (24.3) |
| 4 (66.7) | 22 (31.9) |
| 24 (55.8) | 25 (78.1) |
|
| HER2 |
|
| 0.538 |
|
|
<0.001b |
|
| 0.769 |
|
| 0.001b |
|
0-1+ | 8 (66.7) | 31 (49.2) |
| 15 (39.5) | 24 (64.9) |
| 3 (50.0) | 36 (52.2) |
| 20 (46.5) | 19 (59.4) |
|
| 2+ | 2 (16.7) | 17 (27.0) |
| 6 (15.8) | 13 (35.1) |
| 1 (16.7) | 18 (26.1) |
| 7 (16.3) | 12 (37.5) |
|
| 3+ | 2 (16.7) | 15 (23.8) |
| 17 (44.7) | 0 (0.0) |
| 2 (33.3) | 15 (21.7) |
| 16 (37.2) | 1 (3.1) |
|
| Recurrence |
|
| 0.184 |
|
| 0.157 |
|
| 0.026b |
|
| 0.216 |
|
Yes | 1 (8.3) | 1 (98.4) |
| 2 (5.3) | 0 (0.0) |
| 1 (16.7) | 1 (1.4) |
| 41 (95.3) | 32 (100.0) |
|
| No | 11 (91.7) | 62 (1.6) |
| 36 (94.7) | 37 (100.0) |
| 5 (83.3) | 68 (98.6) |
| 2 (4.7) | 0 (0.0) |
|
| Distant
metastasis |
|
| 0.341 |
|
| 0.051 |
|
| 0.035b |
|
| 0.249 |
|
Yes | 2 (16.7) | 5 (7.9) |
| 6 (15.8) | 1 (2.7) |
| 2 (33.3) | 5 (7.2) |
| 24 (55.8) | 16 (50.0) |
|
| No | 10 (83.3) | 58 (92.1) |
| 32 (84.2) | 36 (97.3) |
| 4 (66.7) | 64 (92.8) |
| 19 (44.2) | 16 (50.0) |
|
Baseline clinical characteristics
A total of 75 patients with primary IDC were
included (Table II). The median age
at diagnosis of IDC was 48.4 years (range, 29–72 years). Patients
were grouped according to the amplification status of FGFR1
or HER1/2. The amplification of HER1/2
was significantly associated with estrogen receptor (P=0.007) and
HER2 (P<0.001) expression status. The frequency of local
recurrence (P=0.026) and distant metastasis (P=0.035) were
significantly higher in the subgroup with FGFR1 and
HER1/2 co-amplification. A total of 5 patients
developed a distant metastasis, of which 1 patient had metastasis
at the time of diagnosis, and 2 patients had distant metastases and
local recurrence simultaneously. There were 5 cases that resulted
in mortality in the entire group; 2 were directly associated with
breast cancer, whereas the other cases were uncertain.
The mean disease-free survival time was 25.7 months
(range, 0–41 months; Table III);
the mean overall survival time was 26.4 months (range, 12–41
months). Tumor size was correlated with disease-free survival time
(P=0.006). Nodal status was significantly associated with
disease-free (P=0.021) and overall (P=0.009) survival times.
Additionally, the clinical stage of the cancer was significantly
associated with overall survival time (P=0.042).
| Table III.Analysis of clinicopathological
characteristics with disease-free and overall survival. |
Table III.
Analysis of clinicopathological
characteristics with disease-free and overall survival.
|
|
| Disease-free
survival | Overall
survival |
|---|
|
|
|
|
|
|---|
| Parameter | n (%) | Log-rank | P-value | Log-rank | P-value |
|---|
| Age, years |
| 0.111 | 0.739 | 1.675 | 0.196 |
|
≤50 | 49 (65.3) |
|
|
|
|
|
>50 | 26 (34.7) |
|
|
|
|
| Tumor size |
| 7.672 | 0.006a | 1.967 | 0.160 |
|
T0-T2 | 70 (93.3) |
|
|
|
|
|
T3-T4 | 5 (6.7) |
|
|
|
|
| Nodal status |
| 5.353 | 0.021a | 6.738 | 0.009a |
| N0 | 41 (54.7) |
|
|
|
|
|
N1-N3 | 34 (45.3) |
|
|
|
|
| Menopausal
status |
| 0.008 | 0.927 | 0.614 | 0.433 |
|
Menopausal | 33 (44.0) |
|
|
|
|
|
Premenopausal | 42 (56.0) |
|
|
|
|
| Clinical stage |
| 1.900 | 0.168 | 4.151 | 0.042a |
|
I–II | 58 (77.3) |
|
|
|
|
|
III–IV | 17 (22.7) |
|
|
|
|
| ER status |
| 0.906 | 0.341 | 0.221 | 0.638 |
|
ER+ | 52 (69.3) |
|
|
|
|
|
ER- | 23 (30.7) |
|
|
|
|
| PR status |
| 1.666 | 0.197 | 1.436 | 0.231 |
|
PR+ | 49 (65.3) |
|
|
|
|
|
PR- | 26 (34.7) |
|
|
|
|
| HER2 |
| 1.827 | 0.401 | 0.883 | 0.643 |
|
0-1+ | 39 (52.0) |
|
|
|
|
| 2+ | 19 (25.3) |
|
|
|
|
| 3+ | 17 (22.7) |
|
|
|
|
| FGFR1
amplification |
| 0.786 | 0.375 | 0.934 | 0.334 |
| + | 12 (16.0) |
|
|
|
|
| − | 63 (84.0) |
|
|
|
|
| HER1/2
amplification |
| 3.628 | 0.057 | 1.908 | 0.167 |
| + | 38 (50.7) |
|
|
|
|
| − | 37 (49.3) |
|
|
|
|
| FGFR1 and
HER1/2 co-amplification |
| 4.136 | 0.042a | 0.394 | 0.530 |
| + | 6 (8.0) |
|
|
|
|
| − | 69 (92.0) |
|
|
|
|
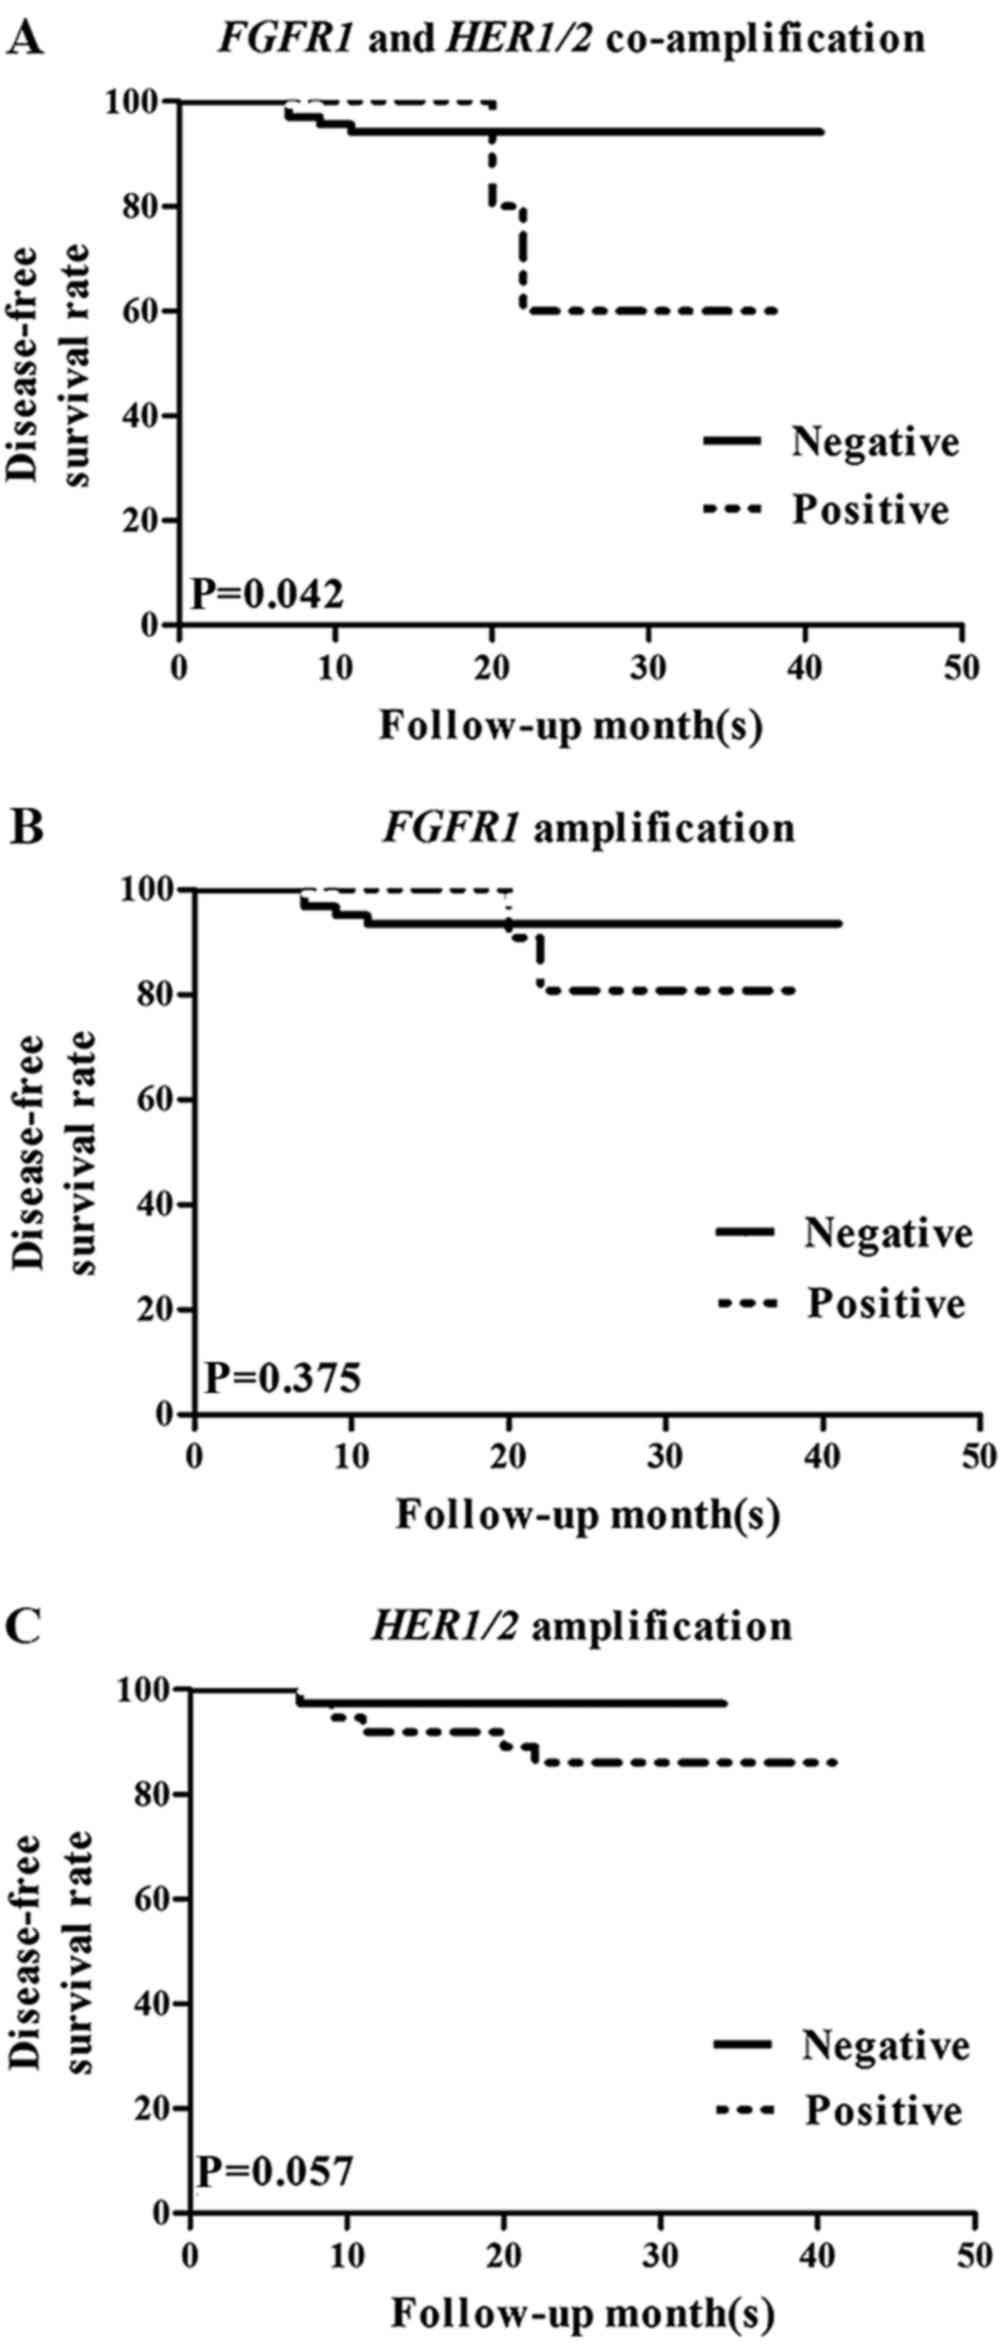
Prognostic significance of FGFR1 and
HER1/2 co-amplification
FGFR1 and HER1/2 co-amplification was
significantly associated with local recurrence and distant
metastasis, as mentioned previously (Table II). To further investigate the
association between FGFR1 and HER1/2 co-amplification
and prognosis, FGFR1 and HER1/2 co-amplification
status was assessed with a Kaplan-Meier analysis (Fig. 3). Based on this analysis, FGFR1
and HER1/2 co-amplification was significantly associated
with reduced disease-free survival time (P=0.042; Fig. 3A). This was true for patients
receiving chemotherapy (P=0.044) or endocrine therapy (P=0.002;
Table IV). However, FGFR1
amplification (Fig. 3B) and
HER1/2 amplification (Fig. 3C)
individually exhibited no significant correlation with disease-free
(P=0.375 and P=0.057, respectively) or overall (P=0.334 and
P=0.167, respectively) survival time (Table III).
| Table IV.Association between treatment
response and FGFR1 and HER1/HER2
co-amplification. |
Table IV.
Association between treatment
response and FGFR1 and HER1/HER2
co-amplification.
|
|
| FGFR1 and
HER1/2 co-amplification, n (%) | Disease-free
survival time |
|---|
|
|
|
|
|
|---|
| Treatment | n | Positive | Negative | Log-rank | P-value |
|---|
| Chemotherapy | 74 | 6 (8.1) | 68 (91.9) | 4.038 | 0.044a |
| Endocrine
therapy | 50 | 6 (12.0) | 44 (88.0) | 9.730 | 0.002a |
Discussion
The present retrospective study aimed to investigate
the association between the CNV of FGFR1, HER1 and
HER2, and the prognosis of patients with IDC. In the present
study, FGFR1 was amplified in 15.6% of samples, and the
amplification rates of HER1 and HER2 were 26.7 and
37.3%, respectively. In other studies, the amplification rates of
FGFR1, HER1 and HER2 have been reported as ~10, ~15
and ~20%, respectively (6,32,33). These
differences may be due to differences in the methods for detection,
classification standards for amplification, or sample sizes between
the studies.
In the present study, the group of patients with
co-amplification of FGFR1 and HER1/2 was
significantly more likely to experience recurrence and distant
metastasis. Co-amplification also influenced disease-free survival
time, with the co-amplification experiencing less favorable
outcomes. No association between prognosis and amplification of
FGFR1 or HER1/2 alone was identified. The data of the
present study contrasted from previous indications that the
amplification of FGFR1 is associated with poor survival time
(20), as FGFR1 amplification
did not affect disease-free or overall survival time in the current
study. The difference may be due to the constitution of the sample;
different types of breast cancer or a different number of patients
may have caused the drift. The amplification of FGFR1 was,
however, associated with menopausal status; the majority of
patients with FGFR1 amplification were menopausal, in
contrast to the patients without FGFR1 amplification.
HER1/2 amplification status was associated with the ER and
HER2 protein expression statuses. This result was consistent with
the view that HER2 amplification is highly associated with
its protein overexpression (6).
In addition, the response to therapy in the
FGFR1 and HER1/2 co-amplification group was
investigated. The data included patients who underwent chemotherapy
and endocrine therapy. The 6 patients who harbored FGFR1 and
HER1/2 co-amplification had poor outcomes following
chemotherapy or endocrine therapy. Insensitivity to therapy may
have caused the group of patients to have unfavorable outcomes.
Accordingly, further study is required to investigate whether, and
how, FGFR1 and HER1/2 co-amplification can influence
tumor resistance to drug therapy.
The amplification of HER1 is not as common in
breast cancer as HER2 amplification, and the effect of
HER1 amplification on patients with breast cancer remains
unclear (34,35). By contrast, HER2 is already a
therapeutic target, and the effect of HER2 amplification for
patients with breast cancer has been confirmed (14,36).
Previously the amplification of FGFR1 has been regarded as
an independent prognostic factor and a potential therapeutic target
in breast cancer, and it may be associated with resistance in
endocrine therapy (25). FGFR1
amplification is rarely exhibited in HER2-amplified tumors
(25); the genes are mutually
exclusive methods for activating similar downstream pathways,
including PI3K/AKT, ERK/MAPK and PKC/PLC (29). Further investigation is required to
study how the co-activation of FGFR and HER1/2 could affect
downstream pathways.
In conclusion, the expression levels of FGFR1,
HER1, HER2 were detected using qPCR and FISH. A specific group
of patients with co-amplification of FGFR1 and HER1/2
was identified to be associated with worse prognosis, and
correlated with resistance to endocrine therapy and chemotherapy.
This finding suggests that the gene statuses of FGFR1, HER1
and HER2 can be predictive of clinical outcome, and that
different therapeutic strategies should be implemented for these
patients in order to improve the prognosis.
Competing interests
The authors declare that they have no competing
interests.
Glossary
Abbreviations
Abbreviations:
|
HER1/2
|
human epidermal growth factor receptor
1 or 2
|
|
FGFR
|
fibroblast growth factor receptor
|
|
IDC
|
invasive ductal breast cancer
|
|
CNV
|
copy number variation
|
|
AKT
|
Akt serine/threonine kinase
|
|
PI3K
|
phosphoinositide-3-kinase
|
|
ERK
|
extracellular signal-regulated
kinase
|
|
MAPK
|
mitogen-activated protein kinase 1
|
|
PKC
|
protein kinase C
|
|
PLC
|
phospholipase C
|
|
qPCR
|
quantitative polymerase chain
reaction
|
|
FISH
|
fluorescence in situ
hybridization
|
|
FFPE
|
formalin-fixed paraffin-embedded
|
References
|
1
|
Chen W, Zheng R, Zeng H, Zhang S and He J:
Annual report on status of cancer in China, 2011. Chin J Cancer
Res. 27:2–12. 2015. View Article : Google Scholar : PubMed/NCBI
|
|
2
|
Gelsi-Boyer V, Orsetti B, Cervera N,
Finetti P, Sircoulomb F, Rougé C, Lasorsa L, Letessier A, Ginestier
C, Monville F M, et al: Comprehensive profiling of 8p11-12
amplification in breast cancer. Mol Cancer Res. 3:655–667. 2005.
View Article : Google Scholar : PubMed/NCBI
|
|
3
|
Cancer Genome Atlas Network: Comprehensive
molecular portraits of human breast tumours. Nature. 490:61–70.
2012. View Article : Google Scholar : PubMed/NCBI
|
|
4
|
Normanno N, Bianco C, Strizzi L, Mancino
M, Maiello MR, De Luca A, Caponigro F and Salomon DS: The ErbB
receptors and their ligands in cancer: An overview. Curr Drug
Targets. 6:243–257. 2005. View Article : Google Scholar : PubMed/NCBI
|
|
5
|
Troyer KL and Lee DC: Regulation of mouse
mammary gland development and tumorigenesis by the ERBB signaling
network. J Mammary Gland Biol Neoplasia. 6:7–21. 2001. View Article : Google Scholar : PubMed/NCBI
|
|
6
|
Slamon DJ, Godolphin W, Jones LA, Holt JA,
Wong SG, Keith DE, Levin WJ, Stuart SG, Udove J, Ullrich A, et al:
Studies of the HER-2/neu proto-oncogene in human breast and ovarian
cancer. Science. 244:707–712. 1989. View Article : Google Scholar : PubMed/NCBI
|
|
7
|
DiGiovanna MP, Stern DF, Edgerton SM,
Whalen SG, Moore D II and Thor AD: Relationship of epidermal growth
factor receptor expression to ErbB-2 signaling activity and
prognosis in breast cancer patients. J Clin Oncol. 23:1152–1160.
2005. View Article : Google Scholar : PubMed/NCBI
|
|
8
|
Wrba F, Reiner A, Ritzinger E, Holzner JH
and Reiner G: Expression of epidermal growth factor receptors
(EGFR) on breast carcinomas in relation to growth fractions,
estrogen receptor status and morphological criteria. An
immunohistochemical study. Pathol Res Pract. 183:25–29. 1988.
View Article : Google Scholar : PubMed/NCBI
|
|
9
|
Suo Z, Risberg B, Kalsson MG, Willman K,
Tierens A, Skovlund E and Nesland JM: EGFR family expression in
breast carcinomas. c-erbB-2 and c-erbB-4 receptors have different
effects on survival. J Pathol. 196:17–25. 2002. View Article : Google Scholar : PubMed/NCBI
|
|
10
|
Nieto Y, Nawaz F, Jones RB, Shpall EJ and
Nawaz S: Prognostic significance of overexpression and
phosphorylation of epidermal growth factor receptor (EGFR) and the
presence of truncated EGFRvIII in locoregionally advanced breast
cancer. J Clin Oncol. 25:4405–4413. 2007. View Article : Google Scholar : PubMed/NCBI
|
|
11
|
Koletsa T, Kotoula V, Karayannopoulou G,
Nenopoulou E, Karkavelas G, Papadimitriou CS and Kostopoulos I:
EGFR expression and activation are common in HER2 positive and
triple-negative breast tumours. Histol Histopathol. 25:1171–1179.
2010.PubMed/NCBI
|
|
12
|
Hwangbo W, Lee JH, Ahn S, Kim S, Park KH,
Kim CH and Kim I: EGFR gene amplification and protein expression in
invasive ductal carcinoma of the breast. Korean J Pathol.
42:107–115. 2013. View Article : Google Scholar
|
|
13
|
Bhargava R, Gerald WL, Li AR, Pan Q, Lal
P, Ladanyi M and Chen B: EGFR gene amplification in breast cancer:
Correlation with epidermal growth factor receptor mRNA and protein
expression and HER-2 status and absence of EGFR-activating
mutations. Mod Pathol. 18:1027–1033. 2005. View Article : Google Scholar : PubMed/NCBI
|
|
14
|
Normanno N, Bianco C, De Luca A, Maiello
MR and Salomon DS: Target-based agents against ErbB receptors and
their ligands: A novel approach to cancer treatment. Endocr Relat
Cancer. 10:1–21. 2003. View Article : Google Scholar : PubMed/NCBI
|
|
15
|
de Azambuja E, Procter MJ, van Veldhuisen
DJ, Agbor-Tarh D, Metzger-Filho O, Steinseifer J, Untch M, Smith
IE, Gianni L, Baselga J, et al: Trastuzumab-associated cardiac
events at 8 years of median follow-up in the Herceptin Adjuvant
trial (BIG 1–01). J Clin Oncol. 32:2159–2165. 2014. View Article : Google Scholar : PubMed/NCBI
|
|
16
|
Graus-Porta D, Beerli RR, Daly JM and
Hynes NE: ErbB-2, the preferred heterodimerization partner of all
ErbB receptors, is a mediator of lateral signaling. EMBO J.
16:1647–1655. 1997. View Article : Google Scholar : PubMed/NCBI
|
|
17
|
Worthylake R, Opresko LK and Wiley HS:
ErbB-2 amplification inhibits down-regulation and induces
constitutive activation of both ErbB-2 and epidermal growth factor
receptors. J Biol Chem. 274:8865–8874. 1999. View Article : Google Scholar : PubMed/NCBI
|
|
18
|
Yarden Y and Sliwkowski MX: Untangling the
ErbB signalling network. Nat Rev Mol Cell Biol. 2:127–137. 2001.
View Article : Google Scholar : PubMed/NCBI
|
|
19
|
Andre F, Job B, Dessen P, Tordai A,
Michiels S, Liedtke C, Richon C, Yan K, Wang B, Vassal G, et al:
Molecular characterization of breast cancer with high-resolution
oligonucleotide comparative genomic hybridization array. Clin
Cancer Res. 15:441–451. 2009. View Article : Google Scholar : PubMed/NCBI
|
|
20
|
Elsheikh Elbauomy S, Green AR, Lambros MB,
Turner NC, Grainge MJ, Powe D, Ellis IO and Reis-Filho JS: FGFR1
amplification in breast carcinomas: A chromogenic in situ
hybridisation analysis. Breast Cancer Res. 9:R232007. View Article : Google Scholar : PubMed/NCBI
|
|
21
|
Reis-Filho JS, Simpson PT, Turner NC,
Lambros MB, Jones C, Mackay A, Grigoriadis A, Sarrio D, Savage K,
Dexter T, et al: FGFR1 emerges as a potential therapeutic target
for lobular breast carcinomas. Clin Cancer Res. 12:6652–6662. 2006.
View Article : Google Scholar : PubMed/NCBI
|
|
22
|
Penault-Llorca F, Bertucci F, Adélaïde J,
Parc P, Coulier F, Jacquemier J, Birnbaum D and deLapeyrière O:
Expression of FGF and FGF receptor genes in human breast cancer.
Int J Cancer. 61:170–176. 1995. View Article : Google Scholar : PubMed/NCBI
|
|
23
|
Neve RM, Chin K, Fridlyand J, Yeh J,
Baehner FL, Fevr T, Clark L, Bayani N, Coppe JP, Tong F, et al: A
collection of breast cancer cell lines for the study of
functionally distinct cancer subtypes. Cancer Cell. 10:515–527.
2006. View Article : Google Scholar : PubMed/NCBI
|
|
24
|
Forozan F, Veldman R, Ammerman CA, Parsa
NZ, Kallioniemi A, Kallioniemi OP and Ethier SP: Molecular
cytogenetic analysis of 11 new breast cancer cell lines. Br J
Cancer. 81:1328–1334. 1999. View Article : Google Scholar : PubMed/NCBI
|
|
25
|
Turner N, Pearson A, Sharpe R, Lambros M,
Geyer F, Lopez-Garcia MA, Natrajan R, Marchio C, Iorns E, Mackay A,
et al: FGFR1 amplification drives endocrine therapy resistance and
is a therapeutic target in breast cancer. Cancer Res. 70:2085–2094.
2010. View Article : Google Scholar : PubMed/NCBI
|
|
26
|
Baird K, Davis S, Antonescu CR, Harper UL,
Walker RL, Chen Y, Glatfelter AA, Duray PH and Meltzer PS: Gene
expression profiling of human sarcomas: Insights into sarcoma
biology. Cancer Res. 65:9226–9235. 2005. View Article : Google Scholar : PubMed/NCBI
|
|
27
|
Tenhagen M, van Diest PJ, Ivanova IA, van
der Wall E and van der Groep P: Fibroblast growth factor receptors
in breast cancer: Expression, downstream effects, and possible drug
targets. Endocr Relat Cancer. 19:R115–R129. 2012. View Article : Google Scholar : PubMed/NCBI
|
|
28
|
Hammond ME, Hayes DF, Wolff AC, Mangu PB
and Temin S: American society of clinical oncology/college of
american pathologists guideline recommendations for
immunohistochemical testing of estrogen and progesterone receptors
in breast cancer. J Oncol Pract. 6:196–197. 2010. View Article : Google Scholar
|
|
29
|
Livak KJ and Schmittgen TD: Analysis of
relative gene expression data using real-time quantitative PCR and
the 2(-Delta Delta C(T)) method. Methods. 25:402–408. 2001.
View Article : Google Scholar : PubMed/NCBI
|
|
30
|
Russell PA, Yu Y, Young RJ, Conron M,
Wainer Z, Alam N, Solomon B and Wright GM: Prevalence, morphology,
and natural history of FGFR1-amplified lung cancer, including
squamous cell carcinoma, detected by FISH and SISH. Mod Pathol.
27:1621–1631. 2014. View Article : Google Scholar : PubMed/NCBI
|
|
31
|
Cihoric N, Savic S, Schneider S, Ackermann
I, Bichsel-Naef M, Schmid RA, Lardinois D, Gugger M, Bubendorf L,
Zlobec I and Tapia C: Prognostic role of FGFR1 amplification in
early-stage non-small cell lung cancer. Br J Cancer. 110:2914–2922.
2014. View Article : Google Scholar : PubMed/NCBI
|
|
32
|
Courjal F, Cuny M, Simony-Lafontaine J,
Louason G, Speiser P, Zeillinger R, Rodriguez C and Theillet C:
Mapping of DNA amplifications at 15 chromosomal localizations in
1875 breast tumors: Definition of phenotypic groups. Cancer Res.
57:4360–4367. 1997.PubMed/NCBI
|
|
33
|
Kersting C, Tidow N, Schmidt H, Liedtke C,
Neumann J, Boecker W, van Diest PJ, Brandt B and Buerger H: Gene
dosage PCR and fluorescence in situ hybridization reveal low
frequency of egfr amplifications despite protein overexpression in
invasive breast carcinoma. Lab Invest. 84:582–587. 2004. View Article : Google Scholar : PubMed/NCBI
|
|
34
|
Bhargava R, Gerald WL, Li AR, Pan Q, Lal
P, Ladanyi M and Chen B: EGFR gene amplification in breast cancer:
Correlation with epidermal growth factor receptor mRNA and protein
expression and HER-2 status and absence of EGFR-activating
mutations. Mod Pathol. 18:1027–1033. 2005. View Article : Google Scholar : PubMed/NCBI
|
|
35
|
Iqbal N and Iqbal N: Human epidermal
growth factor receptor 2 (HER2) in cancers: Overexpression and
therapeutic implications. Mol Biol Int. 2014:8527482014. View Article : Google Scholar : PubMed/NCBI
|
|
36
|
Slamon DJ, Clark GM, Wong SG, Levin WJ,
Ullrich A and McGuire WL: Human breast cancer: Correlation of
relapse and survival with amplification of the HER-2/neu oncogene.
Science. 235:177–182. 1987. View Article : Google Scholar : PubMed/NCBI
|