Introduction
The cancer stem cell (CSC) theory challenges earlier
models concerning the development of cancers by implicating a small
proportion of cells with stem-like properties in the development,
propagation and drug resistance of tumours (1,2). CSCs
display unlimited differentiation potential and an ability to
self-renew, both of which are features required for tumour
initiation and development (2).
Recent studies have suggested that the differentiation and
self-renewal capabilities unique to CSCs may also regulate the
progression and propagation of a tumour, proposing a role for CSCs
in the metastatic spread of cancers (2–5). There is
cumulative evidence to support the CSC theory in the propagation of
leukaemic (blood) and solid (tissue) tumours from CSC of primary
cancers and cancer cell lines of the brain, breast, colon, lung,
prostate, as well as melanoma and glioblastoma (6–12).
Several functional and phenotypic in vitro
assays have been used to identify putative CSC populations. These
include the side population (SP) and ALDEFLUOR assays, the
detection of specific cell surface markers, and the assessment of
the ability of cells to grow as tumourspheres (TS) in suspension
(13–15). The SP assay identifies putative CSCs
based on the high activity of the ATP-binding cassette transporter
protein (ABC)G2, which is also implicated in drug resistance due to
its role in the efflux of chemotherapeutics from the cell (16,17). On
the other hand, the ALDEFLUOR assay identifies CSCs using another
unique CSC marker, aldehyde dehydrogenase (ALDH). The detoxifying
effect of ALDH is thought to protect stem cells against oxidative
damage and may modulate the proliferative capacity of stem cells
(18). As a functional assay, the
generation of three-dimensional spheres using serum-free culture
methods takes advantage of the stem-like nature of CSC by allowing
survival from anoikis and this method has been utilised for the
identification and expansion of CSC populations in vitro
(19) In colon cancer, putative CSCs
have been identified in vitro using a range of the
aforementioned techniques, in particular according to the
expression of the cell surface protein markers, CD44 and CD133, and
to the expression of ALDH and ABCG2 (4,14,19–21).
The most appropriate and accurate method of
identifying of CSCs remains a subject of intense debate,
Furthermore, many researchers remain sceptical as to the role of
this subpopulation in cancer initiation and progression. In
particular, whether or not the presence of CSCs determines the
metastatic potential of the tumour has yet to be fully elucidated
(3).
In this study, we used a paired colon cancer cell
line model derived from a single patient, representative of the
primary tumour (SW480) and its lymph node metastisis (SW620)
(22). As the SW480 and SW620 cell
lines developed from the same genetic background, they provide an
in vitro model to study the cellular changes that occur
during cancer progression and development of a metastatic
phenotype. Our analysis focussed on the comparative in vitro
analysis of putative CSC populations in these paired lines. We
hypothesised that if CSC are responsible for metastasis, then the
SW620 cell line may be enriched in CSC compared to the SW480 cell
line and therefore should be the more chemoresistant of the two
cell lines.
Materials and methods
Adherent cell lines and culture
conditions
Paired human colon adenocarcinoma cell lines SW480
(primary/pre-metastatic tumour; cat. no. 87092801) and SW620 (lymph
node metastasis; cat. no. 87051203) were purchased from the
European Collection of Animal Cell Cultures (Salisbury, UK). SW480
and SW620 cells were maintained in Leibovitz's L-15 medium with
GlutaMAX™-I (Invitrogen; Thermo Fisher Scientific, Inc.,
Waltham, MA, USA), 10% (v/v) fetal bovine serum (Biowest, Nuaillé,
France) and 100 U/ml PSA (Gibco; Invitrogen) at 37°C. Cell lines
used in experiments exhibited passage numbers below 50.
Light and phase contrast
microscopy
Cells and TS were analysed by light microscopy using
an Olympus CKX41 microscope (Olympus Corporation, Tokyo, Japan), or
by phase contrast microscopy using a Zeiss DSZ5000X inverted
microscope (Zeiss AG, Oberkochen, Germany). All images were
analysed using ImageJ software (National Institute of Health,
Bethesda, MD, USA).
Cell adhesion and growth profile
Real-time cell analysis was performed using the
xCELLigence™ System (Roche Applied Science, Rotkreuz,
Swtizerland). SW480 and SW620 cells were seeded at a density of
3×10³ cells per well in 100 µl growth medium in a
96-well E-plate (Roche Applied Science). The E-plate was analysed
over 96 h at 37°C using RTCA 1.2.1 software (ACEA Biosciences, San
Diego, CA, USA), collecting data from one sweep/h. An increase in
cells on the gold electrodes of the well surface was detected by
changes in the electrical impedance, producing the cell index (CI)
output in relation to the impedance at the beginning of the
experiment. An unchanged CI output therefore suggests no change in
the number (or size) of cells, while increases in CI output over
time are indicative of cell growth/proliferation.
Wound healing assay
SW480 and SW620 cells were seeded into untreated
96-well plates (at a density of 1×10⁶ cells/ml) or
plates pre-treated with 1 µg/ml type I collagen or 5 µg/ml
fibronectin (Sigma-Aldrich; Merck KGaA, Darmstadt, Germany) and
allowed to adhere overnight at 37°C. Wounds to each well were
created by the removal of a section of the confluent cell monolayer
using a sterile toothpick and changes in the wound size analysed at
intervals over 24 h. Images were taken at 0, 4, 8, 12 and 24 h
after creating the wound using a Zeiss DSZ5000X inverted
microscope. The change in wound area (%) relative to the start of
the assay (0 h) was calculated for each time point using ImageJ
software (National Institute of Health).
Hoechst efflux assay
The experimental procedure used by Goodell and
colleagues was used for the development of the optimised Hoechst
33342 dye exclusion assay (23). The
SP is characterised as being negative for both Hoechst blue
(Hblue−) and Hoechst red (Hred) staining.
This Hblue−/Hred−SP was identified by
comparing the signals (% of cells with that phenotype) obtained
with or without treatment with verapamil, an inhibitor of the ABCG2
transporter protein that prevents the efflux of Hoechst 33342.
Cells were treated in 75 cm3 flasks with 5 µg/ml Hoechst
33342 alone or a combination of 5 µg/ml Hoechst 33342 (Invitrogen)
and 50 µM verapamil (Sigma-Aldrich; Merck KGaA) for 1 h at 37°C.
Cells were harvested by centrifugation (300 × g for 8 min) and
resuspended in PBS (1×10⁶ cells/ml) containing 2 µg/ml
PI (Sigma-Aldrich; Merck KGaA) for live/dead cell discrimination.
The SP of putative CSC was detected using the FACSAria II (BD
Biosciences, Erembodegem, Belgium). The Hoechst 33342 dye was
excited at 350 nm and the dual emission of Hoechst blue and Hoechst
red analysed at 405/30 and 670/40 nm, respectively. Data were
analysed with FlowJo software (version 7.6.5; Tree Star, Inc.,
Ashland, OR, USA).
ALDEFLUOR® assay
Cell populations with high ALDH enzyme activity were
identified by flow cytometry using the ALDEFLUOR® kit
(#01700; Stemcell Technologies, Inc., Vancouver, BC, Canada), in
which the fluorescent substrate of ALDH, ALDEFLUOR, is cleaved
intracellularly by active ALDH to produce a fluorescent product.
The assay was carried out as per the manufacturer's instructions.
Briefly, cells were resuspended at a density of 1×10⁶
cells/ml in ALDEFLUOR® assay buffer. Activated ALDEFLUOR
reagent (150 µM) was added to each sample and 5×10⁵
cells from each sample were treated with 150 µM ALDH inhibitor,
diethylaminobenzaldehyde (DEAB), as the inhibited control used to
identify the ALDHhigh population. Comparing
ALDEFLUOR-stained cells with stained cells treated with DEAB, the
percentage of ALDHhigh cells was calculated based on the
loss of ALDH activity [% cells ALDHhigh = (%
FITChigh cells without DEAB) - (% FITChigh
cells with DEAB)]. Staining was carried out at 37°C for 45 min and
samples were analysed using the FACSAria II flow cytometer (BD
Biosciences), with excitation at 488 nm and emission detected in
the 530/30 nm filter channel. Data were analysed using FlowJo
software (version 7.6.5; Tree Star, Inc.).
Flow cytometric analysis of CSC
markers
Cells were lifted using 1% (w/v) EDTA, centrifuged
(800 x g for 2 min) and resuspended in PBS (5×10⁵
cells/ml) containing 0.25 µg of allophycocyanin (APC),
phycoerythrin (PE) or FITC directly conjugated antibodies
(anti-CD44 APC, anti-CD24 FITC anti-ABCG2 PE and anti-integrin α6
APC (eBioscience, Inc., San Diego, CA, USA), and anti-CD133 PE
(Miltenyi Biotec GmbH, Bergisch Gladbach, Germany), or used as
unstained controls. Isotype controls (mouse IgG2b PE, Rat IgG2b
APC, mouse IgG1 FITC, mouse IgG1 PE; eBioscience, Inc.) were used
to account for any non-specific antibody binding to live cells by
establishing a gating threshold (limit 0.5%) according to
fluorescence intensity and calculated compensation. All antibodies
were used at a 1:400 dilution (0.25 µg) and samples were incubated
at 4°C for 1 h before harvesting of cells for analysis). The
FACSAria II flow cytometer was used to record 50,000 events prior
to analysis using FlowJo software. The APC fluorophore was excited
at 633 nm and emission recorded in the 620/20 filter channel. Both
the FITC and the PE fluorophores were excited at 488 nm and
emission recorded in the 530/30 or 585/42 filter channels,
respectively. Compensation controls were used to establish values
for fluorescent overlap.
Culture of TS
The ability of colon cancer cells to form TS under
anchorage-independent conditions was analysed for 14 days using a
protocol adapted from that of Dontu et al as well as Kreso
and O'Brien (24,25). Cells were harvested, filtered and
resuspended as a single-cell suspension in conditioned medium to a
density of 2×10⁴ cells/ml. TS were maintained in medium
(DMEM) with 1× B-27 supplement (Gibco; Invitrogen), 20 ng/ml basic
fibroblast growth factor (bFGF; Thermo Fisher Scientific, Inc.), 20
ng/ml epidermal growth factor (EGF; Sigma-Aldrich; Merck KGaA), 5
µg/ml insulin (Novorapid; Novo Nordisk A/S, Bagsværd, Denmark), 10
µg/ml heparin (Sigma-Aldrich; Merck KGaA) and 100 U/ml PSA (Gibco)
in ultra-low attachment culture flasks and/or multiwell plates
(Corning Incorporated, Pittsburgh, PA, USA). Sphere-forming
efficiency (SFE) was quantified per number of cells seeded and
expressed as a percentage.
Cell cycle analysis
Cells were seeded (2×10⁴ cells/ml) in 25
cm3 flasks for TS culture over 5 days, and overnight for
adherent conditions. Cells were lifted with Accutase™
(Invitrogen) pelleted at 1,600 x g and fixed with 70% (v/v)
ethanol before harvesting and staining for 40 min at 37°C in PI
solution [50 µg/ml PI, 100 µg/ml RNAse A, 0.05% (v/v) Triton X-100;
Sigma-Aldrich; Merck KGaA]. Doublet discrimination was carried out
to eliminate false positive results arising from aggregated
cells.
Fluorescence microscopy
Cells seeded on coverslips coated with 5 µg/ml
fibronectin were fixed in methanol and incubated with anti-heat
shock protein 90 (Hsp90)α/β antibody (sc-13119; Santa Cruz
Biotechnology, Inc., Dallas, TX, USA; used at 1:100 dilution)
overnight at 4°C, followed by incubation with donkey anti-mouse
Alexa Fluor-488 secary antibody (A21202; Thermo Fischer Scientific,
Inc., used at 1:500 dilution) for 1 h. Nuclear staining was carried
out using 1 µg/ml Hoechst 33342 (Invitrogen). Images were taken
using a Zeiss AxioVert.A1 Fluorescence LED inverted microscope with
a high resolution AxioCam MRm Rev 3, and analysed with ZEN Lite
2012 1.1.2.0 software (Zeiss AG).
SDS-PAGE and western blot
analysis
Cell lysates were resuspended to equal total protein
concentrations as determined by a NanoDrop 2000 spectrophotometer
(Thermo Fischer Scientific, Inc.) Proteins resolved by SDS-PAGE
gels were transferred onto Hybond Supported Nitrocellulose
membranes (GE Healthcare Life Sciences, Chalfont, UK) membrane.
Hsp90 was detected by chemiluminescence using the ECL Advanced
Western Blotting kit (GE Healthcare Life Sciences), after
incubation with a horseradish peroxidise-conjugated donkey
anti-mouse secondary antibody, using the Chemidoc™ EQ
system (Bio-Rad Laboratories, Inc., Hercules, CA, USA). Images were
analysed using ImageJ software. Anti-Histone H3 (#9715; used at
1:2,500 dilution) and anti-Hsp90α/β (sc-13119; used at 1:1,000
dilution) antibodies were purchased from Cell Signaling Technology,
Inc. (Danvers, MA, USA) and Santa Cruz Biotechnology, Inc.,
respectively.
Viability studies with anti-cancer
drugs
The viability of 3×10³ cells/well
(adherent) and 1×10³ cells/well (TS) in a 96-well plate
were assessed following treatment with GA, NOV, 5-fluorouracil
(5-FU) or oxaliplatin (Sigma-Aldrich; Merck KGaA) at increasing
concentrations in comparison to untreated or DMSO (vehicle
control). After the addition of 10 µl/well WST-1 proliferation
reagent (Roche Applied Science) and incubation for 3 h, the
absorbance at 440 nm was measured using a PowerWave
spectrophotometer (BioTek Instruments, Inc., Winooski, VT, USA).
The concentration at which a chemotherapeutic agent effectively
altered cell viability by 50% (EC50) for each cell line
was calculated in GraphPad Prism 4.03 software (GraphPad Software,
Inc., La Jolla, CA, USA) using non-linear regression.
Statistical analysis
The statistical analyses of data were performed
using GraphPad Prism 4.03 software (GraphPad Software, Inc.). Using
two-way ANOVA, Mann Whitney and t-test (as indicated in the figure
legends), data were assessed for statistical significance, where
P<0.05 was deemed the minimum statistical significance upon
comparison of samples.
Results
Comparison of biological
characteristics of the paired SW480 and SW620 cancer cell
lines
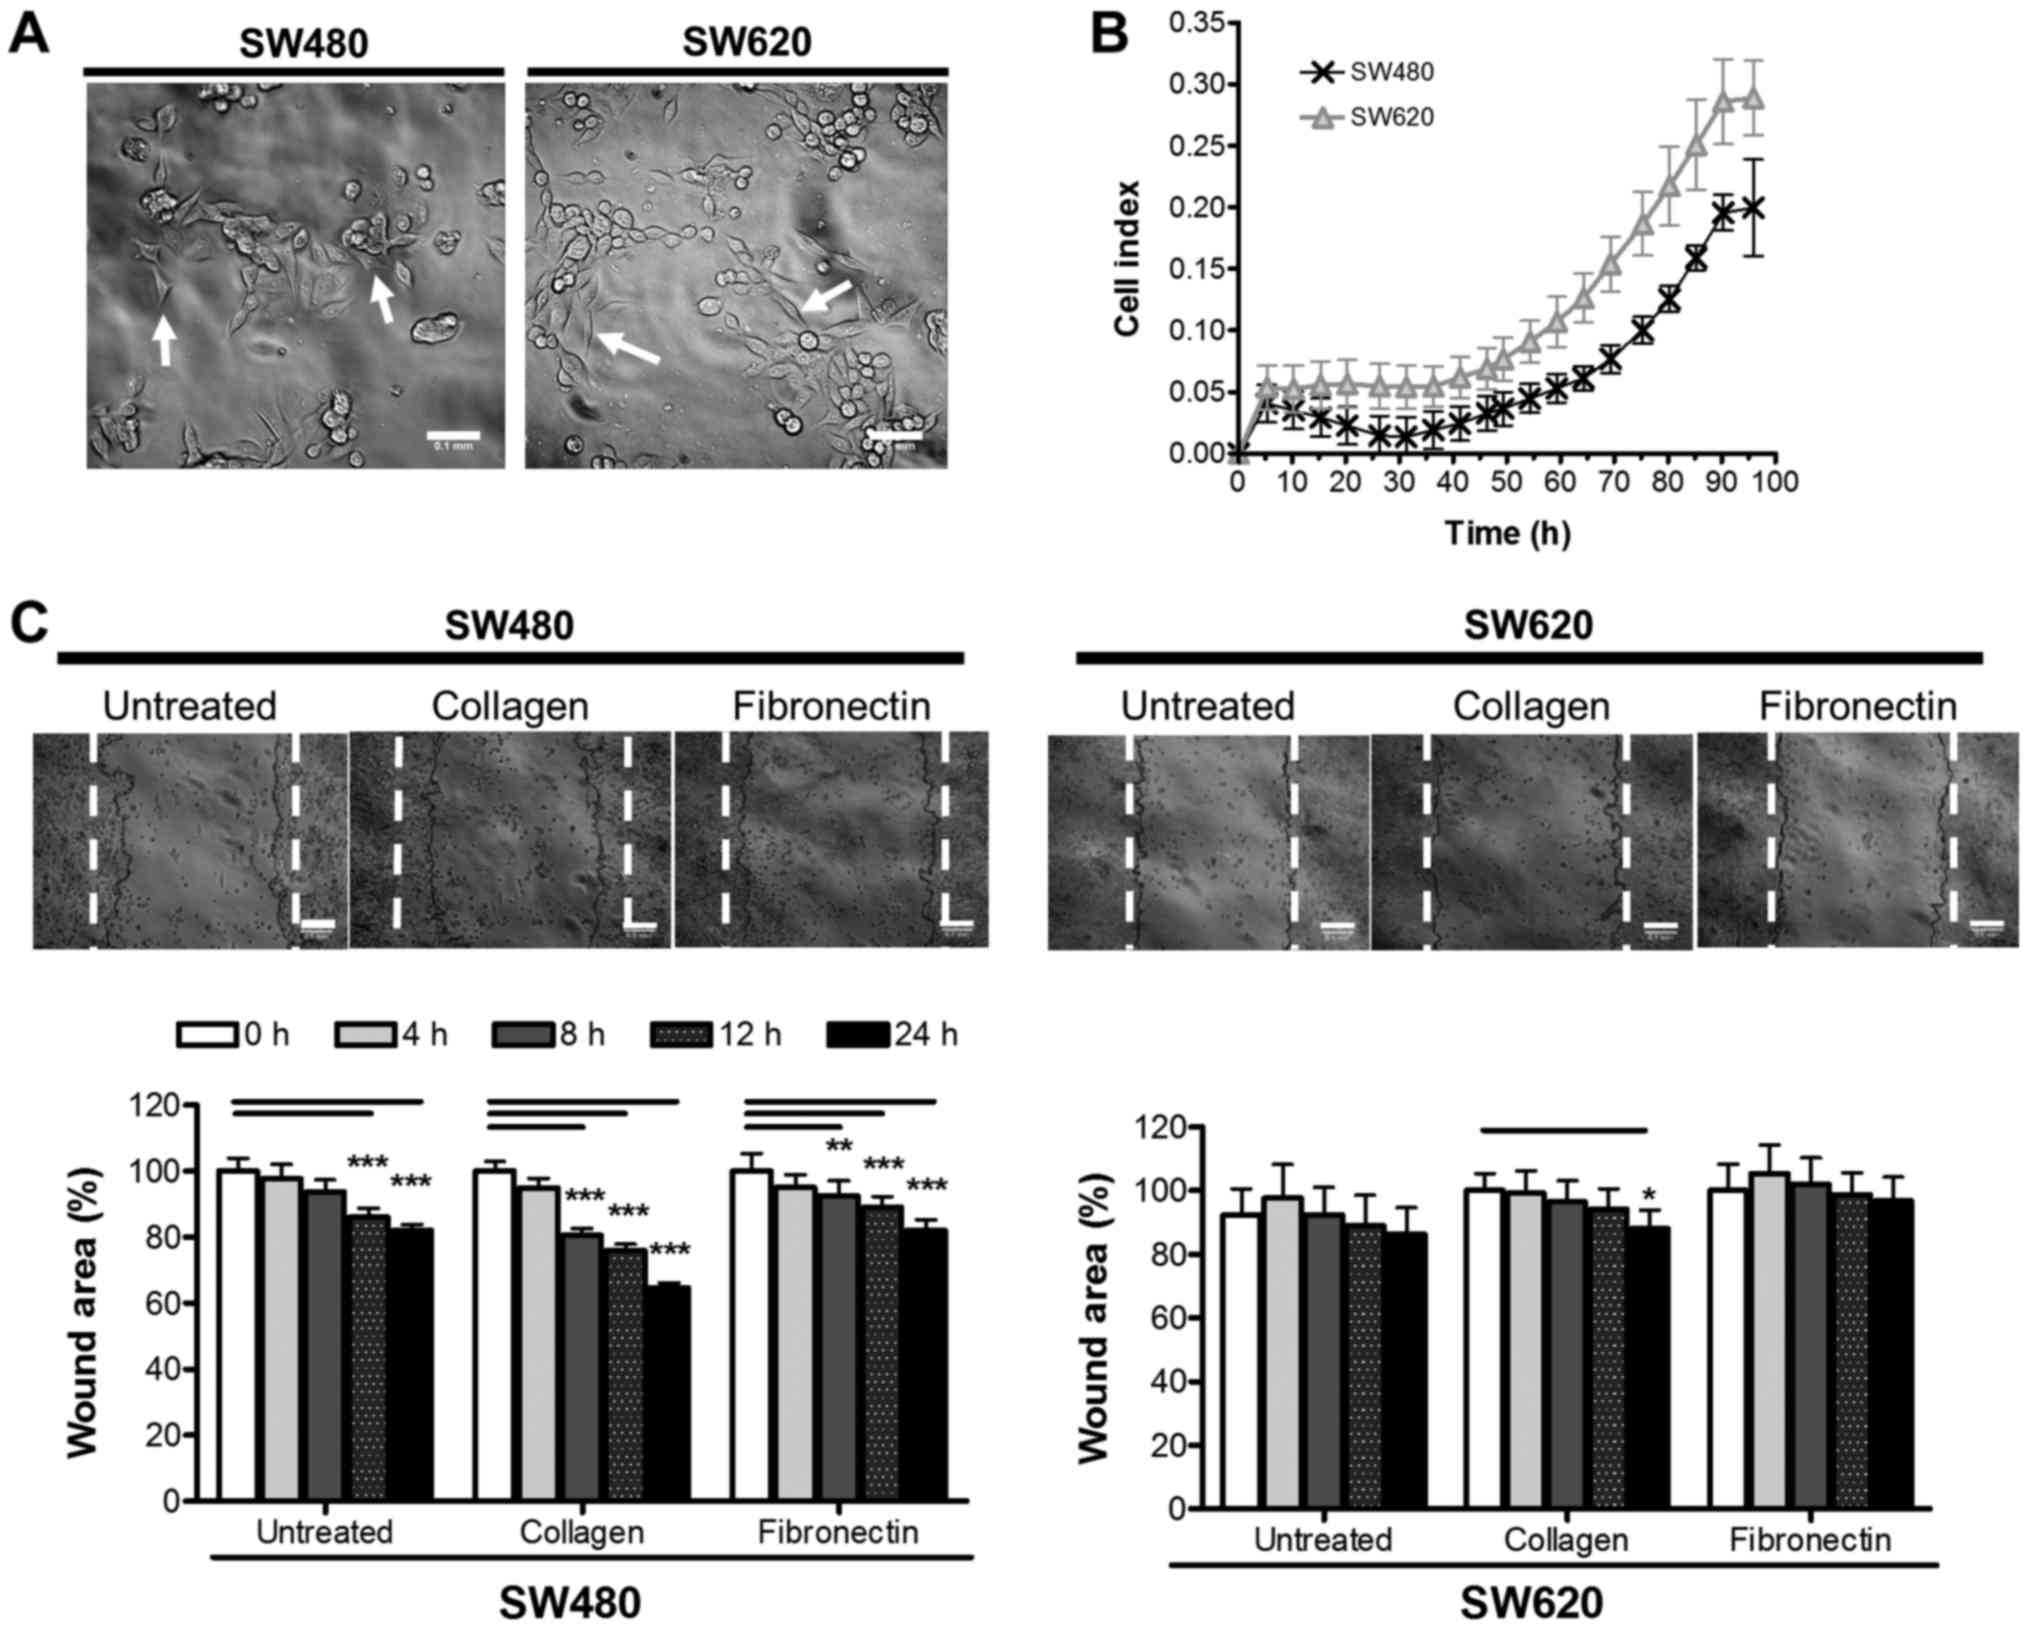
The morphology of SW480 and SW620 cells were
analysed by phase contrast microscopy to reveal two cell
morphologies (Fig. 1A). The SW480
cell line showed small groupings of irregular-shaped cells (80% of
fully adhered cells were irregular in shape, with only 20%
representing a more spindle-like morphology), in comparison to the
small spindle-like shape of the SW620 cells (53% of fully adhered
cells were of a traditional, elongated spindle-shape, while the
remaining 47% were either more rounded spindles or irregular in
shape). These morphologies are similar to those reported previously
in literature (22). SW480 and SW620
cells were next compared in terms of cell growth. Using
xCELLigence™, the adhesion and growth of SW480 and SW620
cells over 96 h was followed in real time (Fig. 1B) and assessed based on the reported
CI. CI values for the SW620 cells were significantly higher overall
than that of the SW480 cells. The higher CI values may reflect the
different morphologies of the cells observed, since this value is
based on the extent to which the growth surface is covered by the
cell monolayer causing electrical impedance on the electrode, and
will thus logically be affected by not only the number of cells but
also their size and shape (Fig. 1A).
Nonetheless, the two cell lines appeared to display similar growth
rates as indicated by the similarity in the shapes of the
respective curves (Fig. 1B). This
data was supported by an assessment of SW480 and SW620 cells for
metabolic activity as a measure of proliferation over 96 h by WST-1
assay, further indicating a similar growth trend between cell lines
(data not shown).
A wound healing assay was used to compare the
migratory potential of the SW480 and SW620 cells in vitro
and to investigate the effect of different matrices (collagen and
fibronectin) on migration of the cells (Fig. 1C). Our data revealed that, overall,
SW480 cells have a significantly higher migratory potential than
SW620 cells. Furthermore, we report that, in the absence of
additional extracellular matrix proteins, limited migration was
observed, particularly for SW620 cells, after the 24 h assay period
(SW480, 17.94±4.50%; SW620, 10.01±12.96% decrease in wound area;
Fig. 1C). Collagen produced the most
significant effect on migration in both SW480 and SW620 cells, from
as early as 8 h in the SW480 cells (35.23±5.84 and 12.02±3.64%
wound closure in SW480 and SW620 cells, respectively; after 24 h,
while fibronectin significantly stimulated migration only in the
SW480 and not SW620 cells (19.67±4.96 and 6.05±5.24%, respectively)
(Fig. 1C).
Comparison of putative cancer
stem-like cell populations in the SW480 and SW620 cell lines in
vitro
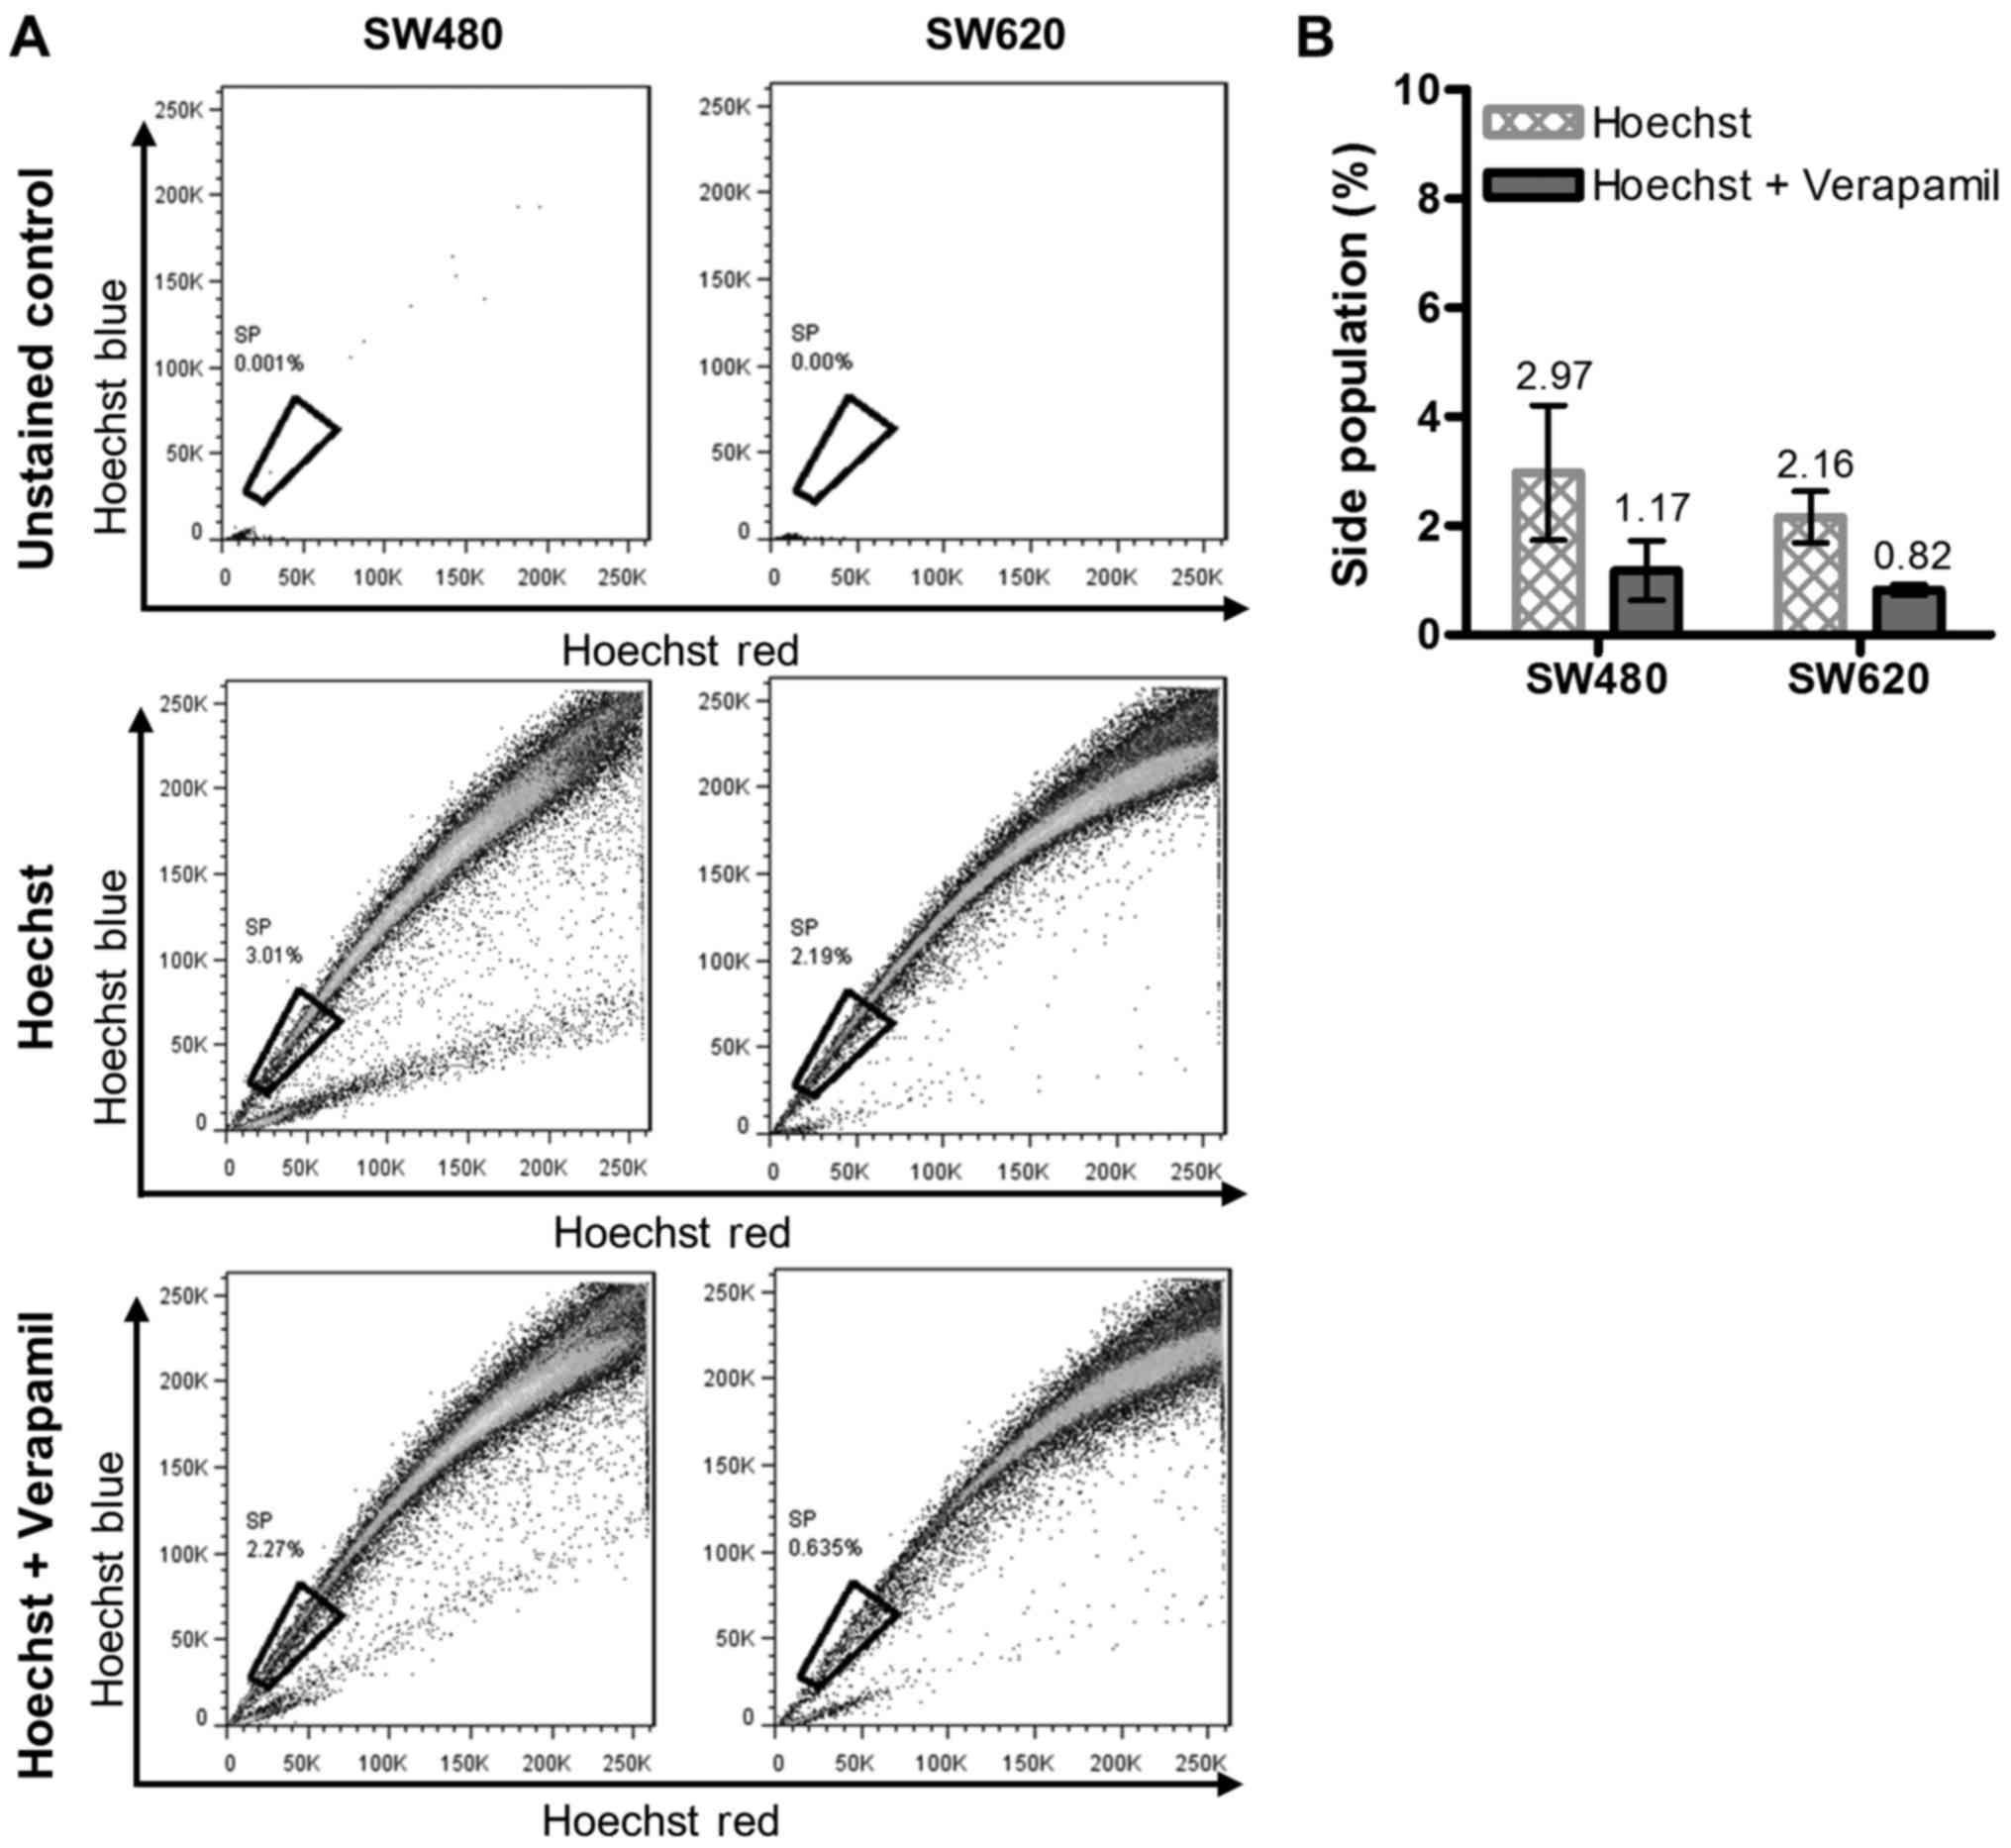
In this study, the presence of putative CSCs was
investigated in vitro by analysis of the SP, expression of
active ALDH and levels of putative CSC surface protein markers.
Given that the SW620 cell line is a metastasis of the primary SW480
cell line, we hypothesised that the SW620 cells may be enriched in
CSC-like cells. Hoechst 33342 stained cells treated with or without
verapamil were compared with unstained uninhibited (control) cells
to determine the proportion of the SP (Fig. 2A). The average results obtained from
three independent analyses indicated that there was no significant
difference between the sizes of the SP detected within the SW480
and SW620 cell lines (SP of 1.80 and 1.34%, respectively, Fig. 2B).
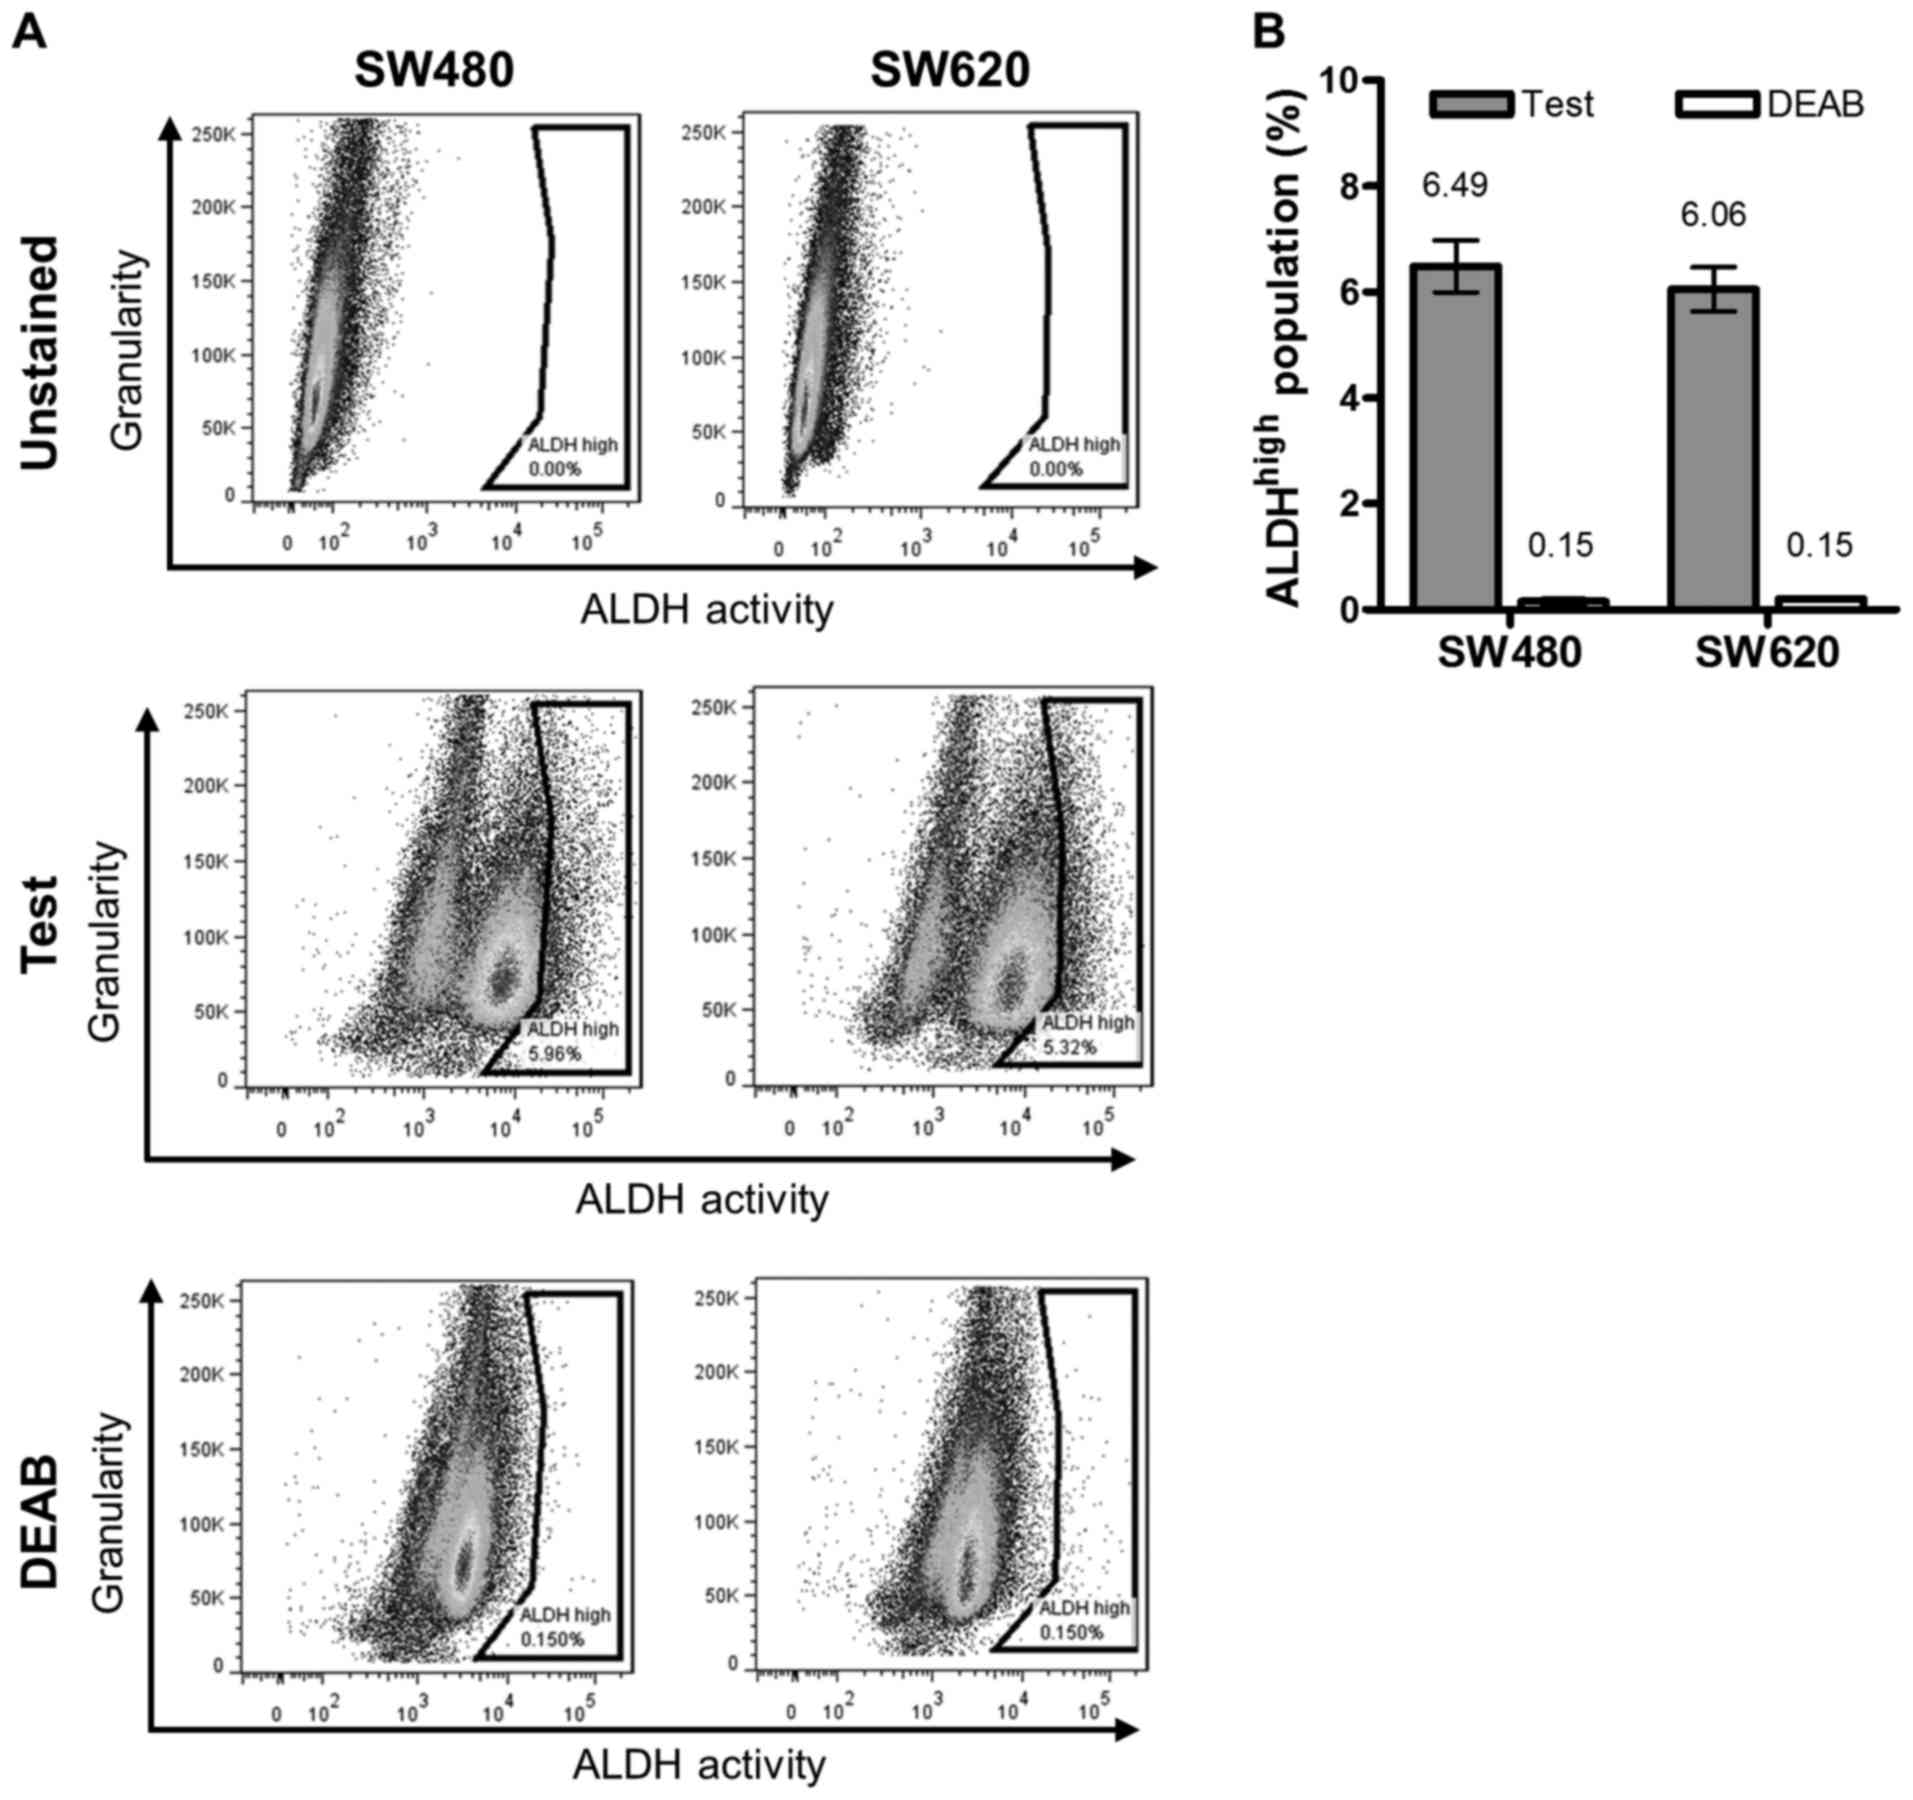
We next compared the proportion of putative CSC
between the two lines according to the levels of active ALDH, using
the ALDEFLUOR® assay (Fig.
3). The ALDHhigh population. was quantified as the
difference in the subpopulation (%) of intensely stained cells
(indicated in the gate to the far right of the histograms) between
samples with or without DEAB treatment (Fig. 3A). Our data revealed no significant
difference in this population between the cell lines (average
ALDHhigh population of SW480 and SW620 cells: 6.49 and
6.06%, respectively (Fig. 3B).
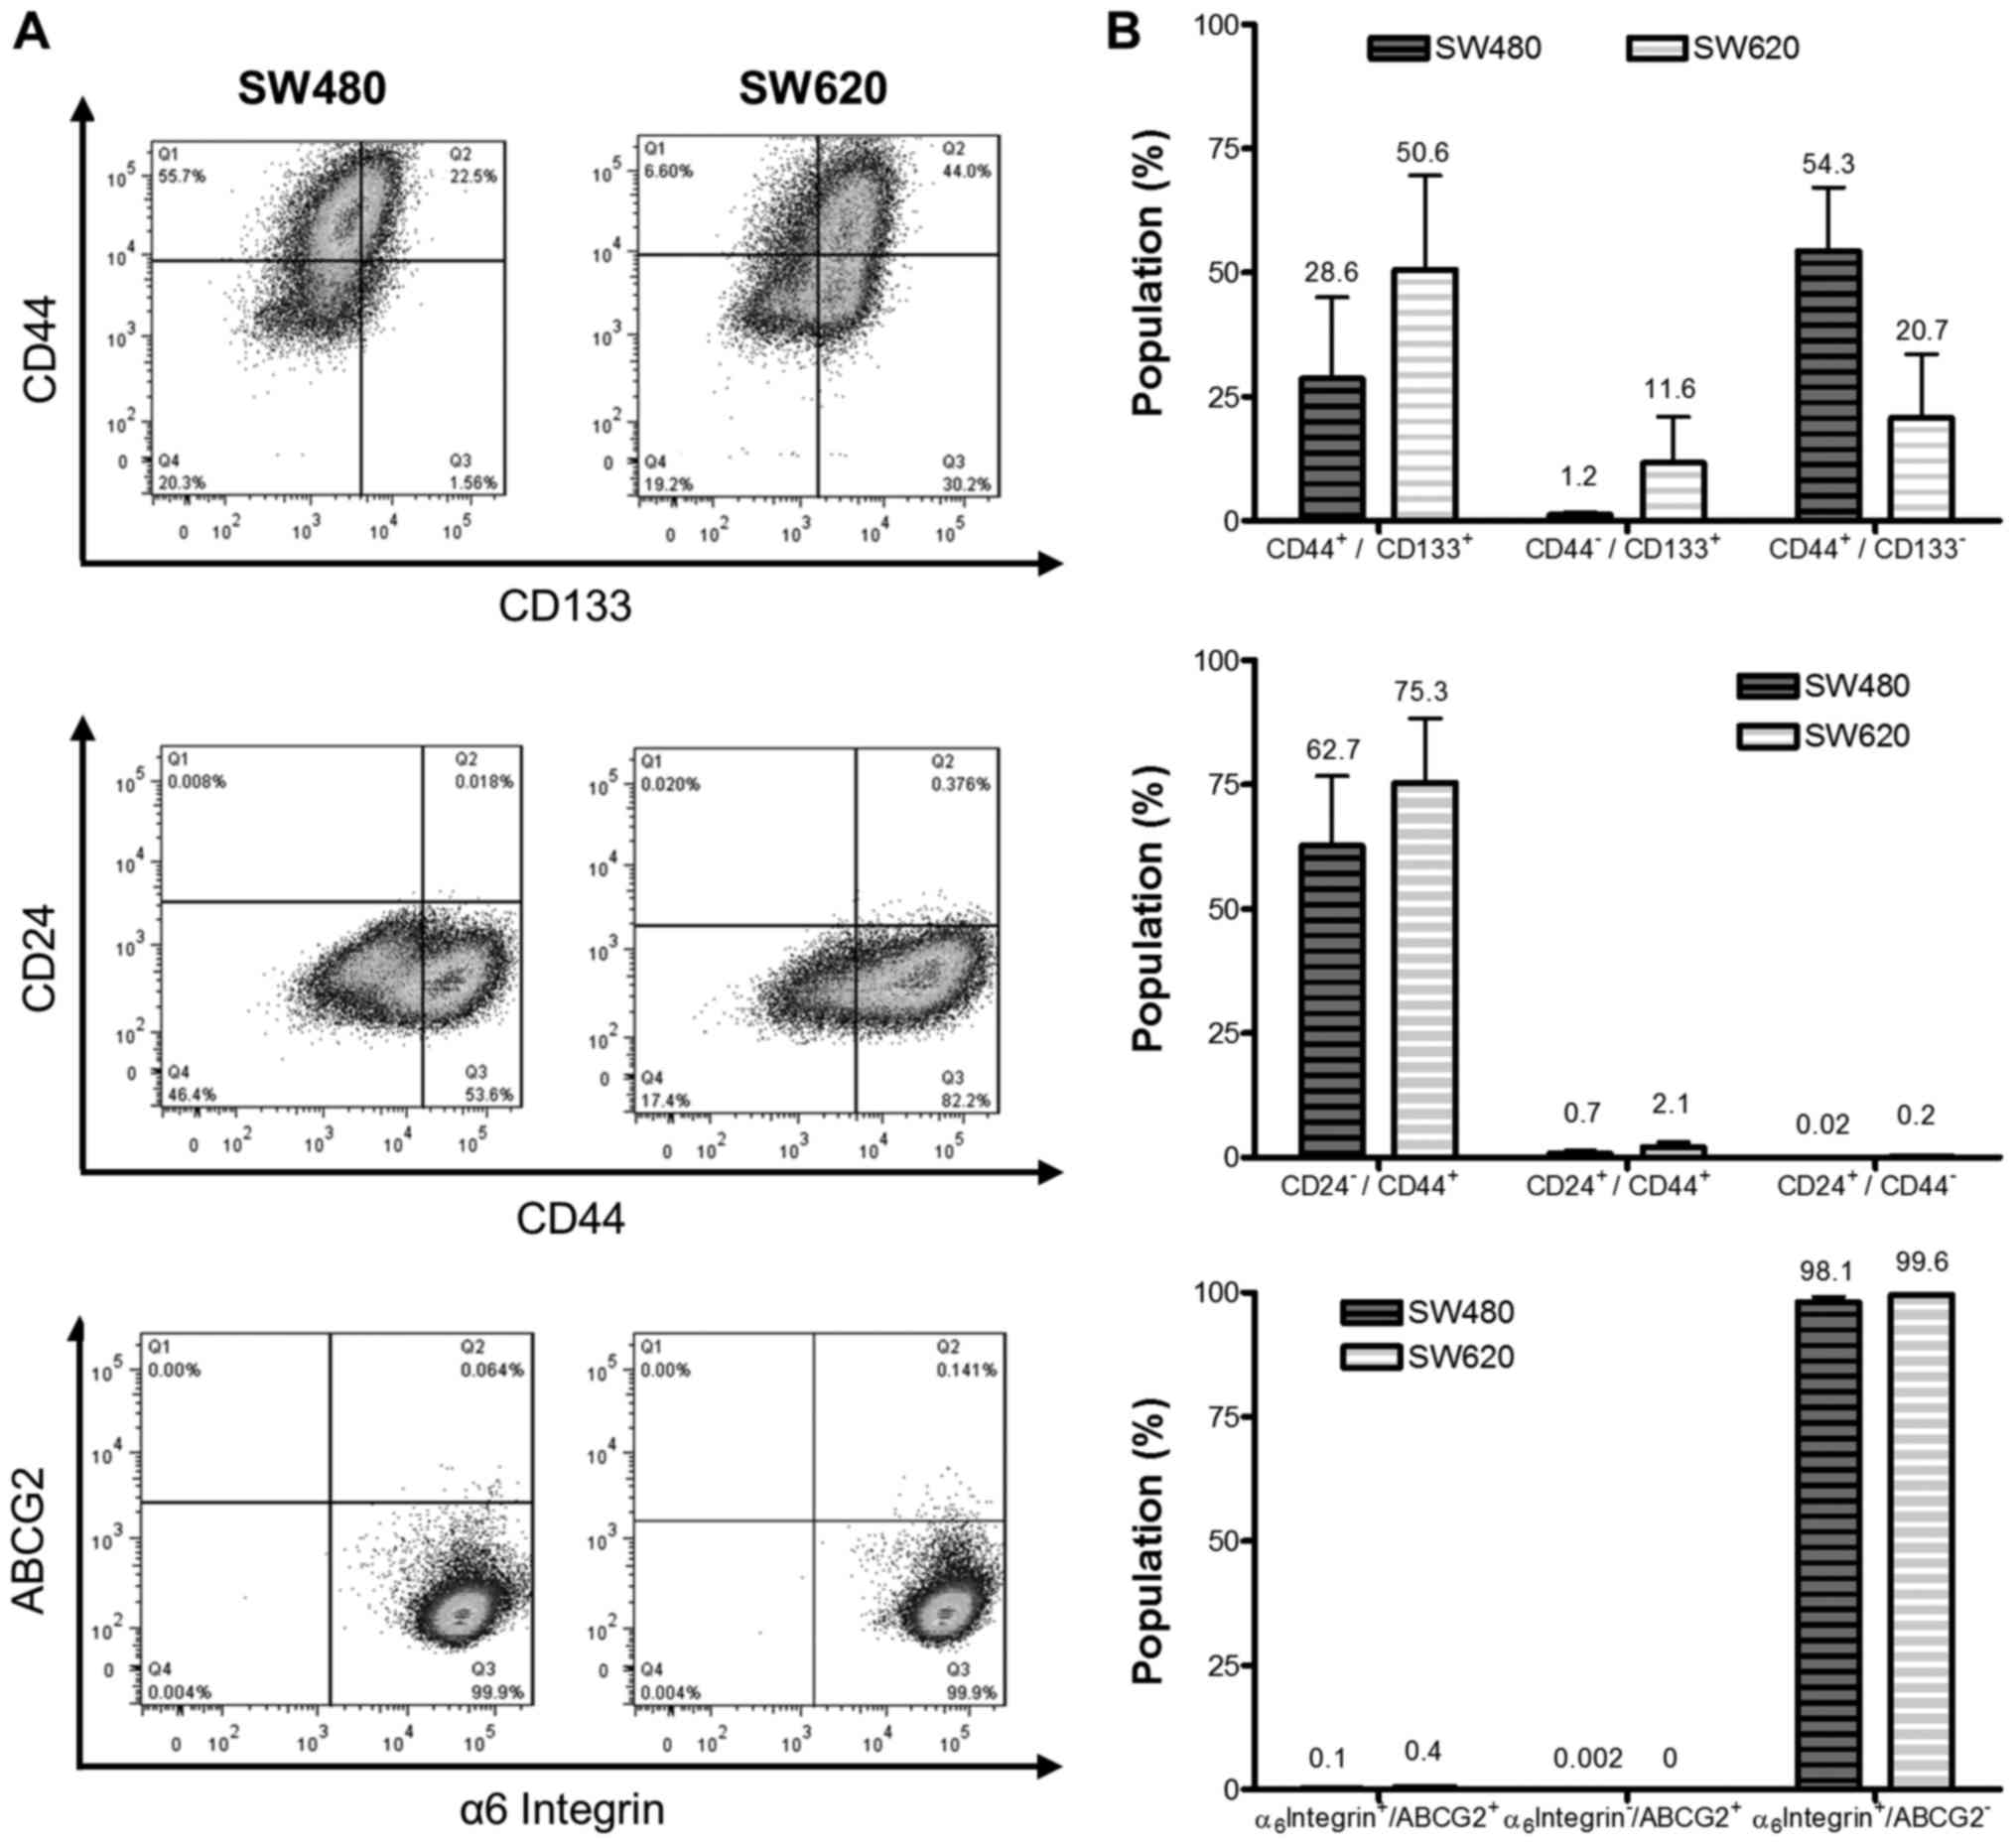
We employed a third strategy to compare putative CSC
levels between the cell lines by analyzing the expression of the
cell surface markers ABCG2 (CD338), CD44 and CD133, CD24 and the α6
integrin (CD49f) (Fig. 4A). SW620
cells revealed a larger proportion of
CD44+/CD133+ cells than SW480 cells (50.6 and
28.6%, respectively; Fig. 4B), while
SW480 cells revealed a greater proportion of
CD44+/CD133− cells than the SW620 cell line
(54.3 and 20.7%, respectively). The
CD44+/CD24− population represented 62.7 and
75.3% of SW480 and SW620 cells, respectively α6 integrin was highly
expressed by both cell lines, accounting for greater than 98 and
99% integrin α6+/ABCG2− populations of SW480
and SW620 cells, respectively. Co-staining for the α6
integrin+/ABCG2+ marker revealed populations
of 0.1 and 0.4% in SW480 and SW620 cells. The differences in
expression of these phenotypic markers between the cell lines were
not, however, deemed to be significant for any of the cell surface
proteins tested, in part due to the high degree of variability in
staining between replicates, which was consistently observed in
subsequent replicate experiments.
Anchorage independent growth model for
putative cancer stem-like cells
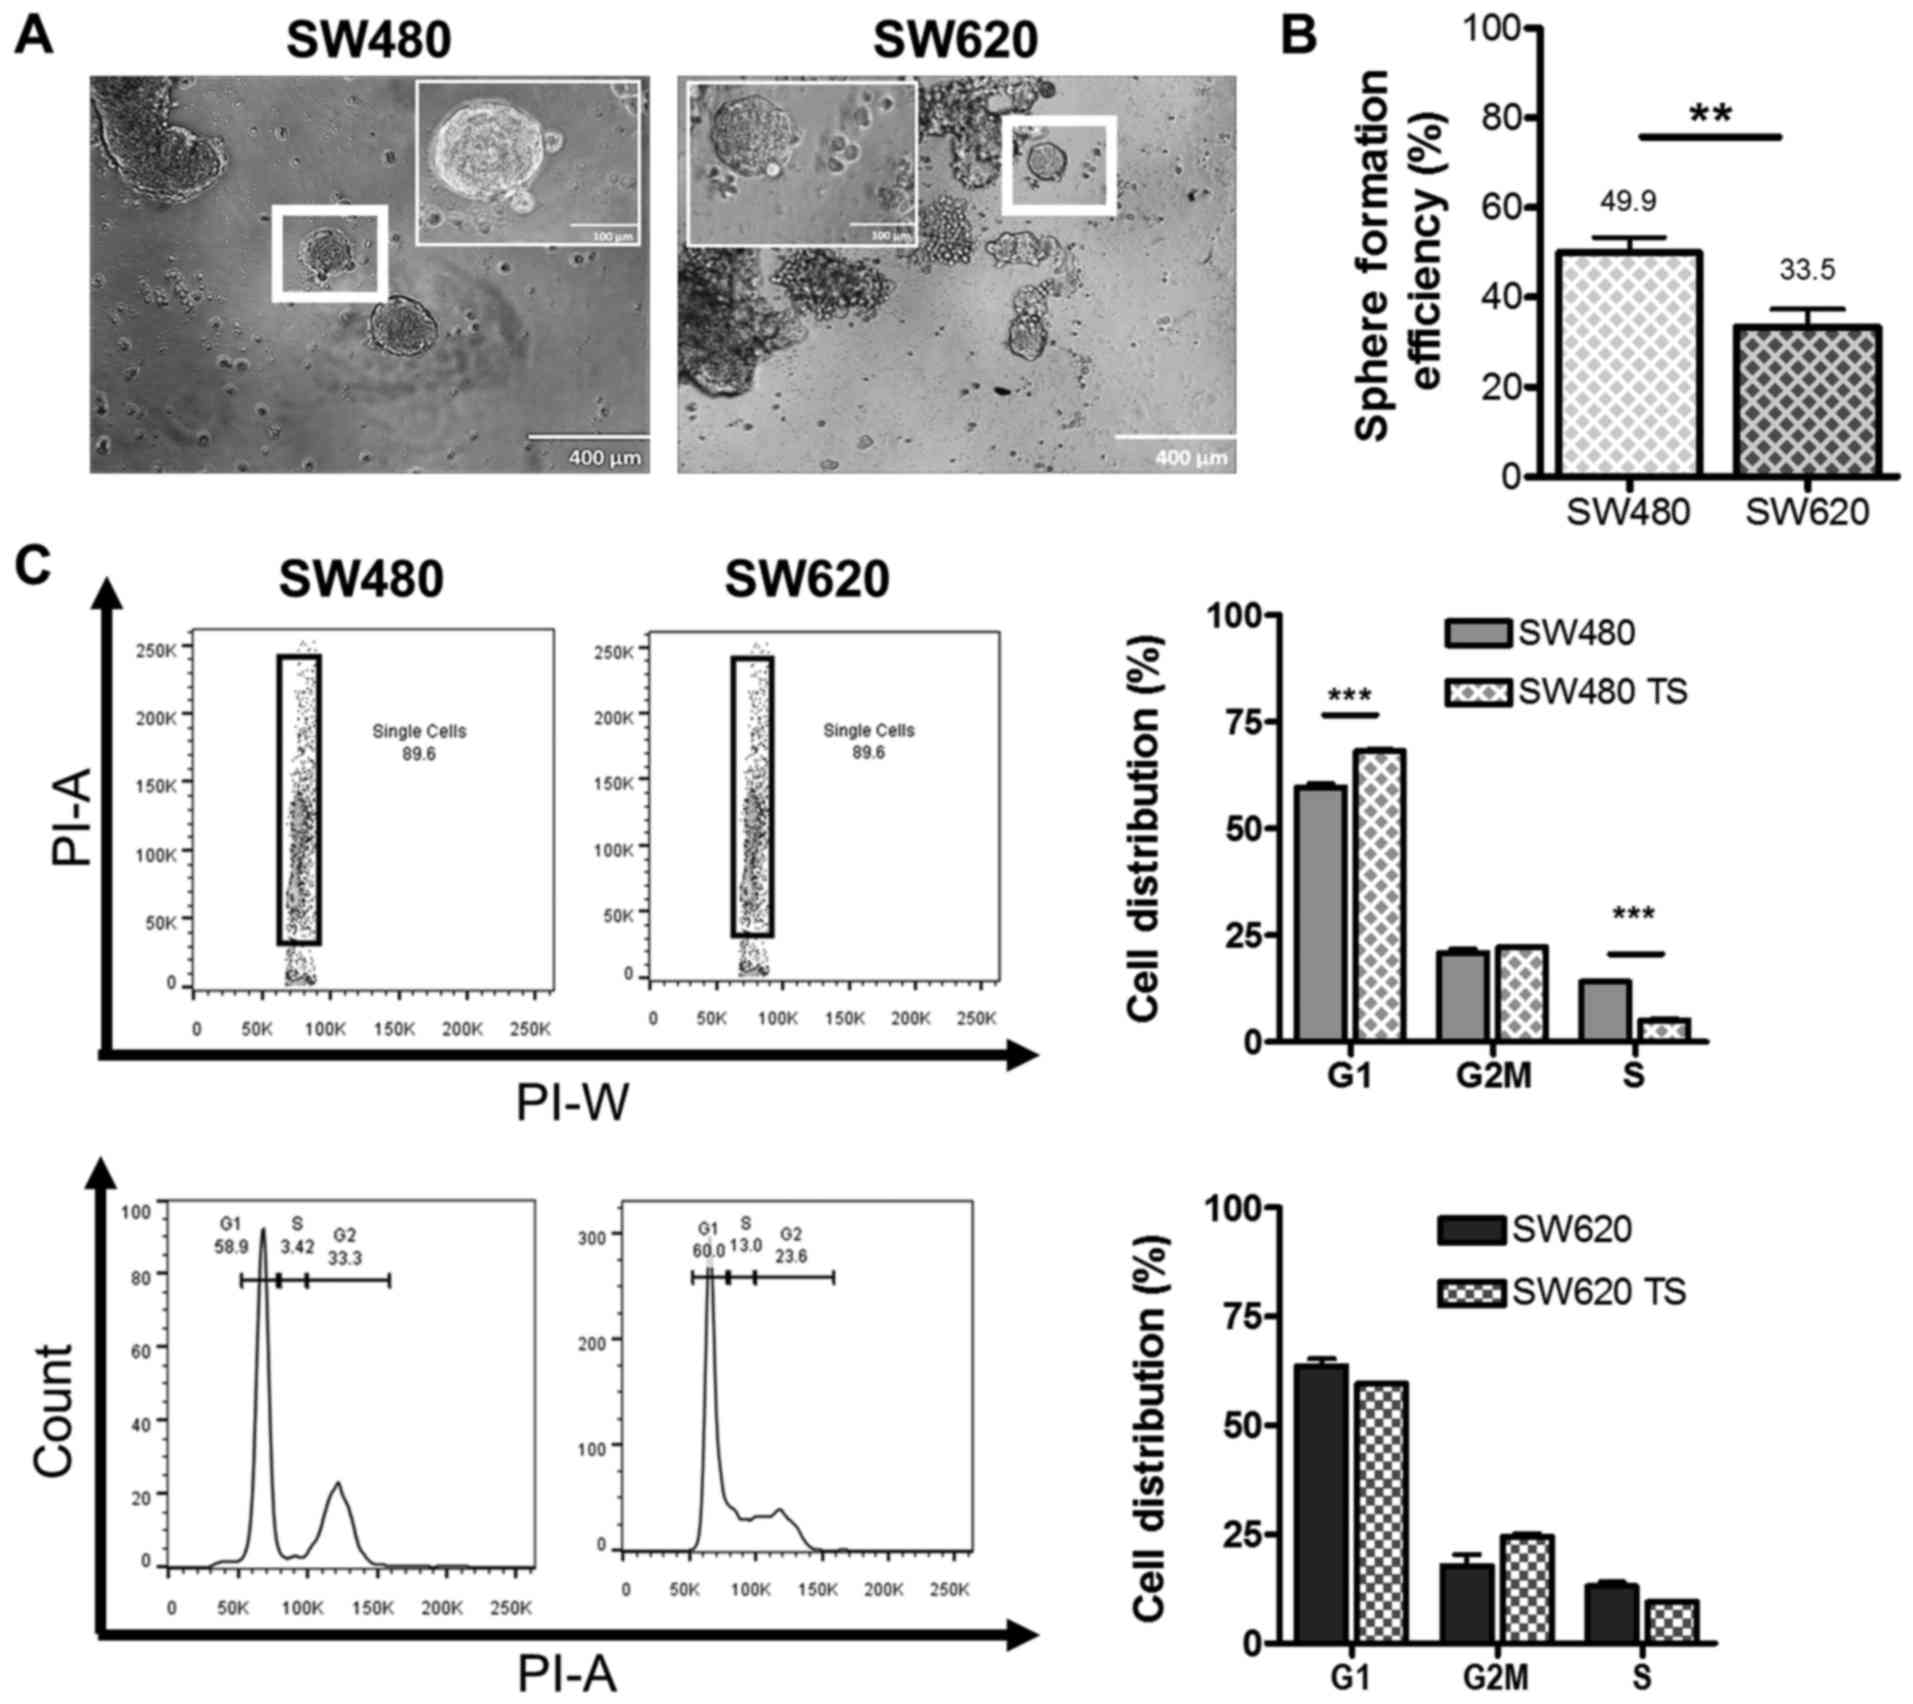
Finally, we compared the levels of putative CSC
between the SW480 and SW620 cell lines using a functional assay,
where we investigated the ability to form TS under
anchorage-independent conditions. Both cell lines were capable of
anchorage-independent growth, forming TS, characterized as
non-adherent three-dimensional spherical colonies with distinct
borders, of approximately 120 µm in diameter within 14 days of
culture (Fig. 5A), which correlates
with sizes reported in the literature for other primary cancers and
cell lines (26–28). We report that SW480 cells displayed
significantly higher SFE than SW620 cells after 7 days of culture
(49.9 and 33.5%, respectively, Fig.
5B). Since quiescence is a feature of CSC (29), we compared the cell cycle distribution
of SW480 and SW620 cells grown adherently and as TS (Fig. 5C). TS derived from SW480 cells
displayed a statistically significant (P<0.001) increase in the
number of cells in G1/G0 phase and a concomitant decrease in the
proportion of cells in S phase compared to SW480 cells cultured
under adherent conditions. No significant difference in the
distribution of cells between the cell cycle phases was detected on
comparison of SW620 cells grown in adherent and TS conditions. The
significant increase in the proportion of cells in G1/G0 phase in
SW480 TS may account for the greater SFE observed for the SW480
cell line over the SW620 cell line (Fig.
5B).
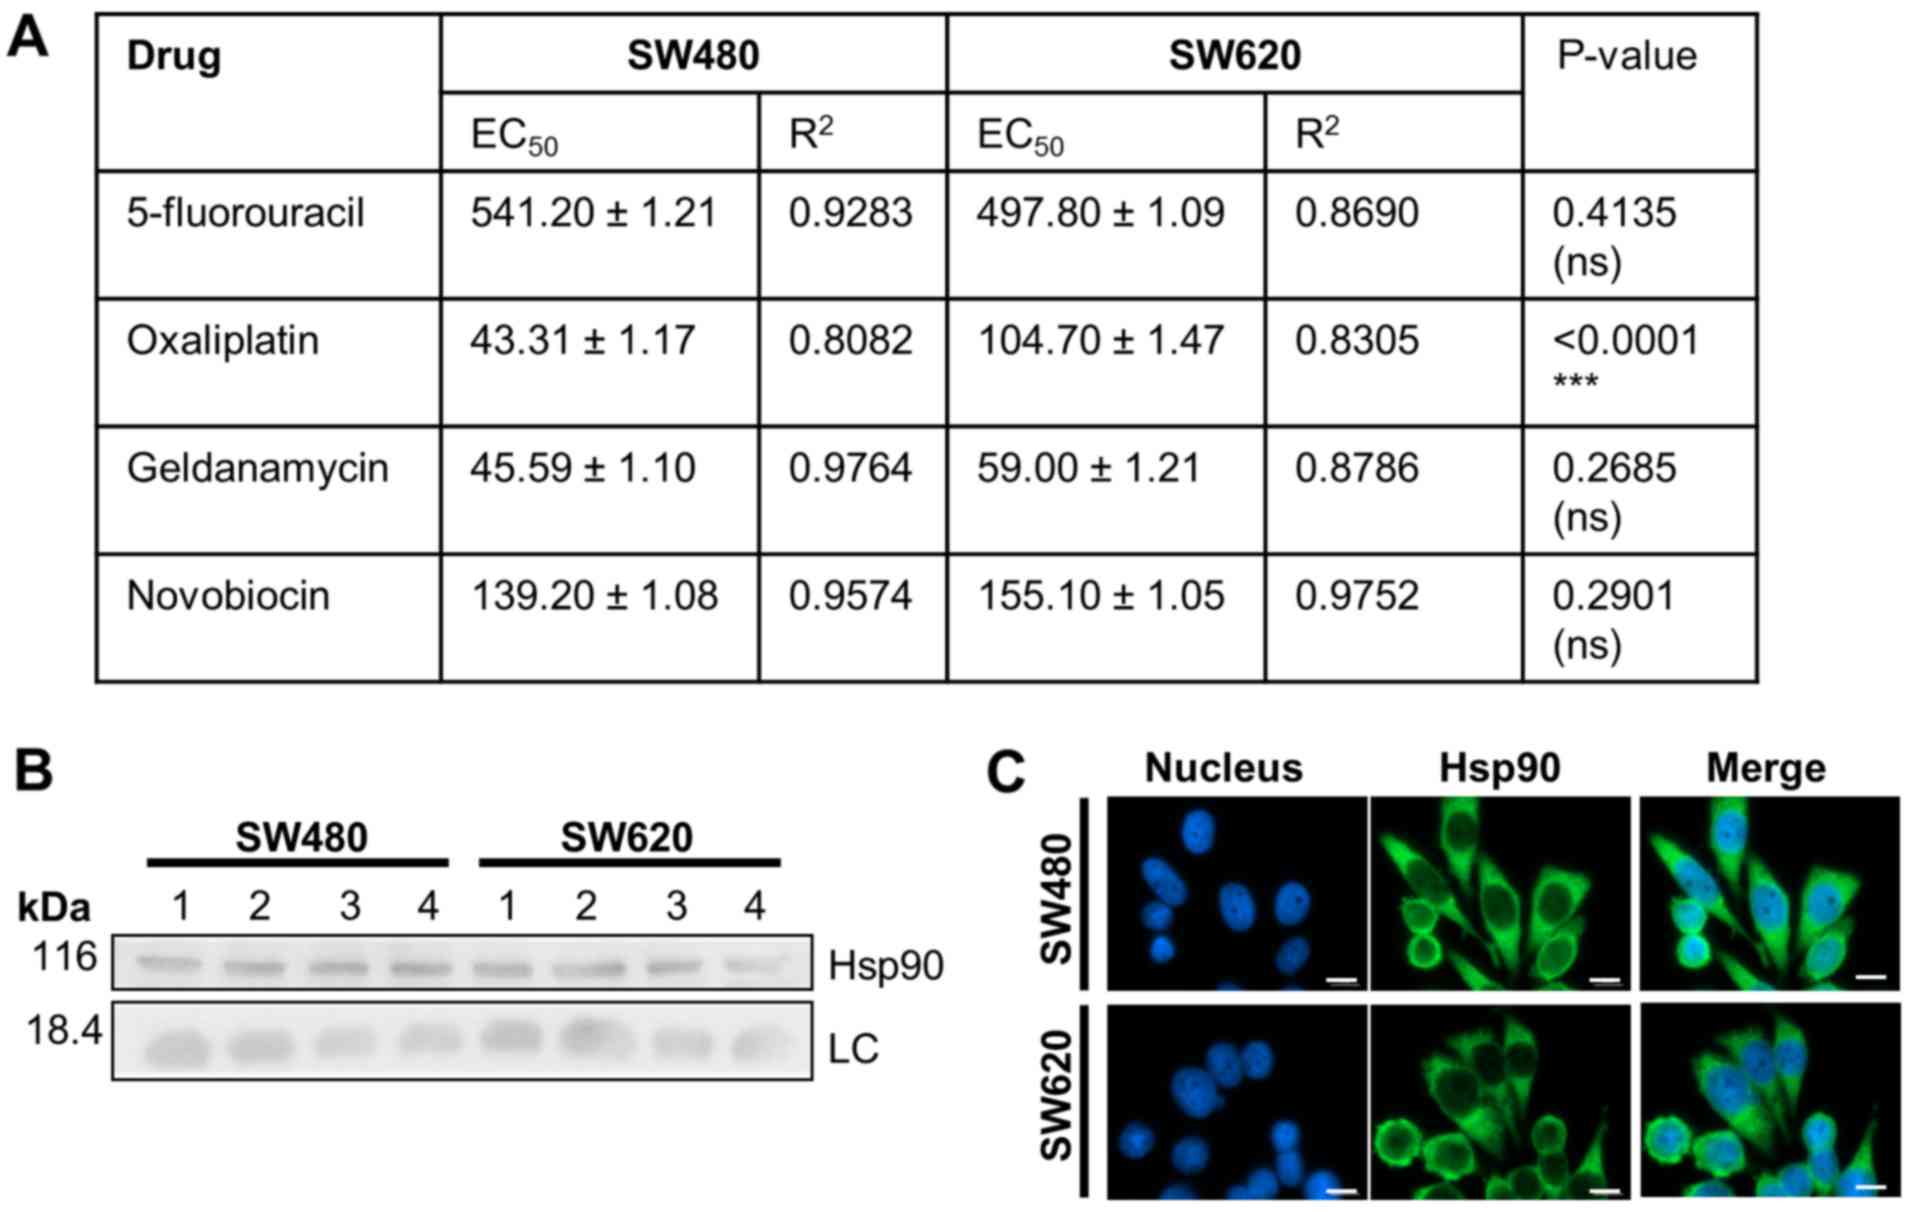
Chemosensitivity of SW480 and SW620
cells in vitro
We next compared the chemosensitivity of the SW480
and SW620 cell lines to anti-cancer drugs, including 5-FU and
oxaliplatin, used in the treatment of colon cancer (30,31), and
the Hsp90 inhibitors, GA and NOV (Fig.
6). SW620 cells displayed greater sensitivity than SW480 cells
to 5-FU treatment, although the difference in EC50
values was not significant), while SW480 cells were significantly
more sensitive to oxaliplatin. SW480 and SW620 cells displayed
similar sensitivities to GA and NOV and demonstrated similar
subcellular localisation and expression levels of Hsp90, the target
of these drugs (Fig. 6B and C).
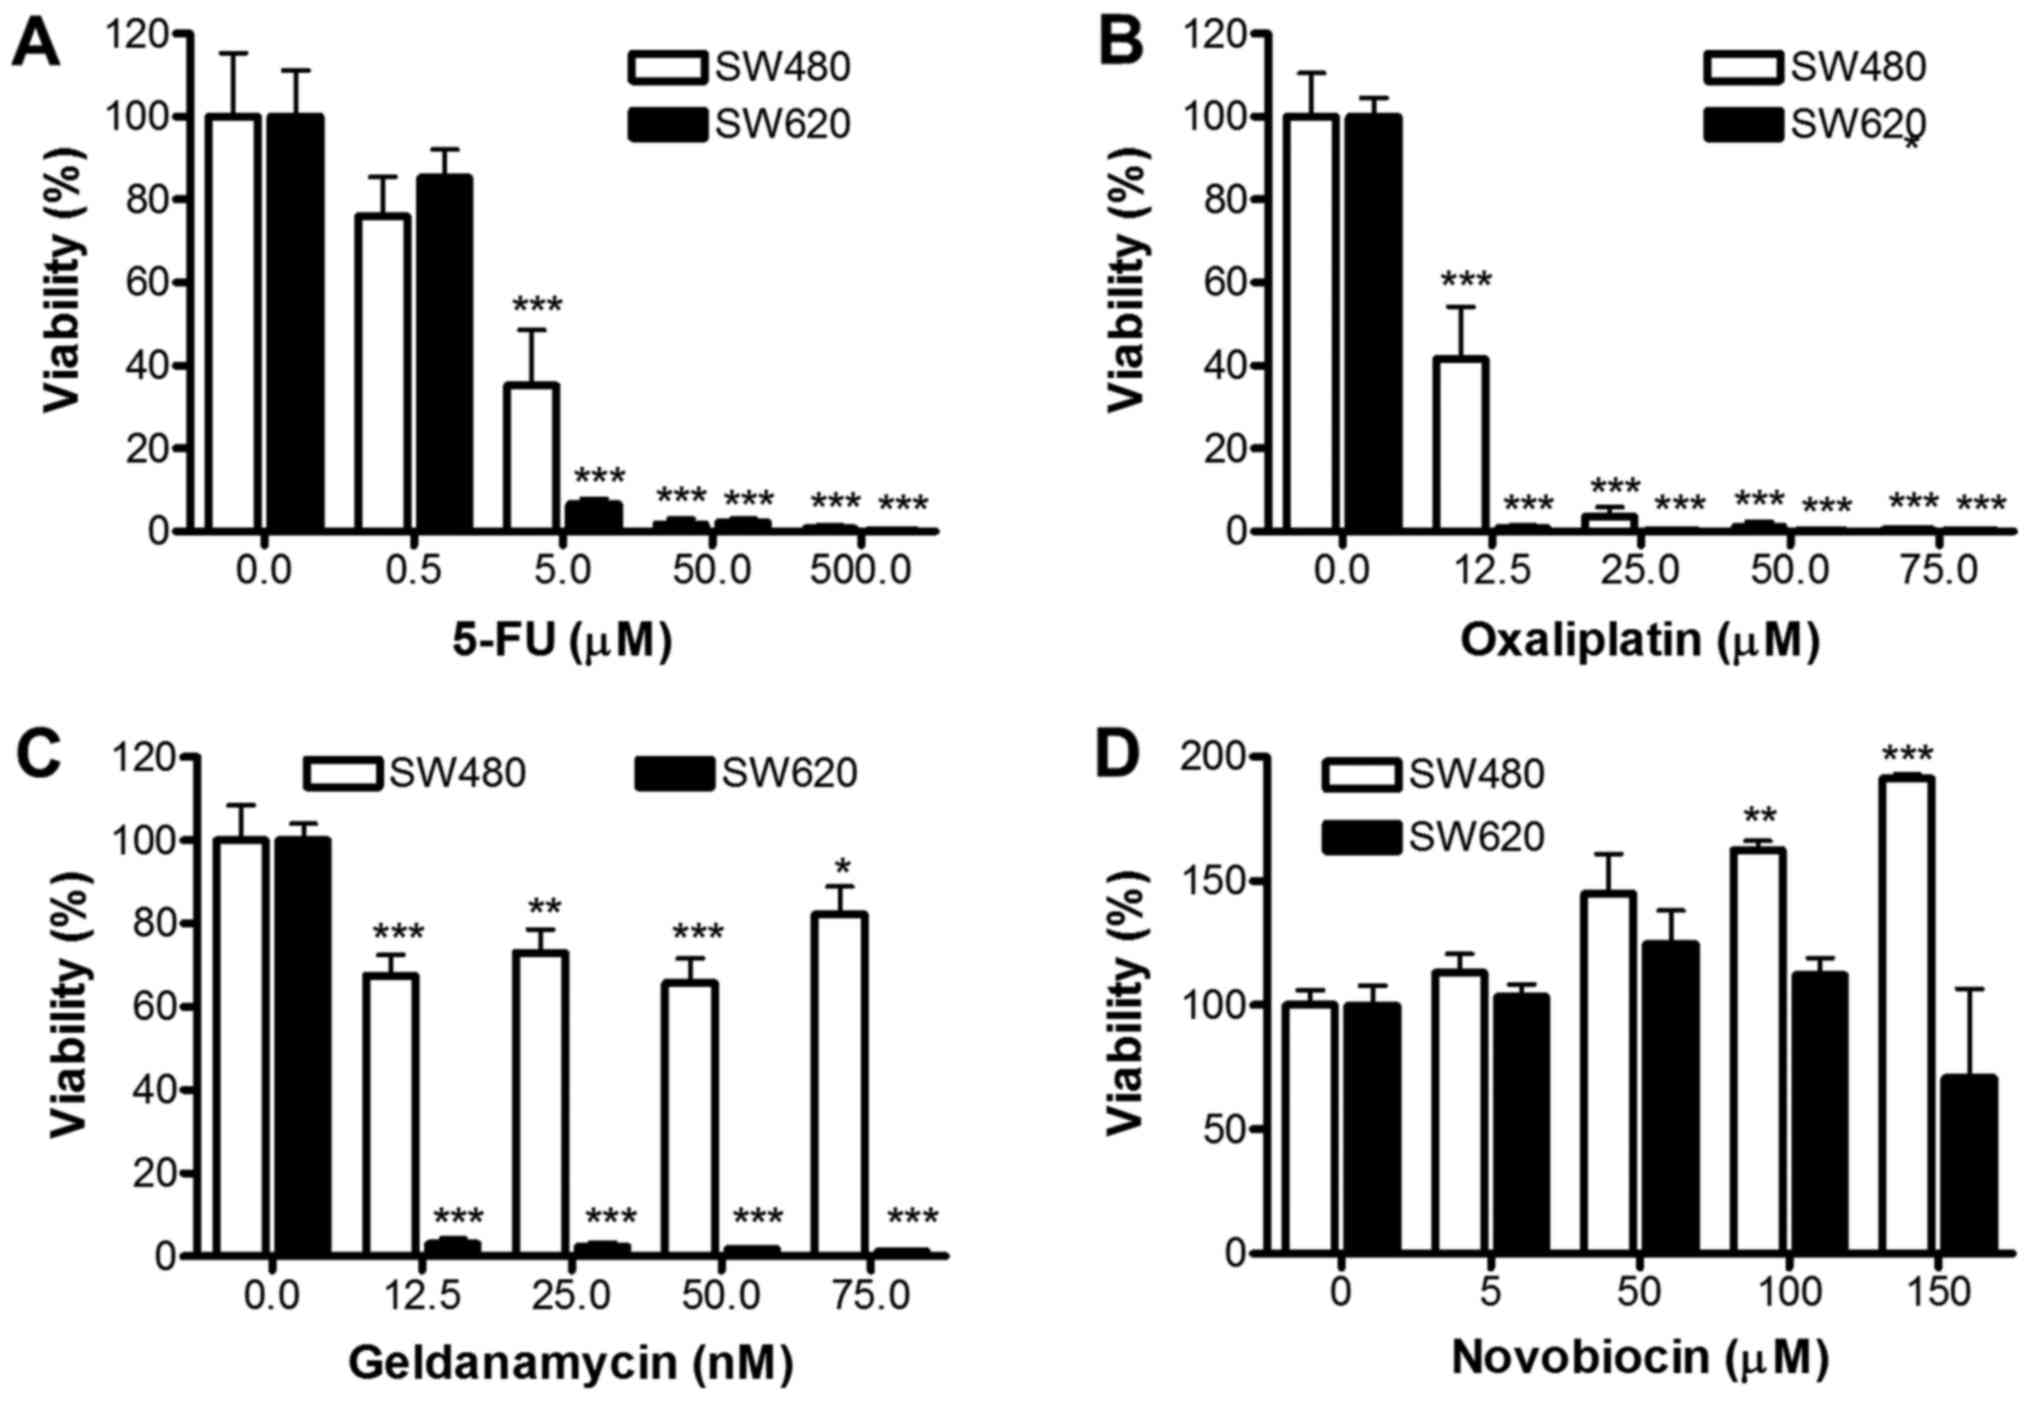
Response of TS to anti-cancer
drugs
We further assessed whether TS from SW480 and SW620
differ in their response to 5-FU, oxaliplatin, GA or NOV (Fig. 7). Dose-dependent decreases in cellular
viability were obtained for both SW480 and SW620 TS following
treatment with 5-FU and oxaliplatin at concentrations above 5 and
12.5 µM (P<0.001), respectively. These results suggest that both
SW480 and SW620 derived TS exhibit enhanced sensitivity (in
comparison to adherent cells) to 5-FU and oxaliplatin treatments
(SW620 TS demonstrated greater sensitivity to 5-FU; Fig. 7A), oxaliplatin (Fig. 7B) and GA (Fig. 7C) compared to SW480 TS. Indeed, SW620
derived TS showed significant reductions in viability after
treatment with only 12.5 nM GA (P<0.001), which is approximately
4-fold lower that the EC50 for SW480 and SW620 adherent
cells. Interestingly, NOV caused a significant dose-dependent
increase in viability in SW480 TS (P<0.01 for 100 µM and
P<0.001 for 150 µM treatments; Fig.
7D). In contrast, NOV had no significant effect on SW620 TS
formation, although the TS were more resistant to NOV compared to
the SW620 cells cultured under adherent conditions.
Discussion
The SW480 and SW620 paired cell lines were
established from the primary tumour and metastatic counterpart of
the same individual and therefore have a shared genetic background,
representing an in vitro model for the changes associated
with the progression of a colon cancer (32). In this study, the two cell lines were
shown to have similar growth rates, while the SW480 cell line was
more migratory on collagen and fibronectin in linear wound healing
assays than the SW620 cell line. While this may seem
counterintuitive, if we consider that the physiology of the
pre-metastatic cell line must support metastatic potential, this
may account for the enhanced migration potential observed in the
SW480 cells.
Our in vitro CSC analysis suggests that,
despite having similar levels of cells bearing putative CSC
markers, the SW480 and SW620 paired cell lines can be
differentiated on the basis of the ability to grow under anchorage
independent conditions as TS. Furthermore, the culture of TS
revealed differences in chemosensitivity of the SW480 and SW620
cell lines that were not observed when the cells were cultured
under adherent conditions. To the best of our knowledge, this is
the first study to report an extensive comparison of any paired
cell lines using a range of in vitro CSC assays.
In colon cancer, the CD133, CD24 and CD44 surface
proteins have been reported to represent putative colorectal CSC
populations (20). However, the use
of CD44 and CD133 markers for the detection of colon CSC remains
controversial (33,34). The proportions of putative CSC
identified within the SP of SW480 and SW620 cells in our study were
low (~1%) in both cases, similar to reports for other colon cancer
lines and gastrointestinal tumours from literature (21,35).
Similarly, the proportion of cells expressing ALDH was comparable
between the two cell lines, and the
CD44+/CD133+ population was also not
significantly different between SW480 and SW620 cells. While both
paired cell lines formed TS, the SW480 cell line demonstrated
significantly greater TS formation efficiency. These data would
suggest that the SW480 cell line should be more enriched in cells
with a CSC-like phenotype than the SW620 line. If the proportion of
CSC is correlated with tumourigenic potential, then these data were
unexpected as SW620 cells have demonstrated a greater tumorigenic
potential than the SW480 cell line in vivo (32). The CD133+ marker has been
used to identify drug-resistant CSC populations in colon cancer,
although, there is some indication that both CD133+ and
CD133− populations in colorectal cancer can regenerate
the growth of a tumour with in vitro serum-free culture
(36,37). We originally hypothesised that if
there were a link between CSC and metastasis, as suggested in the
literature (3–5), then the SW620 cell line might be
enriched in cells bearing CSC expression markers and/or CSC
properties. Our results do not support this hypothesis, since there
was no significant difference in SP, ALDH levels or CSC markers
between SW620 and SW480 cells and SW620 cells displayed a lower TS
forming ability. However, if we consider the definition of a CSC in
terms of their ability to recapitulate a tumour with a similar CSC
hierarchy (7,38), this would explain the similarity in
CSC profiles, between the SW480 and SW620 cell lines observed in
this study in phenotypic marker-based assays.
The SW480/SW620 model was used to explore
differential chemosensitivity between cells derived from a primary
tumour and its metastasis, as well as to assess the effect of
putative CSC-enrichment on drug susceptibility. Under adherent
conditions, the SW480 and SW620 cells were similarly sensitive to
5-FU and the Hsp90 inhibitors, GA and NOV, while SW480 cell lines
were more sensitive to oxaliplatin than the SW620 cell lines. This
demonstrated that differences in the chemosensitivity of primary
and secondary tumour-derived cell lines vary between drugs;
however, in our study, the overall trend was that of a similar
toxicity profile in terms of selected chemotherapeutic agents
between the two cell lines. To address whether the presence of a
putative CSC subpopulation contributes to drug resistance, the
viability of putative CSC-enriched TS grown in the presence of
anti-cancer drugs was compared to the aforementioned results
obtained under adherent conditions. We report that the anti-cancer
drugs 5-FU, oxaliplatin and GA were able to inhibit or reduce TS
formation in both lines at concentrations below the EC50
values determined for adherent lines. This is encouraging in the
light of the recent focus on developing CSC-targeted therapies
(5). In contrast, NOV treatment led
to an increase in TS viability, particularly in the SW480 cell
line. These data support the hypothesis that the SFE and, by
extension, the presence of putative CSCs, influences the
sensitivity of cell populations to anti-cancer drugs (16).
The most striking and intriguing trends observed in
this study were those observed when comparing the SW480 and the
SW620 cell lines in terms of the differences in drug sensitivity of
their respective TS. In particular, SW480 TS unlike SW480 cells
grown under adherent conditions, revealed a significantly greater
tolerance to oxaliplatin, 5-FU, and GA in comparison to SW620 TS.
The differences in chemosensitivities of the SW480 and SW620 TS
were most prominent for the Hsp90 inhibitors GA and NOV, with SW620
TS showing a dramatic increase in sensitivity to GA and the SW480
TS showing a marked and unexpected increase in viability upon
exposure to NOV. These differences may be linked to the increased
expression, in SW620 cells, of the oncogene ERBB3 and telomerase
(39,40), both of which are Hsp90 clients and
have been shown to support anchorage independent growth (41–44). If
the SW620 line is dependent on the latter for growth under
anchorage independent conditions, then this cell line may be more
sensitive to Hsp90 inhibition. The increase in viability of SW480
TS upon NOV treatment was unexpected and is in contrast to other
studies showing that NOV and other C-terminal Hsp90 inhibitors were
able to block anchorage independent growth of cancer cell lines
(45,46), although both of these studies used the
soft agar assay, not the TS assay, to measure anchorage independent
growth.
In conclusion, our data from the analysis of the
SW480 and SW620 paired cell lines do not support a correlation
between CSC populations as identified using a range of accepted
in vitro assays and the migration potential or drug
resistance of the cells since the cell lines have similar levels of
putative CSC but show differences in these biological
responses.
Acknowledgements
Not applicable.
Funding
This study was supported by funding from the South
African Research Chairs Initiative of the Department of Science and
Technology (DST) and National Research Foundation (NRF) of South
Africa (grant no. 98566), NRF CPRR and Incentive funding (grant
nos. 91523 and 90641), the Cancer Association of South Africa,
Medical Research Council South Africa with funds from the National
Treasury under its Economic Competitiveness and Support Package and
Rhodes University. CS was the recipient of a NRF/DST Innovations
postgraduate bursary from the NRF and JAdlM. was the recipient of
an Innovations postdoctoral fellowship from the DST/NRF.
Availability of data and materials
All data generated or analyzed during this study are
included in this published article.
Authors' contributions
ALE and CS conceived the study. CS and JAdlM
conducted the experiments. ALE, JAdlM and CS analyzed the data and
wrote the manuscript. All authors read and approved the final
manuscript.
Ethics approval and consent to
participate
Not applicable.
Consent for publication
Not applicable.
Competing interests
The authors declare that they have no comepting
interests.
Glossary
Abbreviations
Abbreviations:
|
ABC
|
ATP-binding cassette transporter
protein
|
|
ALDH
|
aldehyde dehydrogenase
|
|
CSC
|
cancer stem cells
|
|
Hsp90
|
heat shock protein 90 kDa
|
|
SP
|
side population
|
|
SFE
|
sphere forming efficiency
|
|
5-FU
|
5-fluorouracil
|
|
GA
|
geldanamycin
|
|
NOV
|
novobiocin
|
|
TS
|
tumourspheres
|
References
|
1
|
Sell S: Stem cell origin of cancer and
differentiation therapy. Crit Rev Oncol Hematol. 51:1–28. 2004.
View Article : Google Scholar : PubMed/NCBI
|
|
2
|
Wicha MS, Liu S and Dontu G: Cancer stem
cells: An old idea-A paradigm shift. Cancer Res. 66:1883–1890.
2006. View Article : Google Scholar : PubMed/NCBI
|
|
3
|
Brabletz T, Jung A, Spaderna S, Hlubek F
and Kirchner T: Opinion: Migrating cancer stem cells-an integrated
concept of malignant tumour progression. Nat Rev Cancer. 5:744–749.
2005. View
Article : Google Scholar : PubMed/NCBI
|
|
4
|
Carpentino JE, Hynes MJ, Appelman HD,
Zheng T, Steindler DA, Scott EW and Huang EH: Aldehyde
dehydrogenase-expressing colon stem cells contribute to
tumorigenesis in the transition from colitis to cancer. Cancer Res.
69:8208–8215. 2009. View Article : Google Scholar : PubMed/NCBI
|
|
5
|
Han L, Shi S, Gong T, Zhang Z and Sun X:
Cancer stem cells: Therapeutic implications and perspectives in
cancer therapy. Acta Pharm Sin B. 3:65–75. 2013. View Article : Google Scholar
|
|
6
|
Bonnet D and Dick JE: Human acute myeloid
leukemia is organized as a hierarchy that originates from a
primitive hematopoietic cell. Nat Med. 3:730–737. 1997. View Article : Google Scholar : PubMed/NCBI
|
|
7
|
Singh SK, Clarke ID, Terasaki M, Bonn VE,
Hawkins C, Squire J and Dirks PB: Identification of a cancer stem
cell in human brain tumors. Cancer Res. 63:5821–5828.
2003.PubMed/NCBI
|
|
8
|
Al-Hajj M, Wicha MS, Benito-Hernandez A,
Morrison SJ and Clarke MF: Prospective identification of
tumorigenic breast cancer cells. Proc Natl Acad Sci USA.
100:3983–3988. 2003. View Article : Google Scholar : PubMed/NCBI
|
|
9
|
Ho MM, Ng AV, Lam S and Hung JY: Side
population in human lung cancer cell lines and tumors is enriched
with stem-like cancer cells. Cancer Res. 67:4827–4833. 2007.
View Article : Google Scholar : PubMed/NCBI
|
|
10
|
Collins AT, Berry PA, Hyde C, Stower MJ
and Maitland NJ: Prospective identification of tumorigenic prostate
cancer stem cells. Cancer Res. 65:10946–10951. 2005. View Article : Google Scholar : PubMed/NCBI
|
|
11
|
Dou J, Pan M, Wen P, Li Y, Tang Q, Chu L,
Zhao F, Jiang C, Hu W, Hu K and Gu N: Isolation and identification
of cancer stem-like cells from murine melanoma cell lines. Cell Mol
Immunol. 4:467–472. 2007.PubMed/NCBI
|
|
12
|
Qiang L, Yang Y, Ma YJ, Chen FH, Zhang LB,
Liu W, Qi Q, Lu N, Tao L, Wang XT, et al: Isolation and
characterization of cancer stem like cells in human glioblastoma
cell lines. Cancer Lett. 279:13–21. 2009. View Article : Google Scholar : PubMed/NCBI
|
|
13
|
Allikmets R, Gerrard B, Hutchinson A and
Dean M: Characterization of the human ABC superfamily: Isolation
and mapping of 21 new genes using the expressed sequence tags
database. Hum Mol Genet. 5:1649–1655. 1996. View Article : Google Scholar : PubMed/NCBI
|
|
14
|
Dalerba P, Dylla SJ, Park IK, Liu R, Wang
X, Cho RW, Hoey T, Gurney A, Huang EH, Simeone DM, et al:
Phenotypic characterization of human colorectal cancer stem cells.
Proc Natl Acad Sci USA. 104:10158–10163. 2007. View Article : Google Scholar : PubMed/NCBI
|
|
15
|
Mikhail S and Zeidan A: Stem cells in
gastrointestinal cancers: The road less travelled. World J Stem
Cells. 6:606–613. 2014. View Article : Google Scholar : PubMed/NCBI
|
|
16
|
Zhou J, Wang CY, Liu T, Wu B, Zhou F,
Xiong JX, Wu HS, Tao J, Zhao G, Yang M and Gou SM: Persistence of
side population cells with high drug efflux capacity in pancreatic
cancer. World J Gastroenterol. 14:925–930. 2008. View Article : Google Scholar : PubMed/NCBI
|
|
17
|
Golebiewska A, Brons NH, Bjerkvig R and
Niclou SP: Critical appraisal of the side population assay in stem
cell and cancer stem cell research. Cell Stem Cell. 8:136–147.
2011. View Article : Google Scholar : PubMed/NCBI
|
|
18
|
Yoshida A, Rzhetsky A, Hsu LC and Chang C:
Human aldehyde dehydrogenase gene family. Eur J Biochem.
251:549–557. 1998. View Article : Google Scholar : PubMed/NCBI
|
|
19
|
Ricci-Vitiani L, Lombardi DG, Pilozzi E,
Biffoni M, Todaro M, Peschle C and De Maria R: Identification and
expansion of human colon-cancer-initiating cells. Nature.
445:111–115. 2007. View Article : Google Scholar : PubMed/NCBI
|
|
20
|
Langan RC, Mullinax JE, Raiji MT, Upham T,
Summers T, Stojadinovic A and Avital I: Colorectal cancer
biomarkers and the potential role of cancer stem cells. J Cancer.
4:241–250. 2013. View Article : Google Scholar : PubMed/NCBI
|
|
21
|
Sussman RT, Ricci MS, Hart LS, Sun SY and
El-Deiry WS: Chemotherapy-resistant side-population of colon cancer
cells has a higher sensitivity to TRAIL than the non-SP, a higher
expression of c-Myc and TRAIL-receptor DR4. Cancer Biol Ther.
6:1490–1495. 2007. View Article : Google Scholar : PubMed/NCBI
|
|
22
|
Leibovitz A, Stinson JC, McCombs WB III,
McCoy CE, Mazur KC and Mabry ND: Classification of human colorectal
adenocarcinoma cell lines. Cancer Res. 36:4562–4569.
1976.PubMed/NCBI
|
|
23
|
Goodell BM, Brose K, Paradis G, Conner AS
and Mulligan RC: Isolation and functional properties of murine
hematopoietic stem cells that are replicating in vivo. J Exp Med.
183:1797–1806. 1996. View Article : Google Scholar : PubMed/NCBI
|
|
24
|
Dontu G, Al-Hajj M, Abdallah WM, Clarke MF
and Wicha MS: Stem cells in normal breast development and breast
cancer. Cell Prolif. 36 Suppl 1:S59–S72. 2003. View Article : Google Scholar
|
|
25
|
Kreso A and O'Brien CA: Colon cancer stem
cells. Curr Protoc Stem Cell Biol Chapter. 3:Unit 3.1. 2008.
View Article : Google Scholar
|
|
26
|
López J, Poitevin A, Mendoza-Martínez V,
Pérez-Plasencia C and García-Carrancá A: Cancer-initiating cells
derived from established cervical cell lines exhibit stem-cell
markers and increased radioresistance. BMC Cancer. 12:482012.
View Article : Google Scholar : PubMed/NCBI
|
|
27
|
Cao L, Zhou Y, Zhai B, Liao J, Xu W, Zhang
R, Li J, Zhang Y, Chen L, Qian H, et al: Sphere-forming cell
subpopulations with cancer stem cell properties in human hepatoma
cell lines. BMC Gastroenterol. 11:712011. View Article : Google Scholar : PubMed/NCBI
|
|
28
|
Many AM and Brown AM: Both canonical and
non-canonical Wnt signaling independently promote stem cell growth
in mammospheres. PLoS One. 9:e1018002014. View Article : Google Scholar : PubMed/NCBI
|
|
29
|
Collins K, Jacks T and Pavletich NP: The
cell cycle and cancer. Proc Natl Acad Sci USA. 94:2776–2778. 1997.
View Article : Google Scholar : PubMed/NCBI
|
|
30
|
Anderson EC, Hessman C, Levin TG, Monroe
MM and Wong MH: The role of colorectal cancer stem cells in
metastatic disease and therapeutic response. Cancers (Basel).
3:319–339. 2011. View Article : Google Scholar : PubMed/NCBI
|
|
31
|
Constant S, Huang S, Wiszniewski L and Mas
C: Colon cancer: Current treatments and preclinical models for the
discovery and development of new therapies. Drug Discov. 433–458.
2012.
|
|
32
|
Hewitt RE, McMarlin A, Kleiner D, Wersto
R, Martin P, Tsokos M, Stamp GW and Stetler-Stevenson WG:
Validation of a model of colon cancer progression. J Pathol.
192:446–454. 2000. View Article : Google Scholar : PubMed/NCBI
|
|
33
|
Botchkina IL, Rowehl RA, Rivadeneira DE,
Karpeh MS Jr, Crawford H, Dufour A, Ju J, Wang Y, Leyfman Y and
Botchkina GI: Phenotypic subpopulations of metastatic colon cancer
stem cells: Genomic analysis. Cancer Genomics Proteomics. 6:19–29.
2009.PubMed/NCBI
|
|
34
|
Calvet CY, André FM and Mir L: The culture
of cancer cell lines as tumorspheres does not systematically result
in cancer stem cell enrichment. PLoS One. 9:e896442014. View Article : Google Scholar : PubMed/NCBI
|
|
35
|
Haraguchi N, Utsunomiya T, Inoue H, Tanaka
F, Mimori K, Barnard GF and Mori M: Characterization of a side
population of cancer cells from human gastrointestinal system. Stem
Cells. 24:506–513. 2006. View Article : Google Scholar : PubMed/NCBI
|
|
36
|
Fang DD, Kim YJ, Lee CN, Aggarwal S,
McKinnon K, Mesmer D, Norton J, Birse CE, He T, Ruben SM and Moore
PA: Expansion of CD133(+) colon cancer cultures retaining stem cell
properties to enable cancer stem cell target discovery. Br J
Cancer. 102:1265–1275. 2010. View Article : Google Scholar : PubMed/NCBI
|
|
37
|
Hsu CS, Tung CY, Yang CY and Lin CH:
Response to stress in early tumor colonization modulates switching
of CD133-positive and CD133-negative subpopulations in a human
metastatic colon cancer cell line, SW620. PLoS One. 8:e611332013.
View Article : Google Scholar : PubMed/NCBI
|
|
38
|
Kreso A and Dick JE: Evolution of the
cancer stem cell model. Cell Stem Cell. 14:275–291. 2014.
View Article : Google Scholar : PubMed/NCBI
|
|
39
|
Melcher R, Steinlein C, Feichtinger W,
Müller CR, Menzel T, Lührs H, Scheppach W and Schmid M: Spectral
karyotyping of the human colon cancer cell lines SW480 and SW620.
Cytogenet Cell Genet. 88:145–152. 2000. View Article : Google Scholar : PubMed/NCBI
|
|
40
|
Kolquist KA, Ellisen LW, Counter CM,
Meyerson M, Tan LK, Weinberg RA, Haber DA and Gerald WL: Expression
of TERT in early premalignant lesions and a subset of cells in
normal tissues. Nat Genet. 19:182–186. 1998. View Article : Google Scholar : PubMed/NCBI
|
|
41
|
Gerbin CS and Landgraf R: Geldanamycin
selectively targets the nascent form of ERBB3 for degradation. Cell
Stress Chaperones. 15:529–544. 2010. View Article : Google Scholar : PubMed/NCBI
|
|
42
|
Kim RH, Kim R, Chen W, Hu S, Shin KH, Park
NH and Kang MK: Association of hsp90 to the hTERT promoter is
necessary for hTERT expression in human oral cancer cells.
Carcinogenesis. 29:2425–2431. 2008. View Article : Google Scholar : PubMed/NCBI
|
|
43
|
Yuan H, Veldman T, Rundell K and Schlegel
R: Simian virus 40 small tumor antigen activates AKT and telomerase
and induces anchorage-independent growth of human epithelial cells.
J Virol. 76:10685–10691. 2002. View Article : Google Scholar : PubMed/NCBI
|
|
44
|
Wu H, Zhu S and Mo YY: Suppression of cell
growth and invasion by miR-205 in breast cancer. Cell Res.
19:439–448. 2009. View Article : Google Scholar : PubMed/NCBI
|
|
45
|
Wu D, Zhang R, Zhao R, Chen G, Cai Y and
Jin J: A novel function of novobiocin: disrupting the interaction
of HIF 1α and p300/CBP through direct binding to the HIF1α
C-terminal activation domain. PLoS One. 8:e620142013. View Article : Google Scholar : PubMed/NCBI
|
|
46
|
Hieronymus H, Lamb J, Ross KN, Peng XP,
Clement C, Rodina A, Nieto M, Du J, Stegmaier K, Raj SM, et al:
Gene expression signature-based chemical genomic prediction
identifies a novel class of HSP90 pathway modulators. Cancer Cell.
10:321–330. 2006. View Article : Google Scholar : PubMed/NCBI
|