Introduction
Lung cancer remains a common cause of mortalities
worldwide, accounting for 1.6 million mortalities in 2012 and ~20%
of all cancer mortalities (1).
Non-small cell lung cancer (NSCLC) is the predominant type of the
disease with ~80% of cases (1). In
the last decade, the important discovery of mutations in the
epidermal growth factor receptor (EGFR) gene had led to the
development of targeted therapy and personalized medicine (2). One class of anti-tumor drugs that target
EGFR is a group of small molecule inhibitors that inhibit the
tyrosine kinase domain of EGFR, EGFR-tyrosine kinase inhibitors
(TKIs). Examples of EGFR-TKIs include gefitinib and erlotinib
(3,4).
EGFR-TKIs have demonstrated initial success in some
patients with activating mutations (5). However, numerous patients do not respond
to the drug (6–8). Therefore, the identification of
biomarkers that are predicative of response to the drug became a
key issue for doctors to select the optimal therapy. To date,
mutations in the EGFR gene (exon 19 deletion, exon 18 G719X and
exon 21 L858R) have been reported to be predictors of
individualized treatment (9–12). However, obtaining sufficient
quantities of tissue specimens for laboratory evaluation is a
challenge in clinical practice. Unlike large quantities of tissue
obtained during surgery, tissue biopsies obtained in patients with
advanced NSCLC are usually too small for detection of EGFR gene
mutations following pathological diagnosis, such as routine and
immunohistochemical staining (13,14).
Additionally, under safety and compliance considerations, repeated
biopsies of these patients are associated with high risks and
therefore are unacceptable. Consequently, there is an urgent need
to develop specific biomarkers in specimens that are more easily
assessable, such as serum or plasma.
Matrix-assisted laser desorption ionization-time of
flight mass spectrometry (MALDI-TOF MS) is a soft ionization
technique used in mass spectrometry, which allows the analysis of
biomolecules (biopolymers such as DNA, proteins, peptides and
sugars) and large organic molecules (such as polymers, dendrimers
and other macromolecules), which tend to be fragile and fragment
when ionized by more conventional ionization methods (15,16).
MALDI-TOF MS is a high-throughput procedure and much faster, more
accurate and cheaper compared with other techniques based on
immunological or biochemical tests (17,18). In
recent years, MALDI-TOF MS has been successfully used in
distinguishing cancer patients from healthy controls, such as in
pancreatic, breast, ovarian and lung cancer (19,20). With
regards to predicting tumor treatment responses, perspective
applications of MALDI-TOF MS have also been reported. In 2007,
Taguchi et al (21) developed
and validated a serum/plasma test (VeriStrat) that uses MALDI-TOF
MS to classify patients with NSCLC based on prognosis following
treatment with EGFR TKIs. Following the preliminary study, the same
group further demonstrated that VeriStrat not only have the
predictive capability but also have the potential to be used for
monitoring gefitinib treatment (22).
However, VeriStrat was performed and evaluated primarily on the
Caucasian population, which possess a low frequency of EGFR
mutations (~10%) (23). The frequency
of EGFR mutations in the Asian population is ~30% (24), therefore, it is also desirable to
establish biomarkers using MALDI-TOF MS in this population.
The aim of the present study was to investigate
whether MALDI-TOF MS analysis can be used for pretreatment
selection of patients with advanced NSCLC, who would benefit from
EGFR-TKI therapy in one cohort of Chinese patients. The MALDI-TOF
MS data were obtained and further analyzed with advanced
chemometric tools.
The spectra that were distinctive between the
disease control and disease progression groups of patients were
selected in a training set of samples. Subsequently, the candidate
features of classification were validated in blinded fashion in the
test group of another set of patients. The association between the
blood EGFR mutation status and intensities of the representative
spectra for classification was also evaluated.
Materials and methods
Patient follow-up and sample
collection
Patients that pathologically confirmed as stage
IIIb-IV NSCLC were enrolled at the Department of the Pulmonary
Oncology at the Hospital of Military Medical Sciences (Beijing,
China) between August 2011 and October 2012. The inclusion criteria
included ≥18 years old and Eastern Cooperative Oncology Group
(ECOG) performance status (25,26) ≤3.
EGFR-TKIs therapies, including gefitinib, erlotinib and icotinib
were administrated with the recommended dose. CT scan was initially
performed after four weeks of EGFR-TKI treatment and was
continuously performed every two months. All patients were followed
up until July 31, 2013. The best overall efficacies were divided
into five groups: Complete response (CR), partial response (PR),
stable disease (SD), progressive disease (PD) according to Response
Evaluation Criteria for Solid Tumors (version 1.1) (27).
All serum samples were collected prior to the
initial treatment of EGFR-TKIs. The sera were separated into
aliquots (150 µl) and centrifuged at 2,500 × g for 10 min at 4°C.
The samples were then put into liquid nitrogen for rapid freezing
and stored at −80°C.
The present study was approved by the Ethics
Committee of Academy of Military Medical Sciences in accordance
with the medical research regulations of China and conformed to the
provisions of the Declaration of Helsinki in 1995 (as revised in
Tokyo 2004) (28). All participants
provided written informed consent, and patient information was used
anonymously.
Isolation of serum polypeptides
Briefly, the serum samples were thawed on ice.
Resuspended MB-IMAC-Cu2+ (National Center of Biomedical
Analysis, Beijing, China) was mixed with 5 µl beads (National
Center of Biomedical Analysis) in 50 µl binding buffer (National
Center of Biomedical Analysis) and applied onto the magnetic bead
separator (MBS; Bruker Corporation, Ettlingen, Germany) for four
times. The supernatant was subsequently discarded, and the
procedure was repeated three times. Subsequently, 5 µl serum was
mixed with 20 µl binding buffer without disturbance at room
temperature for 10 min. The mixture was applied onto the MBS for
four times, and the supernatant was discarded. A total of 100 µl
washing solution was added following the MBS step (four times), and
the supernatant was discarded. This step was repeated twice. A
total of 20 µl elution buffer was added and mixed at room
temperature for 20 min. The final mixture was placed on the MBS for
four times and stood for 20 sec each time. Finally, the supernatant
containing serum polypeptide was collected.
MALDI-TOF MS analysis
The samples were analyzed at the Beijing Proteome
Research Center (Beijing, China) using a Bruker Autoflex-II MALDI
MS (Bruker Corporation). The serum polypeptides were mixed with 1
µl saturated HCCA matrix (α-cyano-4-hydroxycinnamic acid dissolved
in 0.1% trifluoroacetic acid and 50% acetonitrile) and was spotted
at a unique location on the target plate. The plate was dried at
room temperature and then inserted into the mass spectrometer after
the instrument was calibrated with pure, well-characterized
standards. Positive ion mass spectra were obtained in linear mode
in an automated manner. The mass spectrum comprised peaks of the
polypeptides with different mass-to-charge ratio (m/z), which was
obtained using the software ClinProTools (CPT; Bruker Corporation).
To avoid system errors and manual operation errors, the standard
(peptide mixture) would be detected prior to the testing of each
sample. Meanwhile, 10 cases were randomly selected, and their serum
samples were collected for 6 days.
In order to evaluate the inter-stability of
MALDI-TOF MS analysis, samples from the same patient but collected
on different days were tested in batches. In order to evaluate the
intra-stability of the analysis, the same sample was tested for 6
times in one day. Peaks with m/z in the range of 1,000–10,000 Da
were selected for calculation of the coefficient of variation. The
results indicated that the coefficient of variation of intra-day
and inter-day were <20%.
Spectra were analyzed by FlexAnalysis software
(version 3.0; Bruker Corporation), including spectrum smoothing,
attenuation and standard peak processing (signal-to-noise ratio
>3). The output data in Excel format, which contain m/z and peak
intensity values, were then normalized using NCBA 6.0 software
(home made).
Classification procedure
Each spectrum obtained from the sample was
characterized by a set of features using the CPT software,
including background subtraction, normalization and integration of
intensities. The disease control group was defined as patients that
were administered with EGFR-TKI therapy for more than one month and
their best treatment responses were CR, PR or SD. The disease
progression group was defined as patients that were administered
with EGFR-TKI therapy within one month and the treatment response
was evaluated as PD. Subsequently, two-thirds of the patients from
each group were randomly selected for the training set of data in
order to establish the classification algorithms. The software
filters the significantly different polypeptides between the
disease control and disease progression groups. The software then
analyzed the intensities of these polypeptides and the best therapy
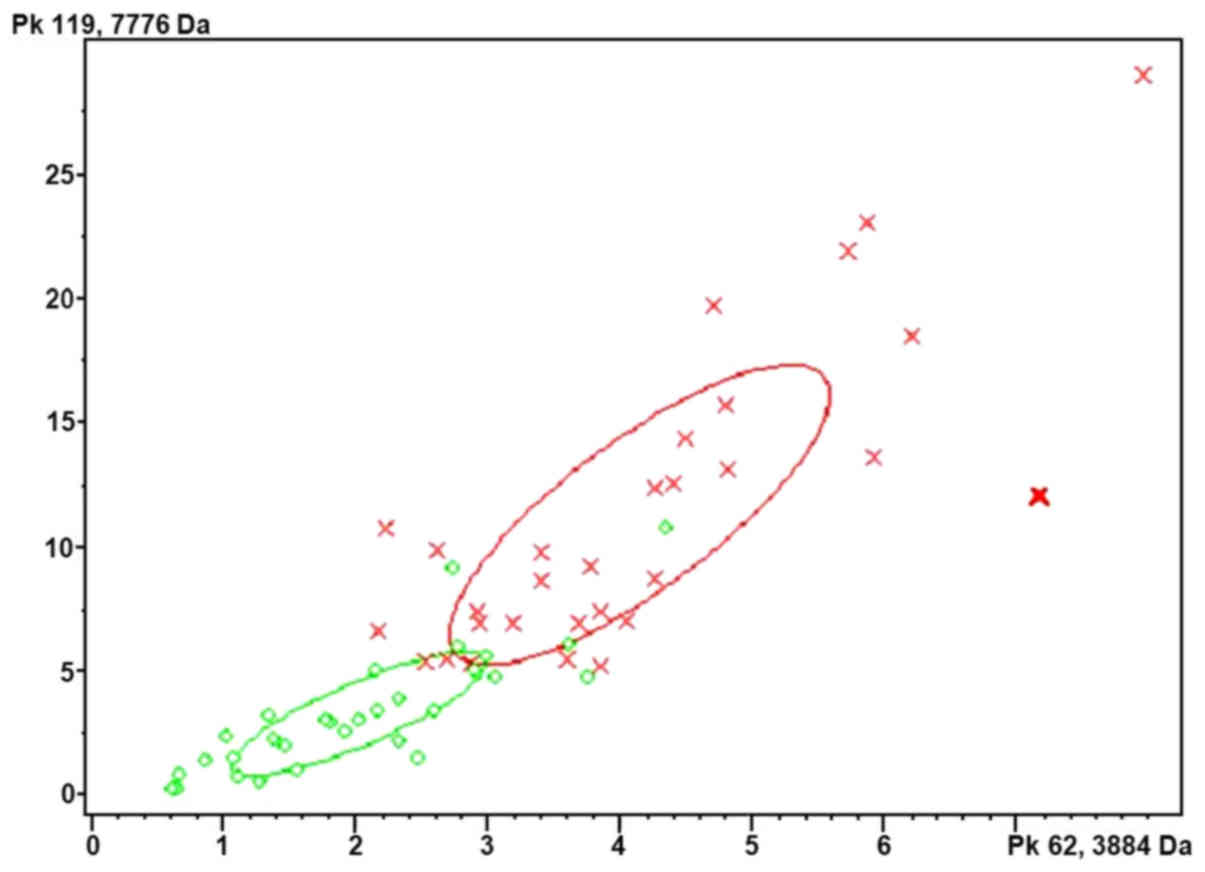
response to establish the classification model. Briefly, the serum
polypeptide fingerprints were analyzed by cluster analysis
(Fig. 1). The results indicated that
Quick Classifier (QC) was the optimal algorithm. QC is a single
variable sorting algorithm that first sorts the average peak area
of each group by P-value and calculates the weight. The model is
then established and all parameters are unchanged. In total, 43
samples were used as a test group to verify the model. The test
samples were classified as the disease control and progression
groups using Clinpro Tools v2.1 software (Bruker Corporation) based
on the classification model.
EGFR mutation status
EGFR mutations were identified according to
previously established methods (29).
Briefly, DNA was extracted from plasma using the QIAamp DNA Blood
Mini kit (Qiagen GmbH, Hilden, Germany). EGFR mutation status was
analyzed using the ADx-ARMS (amplification refractory mutation
system) kit (Amoy Diagnostics, Xiamen, China), and all experiments
and genotyping calling were performed following the manufacturer's
instructions. This kit was approved by the Chinese Food and Drug
Administration for in vitro diagnostics use, which detects
the 29 most common EGFR mutations in lung cancer as described to
date.
Statistical analysis
Statistical analysis was performed using SPSS
(version 19; SPSS, Inc., Chicago, IL, USA). Kaplan-Meier survival
curves of progression-free survival (PFS) and overall survival (OS)
of patients in the disease control and disease progression groups
were generated and compared using the Log-rank test. Time-to-event
outcomes of disease control and disease progression group were
analyzed using hazard ratios (HRs), which take into account the
number and timing of events representing disease progression of PFS
and mortality of OS, respectively. The results were presented as
hazard ratios (HRs) with their 95% corresponding intervals (CIs).
The association between clinical characteristics (stage, sex, age,
performance status, smoking status, and histology) with survival,
as well as the intensities of polypeptides in the classification
model and EGFR gene expression were determined using the
Mann-Whitney Test. Comparisons of the area under the peptide peaks
between the disease control group and disease progression group
were determined using an independent-sample t-test with
ClinproTools software v2.1 (Bruker Corporation). P<0.05 was
considered to indicate a statistically significant difference.
Results
Patients
A total of 103 cases were included, with a median
age of 58 years (range, 33–81 years). Of the total, 63 cases were
male (61.2%), and around half (48.5%) of the cases had a history of
smoking. A total of 87 cases (84.5%) had an ECOG score of 0–1, and
16 cases (15.5%) had a score of 2–3. The major pathological type
was adenocarcinoma (76.7%), followed by squamous carcinoma (13.6%),
and other pathology cases accounted for 9.7%. The study included 8
clinical stage IIIb cases (7.8%) and 95 stage IV cases (92.2%)
(Table I).
 | Table I.Characteristics of the patients with
advanced non-small-cell lung cancer in the present study. |
Table I.
Characteristics of the patients with
advanced non-small-cell lung cancer in the present study.
|
| Patients
(n=103) |
|
|---|
|
|
|
|
|---|
|
Characteristics | Disease control
group, (n=51) | Disease progressive
group, (n=52) | P-value |
|---|
| Age (years) |
|
| 0.105 |
|
Median | 57 | 59 |
|
|
Range | 37–81 | 33–79 |
|
| Sex, n, (%) |
|
| 0.200 |
|
Male | 28 (54.9) | 35 (67.3) |
|
|
Female | 23 (45.1) | 17 (32.7) |
|
| Smoking history, n,
(%) |
|
| 0.013 |
| Current
or former smoker | 20 (39.2) | 33 (63.5) |
|
| Never
smoked | 31 (60.8) | 19 (36.5) |
|
| Histology, n,
(%) |
|
| 0.579 |
|
Adenocarcinoma | 42 (82.3) | 37 (71.1) |
|
|
Squamous-cell carcinoma | 3 (5.9) | 11 (21.2) |
|
|
Others | 6 (11.8) | 4 (7.7) |
|
| Stage, n, (%) |
|
| 0.449 |
|
IIIb | 5 (9.8) | 3 (5.8) |
|
| IV | 46 (90.2) | 49 (94.2) |
|
| EGFR-TKIs, n,
(%) |
|
| – |
|
Gefitinib | 11 (21.6) | 13 (25) |
|
|
Erlotinib | 14 (27.5) | 22 (42.3) |
|
|
Icotinib | 26 (50.9) | 17 (32.7) |
|
| RECIST, n, (%) |
|
| – |
| Partial
response | 28 (54.9) | – |
|
| Stable
disease | 23 (45.1) | – |
|
|
Progressive disease | – | 52 (100) |
|
| PFS (months) |
|
| <0.0001 |
|
Median | 9.6 | 0.9 |
|
|
Range | 1.5–20 | 0.5–1 |
|
| OS (months) |
|
| <0.0001 |
|
Median | 13 | 4 |
|
|
Range | 2.2–23 | 0.6–21.8 |
|
| EGFR mutation
status, n, (%) |
|
| <0.001 |
|
Mutant | 25 (49) | 3 (5.8) |
|
| Exon 19
deletions | 11 (21.6) | 0 |
|
| Exon 21
mutations | 12 (23.5) | 3 (5.8) |
|
|
Other | 2 (3.9) | 0 |
|
|
Wild-type | 6 (11.8) | 17 (32.7) |
|
|
Unknown | 20 (39.2) | 32 (61.5) |
|
| ECOG performance
status, n, (%) |
|
| 0.620 |
|
0–1 | 44 (86.3) | 43 (82.7) |
|
|
2–3 | 7 (13.7) | 9 (17.3) |
|
A total of 51 samples were tested for EGFR gene
mutations. The results indicated that around half of the cases
(54.9%) were EGFR mutants, including 11 (21.6%) cases of exon 19
deletion mutation, 15 (29.4%) cases of exon 21 point mutations and
2 cases (3.9%) of exon 18 point mutations (Table I). The median of PFS for mutant and
wild-type patients was 7.75 months and 1 month, respectively
(HR=0.4905, 95% CI=0.2598–0.9260, P=0.028), and the median of OS
was 11 months and 9 months, respectively (HR=0.7049, 95%
CI=0.3919–1.268, P=0.2431).
The median follow-up duration of all 103 cases was 9
months. A total of 51 cases with optimal treatment responses as CR
or PR or SD following EGFR-TKIs therapy for more than one month
were in the control group. The other 52 cases who were
administrated with EGFR-TKIs within one month and whose responses
evaluated as PD were counted in the progressive disease group.
Development of the classification
model
The control and progressive disease cases were
randomly divided into one training group and one test group by a
ratio of 3:2 as previously described (18). The training group included 30 control
cases (control group I) and 30 progressive disease cases
(progressive group I). The other 43 patients were classified into
the test group, including 21 cases in the control group (control
group II) and 22 cases of progressive disease group (progressive
group II).
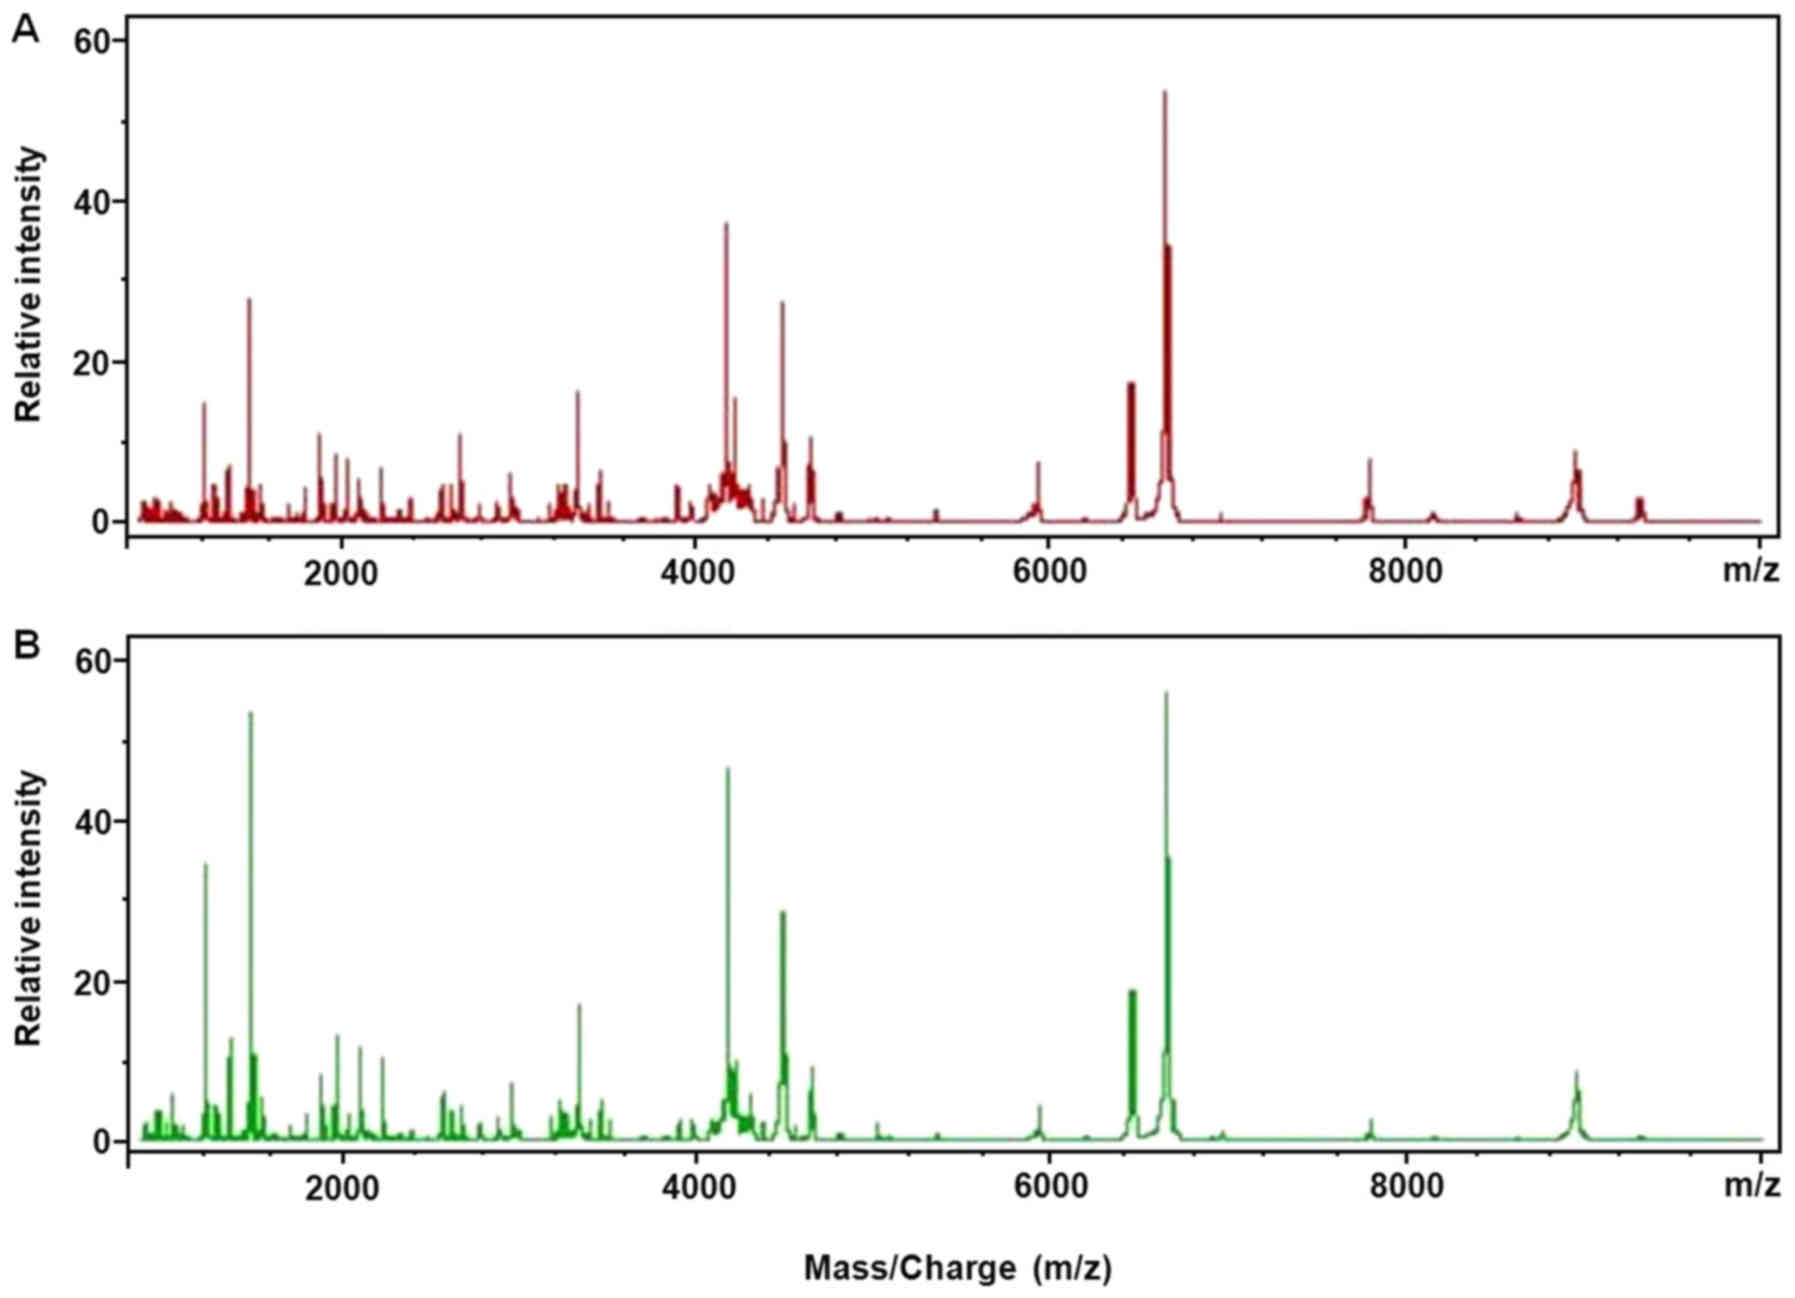
The serum polypeptide fingerprints of control group
I and progression group I are illustrated in Fig. 2. A total of 125 polypeptide peaks were
identified from the fingerprints of control group I and progression
group I by the CPT software. The significant difference was defined
as AUC (area under the curve) >0.8 and P<0.003. Based on
these criteria, a total of 8 differential polypeptides peaks were
obtained between the control group I and progressive group I, whose
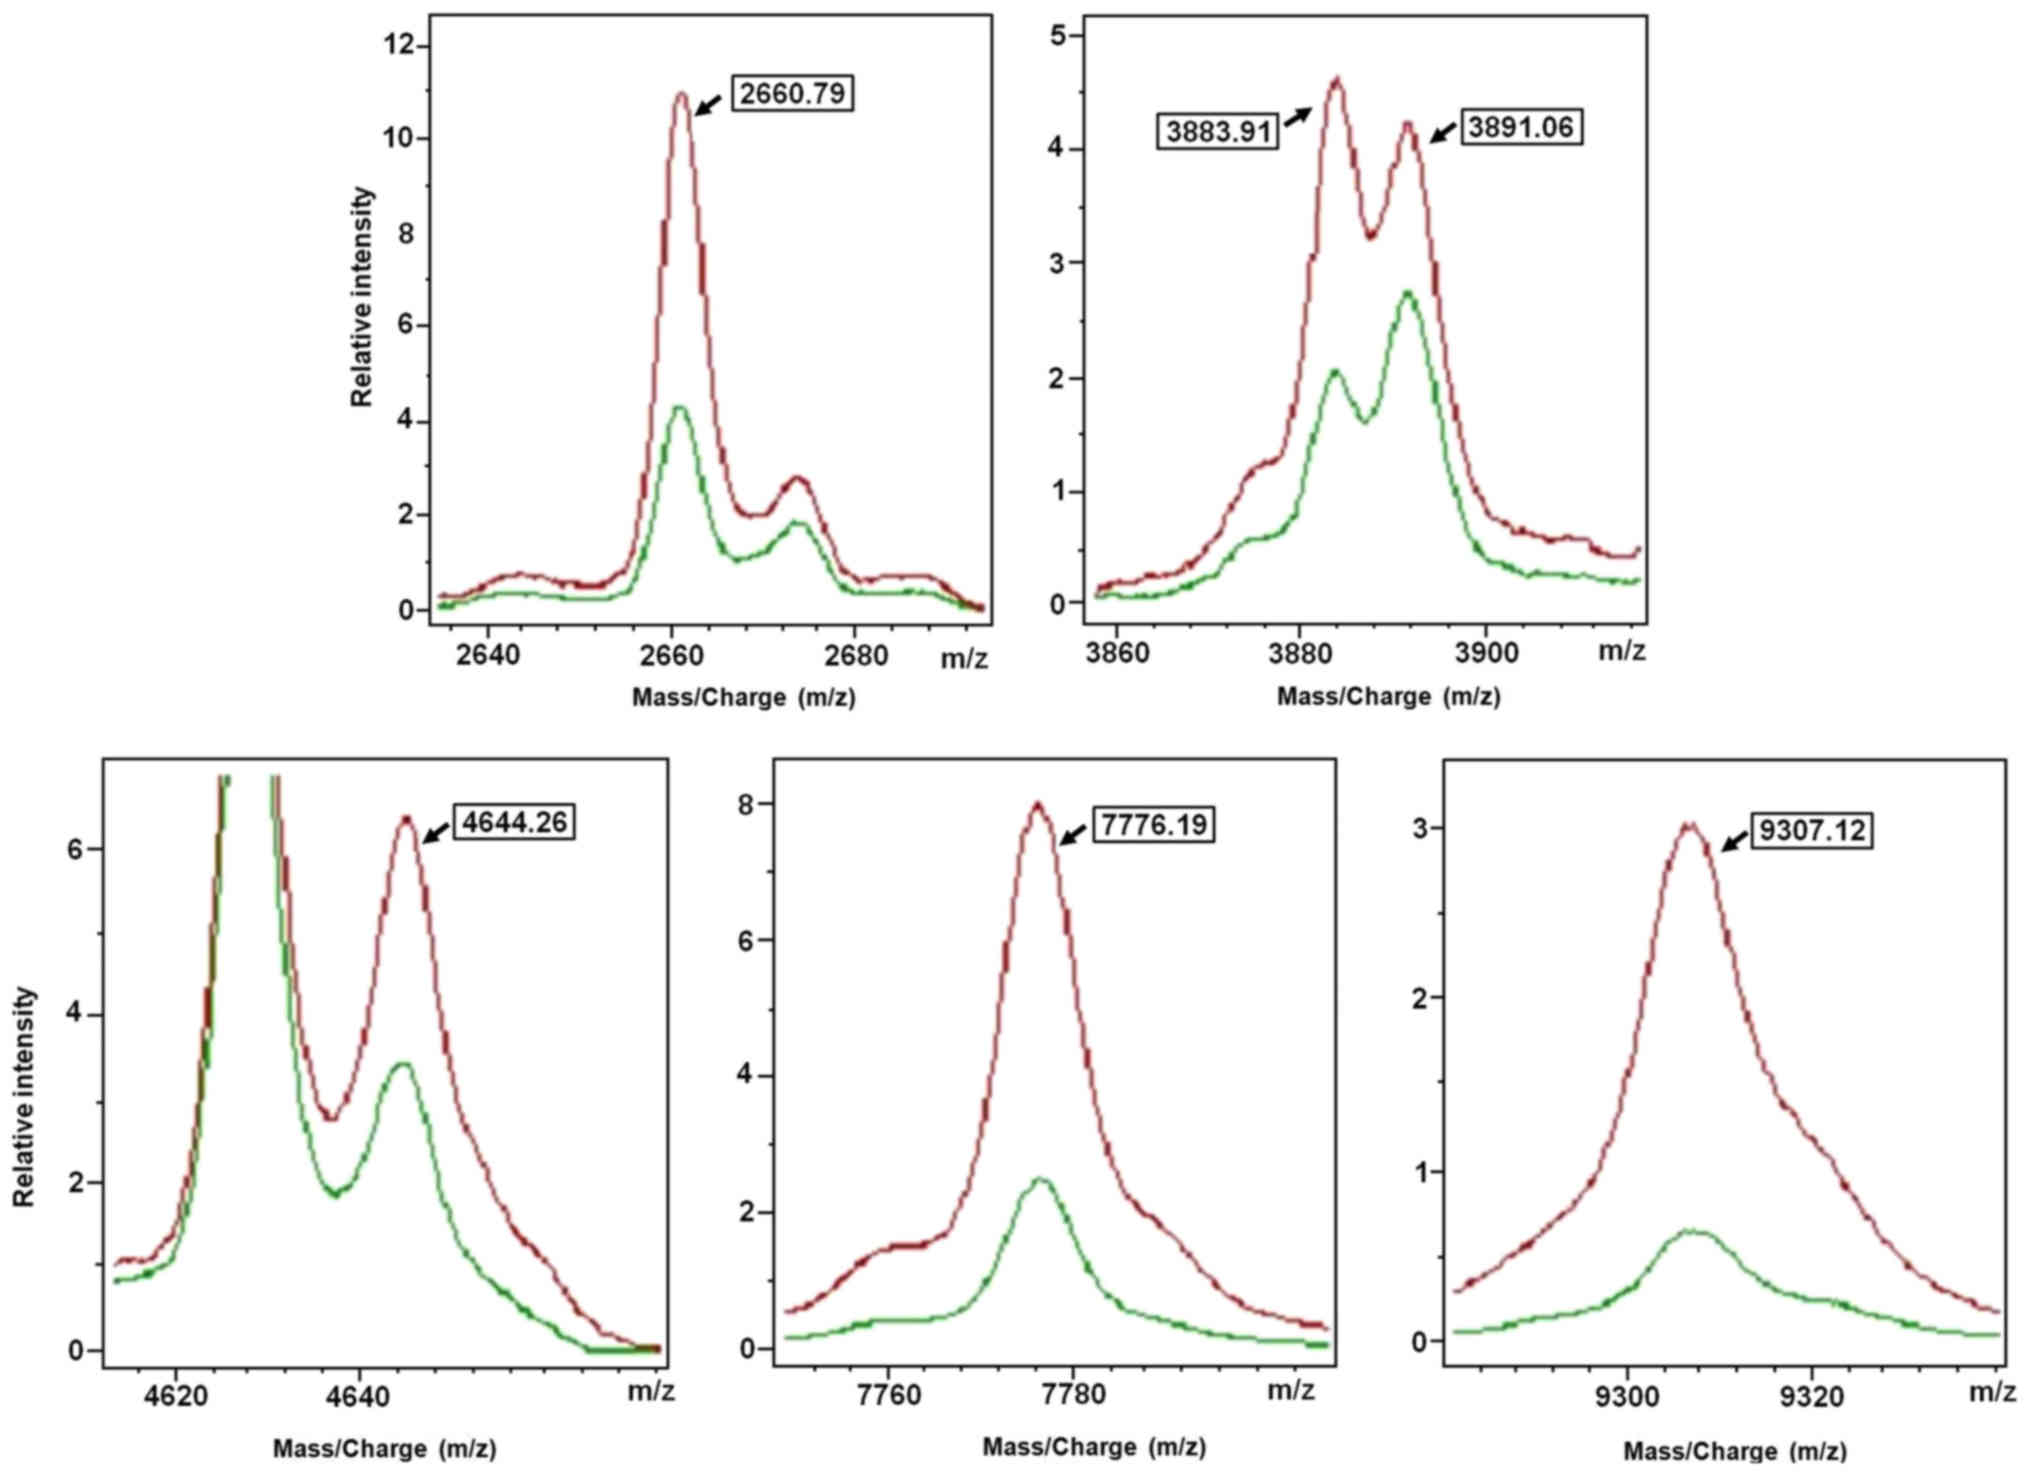
m/z were in the range of 1,000–10,000 Da (Table II). Subsequently, the QC algorithm
calculated 6 polypeptides in the optimal template, which was used
to develop the classification model (Fig.
3 and Table III). It was
defined that, when the 2660.79 Da peak area of the serum
polypeptides was 76.54±46.48, and 3883.91 Da peak area was
44.41±15.41, and 3891.06 Da peak area was 41.24±13.72, and 4644.26
Da peak area was 87.98±34.08 range, and 7776.19 Da peak area was
121.06±64.54, and 9307.12 Da peak area was 74.58±45.55, the sample
was considered from patients of the control group. By contrast,
when 2660.79 Da peak area of the serum polypeptides was
32.84±16.85, and 3883.91 Da peak area was 21.72±10.40, and 3891.06
Da peak area was 25.34±14.62, and 4644.26 Da peak area was
46.58±20.42, and 7776.19 Da peak area was 35.21±26.78, and 9307.12
Da peak area was 17.95±13.86, the sample was considered from
patients of the progressive disease groups. The result indicated
that the identification and predictive rates of the model to
clarify the disease control group were 90 and 93.16%,
respectively.
| Table II.Comparison of serum polypeptides
peaks intensities between the disease progression and disease
control groups. |
Table II.
Comparison of serum polypeptides
peaks intensities between the disease progression and disease
control groups.
| m/z | Progression group I
(n=30), average of peak area ± SD | Control group I
(n=30), average of peak area ± SD | AUC |
|---|
| 3883.91 | 21.72±10.40 | 44.41±15.41 | 0.90a |
| 7776.19 | 35.21±26.78 | 121.06±64.54 | 0.95a |
| 9307.12 | 17.95±13.86 | 74.58±45.55 | 0.97a |
| 4644.26 | 46.58±20.42 | 87.98±34.08 | 0.87a |
| 2660.79 | 32.84±16.85 | 76.54±46.48 | 0.82a |
| 3891.06 | 25.34±14.62 | 41.24±13.72 | 0.81a |
| 7935.17 | 3.12±1.64 | 6.84±4.31 | 0.85a |
| 2379.3 | 10.81±8.09 | 21.54±12.04 | 0.81a |
| Table III.Mass spectral features used in the
classification algorithm for matrix-assisted laser desorption
ionization-time of flight mass spectrometry. |
Table III.
Mass spectral features used in the
classification algorithm for matrix-assisted laser desorption
ionization-time of flight mass spectrometry.
| m/z | Maximum peak drift
(%) | Weight |
|---|
| 2660.79 | 0.1 | 0.0006 |
| 3883.91 | 0.1 | 2.1662 |
| 3891.06 | 0.1 | 0.0012 |
| 4644.26 | 0.1 | 2.2672 |
| 7776.19 | 0.1 | 3.2804 |
| 9307.12 | 0.1 | 7.4200 |
Validation of the classification
model
A total of 43 patients in the test group were used
to validate the classification model. Among 21 control cases, 16
cases were correctly classified. By contrast, among 22 cases in the
progressive disease group, 18 cases were correctly classified by
the classification model. Therefore, the sensitivity of the model
was 76.2% (16/21), and the specificity was 81.8% (18/22). The
accuracy rate was of the model 79.1% (34/43).
Correlation between EGFR mutation
status and classification model
The correlation between the six polypeptides in the
classification model and the expression of EGFR gene was further
analyzed. A total of three polypeptides (m/z=2660.79, m/z=4644.26
and m/z=9307.12) were significantly different between EGFR mutant
and wild-type patients (P=0.036, P=0.025 and P=0.037,
respectively). This meant results the stronger the expression of
the polypeptides, the greater the chance that the EGFR mutations
occur. However, there was no statistically significant difference
in the polypeptides, m/z=3883.91, m/z=3891.06 and m/z=7776.19,
between the two groups (P=0.784, P=0.087 and P=0.060, respectively;
Table IV).
| Table IV.Correlation analysis of epidermal
growth factor receptor mutation status and the polypeptides peaks
intensities in the model. |
Table IV.
Correlation analysis of epidermal
growth factor receptor mutation status and the polypeptides peaks
intensities in the model.
|
| Mutant (n=28) | Wild-type
(n=23) |
|
|
|---|
|
|
|
|
|
|
|---|
| m/z | Mean ± SD | Median (IQR) | Mean ± SD | Median (IQR) | Statistics (Z
score) | P-value |
|---|
| 2660.79 | 0.28±0.13 | 0.29 (0.19) | 0.27±0.13 | 0.28 (0.15) | −2.09 | 0.036 |
| 3883.91 | 0.13±0.03 | 0.12 (0.04) | 0.13±0.03 | 0.13 (0.04) | 0.27 | 0.784 |
| 3891.06 | 0.14±0.06 | 0.13 (0.06) | 0.17±0.07 | 0.17 (0.08) | 1.71 | 0.087 |
| 4644.26 | 0.26±0.07 | 0.25 (0.14) | 0.22±0.06 | 0.24 (0.08) | 2.24 | 0.025 |
| 7776.19 | 0.20±0.05 | 0.20 (0.07) | 0.16±0.07 | 0.15 (0.11) | −1.88 | 0.060 |
| 9307.12 | 0.07±0.03 | 0.07 (0.04) | 0.05±0.03 | 0.05 (0.04) | −2.09 | 0.037 |
Discussion
Individualized treatment under the guidance of
molecular markers is a research hotspot, and it is a current trend
in advanced lung cancer treatment. Although EGFR mutation was a
promising predictor of response to EGFR-TKIs treatment, many
unfavorable conditions limited its usage. At present, some attempts
have been taken to replace tissue specimens with blood, pleural
effusion or other substitute samples that may contain tumor
information for the detection of EGFR mutations (13,15,30).
However, a more constructive attempt is to establish a new
predictor system using proteomic techniques. In the present study,
a classification model was developed using six distinct m/z
features in a training set of patients. For validation in a test
group, the sensitivity, specificity and accuracy rate of the model
were all ~80%. In addition, the intensities of the three
polypeptides in the model were correlated with EGFR mutation
status.
EGFR gene amplification is the most developed method
in the clinic to predict EGFR-TKIs treatment responses (31,32). EGFR
gene amplification is also used to identify the cause of acquired
resistance to EGFR-TKIs by repeated, real-time biopsy (33,34).
However, the difficulty of obtaining tissue samples and the
presence of critical laboratory requirements limited the
application of EGFR-TKI (13,14,30).
In recent years, the development of a new prediction
system has been imminently underway. One relatively new proteomic
technology, MALDI-TOF MS, has been used as a tool to distinguish
differentially expressed profiles in pretreatment serum for
prediction of therapy response. The classification ability of the
VeriStrat test based on the MALDI-TOF MS technique appears to be
similar compared with tumor tissue-based assays (21). The algorithm in VeriStrat uses the
integrated intensities of 8 mass spectral peaks and assigns a
classification label either ‘good’ (VSG) or ‘poor’ (VSP) (21). Multivariate analysis of 111 patients
with NSCLC that were treated with gefitinib indicated that the VSG
group had longer PFS and OS compared with the VSP group (22). The prognostic value of the VeriStrat
classification was further confirmed in the PROSE study, which is a
biomarker-stratified, randomized phase III trial (35). A total of 285 cases of patients with
advanced NSCLC were centrally randomized in a 1:1 ratio to the
second-line treatment of erlotinib or standard chemotherapy
(pemetrexe or dordocetaxel). According to VeriStrat classification
and further stratified analysis, the overall survival of the VSG
group was significantly improved compared with the VSP group. In
addition, the survival of VSP patients who received chemotherapy
was longer compared with those that were administered with
erlotinib. However, the survival of the patients in the VSG group
who received chemotherapy was similar to the patients that were
administered with erlotinib (36).
The aforementioned studies indicated that the serum
proteomic VeriStrat classification was particularly important in
assisting treatment selection between chemotherapy and molecular
targeted therapy for the second-line treatment of patients with
wild-type EGFR and unknown EGFR status. It was recommended that the
patients in the VSP group would receive chemotherapy. For VSG
patients, the treatment response of molecular targeted therapy was
similar compared with the response to chemotherapy.
In the present study, the classification model was
developed based on serum polypeptides detected by MALDI-TOF MS.
However, the m/z values of 6 polypeptides entered in the present
model were different from the findings of VeriStrat (37,38). One
reason might be that the VeriStrat algorithm was developed from
patients with disease progression in less than one month and from
patients with stable disease for more than six months (37), while the present model was based on
differentially expressed spectra from patients with CR, PR or SD
responses and from patients with PD. The differences in the
definitions of treatment outcome may lead to identification of
different polypeptides. On the other hand, the biological rationale
for differential outcome according to MALDI-TOF MS is hypothesized
to be associated with a systemic inflammatory response to tumors
that promotes tumor growth and apoptotic resistance (39). The EGFR mutation rate in the Chinese
population in the present study was different from the one targeted
by VeriStrat, which may result in the induction of different
inflammatory processes and thus different polypeptides. However,
this hypothesis requires further investigation.
In a blinded fashion, the model was verified with an
accuracy rate of ~80%. Lazzari et al (22) investigated the possible changes in
VeriStrat classification from the pretreatment baseline to
treatment withdrawal. It was identified that 30% of cases exhibited
a change, and the majority of the changes were from ‘good’ to
‘poor’. In addition, in 90% of these cases where ‘good’ at the
baseline was changed to ‘poor’, progression was associated with the
development of new lesions (22). As
the definition of ‘disease control’ used in the present model was
not equivalent to the ‘good’ classification as used in VeriStrat,
the change in classification from ‘disease control’ to ‘progressive
disease’ and the change from progressive disease to disease control
may have occurred. This may have resulted in false classification
in the present study.
In the present study, a correlation between EGFR
gene amplification in the plasma sample and expression intensities
of 3 polypeptides peaks in the classification model was identified.
However, other studies did report any significant correlations
between VeriStrat classification and EGFR mutation status or KRAS
mutations (22,40,41). One
may argue that blood samples were used to analyze EGFR mutation
status while other studies detected EGFR amplifications using
tissue specimens. However a number of studies have demonstrated
that EGFR mutation in the plasma (42–45) or
serum (46,47) was consistent with EGFR mutation status
in tissue specimens (42,43,46–48), and
EGFR mutations in blood samples can be used as a predictor of
treatment response from EGFR-TKIs (42–45,48). It
was hypothesized that the primary reason for the differences in m/z
values may be different host background between the present study
and other studies (22,37,38,40,43–48).
As previously established, the rate of EGFR
mutations is markedly higher in Asians compared with other ethnic
groups such as Caucasian (49,50).
Consequently, we suggested that VeriStrat classification might be
more useful to identify patients with primary or secondary
resistance to EGFR-TKIs, while the classification model in the
present study may focus on EGFR-TKI-sensitive populations.
There are two major limitations in the present
study. One limitation was that the control group was not included.
However, the model was verified in an additional separate study
using a control group (data not shown). Another limitation was that
smoking status may be a confounding factor when developing the
model. Stratified analysis with a larger size of samples is
required to avoid this bias.
The mechanisms of EGFR-TKI resistance and
interventions for resistance are topical issues in clinical
research. Using repeated biopsies and detection of EGFR mutations,
it may be possible to identify the mechanisms underlying resistance
and consequently lead to personalized therapy (51,52).
However, repeat biopsy is more difficult to obtain
due to poor material recovered by bronchoscopy and the invasiveness
of the procedure, compared with repeat blood sampling (53,54). By
contrast, the dynamic monitoring of drug-resistant-associated
proteomic indicators in blood samples may be more practical.
Therefore, it is important to the future to observe the stability
of the six polypeptides in the course of treatment and to monitor
the potential correlation between the changes within the six
polypeptides and disease progression.
In conclusion, the present study indicated that as a
non-invasive and practical technique, MALDI-TOF MS analysis of
peripheral blood may be a novel tool that can assist the selection
of personalized treatment and a useful tool to complement
conventional methods, particularly for patients where the
availability of tissue samples is limited for EGFR detection. In
addition, expanded and prospective studies will be considered for
further verification of the dynamic and real-time property of the
model.
Acknowledgements
The authors thank Dr Wei-Xia Wang and Miss Zi-He
Wang (Department of Oncology, Affiliated Hospital of Academy of
Military Medical Sciences, Beijing, China) for sample
collection.
Funding
The present study was supported by the grant of the
National Key Scientific Instrument and Equipment Development
Project (grant no. 2011YQ170067).
Availability of data and materials
The datasets used and/or analyzed during the current
study are available from the corresponding author on reasonable
request.
Authors' contributions
JA and CHT drafted the manuscript. JA, CHT, NW, YL,
JL, BX and KH carried out the MALDI-TOF MS experiment and analyzed
the data. XYL, WFG and HJG collected the clinical samples and data
of patients. XQL participated in the design and coordination of the
study. All authors reviewed the draft manuscript, and read and
approved the final version for submission.
Ethics approval and consent to
participate
The present study was approved by the Ethics
Committee of Academy of Military Medical Sciences (Beijing, China)
in accordance with the medical research regulations of China and
conformed to the provisions of the Declaration of Helsinki in 1995
(as revised in Tokyo 2004). All participants provided written
informed consent.
Consent for publication
All participants provided written informed consent,
and patient information was anonymized.
Competing interests
The authors have declared that no competing
interests exist.
Glossary
Abbreviations
Abbreviations:
|
EGFR
|
epidermal growth factor receptor
|
|
EGFR-TKI
|
epidermal growth factor
receptor-tyrosine kinase inhibitor
|
|
NSCLC
|
non-small-cell lung cancer
|
|
MALDI-TOF MS
|
matrix-assisted laser desorption
ionization-time of flight mass spectrometry
|
|
MBS
|
magnetic bead separator
|
|
PFS
|
progression-free survival
|
|
m/z
|
mass-to-charge ratio
|
|
CR
|
complete response
|
|
PR
|
partial response
|
|
SD
|
stable disease
|
|
PD
|
progressive disease
|
|
HCCA
|
α-cyano-4-hydroxycinnamic acid
|
|
ECOG
|
Eastern Cooperative Oncology Group
|
|
OS
|
overall survival
|
References
|
1
|
World Health Organization: Cancer.
http://www.who.int/mediacentre/factsheets/fs297/en/April
23–2015
|
|
2
|
Stewart EL, Tan SZ, Liu G and Tsao MS:
Known and putative mechanisms of resistance to EGFR targeted
therapies in NSCLC patients with EGFR mutations-a review. Transl
Lung Cancer Res. 4:67–81. 2015.PubMed/NCBI
|
|
3
|
Pao W and Chmielecki J: Rational,
biologically based treatment of EGFR-mutant non-small-cell lung
cancer. Nat Rev Cancer. 10:760–774. 2010. View Article : Google Scholar : PubMed/NCBI
|
|
4
|
Sequist LV, Joshi VA, Jänne PA, Muzikansky
A, Fidias P, Meyerson M, Haber DA, Kucherlapati R, Johnson BE and
Lynch TJ: Response to treatment and survival of patients with
non-small cell lung cancer undergoing somatic EGFR mutation
testing. Oncologist. 12:90–98. 2007. View Article : Google Scholar : PubMed/NCBI
|
|
5
|
Tsao MS, Sakurada A, Cutz JC, Zhu CQ,
Kamel-Reid S, Squire J, Lorimer I, Zhang T, Liu N, Daneshmand M, et
al: Erlotinib in lung cancer-molecular and clinical predictors of
outcome. N Engl J Med. 353:133–144. 2005. View Article : Google Scholar : PubMed/NCBI
|
|
6
|
Taniguchi Y, Tamiya A, Nakahama K, Naoki
Y, Kanazu M, Omachi N, Okishio K, Kasai T and Atagi S: Impact of
metastatic status on the prognosis of EGFR mutation-positive
non-small cell lung cancer patients treated with first-generation
EGFR-tyrosine kinase inhibitors. Oncol Lett. 14:7589–7596.
2017.PubMed/NCBI
|
|
7
|
Jackman D, Pao W, Riely GJ, Engelman JA,
Kris MG, Jänne PA, Lynch T, Johnson BE and Miller VA: Clinical
definition of acquired resistance to epidermal growth factor
receptor tyrosine kinase inhibitors in non-small-cell lung cancer.
J Clin Oncol. 28:357–360. 2010. View Article : Google Scholar : PubMed/NCBI
|
|
8
|
Laurila N and Koivunen JP: EGFR inhibitor
and chemotherapy combinations for acquired TKI resistance in
EGFR-mutant NSCLC models. Med Oncol. 32:2052015. View Article : Google Scholar : PubMed/NCBI
|
|
9
|
Hirsch FR, Varella-Garcia M, Bunn PA Jr,
Franklin WA, Dziadziuszko R, Thatcher N, Chang A, Parikh P, Pereira
JR, Ciuleanu T, et al: Molecular predictors of outcome with
gefitinib in a phase III placebo-controlled study in advanced
non-small-cell lung cancer. J Clin Oncol. 24:5034–5042. 2006.
View Article : Google Scholar : PubMed/NCBI
|
|
10
|
Lynch TJ, Bell DW, Sordella R,
Gurubhagavatula S, Okimoto RA, Brannigan BW, Harris PL, Haserlat
SM, Supko JG, Haluska FG, et al: Activating mutations in the
epidermal growth factor receptor underlying responsiveness of
non-small-cell lung cancer to gefitinib. N Engl J Med.
350:2129–2139. 2004. View Article : Google Scholar : PubMed/NCBI
|
|
11
|
Paez JG, Jänne PA, Lee JC, Tracy S,
Greulich H, Gabriel S, Herman P, Kaye FJ, Lindeman N, Boggon TJ, et
al: EGFR mutations in lung cancer: Correlation with clinical
response to gefitinib therapy. Science. 304:1497–1500. 2004.
View Article : Google Scholar : PubMed/NCBI
|
|
12
|
Sharma SV, Bell DW, Settleman J and Haber
DA: Epidermal growth factor receptor mutations in lung cancer. Nat
Rev Cancer. 7:169–181. 2007. View
Article : Google Scholar : PubMed/NCBI
|
|
13
|
Ellison G, Zhu G, Moulis A, Dearden S,
Speake G and McCormack R: EGFR mutation testing in lung cancer: A
reivew of available methods and their use for analysis of tumor
tissue and cytology samples. J Clin Pathol. 66:79–89. 2013.
View Article : Google Scholar : PubMed/NCBI
|
|
14
|
Kitamura A, Hosoda W, Sasaki E, Mitsudomi
T and Yatabe Y: Immunohistochemical detection of EGFR mutation
using mutation-specific antibodies in lung cancer. Clin Cancer Res.
16:3349–3355. 2010. View Article : Google Scholar : PubMed/NCBI
|
|
15
|
Sandanayake NS, Camuzeaux S, Sinclair J,
Blyuss O, Andreola F, Chapman MH, Webster GJ, Smith RC, Timms JF
and Pereira SP: Identification of potential serum peptide
biomarkers of biliary tract cancer using MALDI MS profiling. BMC
Clin Pathol. 14:72014. View Article : Google Scholar : PubMed/NCBI
|
|
16
|
Callesen AK, Madsen JS, Vach W, Kruse TA,
Mogensen O and Jensen ON: Serum protein profiling by solid phase
extraction and mass spectromety: A future diagnostics tools?
Proteomics. 9:1428–1441. 2009. View Article : Google Scholar : PubMed/NCBI
|
|
17
|
Lopez MF, Mikulskis A, Kuzdzal S, Golenko
E, Petricoin EF III, Liotta LA, Patton WF, Whiteley GR, Rosenblatt
K, Gurnani P, et al: A novel, high-throughput workflow for
discovery and identification of serum carrier protein-bound peptide
biomarker candidates in ovarian cancer samples. Clin Chem.
53:1067–1074. 2007. View Article : Google Scholar : PubMed/NCBI
|
|
18
|
Han KQ, Huang G, Gao CF, Wang XL, Ma B,
Sun LQ and Wei ZJ: Identification of lung cancer patients by serum
protein profiling using surface-enhanced laser
desorption/ionization time-of-flight mass spectrometry. Am J Clin
Oncol. 31:133–139. 2008. View Article : Google Scholar : PubMed/NCBI
|
|
19
|
Koopmann J, Zhang Z, White N, Rosenzweig
J, Fedarko N, Jagannath S, Canto MI, Yeo CJ, Chan DW and Goggins M:
Serum diagnosis of pancreatic adenocarcinoma using surface-enhanced
laser desorption and ionization mass spectrometry. Clin Cancer Res.
10:860–868. 2004. View Article : Google Scholar : PubMed/NCBI
|
|
20
|
Li J, Zhang Z, Rosenzweig J, Wang YY and
Chan DW: Proteomics and bioinformatics approaches for
identification of serum biomarkers to detect breast cancer. Clin
Chem. 48:1296–1304. 2002.PubMed/NCBI
|
|
21
|
Taguchi F, Solomon B, Gregorc V, Roder H,
Gray R, Kasahara K, Nishio M, Brahmer J, Spreafico A, Ludovini V,
et al: Mass spectrometry to classify non-small-cell lung cancer
patients for clinical outcome after treatment with epidermal growth
factor receptor tyrosine kinase inhibitors: A multicohort
cross-institutional study. J Natl Cancer Inst. 99:838–846. 2007.
View Article : Google Scholar : PubMed/NCBI
|
|
22
|
Lazzari C, Spreafico A, Bachi A, Roder H,
Floriani I, Garavaglia D, Cattaneo A, Grigorieva J, Viganò MG,
Sorlini C, et al: Changes in plasma mass-spectral profile in course
of treatment of non-small cell lung cancer patients with epidermal
growth factor receptor tyrosine kinase inhibitors. J Thorac Oncol.
7:40–48. 2012. View Article : Google Scholar : PubMed/NCBI
|
|
23
|
Hirsch FR and Bunn PA Jr: EGFR testing in
lung cancer is ready for prime time. Lancet Oncol. 10:432–433.
2009. View Article : Google Scholar : PubMed/NCBI
|
|
24
|
Mitsudomi T, Kosaka T and Yatabe Y:
Biological and clinical implications of EGFR mutations in lung
cancer. Int J Clin Oncol. 11:190–198. 2006. View Article : Google Scholar : PubMed/NCBI
|
|
25
|
Schiller JH, Harrington D, Belani CP,
Langer C, Sandler A, Krook J, Zhu J and Johnson DH: Eastern
Cooperative Oncology Group: Comparison of four chemotherapy
regimens for advanced non-small-cell lung cancer. N Engl J Med.
346:92–98. 2002. View Article : Google Scholar : PubMed/NCBI
|
|
26
|
Sandler A, Gray R, Perry MC, Brahmer J,
Schiller JH, Dowlati A, Lilenbaum R and Johnson DH:
Paclitaxel-carboplatn alone or with bevacizumab for non-small-cell
lung cancer. N Engl J Med. 355:2542–2550. 2006. View Article : Google Scholar : PubMed/NCBI
|
|
27
|
Eisenhauer EA, Therasse P, Bogaerts J,
Schwartz LH, Sargent D, Ford R, Dancey J, Arbuck S, Gwyther S,
Mooney M, et al: New response evaluation criteria in solid tumors:
Revised RECIST guideline (version 1.1). Eur J Cancer. 45:228–247.
2009. View Article : Google Scholar : PubMed/NCBI
|
|
28
|
Carlson RV, Boyd KM and Webb DJ: The
revision of the Declaration of Helsinki: Past, present and future.
Br J Clin Pharmacol. 57:695–713. 2004. View Article : Google Scholar : PubMed/NCBI
|
|
29
|
Liu X, Lu Y, Zhu G, Lei Y, Zheng L, Qin H,
Tang C, Ellison G, McCormack R and Ji Q: The diagnostic accuracy of
pleural effusion and plasma samples versus tumour tissue for
detection of EGFR mutation in patients with advanced non-small cell
lung cancer: Comparison of methodologies. J Clin Pathol.
66:1065–1069. 2013. View Article : Google Scholar : PubMed/NCBI
|
|
30
|
Kim CH, Kim SH, Park SY, Yoo J, Kim SK and
Kim HK: Identification of EGFR mutations by immunohistochemistry
with EGFR Mutation-specific antibodies in biopsy and resection
specimens from pulmonary adenocarcinoma. Cancer Res Threat.
47:653–660. 2015. View Article : Google Scholar
|
|
31
|
Yang L, Tang C, Xu B, Wang W, Li J, Li X,
Qin H, Gao H, He K, Song S and Liu X: Classification of epidermal
growth factor receptor gene mutation status using serum proteomic
profiling predicts tumor response in patients with stage IIIB or IV
Non-small-cell lung cancer. PLoS One. 10:e01289702015. View Article : Google Scholar : PubMed/NCBI
|
|
32
|
Zhou J, Wang J, Zeng Y, Zhang X, Hu Q,
Zheng J, Chen B, Xie B and Zhang WM: Implication of
epithelial-mesenchymal transition in IGF1R-induced resistance to
EGFR-TKIs in advanced non-small cell lung cancer. Oncotarget.
6:44332–44345. 2015. View Article : Google Scholar : PubMed/NCBI
|
|
33
|
Xu J, Wang J and Zhang S: Mechanisms of
resistance to irreversible epidermal growth factor receptor
tyrosine kinase inhibitors and therapeutic strategies in non-small
cell lung cancer. Oncotarget. 8:90557–90578. 2017.PubMed/NCBI
|
|
34
|
Mansuet-Lupo A, Zouiti F, Alifano M,
Tallet A, Charpentier MC, Ducruit V, Devez F, Lemaitre F,
Laurent-Puig P, Damotte D and Blons H: Intratumoral distribution of
EGFR mutations and copy number in metastatic lung cancer, what
impact on the initial molecular diagnosis? J Transl Med.
12:1312014. View Article : Google Scholar : PubMed/NCBI
|
|
35
|
Gregorc V, Novello S, Lazzari C, Barni S,
Aieta M, Mencoboni M, Grossi F, De Pas T, de Marinis F, Bearz A, et
al: Predictive value of a proteomic signature in patients with
non-small-cell lung cancer treated with second-line erlotinib or
chemotherapy (PROSE): A biomarker-stratified, randomised phase 3
trial. Lancet Oncol. 15:713–721. 2014. View Article : Google Scholar : PubMed/NCBI
|
|
36
|
Lazzari C, Novello S, Barni S, Aieta M, De
Marinis F, De Pas T, Grossi F, Mencoboni M, Bearz A, Floriani I, et
al: Randomized proteomic stratified phase III study of second-line
erlotinib (E) versus chemotherapy (CT) in patients with inoperable
non-small cell lung cancer (PROSE). J Clin Oncol. 31:2013.DOI:
10.1200/jco.2013.31. View Article : Google Scholar
|
|
37
|
Kuiper JL, Lind JS, Groen HJ, Roder J,
Grigorieva J, Roder H, Dingemans AM and Smit EF:
VeriStrat® has prognostic value in advanced stage NSCLC
patients treated with erlotinib and sorafenib. Br J Cancer.
107:1820–1825. 2012. View Article : Google Scholar : PubMed/NCBI
|
|
38
|
Carbone DP, Ding K, Roder H, Grigorieva J,
Roder J, Tsao MS, Seymour L and Shepherd FA: Prognostic and
predictive role of the VeriStrat plasma test in patients with
advanced non-small-cell lung cancer treated with erlotinib or
placebo in the NCIC clinical trials group BR.21 tiral. J Thorac
Oncol. 7:1653–1660. 2012. View Article : Google Scholar : PubMed/NCBI
|
|
39
|
Milan E, Lazzari C, Anand S, Floriani I,
Torri V, Sorlini C, Gregorc V and Bachi A: SAA1 is over-expressed
in plasma of non small cell lung cancer patients with poor outcome
after treatment with epidermal growth factor receptor
tyrosine-kinase inhibitors. J Proteomics. 76:91–101. 2012.
View Article : Google Scholar : PubMed/NCBI
|
|
40
|
Amann JM, Lee JW, Roder H, Brahmer J,
Gonzalez A, Schiller JH and Carbone DP: Genetic and proteomic
features associated with survival after treatment with erlotinib in
first-line therapy of non-small cell lung cancer in Eastern
Cooperative Oncology Group 3503. J Thorac Oncol. 5:169–178. 2010.
View Article : Google Scholar : PubMed/NCBI
|
|
41
|
Chung CH, Seeley EH, Roder H, Grigorieva
J, Tsypin M, Roder J, Burtness BA, Argiris A, Forastiere AA,
Gilbert J, et al: Detection of tumor epidermal growth factor
receptor pathway dependence by serum mass spectrometry in cancer
patients. Cancer Epidemiol Biomarkers Prev. 19:358–365. 2010.
View Article : Google Scholar : PubMed/NCBI
|
|
42
|
Bai H, Mao L, Wang HS, Zhao J, Yang L, An
TT, Wang X, Duan CJ, Wu NM, Guo ZQ, et al: Epidermal growth factor
receptor mutations in plasma DNA samples predict tumor response in
Chinese patients with stages IIIB to IV non-small-cell lung cancer.
J Clin Oncol. 27:2653–2659. 2009. View Article : Google Scholar : PubMed/NCBI
|
|
43
|
He C, Liu M, Zhou C, Zhang J, Ouyang M,
Zhong N and Xu J: Detection of epidermal growth factor receptor
mutations in plasma by mutant-enriched PCR assay for prediction of
the response to gefitinib in patients with non-small-cell lung
cancer. Int J Cancer. 125:2393–2399. 2009. View Article : Google Scholar : PubMed/NCBI
|
|
44
|
Jian G, Songwen Z, Ling Z, Qinfang D, Jie
Z, Liang T and Caicun Z: Prediction of epidermal growth factor
receptor mutations in the plasma/pleural effusion to efficacy of
gefitinib treatment in advanced non-small cell lung cancer. J
Cancer Res Clin Oncol. 136:1341–1347. 2010. View Article : Google Scholar : PubMed/NCBI
|
|
45
|
Mack PC, Holland WS, Burich RA, Sangha R,
Solis LJ, Li Y, Beckett LA, Lara PN Jr, Davies AM and Gandara DR:
EGFR mutations detected in plasma are associated with patient
outcomes in erlotinib plus docetaxel-treated non-small cell lung
cancer. J Thorac Oncol. 4:1466–1472. 2009. View Article : Google Scholar : PubMed/NCBI
|
|
46
|
Kimura H, Kasahara K, Shibata K, Sone T,
Yoshimoto A, Kita T, Ichikawa Y, Waseda Y, Watanabe K, Shiarasaki
H, et al: EGFR mutation of tumor and serum in gefitinib-treated
patients with chemotherapy-naive non-small cell lung cancer. J
Thorac Oncol. 1:260–267. 2006. View Article : Google Scholar : PubMed/NCBI
|
|
47
|
Kimura H, Suminoe M, Kasahara K, Sone T,
Araya T, Tamori S, Koizumi F, Nishio K, Miyamoto K, Fujimura M and
Nakao S: Evaluation of epidermal growth factor receptor mutation
status in serum DNA as a predictor of response to gefitinib
(IRESSA). Br J Cancer. 97:778–784. 2007. View Article : Google Scholar : PubMed/NCBI
|
|
48
|
Kuang Y, Rogers A, Yeap BY, Wang L,
Makrigiorgos M, Vetrand K, Thiede S, Distel RJ and Jänne PA:
Noninvasive detection of EGFR T790M in gefitinib or erlotinib
resistant non-small cell lung cancer. Clin Cancer Res.
15:2630–2636. 2009. View Article : Google Scholar : PubMed/NCBI
|
|
49
|
Chen YM: Update of epidermal growth factor
receptor-tyrosine kinase inhibitors in non-small-cell lung cancer.
J Chin Med Assoc. 76:249–257. 2013. View Article : Google Scholar : PubMed/NCBI
|
|
50
|
Shiau CJ, Babwah JP, da Cunha Santos G,
Sykes JR, Boerner SL, Geddie WR, Leighl NB, Wei C, Kamel-Reid S,
Hwang DM and Tsao MS: Sample features associated with success rates
in population-based EGFR mutation testing. J Thorac Oncol.
9:947–956. 2014. View Article : Google Scholar : PubMed/NCBI
|
|
51
|
Socinski MA, Villaruz LC and Ross J:
Understanding mechanisms of resistance in the epithelial growth
factor receptor in non-small cell lung cancer and the role of
biopsy at progression. Oncologist. 22:3–11. 2017. View Article : Google Scholar : PubMed/NCBI
|
|
52
|
Doebele RC, Pilling AB, Aisner DL,
Kutateladze TG, Le AT, Weickhardt AJ, Kondo KL, Linderman DJ,
Heasley LE, Franklin WA, et al: Mechanisms of resistance to
crizotinib in patients with AKL gene rearranged non-small cell lung
cancer. Clin Cancer Res. 18:1472–1482. 2012. View Article : Google Scholar : PubMed/NCBI
|
|
53
|
Travis WD, Brambilla E, Noguchi M,
Nicholson AG, Geisinger K, Yatabe Y, Powell CA, Beer D, Riely G,
Garg K, et al: International association for the study of lung
Cancer/American Thoracic Society/European respiratory society:
International multidisciplinary classification of lung
adenocarcinoma: Executive summary. Proc Am Thorac Soc. 8:381–385.
2011. View Article : Google Scholar : PubMed/NCBI
|
|
54
|
Ou SH, Bartlett CH, Mino-Kenudson M, Cui J
and Iafrate AJ: Crizotinib for the treatment of ALK-rearranged
non-small cell lung cancer: A success story to usher in the second
decade of molecular targeted therapy in oncology. Oncologist.
17:1351–1375. 2012. View Article : Google Scholar : PubMed/NCBI
|