Introduction
The standard treatment for non-muscle invasive
bladder cancer is transurethral resection of the tumor (TUR)
followed by intravesical instillation of lyophilized Bacillus
Calmette-Guérin (BCG) (1). BCG
induces a non-specific immune response that is believed to remove
remnant tumor cells (1) and direct
BCG interaction with cancer cells may have a role in this response
(2).
BCG is internalized by bladder cancer cells via the
α5β1 integrin complex (3), and
cross-linking of this receptor by BCG induces gene expression
(4). The internalization process
occurs via micropinocytosis (5), as
opposed to phagocytosis. BCG internalization is associated with
decreased production of reactive oxygen species (ROS) and thiols
(6) and increased cell death.
BCG-induced cell death has been revealed to be associated with NO
production (7), and is necrotic,
involving the release of HMGB1, which exhibits paracrine effects on
urothelial cells (8).
Lyophilized and live BCG induce differential ROS
modulation in A549 lung epithelial cancer cells (9) and human bladder cancer cell lines
(10), probably as lyophilized
preparations contain extruded cellular components, secreted BCG
proteins and whole bacteria. Similarly, intravesical instillation
of live and inactivate BCG preparations in mice induced
differential cytokine/chemokine gene expression (11).
The present study further elucidates the cellular
changes induced by BCG interaction with cancer cells in the
clinical time-frame of 2 h. In this time frame, RNA expression
changes are easily detected compared with changes in protein
levels. A stimulated cell may trigger novel mRNA synthesis within a
few min, but protein production requires a longer time period. The
genes induced within 2 h will generate proteins that will in turn
lead to the expression of other genes. Therefore, studies
evaluating expression at time points beyond 2 h are examining
primary, secondary or even tertiary responses to the original
stimulus. Genes whose expression is triggered immediately following
interaction with BCG may be specific markers of the response to BCG
immunotherapy.
Several BCG strains are used to treat bladder
cancer. Genetic analyses have indicated that these strains have
genetic differences (12,13) that affect their anti-proliferative
effects on human bladder cancer cell lines. Therefore, the ability
of the two most commonly used BCG strains, namely BCG Connaught and
Tice, to modulate gene expression was compared. It was hypothesized
that genes induced by these similar strains are likely to be
important for the response of cells to BCG.
To evaluate gene expression changes, human bladder
cancer cell lines with known differential ability to internalize
BCG (14) were exposed to BCG for 2 h
in the present study. This allowed differentiation between
responses induced by BCG internalization, and identification of
those responses likely to be induced by membrane interactions. The
effect of major BCG soluble proteins Ag85B and Mycobacterium
protein tyrosine phosphatase A (MptpA) on gene expression was also
determined. RNA was extracted from these cells, subjected to the
representational differential analysis (RDA) (15) and used to probe oligo arrays to
identify differentially expressed genes.
Materials and methods
Preparation of bacteria
Lyophilized BCG strains [(Connaught; Sanofi S.A.,
Paris, France) and Tice (Merck Sharp & Dohme, Whitehouse
Station, NJ, USA)] were prepared as previously described (10). BCG was maintained in 7H9 Middlebrook
media (Difco™; BD Biosciences, Franklin, NJ, USA)
supplemented with 10% ADC supplement (0.85% NaCl, 5% bovine serum
albumin fraction V, 2% dextrose and 0.003% catalase; Sigma-Aldrich;
Merck KGaA, Darmstadt, Germany), 0.05% Tween-80 and 0.2% glycerol.
Live Connaught BCG was grown on 7H10 Middlebrook agar supplemented
with 10% ADC supplement, 0.05% Tween-80 and 0.5% glycerol, and
single colonies were selected for growth. BCG cultures were
harvested at 0.7 to 0.8 OD600nm at the exponential
phase. The formula OD600nm 0.1=2.6×10⁶ colony
forming units (c.f.u.)/ml was established by plating serial
dilutions of BCG culture on 7H10 Middlebrook agar with
supplements.
Mammalian cell culture
Human transitional cell carcinoma cell lines MGH,
RT4 and J82 (American Type Culture Collection, Manassas, VA, USA)
were cultured in RPMI (Biowest, Nuaillé, France) supplemented with
10% heat inactivated fetal bovine serum (Biowest), 2 mM
L-glutamine, 50 U/ml penicillin G and 50 µg/ml streptomycin at 37°C
in 5% CO2 and routinely passaged when 85–90% confluent.
The cells (2×10⁶) plated overnight were incubated with
2×10⁷ cfu live or lyophilized BCG at 37°C for 2 h. A
Transwell device blocked direct contact between BCG and the cells.
Sodium orthovandate (100 µM) inhibited tyrosine phosphatase
activity. Purified MptpA at 0.5 µg/ml and 5 µg/ml, prepared as
described previously (10), was added
to the cells at 37°C for 2 h, and RNA was isolated. Ag85B
(Sigma-Aldrich; Merck KGaA) at a concentration of 1 µg/ml was added
to the cells. For verification of gene expression, the experiments
were performed three times in duplicate.
RNA extraction and RDA
MGH (6×10⁵) cells were plated in a 10 mm
cell culture dish overnight prior to treatment with
6×10⁷ cfu of lyophilized BCG at 37°C for 2 h. Total RNA
was extracted using TRIzol® (Invitrogen; Thermo Fisher
Scientific, Inc., Waltham, MA, USA). Then, poly A+ RNA
was isolated using the Oligotex® mRNA midi kit (Qiagen,
Inc., Valencia, CA, USA) and converted to cDNAs with
Riboclone® cDNA Synthesis system (Promega Corporation,
Madison, WI, USA), according to the manufacturer's protocols. The
RDA was performed as described by Pastorian et al (15). The samples with and without BCG
treatment were subjected to repeated rounds of subtractive
hybridization at 1:10, 1:100 and 1:5,000 tester to driver ratios.
Only products that were upregulated in the tester population were
amplifiable by polymerase chain reaction (PCR). The PCR amplified
products were ligated into pGEM®T Easy Vector (Promega
Corporation), transformed into DH5α cells and positive clones were
selected on LB agar plates with 100 µg/ml ampicillin. Plasmid DNA
was isolated (Promega Corporation) and sequenced with-21M13 forward
primers (5′-GTAAAACGACGGCCAGT-3′) using the BigDye version 3.0
system (Applied Biosystems; Thermo Fisher Scientific, Inc.). The
sequencing results were identified using the BLAST algorithm
(https://blast.ncbi.nlm.nih.gov/Blast.cgi).
Expression array analysis
PolyA+ mRNA samples were converted to
Biotin-16-UTP (Roche Diagnostics, Indianapolis, IN, USA) labeled
cRNA using the TrueLabelling-AMP™ Linear RNA
Amplification kit (SABiosciences, Frederick, MD, USA). The labeled
cRNA was purified from interfering free Biotin-16-UTP using the
Array Grade cRNA Cleanup kit (SABiosciences). The yield of cRNA
samples were quantified using the formula as follows: Concentration
(µg/ml)=OD260×40 × dilution factor (dilution factor, 350). The
Inflammatory Cytokines and Receptors and Toxicology and Drug
Resistance microarray (OHS401, SABiosciences) was assayed as
previously described (16).
Chemiluminescence detection was performed using the SABiosciences
Chemiluminescent Detection Kit and X-ray films. Blot intensity
analysis was performed using SABiosciences GEArray Expression
Analysis Suite online software (http://saweb2.sabiosciences.com/support_software.php).
Reverse transcription (RT-PCR
A total of ~5 µg of RNA was pre-treated with 1 U
DNAse in 1X DNAse buffer (20 mM Tris.Cl pH 8.4, 20 mM
MgCl2, 500 mM KCl) and 40 U RNAsin for 15 min at room
temperature, and digestion was terminated by the addition of EDTA
(final concentration, 2.5 mM). Oligo dT (0.5 µg) was added, and the
mixture was incubated at 65°C for 10 min, then chilled on ice for 5
min prior to the addition of the cDNA synthesis buffer (50 mM Tris
pH 8.3, 75 mM KCl, 3 mM MgCl2), 0.5 mM dNTPs (Promega
Corporation), 8 U RNAsin (Promega Corporation), 200 U SuperScript
II enzyme (Invitrogen; Thermo Fisher Scientific, Inc.) and
incubation at 42°C for 50 min. The reaction was terminated by
heating at 70°C for 15 min, and then the samples were diluted with
180 µl TE buffer (20 mM Tris pH 8.0, 1 mM EDTA). PCR was performed
on cDNAs (5 µl) with 0.5 µM gene-specific primers, 0.2 mM dNTPs,
0.5 U DyNAzyme™ DNA polymerase (Finnzymes; Thermo Fisher
Scientific, Inc.) in 10 mM Tris pH 8.8, 50 mM KCl, 1.5 mM
MgCl2 and 0.1% Triton® X-100. The PCR
products were separated on a 1.5% agarose gel, and the relative
density of the gene-specific PCR products and ribosomal protein
S27a (RPS27A) was determined using the GeneTools densitometry
software (version 3.0; Syngene Europe, Cambridge, UK). Gene
expression data is presented as the mean ± standard error. Table I lists the sequences of the PCR
primers, annealing temperature and size of the PCR products. The
thermocycling conditions comprise one initial denaturation step at
94°C for 5 min followed by repeated amplification cycles of 94°C,
primer annealing temperature and 72°C for 30 sec each and one final
extension step at 72°C for 5 min. The appropriate number of PCR
cycles for each primer set was determined by plotting the density
of the PCR products at 30, 35 and 40 cycles. For the majority of
the genes, 30 and 35 cycles were suitable for differential
expression analysis.
 | Table I.Primers and conditions for polymerase
chain reaction. |
Table I.
Primers and conditions for polymerase
chain reaction.
| Gene | Forward
(5′-3′) | Reverse
(5′-3′) | Temperature,
°C | Size, bp |
|---|
| TNFα |
GTGTGGCCTGCACAGTGA |
GGAGCAGAGGCTCAGCAA | 56 | 550 |
| IL1β |
ACATGCCCGTCTTCCTGG |
GGGAAGCGGTTGCTCATC | 56 | 421 |
| TOLLIP |
GGACAGGCTTGTCTGCCA |
CGCACGTTCTGAGACCAC | 56 | 317 |
| CCL20 |
GCCAATGAAGGCTGTGAC |
ACAAGTCCAGTGAGGCAC | 54 | 262 |
| CSF2 |
CAGGAGCCGACCTGCCTA |
TCAGGGTCAGTGTGGCCC | 58 | 388 |
| IL10RB |
CCTTAGAGGTCGAGGCAG |
GTCCGTGCTCTGTGTAGC | 56 | 420 |
| CXCL6 |
CCAGTCTTCAGCGGAGCA |
CCTCCCTCAACAGCACAC | 54 | 384 |
| IL12A |
AATGGGAGTTGCCTGGCC |
ACGGTTTGGAGGGACCTC | 56 | 364 |
| CXCL5 |
GGACCAGAGAGAGCTTGG |
GTGTGTCCCACCAGGACT | 56 | 373 |
| IL11RA |
TCTGGCTGAGGCTGAGAC |
TCCCTGCCTCACAGACAC | 56 | 370 |
| IL15RA |
AGCTTCCCAGGAGAGACC |
TCCCAGGTCCCTGTCCAT | 56 | 279 |
| SCYE1 |
TGGAGAGAGGAAGTTGCC |
GTCAGGGTTACTCTGGCA | 54 | 357 |
| GSTA3 |
ATGGACGGGGCAGAATGG |
GGAGATAAGGCTGGAGTC | 54 | 497 |
| GSTT2 |
AGGCTCGTGCCCGTGTTC |
GGCCTCTGGTGAGGGTG | 58 | 428 |
| GSTM5 |
CAGAAGATGGGAGGGAGG |
GGGGGACTTTGATGGAGG | 56 | 207 |
| MGST1 |
GCAGAGCCCACCTGAATG |
TCCTCTGCTCCCCTCCTA | 56 | 354 |
| MGST2 |
AGACCTGCCTGCCTTCCT |
CCACCCAGCCATCCACAA | 56 | 392 |
| HSPA6 |
CAGTGGCATCCCTCCTGC |
GCGGGCTTGAGTGCCACA | 58 | 499 |
| NOS2A |
CCTGGCAAGCCCAAGGTC |
CACCCACTTGCCAGGCCT | 58 | 587 |
| NAT2 |
GTGACCATTGACGGCAGG |
CGTGAGGGTAGAGAGGAT | 54 | 630 |
| NAT5 |
CCTTTACCTGCGACGACC |
GGAGGAGACTGGAGCAAG | 56 | 830 |
| β-ACTIN |
AAATCGTGCGTGACATTAAGG |
AGCACTGTGTTGGCGTACAG | 50 | 277 |
| GAPDH |
GGAAGGACTCATGACCAC |
GGTCTCTCTCTTCCTCTT | 53 | 546 |
| RPS27A |
CTCGAGGTTGAACCCTCG |
GCACTCTCGACGAAGGCG | 56 | 321 |
Statistical analysis
For analysis between two or more samples, one-way
analysis of variance with post hoc Bonferroni test was used.
Independent sample t-tests were used for comparisons between two
samples. P<0.05 was considered to indicate a statistically
significant difference.
Results
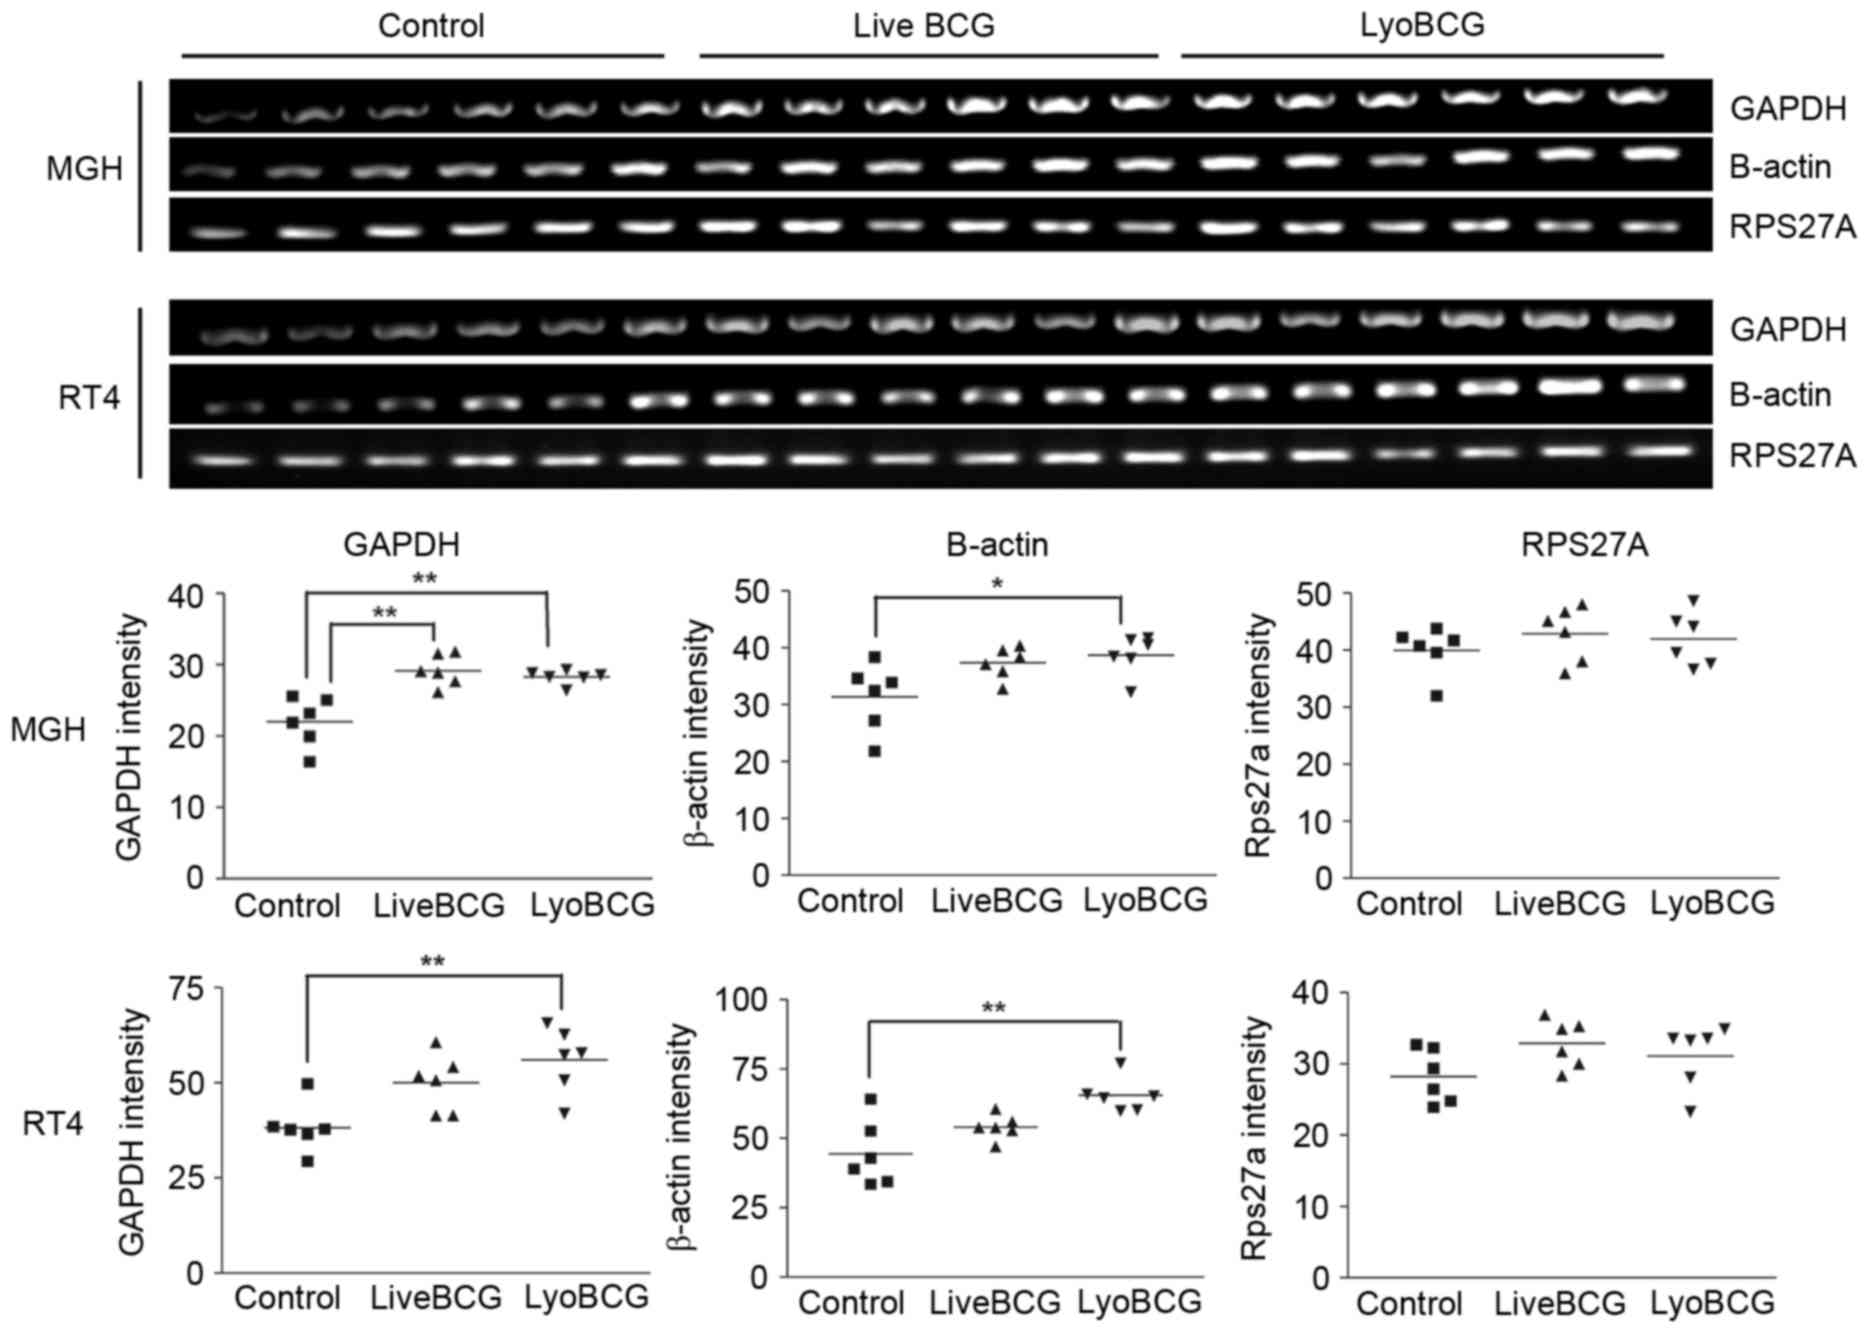
GAPDH and β-actin are induced by BCG
in bladder cancer cells. MGH cells, which readily internalize BCG,
were exposed to BCG Connaught for 2 h, and the RNA was extracted
and subjected to several rounds of subtractive hybridization. The
RNA was subsequently cloned and sequenced following the protocol
developed by Pastorian et al (15). A total of 56 clones were isolated
(from control and BCG treated samples) and sequenced. The sequences
were identified by using the BLAST program on GenBank. The genes
identified are listed in Table II. A
total of 6 genes were chosen for validation by RT-PCR on fresh
samples, but only 2 genes (β-actin and GAPDH) were
confirmed to be induced in MGH and RT4 cells exposed to lyophilized
and live BCG (Fig. 1). The other
genes identified: Glutathione-S-transferase κ; heat shock protein
70 protein 5; natural killer cell enhancing factor; and β1
integrin, were not differentially modulated. As RT4 cells do not
internalize BCG as well compared with MGH cells (10), the gene expression changes induced in
RT4 cells may be due to membrane signaling or the uptake of BCG
soluble factors. β-actin and GAPDH are normally used
as controls for gene expression analysis, and normalization with
these genes would lead to erroneous interpretation of gene
expression changes. A ribosomal protein gene, RPS27A, was
identified not to vary in response to BCG and was used as a control
gene (Fig. 1). One limitation of the
RDA strategy was that often the sequence identified had homology to
a conserved domain of a family of associated genes, which meant it
was difficult to identify the actual family member that was
induced. Therefore, oligo arrays with detoxification genes and
inflammatory cytokine genes were also analyzed.
| Table II.Differentially expressed genes as
determined by representational differential analysis. |
Table II.
Differentially expressed genes as
determined by representational differential analysis.
| Class of
protein | Control Sample | Lyo BCG treated
sample |
|---|
| Membrane
proteins/adhesion molecules | • Chondroitin
sulphate proteoglycan 6 (NM_005445.2) | • Integrin β1
(NM_133376.1) |
|
|
| • CD81 antigen
(NM_004356.2) |
|
|
| • Connexin 45
(NM_005497.1) |
|
|
| • Translocase of
Inner mitochondrial) membrane 17 (NM_006335.1) |
|
|
| • ATP synthase H+
transporting protein, alpha subunit (BT008024) |
| Detoxification,
antioxidants and stress response | • Diaphorase
NADH/NADPH cytochrome b5 reductase (BC007659) | •
Gluthathione-S-Transferase subunit 13 (NM_015917.1) |
|
|
| • Heat Shock
protein 70 (NM_005347.2) |
|
|
| • Natural Killer
cell enhancing factor (HUMNKEFA) |
|
|
| • Peroxiredoxin 1
(NM_002574.2) |
| Intracellular
motility/Cell structure integrity | • Kinesin
(NM_004521.1) | • Clathrin assembly
protein 50 (HSU36188) |
|
| • Dynein
(NM_003746.1) | • β-Actin
(NM_001101.2) |
|
| • Thymosin β4
(NM_021109.1) |
|
| Enzymes and
regulatory proteins | • Inhibitor of κ
light polypeptide gene enhancer (NM_003640.1) | • c-myc binding
protein (HUMCMYCQ) |
|
|
| • Protein kinase
cAMP dependent regulatory, type 1α (NM_002734.2) |
|
| • Cytoplasmic
antiproteinase 38 kDa (S69272) |
|
|
|
| •
6-phosphofructo-2-kinase (NM_004567.2) |
|
| • Enolase 1
(NM_001428.21) |
|
|
| • Lactate
dehydrogenase A (NM_005566.1) | •
Glyceraldehyde-3-phosphate dehydrogenase (NM_002046.2) |
|
| • Spermine
N1-Acetyltransferase (NM_002970.1) | • Follistatin like
protein (NM_008047.2) |
|
|
| •
Metallo-β-lactamase (D83198) |
| Transcription
factors and nuclear proteins | • Transcription
factor 2 (NM_000548.1) | • Ribophorin
(Y00281) |
|
| • Nucleolin
(NM_005381.1) | • Archain 1
(NM_001655.3) |
|
| • DNA polymerase,
Epsilon 3, p17 subunit (NM_017443.3) |
|
|
| • Histone
acetyltransferase 1 (NM_003642.1) |
|
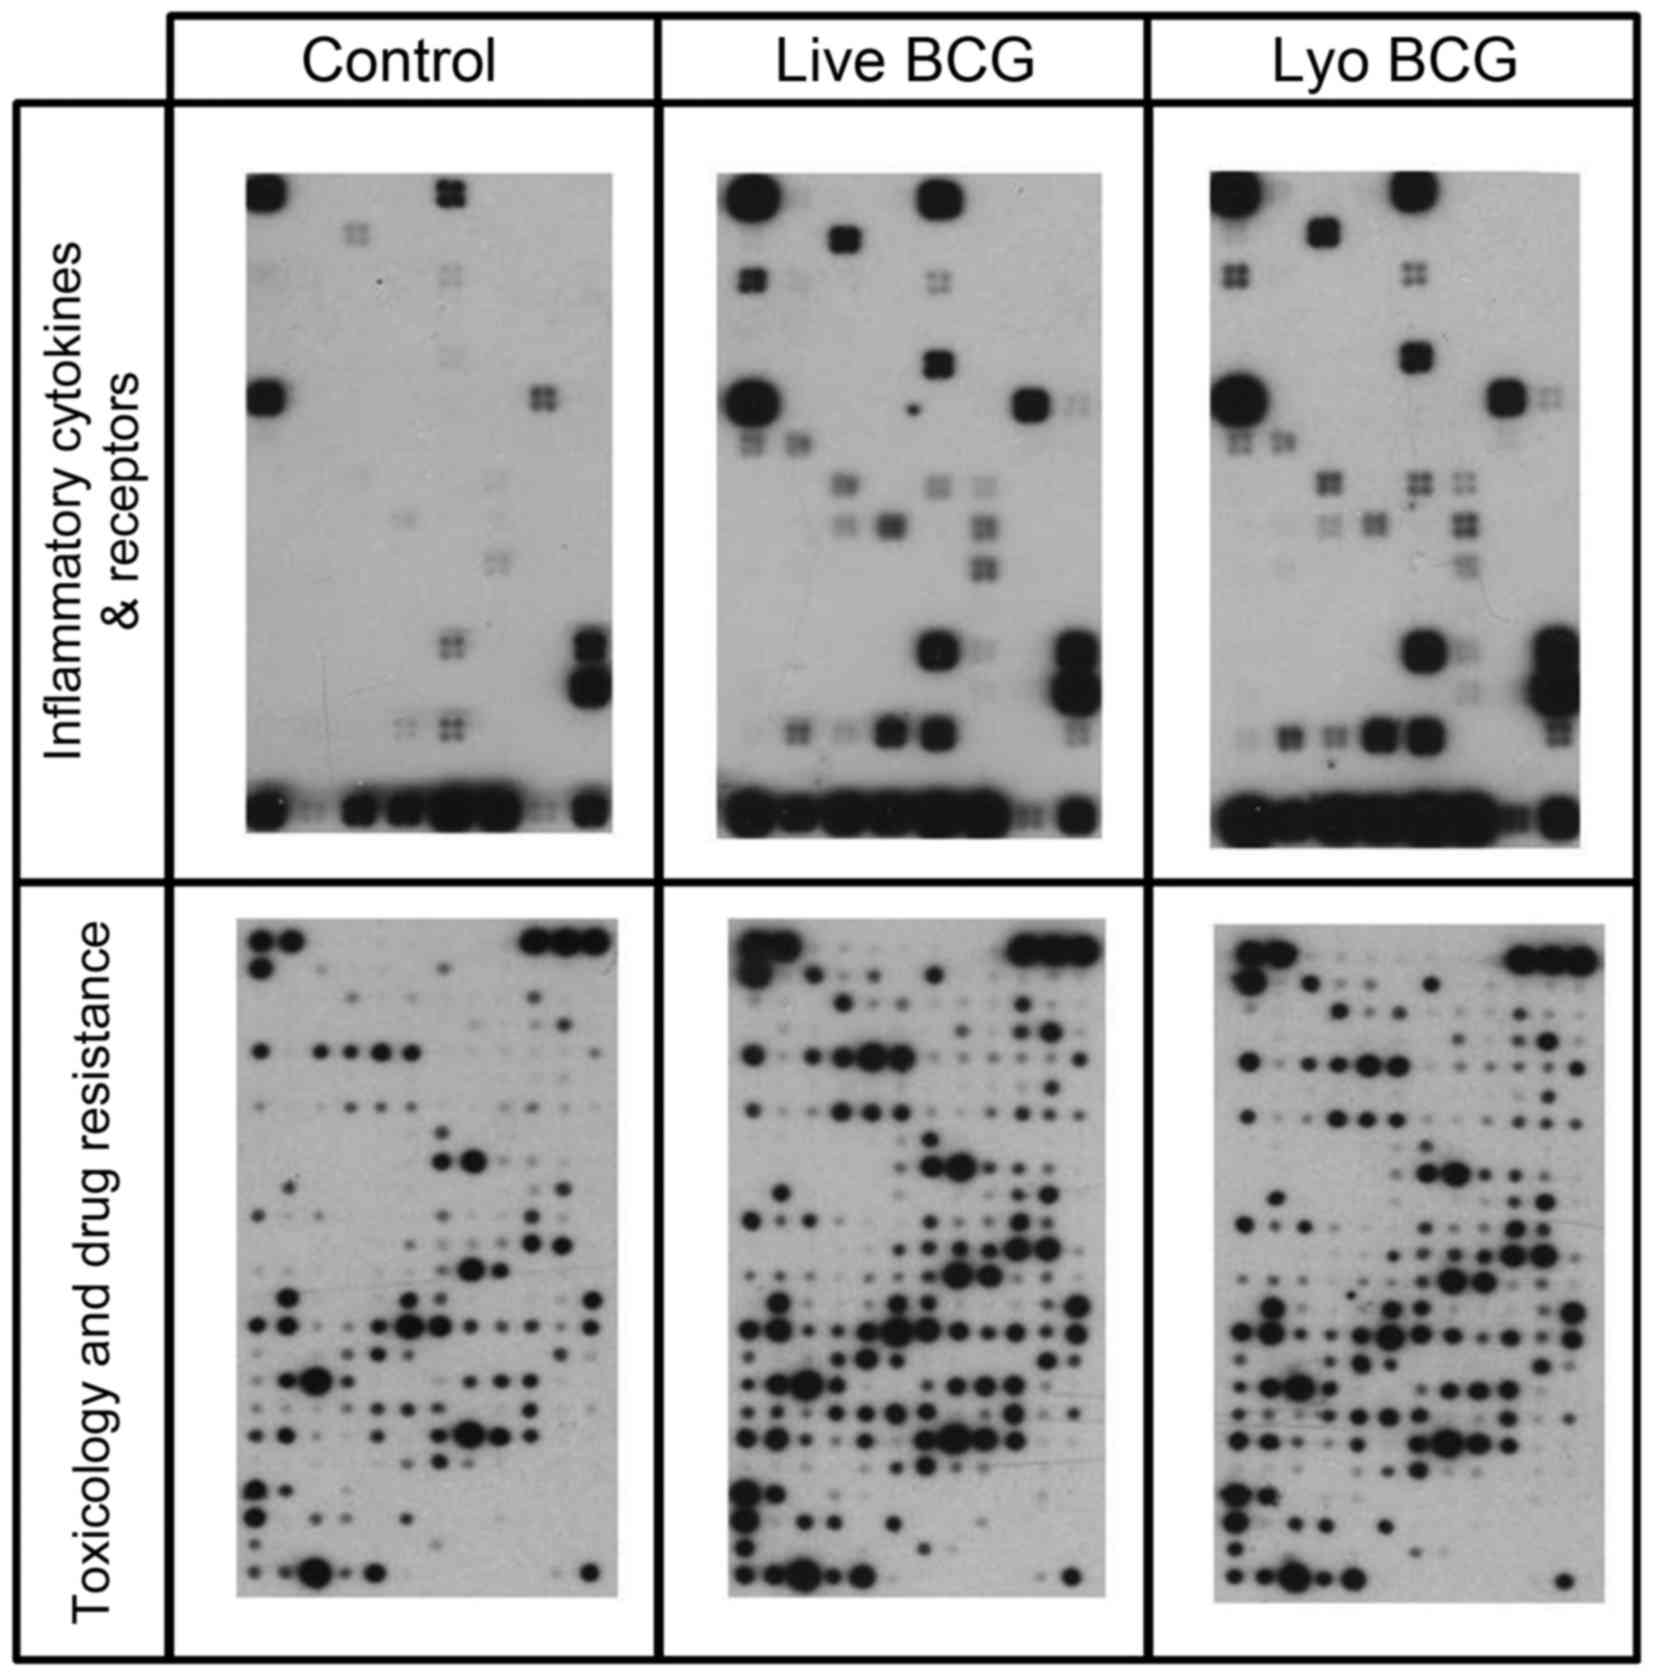
Live and lyophilized BCG induced
differential gene expression
Several genes were identified to be differentially
expressed on the arrays following exposure of MGH cells to live or
lyophilized BCG (Fig. 2). The
Inflammatory Cytokines & Receptors array contained
oligonucleotides representing 61 genes, and the Toxicology &
Drug Resistance array contained 386 genes. A total of 17 genes on
the Inflammatory Cytokines & Receptors array and 59 genes on
the Toxicology & Drug Resistance array were differentially
expressed by >2-fold (Tables III
and IV). To re-confirm the array
data, 20 genes with >5-fold difference in expression levels and
2 that were increased ~2-fold were chosen for RT-PCR analysis on
fresh MGH and RT4 cells exposed to lyophilized and live BCG for 2
h. A total of 10 genes (CXCL5, IL11RA, IL15RA, SCYE1, HSPA6, NAT2,
NAT5, GSTM5, GSTA3 and NOS2A) were not detectable during RT-PCR
validation. The two cells lines differentially expressed certain
genes in their basal state (Table V).
Unstimulated MGH cells expressed significantly higher levels of
TNFα, IL12A, CXCL6, CCL20, CSF2, IL10RB, TOLLIP, GSTT2 and CCNE1
when compared with RT4 cells (P<0.05). MGST1 expression was
higher in RT4 cells, compared with MGH cells. For MGH cells exposed
to live or lyophilized BCG, the expression of the following genes:
CCL20, CXCL6, IL12A, MGST2, IL10RB and CCNE1 were significantly
reduced (P<0.005 except CXCL6, P<0.05), compared with
unstimulated MGH cells. While TNFα and TOLLIP expression levels
were increased on exposure to live BCG (Table V), compared with unstimulated MGH
cells (P<0.005 and P<0.05 respectively), only TNFα was
significantly increased following exposure to lyophilized BCG
(P<0.005 when compared with unstimulated MGH cells). MGST1 and
GSTT2 were increased only in lyophilized BCG-treated MGH cells. In
the RT4 cells, MGST1, CSF2 and TOLLIP expression levels increased,
while CXCL6 expression decreased following exposure to live or
lyophilized BCG (Table V). However,
IL1β was significantly decreased following lyophilized BCG exposure
(P<0.05) and IL12A expression was significantly decreased
following live BCG exposure in RT4 cells (P<0.05), compared with
unstimulated RT4 cells. Similar gene expression changes between MGH
and RT4 cell lines probably indicated genes whose expression
resulted from the interaction of BCG or BCG-soluble factors with
cellular receptors, while genes increased in MGH and unchanged in
RT4 are likely due to BCG internalization, as MGH cells readily
internalize BCG, unlike RT4 cells.
| Table III.Differentially expressed
genesa on the Human
Inflammatory Cytokines and Receptors oligo array. |
Table III.
Differentially expressed
genesa on the Human
Inflammatory Cytokines and Receptors oligo array.
| Ref Seq number | Symbol | Description |
|---|
| NM_004591 | CCL20 | Chemokine (C-C
motif) ligand 20 |
| NM_005624 | CCL25 | Chemokine (C-C
motif) ligand 25 |
| NM_005194 | CEBPB | CCAAT/enhancer
binding protein (C/EBP), β |
| NM_002090 | CXCL3 | Chemokine (C-X-C
motif) ligand 3 |
| NM_002994 | CXCL5 | Chemokine (C-X-C
motif) ligand 5 |
| NM_002993 | CXCL6 | Chemokine (C-X-C
motif) ligand 6 (granulocyte chemotactic protein 2) |
| NM_000628 | IL10RB | Interleukin 10
receptor, β |
| NM_004512 | IL11RA | Interleukin 11
receptor, α |
| NM_000882 | IL12A | Interleukin 12A
(natural killer cell stimulatory factor 1, cytotoxic lymphocyte
maturation factor 1, p35) |
| NM_001560 | IL13RA1 | Interleukin 13
receptor, α 1 |
| NM_000640 | IL13RA2 | Interleukin 13
receptor, α 2 |
| NM_002189 | IL15RA | Interleukin 15
receptor, α |
| NM_000576 | IL1B | Interleukin 1,
β |
| NM_004757 | SCYE1 | Small inducible
cytokine subfamily E, member 1 (endothelial
monocyte-activating) |
| NM_000582 | SPP1 | Secreted
phosphoprotein 1 (osteopontin, bone sialoprotein I, early
T-lymphocyte activation 1) |
| NM_000594 | TNF | Tumor necrosis
factor (TNF superfamily, member 2) |
| NM_019009 | TOLLIP | Toll interacting
protein |
| Table IV.Differentially expressed
genesa on the Human
Toxicology and Drug resistance oligo array. |
Table IV.
Differentially expressed
genesa on the Human
Toxicology and Drug resistance oligo array.
| Ref Seq number | Symbol | Description |
|---|
| NM_005157 | ABL1 | V-abl Abelson
murine leukemia viral oncogene homolog 1 |
| NM_005163 | AKT1 | V-akt murine
thymoma viral oncogene homolog 1 |
| NM_138578 | BCL2L1 | BCL2-like 1 |
| NM_004327 | BCR | Breakpoint cluster
region |
| NM_001238 | CCNE1 | Cyclin E1 |
| NM_006431 | CCT2 | Chaperonin
containing TCP1, subunit 2 (β) |
| NM_016280 | CES4 | Carboxylesterase
4-like |
| NM_020985 | CHAT | Choline
acetyltransferase |
| NM_007194 | CHEK2 | CHK2 checkpoint
homolog (S. pombe) |
| NM_000754 | COMT |
Catechol-O-methyltransferase |
| NM_000755 | Crat | Carnitine
acetyltransferase |
| NM_000758 | CSF2 | Colony stimulating
factor 2 (granulocyte-macrophage) |
| NM_001905 | CTPS | CTP synthase |
| NM_001565 | CXCL10 | Chemokine (C-X-C
motif) ligand 10 |
| NM_000761 | CYP1A2 | Cytochrome P450,
family 1, subfamily A, polypeptide 2 |
| NM_000104 | CYP1B1 | Cytochrome P450,
family 1, subfamily B, polypeptide 1 |
| NM_020674 | CYP20A1 | Cytochrome P450,
family 20, subfamily A, polypeptide 1 |
| NM_004083 | DDIT3 |
DNA-damage-inducible transcript 3 |
| NM_001931 | DLAT | Dihydrolipoamide
S-acetyltransferase (E2 component of pyruvate dehydrogenase
complex) |
| NM_001539 | DNAJA1 | DnaJ (Hsp40)
homolog, subfamily A, member 1 |
| NM_006145 | DNAJB1 | DnaJ (Hsp40)
homolog, subfamily B, member 1 |
| NM_003315 | DNAJC7 | DnaJ (Hsp40)
homolog, subfamily C, member 7 |
| NM_005225 | E2F1 | E2F transcription
factor 1 |
| NM_005228 | EGFR | Epidermal growth
factor receptor (erythroblastic leukemia viral (v-erb-b) oncogene
homolog, avian) |
| NM_001964 | EGR1 | Early growth
response 1 |
| NM_004448 | ERBB2 | V-erb-b2
erythroblastic leukemia viral oncogene homolog 2,
neuro/glioblastoma derived oncogene homolog (avian) |
| NM_000122 | ERCC3 | Excision repair
cross-complementing rodent repair deficiency, complementation group
3 (xeroderma pigmentosum group B complementing) |
| NM_005252 | FOS | V-fos FBJ murine
osteosarcoma viral oncogene homolog |
| NM_001924 | GADD45A | Growth arrest and
DNA-damage-inducible, α |
| NM_015675 | GADD45B | Growth arrest and
DNA-damage-inducible, β |
| NM_004861 | GAL3ST1 |
Galactose-3-O-sulfotransferase 1 |
| NM_000847 | GSTA3 | Glutathione
S-transferase A3 |
| NM_000851 | GSTM5 | Glutathione
S-transferase M5 |
| NM_000853 | GSTT1 | Glutathione
S-transferase θ 1 |
| NM_000854 | GSTT2 | Glutathione
S-transferase θ 2 |
| NM_005345 | HSPA1A | Heat shock 70 kDa
protein 1A |
| NM_002155 | HSPA6 | Heat shock 70 kDa
protein 6 (HSP70B') |
| NM_001541 | HSPB2 | Heat shock 27 kDa
protein 2 |
| NM_006308 | HSPB3 | Heat shock 27 kDa
protein 3 |
| NM_000875 | IGF1R | Insulin-like growth
factor 1 receptor |
| NM_002178 | IGFBP6 | Insulin-like growth
factor binding protein 6 |
| NM_000576 | IL1B | Interleukin 1,
β |
| NM_000595 | LTA | Lymphotoxin α (TNF
superfamily, member 1) |
| NM_020300 | MGST1 | Microsomal
glutathione S-transferase 1 |
| NM_002413 | MGST2 | Microsomal
glutathione S-transferase 2 |
| NM_005954 | MT3 | Metallothionein 3
[growth inhibitory factor (neurotrophic)] |
| NM_000015 | NAT2 | N-acetyltransferase
2 (arylamine N-acetyltransferase) |
| N
M_016100 | NAT5 | N-acetyltransferase
5 (ARD1 homolog, S. cerevisiae) |
|
NM_003960 | NAT8 | N-acetyltransferase
8 (camello-like) |
|
NM_003998 | NFKB1 | Nuclear factor of
kappa light polypeptide gene enhancer in B-cells 1 (p105) |
|
NM_002503 | NFKBIB | Nuclear factor of
kappa light polypeptide gene enhancer in B-cells inhibitor,
beta |
|
NM_000625 | NOS2A | Nitric oxide
synthase 2A (inducible, hepatocytes) |
|
NM_005122 | NR1I3 | Nuclear receptor
subfamily 1, group I, member 3 |
|
NM_000940 | PON3 | Paraoxonase 3 |
|
NM_000321 | RB1 | Retinoblastoma 1
(including osteosarcoma) |
|
NM_030752 | TCP1 | T-complex 1 |
|
NM_000594 | TNF | Tumor necrosis
factor (TNF superfamily, member 2) |
|
NM_003299 | TRA1 | Tumor rejection
antigen (gp96) 1 |
|
NM_003789 | TRADD | TNFRSF1A-associated
via death domain |
| Table V.Gene expression modulation by BCG in
MGH and RT4 cell lines. |
Table V.
Gene expression modulation by BCG in
MGH and RT4 cell lines.
|
| MGH | RT4 |
|---|
|
|
|
|
|---|
| Gene | Control | Live BCG | Lyo BCG | Control | Live BCG | Lyo BCG |
|---|
| GSTT2 |
1.31±0.53 |
1.57±0.53 |
2.50±0.88a |
0.63±0.29 |
0.62±0.16 |
0.56±0.33 |
| MGST1 |
0.49±0.12 |
0.79±0.29 |
1.10±0.43a |
0.67±0.06 |
1.26±0.13b |
1.15±0.13b |
| MGST2 |
1.27±0.27 |
0.44±0.23b |
0.63±0.34b |
1.36±0.23 |
1.30±0.11 |
1.38±0.20 |
| CSF2 |
1.35±0.36 |
1.05±0.12 |
1.23±0.32 |
0.86±0.06 |
1.32±0.22b |
1.26±0.21b |
| CXCL6 |
2.42±0.49 |
1.14±0.13a |
1.81±1.15 |
1.00±0.09 |
0.75±0.04b |
0.76±0.03b |
| CCL20 |
1.50±0.35 |
0.82±0.05b |
0.92±0.22b |
0.95±0.10 |
0.88±0.10 |
1.00±0.210 |
| IL1β |
1.41±0.28 |
1.17±0.18 |
1.23±0.22 |
1.54±0.29 |
1.54±0.13 |
0.43±0.12b |
| TNFα |
1.21±0.31 |
1.64±0.13b |
1.55±0.15b | ND | ND | ND |
| IL12A |
1.68±0.47 |
0.88±0.09b |
0.99±0.24b |
1.12±0.12 |
0.85±0.07a |
0.94±0.20 |
| IL10RB |
2.71±0.46 |
1.15±0.12b |
1.39±0.60b |
1.29±0.19 |
1.17±0.24 |
1.04±0.32 |
| TOLLIP |
1.84±0.26 |
2.47±0.38a |
2.31±0.33 |
0.84±0.13 |
1.25±0.27a |
1.31±0.24b |
| CCNE1 |
2.57±0.31 |
1.06±0.11b |
1.41±0.45b |
1.36±0.23 |
1.09±0.34 |
1.12±0.37 |
GSTT2, TNFα and TOLLIP expression are
modulated by BCG soluble factors
The effects of BCG-soluble factors were examined on
3 genes: GSTT2 and TNFα (increased in MGH and not RT4 cells); and
TOLLIP (increased in the two cell lines). A membrane insert was ≤
used to separate whole BCG from the cells to examine the effect of
BCG soluble (secreted) factors. There was a significant decrease
(P<0.005) in GSTT2 expression in live BCG-treated (0.08±0.04)
and lyophilized BCG-treated (0.09±0.04) cells compared with the
control cells (0.43±0.09), and a significant decrease (P<0.05)
in TNFα expression in the presence of lyophilized BCG (0.37±0.06)
compared with the control (0.77±0.15). In the presence of
orthovanadate, a tyrosine phosphatase inhibitor, the magnitude of
the decrease in GSTT2 expression was reduced in cells treated with
live BCG (0.51±0.02) and lyophilized BCG (0.67±0.02) compared with
the control (0.8±0.01). This indicates the modulatory function of a
protein tyrosine phosphatase (PTP), either of human or
mycobacterial origin. MptpA is a well-known mycobacterial PTP, and
similar to Ag85B it is a major soluble factor secreted by BCG.
MptpA decreased GSTT2 expression (Fig.
3A) but exhibited no effect on TNFα or TOLLIP expression. Ag85B
was previously demonstrated to increase cellular ROS (10). Ag85B increased TNFα expression, but
there was no effect on TOLLIP or GSTT2 expression (Fig. 3A). This indicates that other
mycobacterial proteins may serve a role in the modulation of TNFα
gene expression, as the decrease in TNFα was observed in the
presence of a membrane insert.
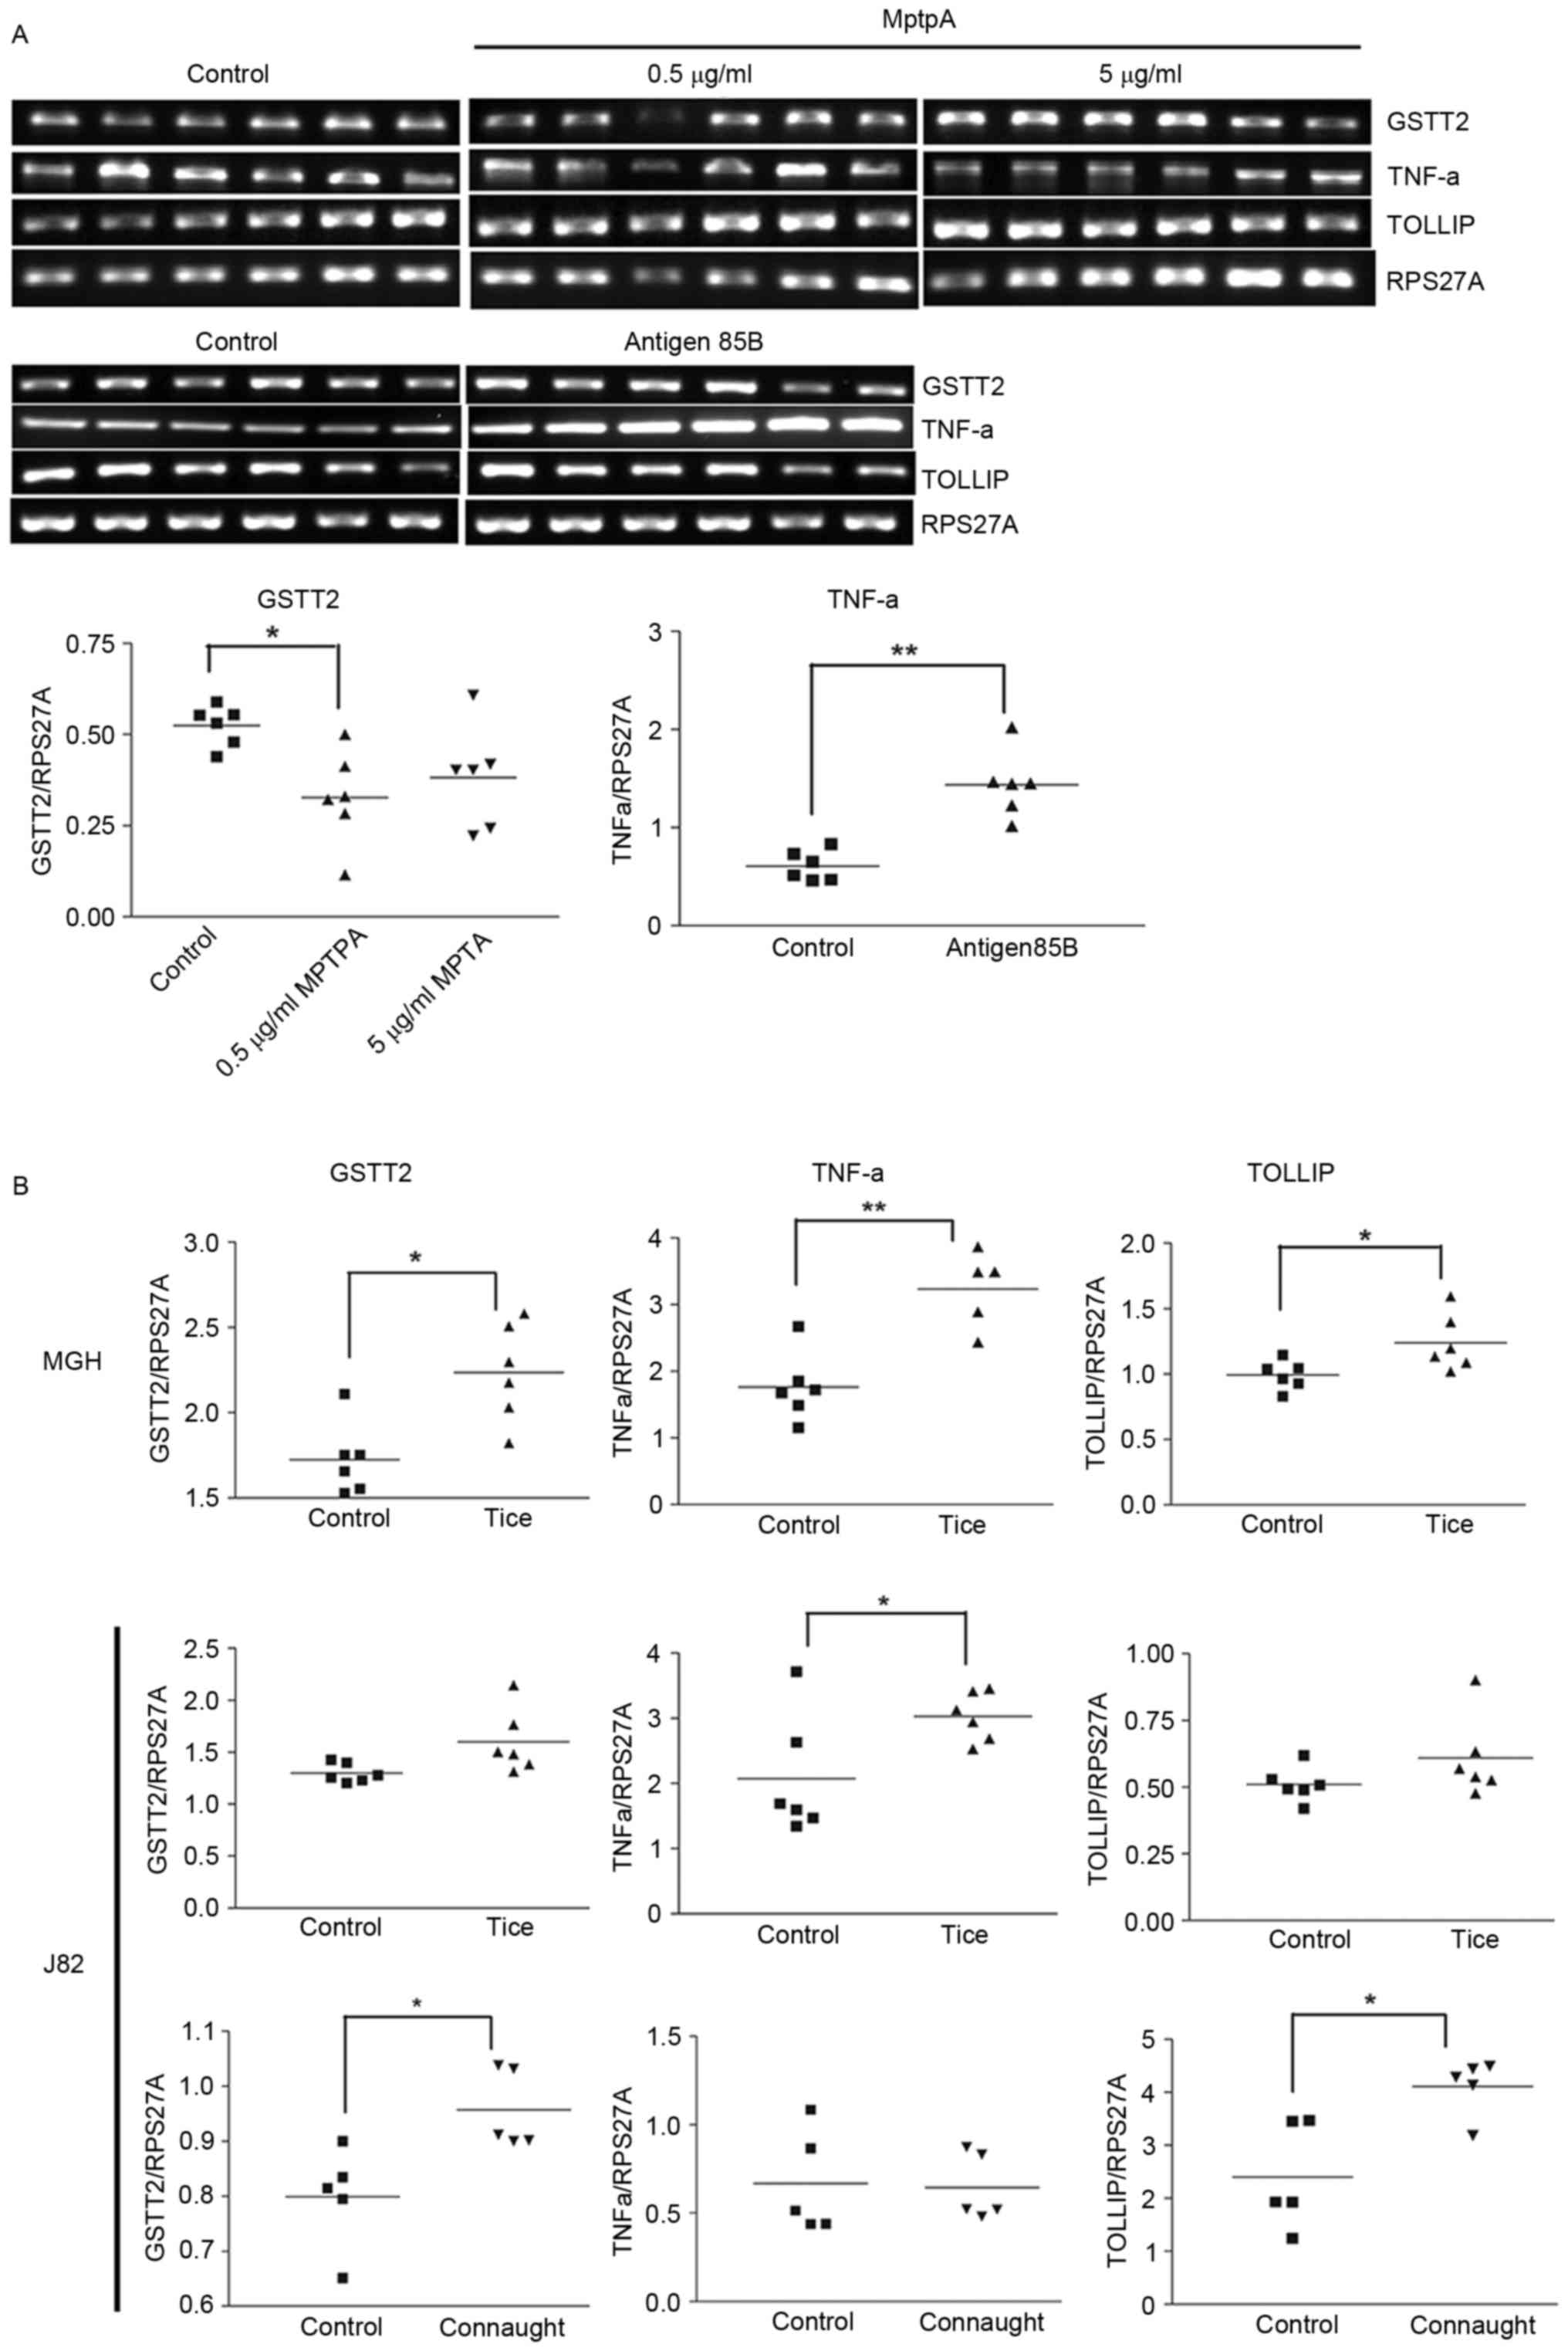 | Figure 3.Modulation of gene expression by
Ag85, MptpA and BCG Tice® and Connaught strains. Reverse
transcription polymerase chain reaction analysis of (A) MGH cells
treated with BCG secreted proteins, MptpA and Ag85B, and (B) MGH
and J82 cells treated with BCG Tice® and Connaught. Gene
expression was measured relative to RPS27A. *P<0.05,
**P<0.005. Comparisons between >2 samples were performed
using one-way analysis of variance with Bonferroni correction. An
independent sample t-test was used for comparing between 2 samples.
GSTT2, glutathione S-transferase θ 2; TNFα, tumor necrosis factor
α; TOLLIP, Toll interacting protein; RPS27A, ribosomal protein
S27a; MptpA, Mycobacterium protein tyrosine phosphatase A; Ag85B,
antigen 85B. |
GSTT2, TNFα and TOLLIP expression is
modulated by BCG Tice® and Connaught
To determine if the gene expression changes observed
were BCG-strain specific, MGH and J82 cells (which internalize BCG)
(10) were exposed to BCG
Tice® for 2 h. Increased expression levels of GSTT2,
TNFα and TOLLIP were observed in MGH cells (P<0.05; Fig. 3B). The effects of Tice® and
Connaught on MGH cells were similar (Table V; Fig.
3B). In the J82 cells, Connaught increased GSTT2 and TOLLIP
expression (P<0.05) but had no effect on TNFα. However,
Tice® increased the expression of all 3 genes, but only
TNFα was significantly increased. The differential response in J82
cells indicates that the responses of the two BCG strains are also
dependent on host cell genetics. These results confirm that GSTT2,
TNFα and TOLLIP are induced by the two BCG strains.
Discussion
MGH and RT4 human bladder cancer cell lines differ
in the expression of several genes when unstimulated, with RT4
expressing a greater number of cytokine and chemokine genes. A
limitation of the present study was that only these two cell lines
were compared for the majority of the evaluations. Furthermore PCR
was performed between 30–35 cycles as based on densitometry
analysis of PCR products relative to cycle number; however, the PCR
products were still amplifying and had not yet reached a plateau.
The two cell lines responded to BCG by increasing the expression of
β-actin and GAPDH. Therefore, neither gene is a
suitable control gene for normalization of gene expression when
analyzing BCG-induced early gene expression. Although GAPDH is
regarded as a glycolytic protein, it regulates gene transcription,
initiates apoptosis and is a major target for thiolation by ROS
(17). In monocytes infected with
mycobacteria, increased GAPDH expression leads to increased
mycobacterial survival (18). β-actin
is a cytoskeletal protein associated with cell structure, migration
and the internalization of pathogens (19). BCG-induced β-actin expression may
affect any of these functions.
The genes identified may be segregated by the cells
lines they are expressed in as those likely to be induced by BCG
internalization and soluble factors (GSTT2, MGST2, CCL20,
TNFα, CCNE1 and IL10RB) and those likely to be
the result of BCG membrane interactions and/or soluble factors
(MGST1, CXCL6, IL12A, CSF2, IL1β, GAPDH,
β-ACTIN and TOLLIP). TNFα was not detected in
RT4 cells, and this in consistent with our previous study, which
demonstrated the absence of TNFα production prior and subsequent to
BCG stimulation of RT4 cells (20).
The GSTs are a family of metabolic enzymes that
conjugate reduced glutathione to electrophilic compounds such as
xenobiotics, carcinogens, pesticides and other chemicals, resulting
in their detoxification (21). There
are ~19 members. To date, GSTP and GSTM have been implicated in the
development of bladder cancer, and may possibly affect the response
to therapy (22). GSTT2 protects
cells against the toxic products of oxygen and lipid peroxidation.
The increased expression of GSTT2 may be due to the
modulation of cellular lipid peroxidation by BCG (10) MGST2 and MGST1 are
microsomal GSTs. MGST2 is a modulator of ROS and DNA damage, while
MGST1 serves a role in eicosanoid and glutathione metabolism and
has previously been revealed to block the effectiveness of
doxorubicin by removing the oxidative stress induced by the drug
(23). The modulation of these GSTs
is consistent with the cellular ROS changes that occur following
BCG internalization (6). ROS is the
major means by which phagocytic cells destroy microbes (24), and the induction of the identified
genes may serve a role in the destruction of internalized BCG. A
previous study identified a single nucleotide polymorphism in GSTT2
that was correlated with recurrence following TUR in high grade
bladder cancer (25), but it has not
been evaluated in patients who have received BCG immunotherapy.
TOLLIP is the inhibitory protein of Toll-like
receptors (TLRs). TLR activation results in homo or
hetero-dimerization of these receptors, which associate with the
MyD88-IRAK-4 complex (containing IRAK-1 and IRAK-2) and triggers
nuclear factor (NF)-κB activation. TOLLIP controls Myd88-mediated
activation of NF-κB by: i) Binding directly to IL-1R, TLR2 and TLR4
following TLR activation; and ii) by binding to IRAK-1, inhibiting
its auto-phosphorylation. A second function of TOLLIP is in protein
trafficking. TOLLP binds RAC-1 and facilitates entry of
uropathogenic Escherichia coli into bladder epithelial cells
(26). BCG has also been revealed to
use a RAC-1-dependant pathway to enter bladder epithelial cells
(5). TOLLIP expression is associated
with increased interleukin-(IL)10 production and blocking of the
TGFβ pathway (27). TOLLIP
polymorphisms are associated with differential susceptibility to
tuberculosis (28), and may perhaps
also modulate the response to BCG immunotherapy.
While the cytokine and chemokine genes identified
exhibit well known effects on immune activation, certain genes have
also have been identified to affect phagosome function. Reduction
of IL10RB may reduce IL10 signaling, which is necessary to
block phagosome fusion to lysosomes (29). IL12A is also known to modulate
phagosome lysosome fusion (30).
CCNE1, a regulator of the cell cycle, had a reduced
expression and this would cause cell arrest. Therefore, the
induction of these genes may modulate bacterial survival within
cells. Consistent with this possibility, IL10RB and
IL12A are reduced in MGH cells, which internalize BCG, while
there is only a reduction in IL12A in RT4 cells that
internalize BCG poorly. CSF2, CXCL6, CCL20 and TNFα
are regulators of immune cell activation, chemotaxis and cell
death. CCL20 downregulates ROS production in Mycobacterium
tuberculosis (MTb)-infected monocytes (31). It remains to be determined if the
other chemokines serve a role in BCG survival. Kadhim et al
(32) identified the NRAMP
gene as an important regulator of BCG survival, however, it is
unlikely to be the only gene that performs this function, and these
results may have identified several other genes that modulate BCG
survival.
Rentsch et al (12) identified that immunotherapy using BCG
Tice® and Connaught produced different outcomes in
patients with bladder cancer. Tice® has been suggested
to be inferior to Connaught in inducing adaptive BCG-specific
CD8+ T cell responses and recruiting T cells to the
bladder (29). This may be associated
with the observation that following 72 h, Tice® exhibits
a lower survival rate compared with Connaught, and a reduced
ability to induce IL8 production (13). In the bladder cancer cell lines
examined in the present study, there was a similar increase in
GSTT2, TNFα and TOLLIP expression levels induced by
Tice® and Connaught cells at 2 h. Therefore, the
different survival ability may be associated with bacterial genetic
differences, as opposed to host factors.
Given the effects of orthovanadate and MptpA on
GSTT2 expression, it is likely that a protein required for
GSTT2 expression is regulated by tyrosine phosphorylation.
MptpA has previously been demonstrated to modulate GSK3α activity
by promoting MTb survival in macrophages (33), and to modulate phagocytosis and actin
polymerization (34). TNFα was
induced in alveolar macrophages containing MTb, and it in turn
increased Ag85B expression (35). In
the present study Ag85B was able to induce TNFα expression,
demonstrating an interdependent association between these 2
proteins. BCG soluble factors and whole BCG induced different
effects, as observed with GSTT2 expression. Therefore, the
response to BCG is a summation of the responses triggered by these
two factors.
These results highlight the possibility that simply
washing lyophilized BCG prior to therapy may modulate therapeutic
outcomes by removing soluble factors. The genes identified in the
present study may be good candidate biomarkers to evaluate outcomes
in patients with bladder cancer receiving BCG immunotherapy.
Acknowledgements
Not applicable.
Funding
The present study was funded by the Biomedical
Research Council Singapore (grant no. BMRC 04/1/21/19/311).
Availability of data and materials
The datasets used and/or analyzed during the current
study are available from the corresponding author on reasonable
request.
Authors' contributions
JNR performed the studies. JNR, RM and KE
participated in the design of the experiments. All three authors
worked on the manuscript and approved its submission.
Ethics approval and consent to
participate
Not applicable.
Consent for publication
Not applicable.
Competing interests
The authors declare that they have no competing
interests.
References
|
1
|
Herr HW and Morales A: History of bacillus
Calmette-Guerin and bladder cancer: an immunotherapy success story.
J Urol. 179:53–56. 2008. View Article : Google Scholar : PubMed/NCBI
|
|
2
|
Ratliff TL, Palmer JO, McGarr JA and Brown
EJ: Intravesical Bacillus Calmette-Guerin therapy for murine
bladder tumors: Initiation of the response by fibronectin-mediated
attachment of Bacillus Calmette-Guérin. Cancer Res. 47:1762–1766.
1987.PubMed/NCBI
|
|
3
|
Kuroda K, Brown EJ, Telle WB, Russell DG
and Ratliff TL: Characterization of the internalization of bacillus
Calmette-Guerin by human bladder tumor cells. J Clin Invest.
91:69–76. 1993. View Article : Google Scholar : PubMed/NCBI
|
|
4
|
Chen F, Zhang G, Iwamoto Y and See WA:
Bacillus Calmette-Guerin initiates intracellular signaling in a
transitional carcinoma cell line by cross-linking alpha 5 beta 1
integrin. J Urol. 170:605–610. 2003. View Article : Google Scholar : PubMed/NCBI
|
|
5
|
Redelman-Sidi G, Iyer G, Solit DB and
Glickman MS: Oncogenic activation of Pak1-dependent pathway of
macropinocytosis determines BCG entry into bladder cancer cells.
Cancer Res. 73:1156–1167. 2013. View Article : Google Scholar : PubMed/NCBI
|
|
6
|
Pook SH, Esuvaranathan K and Mahendran R:
N-acetylcysteine augments the cellular redox changes and cytotoxic
activity of internalized mycobacterium bovis in human bladder
cancer cells. J Urol. 168:780–785. 2002. View Article : Google Scholar : PubMed/NCBI
|
|
7
|
Shah G, Zhang G, Chen F, Cao Y,
Kalyanaraman B and See WA: iNOS expression and NO production
contribute to the direct effects of BCG on urothelial carcinoma
cell biology. Urol Oncol. 32:45.e1–9. 2014. View Article : Google Scholar
|
|
8
|
Zhang G, Chen F, Cao Y, Amos JV, Shah G
and See WA: HMGB1 release by urothelial carcinoma cells in response
to Bacillus Calmette-Guérin functions as a paracrine factor to
potentiate the direct cellular effects of Bacillus Calmette-Guérin.
J Urol. 190:1076–1082. 2013. View Article : Google Scholar : PubMed/NCBI
|
|
9
|
Méndez-Samperio P, Pérez A and Torres L:
Role of reactive oxygen species (ROS) in Mycobacterium bovis
bacillus Calmette Guérin-mediated up-regulation of the human
cathelicidin LL-37 in A549 cells. Microb Pathog. 47:252–257. 2009.
View Article : Google Scholar : PubMed/NCBI
|
|
10
|
Rahmat JN, Esuvaranathan K and Mahendran
R: Bacillus Calmette-Guérin induces cellular reactive oxygen
species and lipid peroxidation in cancer cells. Urology.
79:1411.e15–e20. 2012. View Article : Google Scholar
|
|
11
|
De Boer EC, Rooijakkers SJ, Schamhart DH
and Kurth KH: Cytokine gene expression in a mouse model: The first
instillations with viable bacillus Calmette-Guerin determine the
succeeding Th1 response. J Urol. 170:2004–2008. 2003. View Article : Google Scholar : PubMed/NCBI
|
|
12
|
Rentsch CA, Birkhäuser FD, Biot C, Gsponer
JR, Bisiaux A, Wetterauer C, Lagranderie M, Marchal G, Orgeur M,
Bouchier C, et al: Bacillus Calmette-Guérin strain differences have
an impact on clinical outcome in bladder cancer immunotherapy. Eur
Urol. 66:677–688. 2014. View Article : Google Scholar : PubMed/NCBI
|
|
13
|
Secanella-Fandos S, Luquin M and Julián E:
Connaught and Russian strains showed the highest direct antitumor
effects of different Bacillus Calmette-Guérin substrains. J Urol.
189:711–718. 2013. View Article : Google Scholar : PubMed/NCBI
|
|
14
|
Pook SH, Rahmat JN, Esuvaranathan K and
Mahendran R: Internalization of mycobacterium bovis, bacillus
calmette guerin, by bladder cancer cells is cytotoxic. Oncol Rep.
18:1315–1320. 2007.PubMed/NCBI
|
|
15
|
Pastorian K, Hawel L III and Byus CV:
Optimization of cDNA representational difference analysis for the
identification of differentially expressed mRNAs. Anal Biochem.
283:89–98. 2000. View Article : Google Scholar : PubMed/NCBI
|
|
16
|
Seow SW, Rahmat JN, Bay BH, Lee YK and
Mahendran R: Expression of chemokine/cytokine genes and immune cell
recruitment following the instillation of mycobacterium bovis,
bacillus calmette-guerin or lactobacillus rhamnosus strain GG in
the healthy murine bladder. Immunology. 124:419–427. 2008.
View Article : Google Scholar : PubMed/NCBI
|
|
17
|
Hwang NR, Yim SH, Kim YM, Jeong J, Song
EJ, Lee Y, Lee JH, Choi S and Lee KJ: Oxidative modifications of
glyceraldehyde-3-phosphate dehydrogenase play a key role in its
multiple cellular functions. Biochem J. 423:253–264. 2009.
View Article : Google Scholar : PubMed/NCBI
|
|
18
|
Rienksma RA, Suarez-Diez M, Mollenkopf HJ,
Dolganov GM, Dorhoi A, Schoolnik GK, Dos Santos Martins VA,
Kaufmann SH, Schaap PJ and Gengenbacher M: Comprehensive insights
into transcriptional adaptation of intracellular mycobacteria by
microbe-enriched dual RNA sequencing. BMC Genomics. 16:342015.
View Article : Google Scholar : PubMed/NCBI
|
|
19
|
Mendes-Giannini MJ, Hanna SA, da Silva JL,
Andreotti PF, Vincenzi LR, Benard G, Lenzi HL and Soares CP:
Invasion of epithelial mammalian cells by Paracoccidioides
brasiliensis leads to cytoskeletal rearrangement and apoptosis of
the host cell. Microbes Infect. 6:882–891. 2004. View Article : Google Scholar : PubMed/NCBI
|
|
20
|
Zhang Y, Khoo HE and Esuvaranathan K:
Effects of bacillus Calmette-Guerin and interferon-alpha-2B on
human bladder cancer in vitro. Int J Cancer. 71:851–857. 1997.
View Article : Google Scholar : PubMed/NCBI
|
|
21
|
Dourado DF, Fernandes PA and Ramos MJ:
Mammalian cytosolic glutathione transferases. Curr Protein Pept
Sci. 9:325–337. 2008. View Article : Google Scholar : PubMed/NCBI
|
|
22
|
Simic T, Savic-Radojevic A,
Pljesa-Ercegovac M, Matic M and Mimic-Oka J: Glutathione
S-transferases in kidney and urinary bladder tumors. Nat Rev Urol.
6:281–289. 2009. View Article : Google Scholar : PubMed/NCBI
|
|
23
|
Johansson K, Järvliden J, Gogvadze V and
Morgenstern R: Multiple roles of microsomal glutathione transferase
1 in cellular protection: A mechanistic study. Free Radic Biol Med.
49:1638–1645. 2010. View Article : Google Scholar : PubMed/NCBI
|
|
24
|
West AP, Brodsky IE, Rahner C, Woo DK,
Erdjument-Bromage H, Tempst P, Walsh MC, Choi Y, Shadel GS and
Ghosh S: TLR signalling augments macrophage bactericidal activity
through mitochondrial ROS. Nature. 472:476–480. 2011. View Article : Google Scholar : PubMed/NCBI
|
|
25
|
Ke HL, Lin J, Ye Y, Wu WJ, Lin HH, Wei H,
Huang M, Chang DW, Dinney CP and Wu X: Genetic variations in
glutathione pathway genes predict cancer recurrence in patients
treated with transurethral resection and bacillus Calmette-Guerin
instillation for non-muscle invasive bladder cancer. Ann Surg
Oncol. 22:4104–4110. 2015. View Article : Google Scholar : PubMed/NCBI
|
|
26
|
Visvikis O, Boyer L, Torrino S, Doye A,
Lemonnier M, Lorès P, Rolando M, Flatau G, Mettouchi A, Bouvard D,
et al: Escherichia coli producing CNF1 toxin hijacks Tollip to
trigger Rac1-dependent cell invasion. Traffic. 12:579–590. 2011.
View Article : Google Scholar : PubMed/NCBI
|
|
27
|
Zhu L, Wang L, Luo X, Zhang Y, Ding Q,
Jiang X, Wang X, Pan Y and Chen Y: Tollip, an intracellular
trafficking protein, is a novel modulator of the transforming
growth factor-β signaling pathway. J Biol Chem. 287:39653–39663.
2012. View Article : Google Scholar : PubMed/NCBI
|
|
28
|
Shah JA, Vary JC, Chau TT, Bang ND, Yen
NT, Farrar JJ, Dunstan SJ and Hawn TR: Human TOLLIP regulates TLR2
and TLR4 signaling and its polymorphisms are associated with
susceptibility to tuberculosis. J Immunol. 189:1737–1746. 2012.
View Article : Google Scholar : PubMed/NCBI
|
|
29
|
Montaner LJ, da Silva RP, Sun J,
Sutterwala S, Hollinshead M, Vaux D and Gordon S: Type 1 and type 2
cytokine regulation of macrophage endocytosis: Differential
activation by IL-4/IL-13 as opposed to IFN-gamma or IL-10. J
Immunol. 162:4606–4613. 1999.PubMed/NCBI
|
|
30
|
Jung JY and Robinson CM: IL-12 and IL-27
regulate the phagolysosomal pathway in mycobacteria-infected human
macrophages. Cell Commun Signal. 12:162014. View Article : Google Scholar : PubMed/NCBI
|
|
31
|
Rivero-Lezcano OM, González-Cortés C,
Reyes-Ruvalcaba D and Diez-Tascón C: CCL20 is overexpressed in
Mycobacterium tuberculosis-infected monocytes and inhibits the
production of reactive oxygen species (ROS). Clin Exp Immunol.
162:289–297. 2010. View Article : Google Scholar : PubMed/NCBI
|
|
32
|
Kadhim SA, Chin JL, Batislam E, Karlik SJ,
Garcia B and Skamene E: Genetically regulated response to
intravesical bacillus Calmette Guerin immunotherapy of orthotopic
murine bladder tumor. J Urol. 158:646–652. 1997. View Article : Google Scholar : PubMed/NCBI
|
|
33
|
Poirier V, Bach H and Av-Gay Y:
Mycobacterium tuberculosis promotes anti-apoptotic activity of the
macrophage by PtpA protein-dependent dephosphorylation of host
GSK3α. J Biol Chem. 289:29376–29385. 2014. View Article : Google Scholar : PubMed/NCBI
|
|
34
|
Castandet J, Prost JF, Peyron P,
Astarie-Dequeker C, Anes E, Cozzone AJ, Griffiths G and
Maridonneau-Parini I: Tyrosine phosphatase MptpA of Mycobacterium
tuberculosis inhibits phagocytosis and increases actin
polymerization in macrophages. Res Microbiol. 156:1005–1013. 2005.
View Article : Google Scholar : PubMed/NCBI
|
|
35
|
Islam N, Kanost AR, Teixeira L, Johnson J,
Hejal R, Aung H, Wilkinson RJ, Hirsch CS and Toossi Z: Role of
cellular activation and tumor necrosis factor-alpha in the early
expression of Mycobacterium tuberculosis 85B mRNA in human alveolar
macrophages. J Infect Dis. 190:341–351. 2004. View Article : Google Scholar : PubMed/NCBI
|