Introduction
Esophageal squamous cell carcinoma (ESCC) is one of
histologic subtypes of esophageal cancer, and it occurs at a
relatively high frequency in China, with five-year survival rates
of 14% in Hong Kong (1). However, the
molecular mechanism underlying the development of ESCC remains
poorly understood.
In recent years, substantial advances have been made
in ESCC research. Signal transducer and activator of transcription
3 (STAT3) has been demonstrated to be upregulated by the
β-catenin/T cell factor pathway in ESCC (2). STAT3β expression is significantly
associated with a shorter survival time for patients with ESCC, and
it may suppress the oncogenic effects of STAT3α in ESCC cell lines
(3). Furthermore, xerophilusin B can
induce the G2/M cell cycle arrest and apoptosis of ESCC
cells (4). A previous study
identified that extracellular matrix protein 1b is downregulated in
ESCC compared with normal esophageal tissues, and that it served a
potential suppressive function in tumorigenesis and metastasis
(1). Additionally, plasma matrix
metalloproteinase 1 was observed to be highly expressed in ESCC
compared with normal esophageal tissues, and it may have
contributed to the detection and survival prediction of ESCC
(5). However, the pathogenesis of
ESCC is not yet completely characterized.
In 2010, Lee et al (6) performed gene expression profiling to
investigate target genes for hypoxia-inducible factor (HIF) in the
esophageal tumor microenvironment; the study identified a number of
HIF target genes, including prostaglandin E synthase,
cyclooxygenase 2 and insulin-like growth factor binding protein-3.
However, the co-expression networks and functional enrichment
analysis of the differentially expressed genes (DEGs) in the ESCC
samples were not investigated. In the present study, the microarray
dataset of GSE17351 produced by Lee et al (6) was analyzed to identify DEGs in ESCC
samples. Following this, the Weighted Correlation Network Analysis
(WGCNA), a systems biology method for identifying the correlation
between genes across microarray samples (7), was used to analyze co-expression
networks for the upregulated DEGs. Subsequently, gene ontology (GO)
and pathway enrichment analyses were performed for the DEGs in the
two most significant network modules. Additionally, the DEGs were
validated using another gene expression dataset, GSE20347 (8) from the Gene Expression Omnibus (GEO).
These results may contribute to an improved understanding of the
etiology of ESCC.
Materials and methods
Affymetrix microarray data
The GSE17351 microarray expression profile (6), based on the platform of the GPL570
[HG-U133_Plus_2] Affymetrix Human Genome U133 Plus 2.0 Array
(Affymetrix; Thermo Fisher Scientific, Inc., Waltham, MA, USA), was
downloaded from the GEO (http://www.ncbi.nlm.nih.gov/geo/) database. The
dataset contains 5 tumor esophageal mucosa samples and 5 adjacent
normal esophageal mucosa samples from 5 male patients with ESCC,
with an age range of 51–76 years. All esophageal tissues were
originally obtained through surgery at the Okayama University
Hospital, Kitano Hospital and the Hospital of the University of
Pennsylvania through the Cooperative Human Tissue Network (6).
Data preprocessing
The expression values of all probes in each sample
were reduced to a single value by determining the mean expression
value via the aggregate function method (9). Missing data were assigned using the
k-nearest neighbor method (10).
Quantile normalization for complete data was performed using the
preprocess Core package in Bioconductor (11). When numerous probes were mapped to one
gene, the mid-value of the data was defined as the expression level
of the gene. However, when numerous genes were mapped by one probe,
this probe was considered to lack specificity, and was removed from
the analysis.
Identification of DEGs
The Linear Models for Microarray Data package of
Bioconductor (12) was used to
identify genes that were significantly differentially expressed in
ESCC samples. The raw P-value was adjusted using the Benjamin and
Hochberg method (13), and a
|log2 fold change (FC)|>0.585 and P<0.05 were
selected as the cut-off criteria.
Construction of co-expression networks
and identification of co-expression network modules
The WGCNA package of R (7) was used to analyze the co-expression
network for DEGs, and the co-expression networks were visualized
using Cytoscape (Version 3.2.0) (14). The weighting coefficient β was set to
25. The adjacency matrix power method (15) was used to transfer matrixes to
weighted co-expression networks.
Co-expression network modules were obtained using a
hierarchical clustering algorithm (16). The number of genes in each module was
at least 30. Then, the significant modules were identified using
correlation coefficient and network significance methods included
in the WGCNA package. Gene significance (GS) measure was defined as
a function GS, and a module significance (MS) measure as a mean of
the GS in the module. A larger MS value indicated a greater
association of a module with ESCC.
GO and pathway enrichment analyses for
DEGs in the significant modules
The WGCNA package was used to obtain significant GO
terms for DEGs in the significant modules, and the cluster Profiler
package of R (17) was used to
perform Kyoto Encyclopedia of Genes and Genomes (KEGG) enrichment
analysis for DEGs in modules. P<0.05 was selected as the cut-off
criterion.
Data validation of the DEGs
The gene expression dataset GSE20347 (8) from GEO was used to validate the
expression of the identified DEGs. The dataset included the data
from 17 micro-dissected ESCC tumor tissues and 17 matched normal
adjacent tissues from patients with ESCC. The data were with the
GPL571 [HG-U133A_2] Affymetrix Human Genome U133A 2.0 Array
platform (Affymetrix; Thermo Fisher Scientific, Inc.).
Data preprocessing and DEG identification were
performed with the same methods as for the data in GSE17351. The
overlapping upregulated and downregulated DEGs between GSE20347 and
GSE17351 were identified and illustrated using an online Venn
diagram plotter tool (https://omics.pnl.gov/software/venn-diagram-plotter).
The overlapping DEGs were considered to be preliminarily validated
by the GSE20347 dataset.
Results
Identification of DEGs
Following data preprocessing, a total of 6,899 genes
in 10 samples were excluded. Based on the cut-off criteria, 955
DEGs were identified, including 487 upregulated and 468
downregulated DEGs.
Analysis of co-expression network
modules
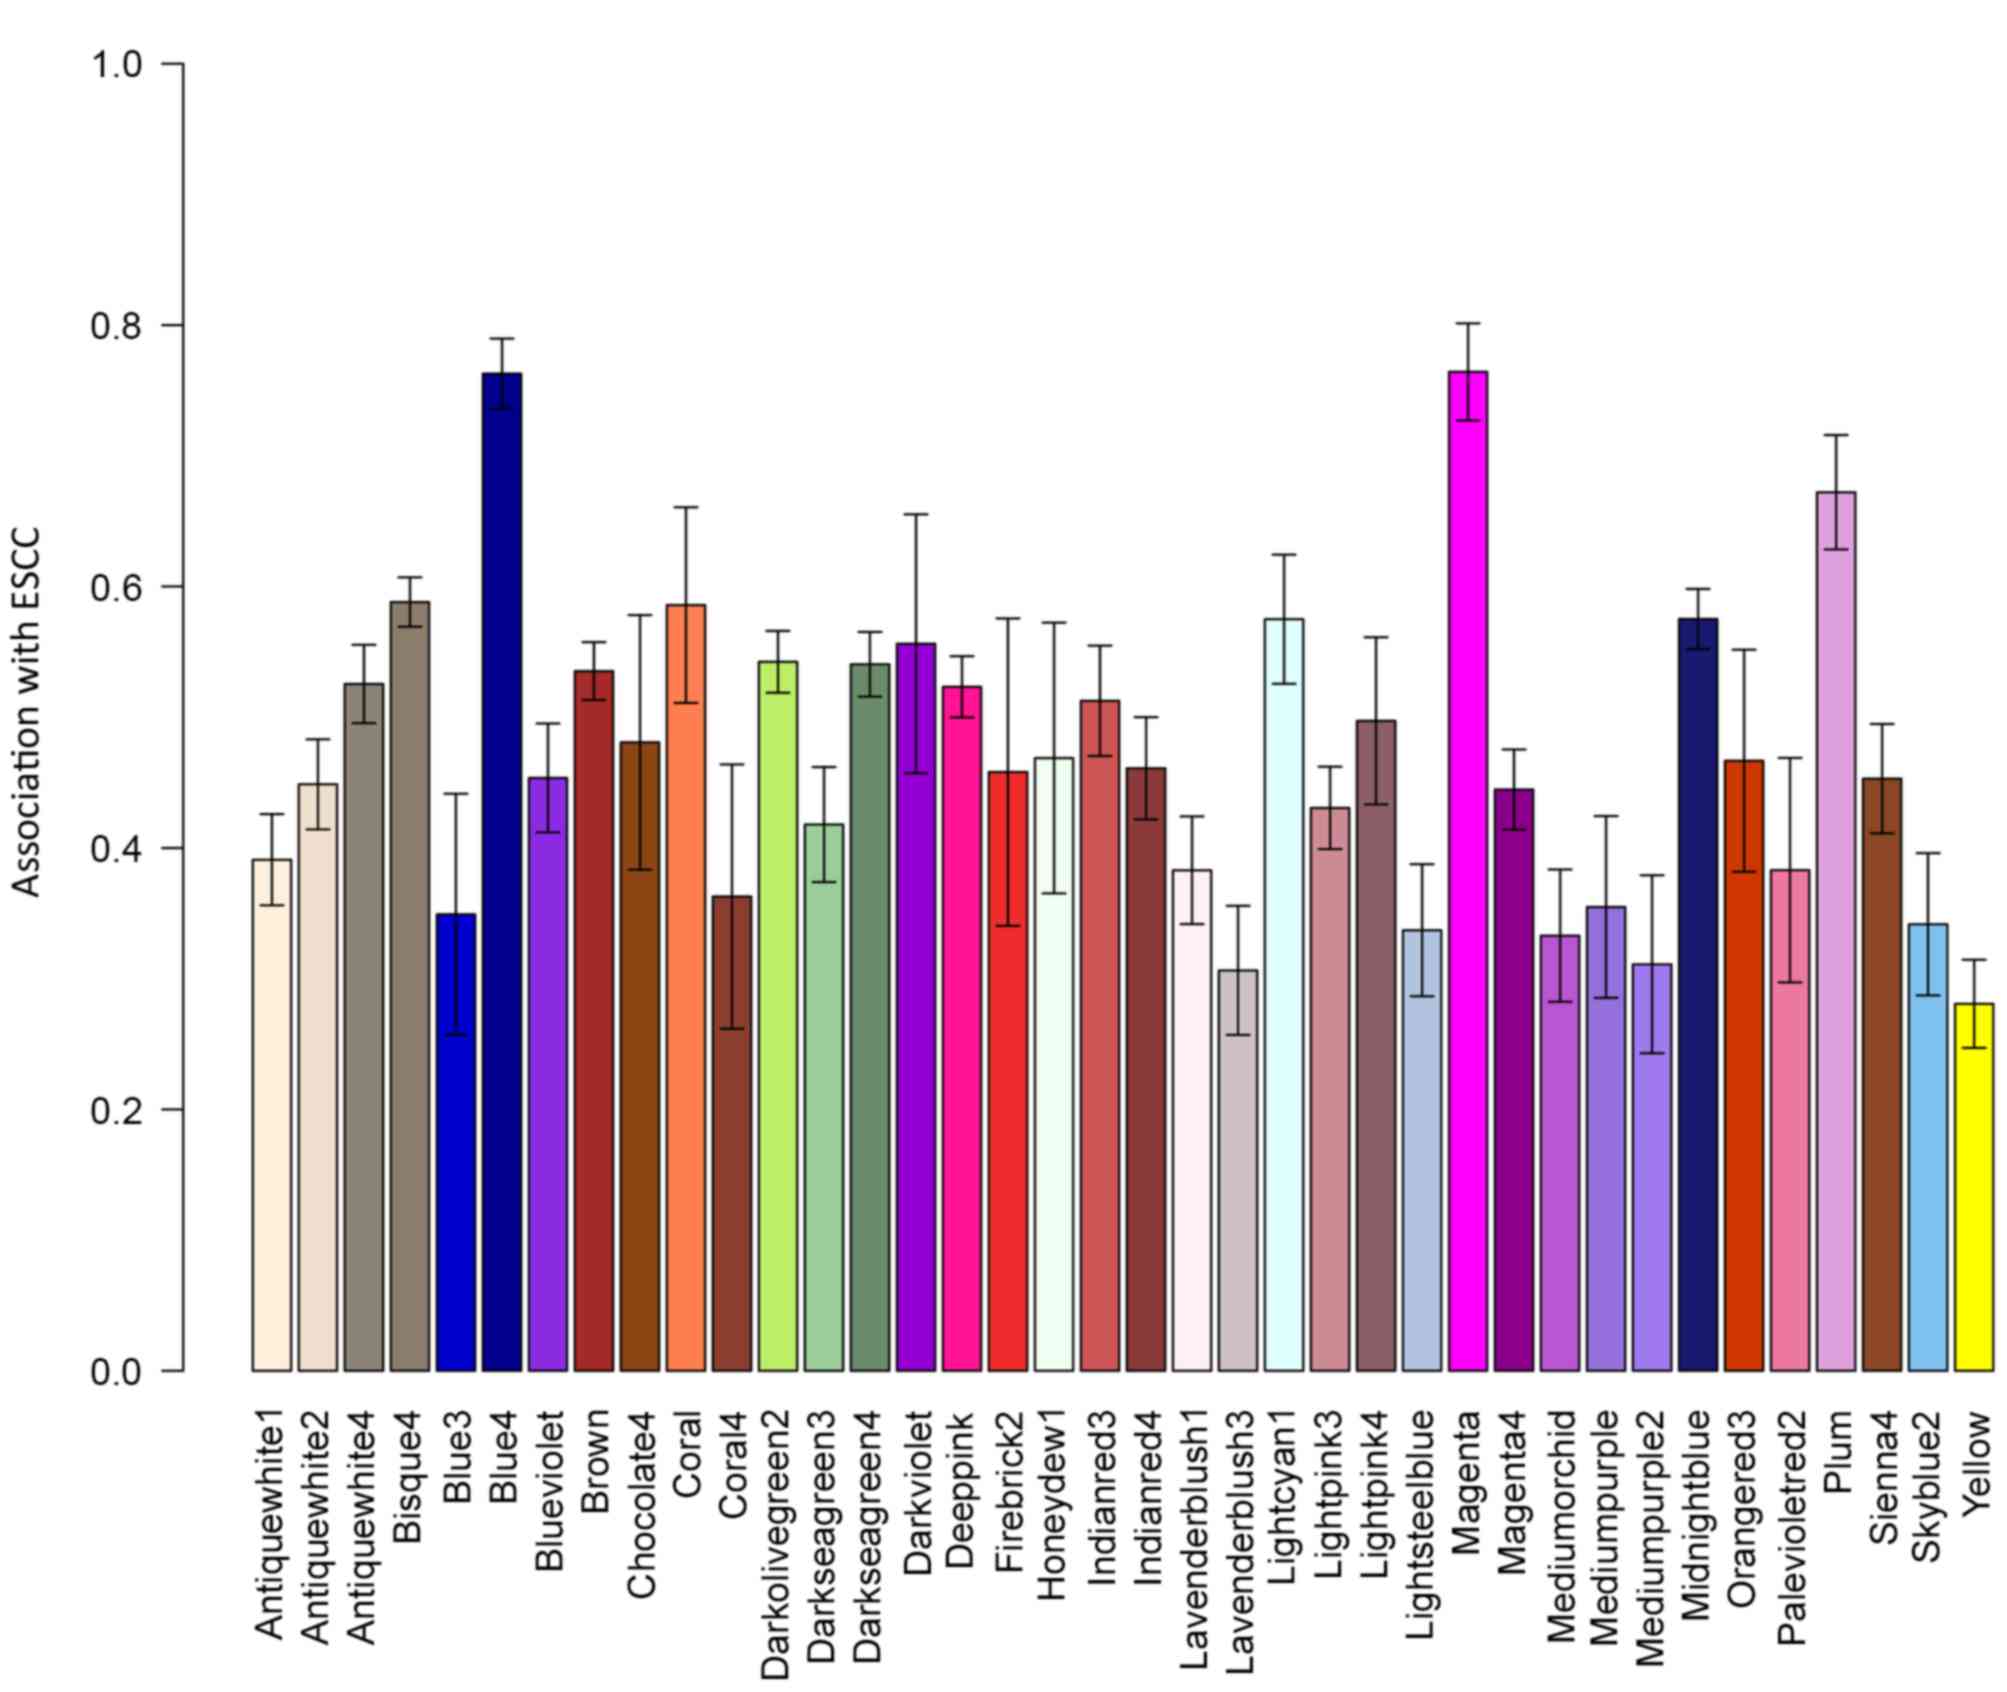
A total of 24 co-expression network modules were
identified. Of these 24, the modules ‘blue4’ and ‘magenta’ were the
most significantly associated with ESCC (Fig. 1).
Construction of co-expression
subnetworks for the blue4 and magenta modules
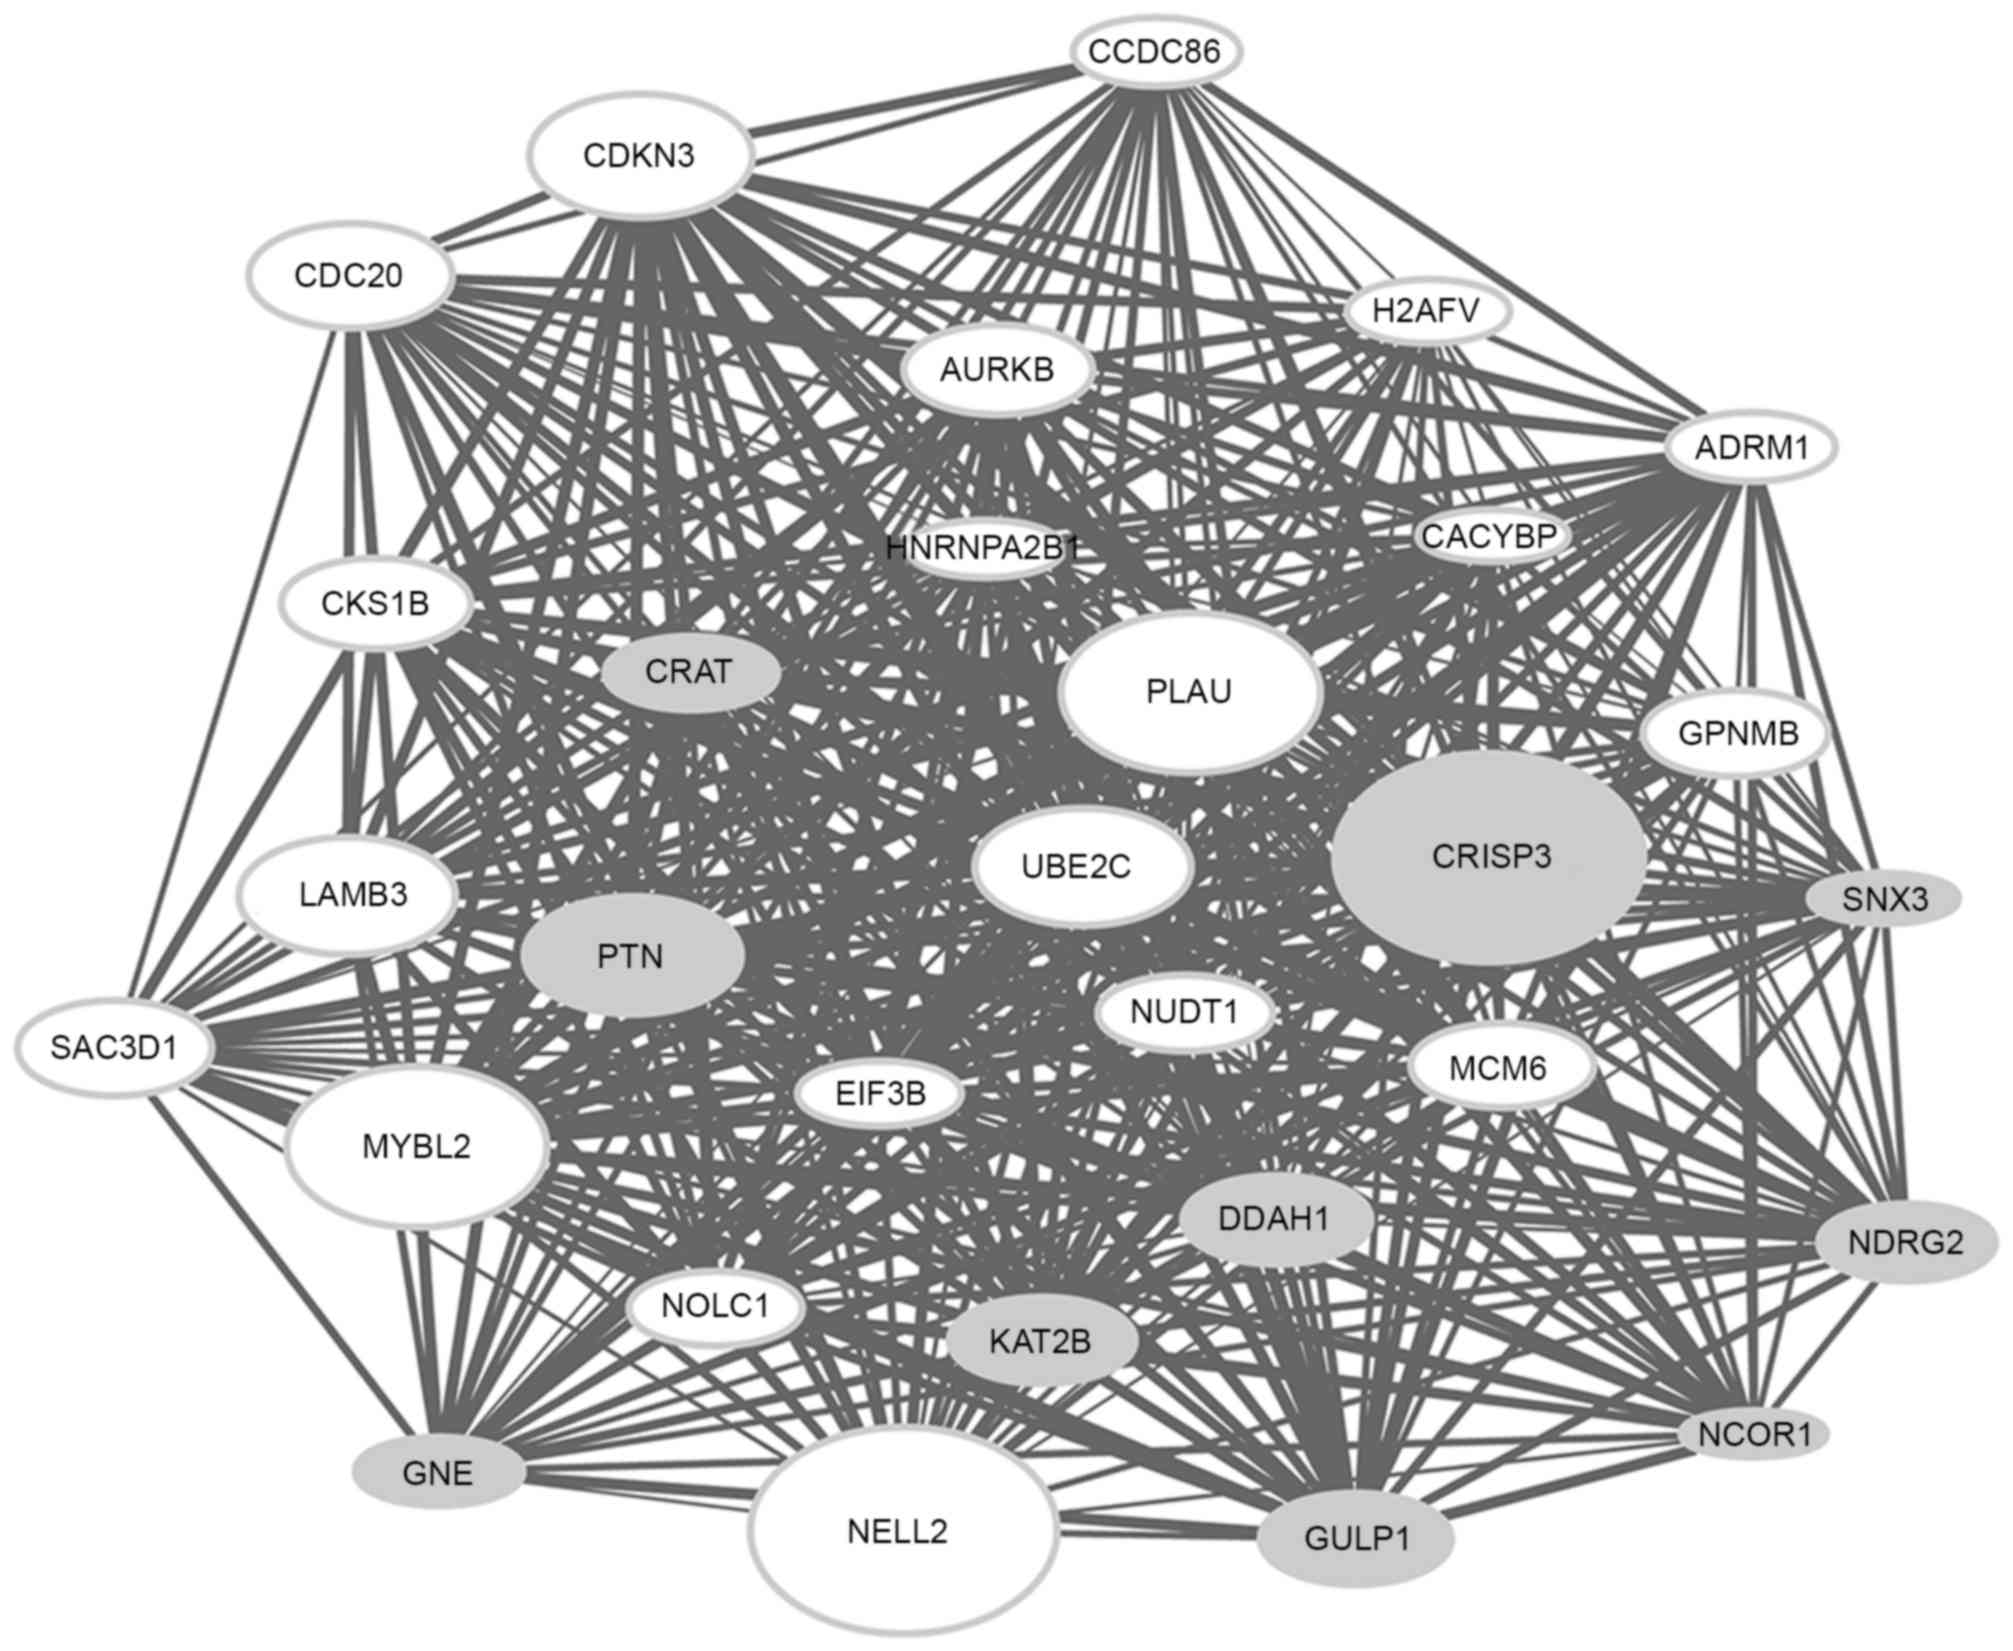
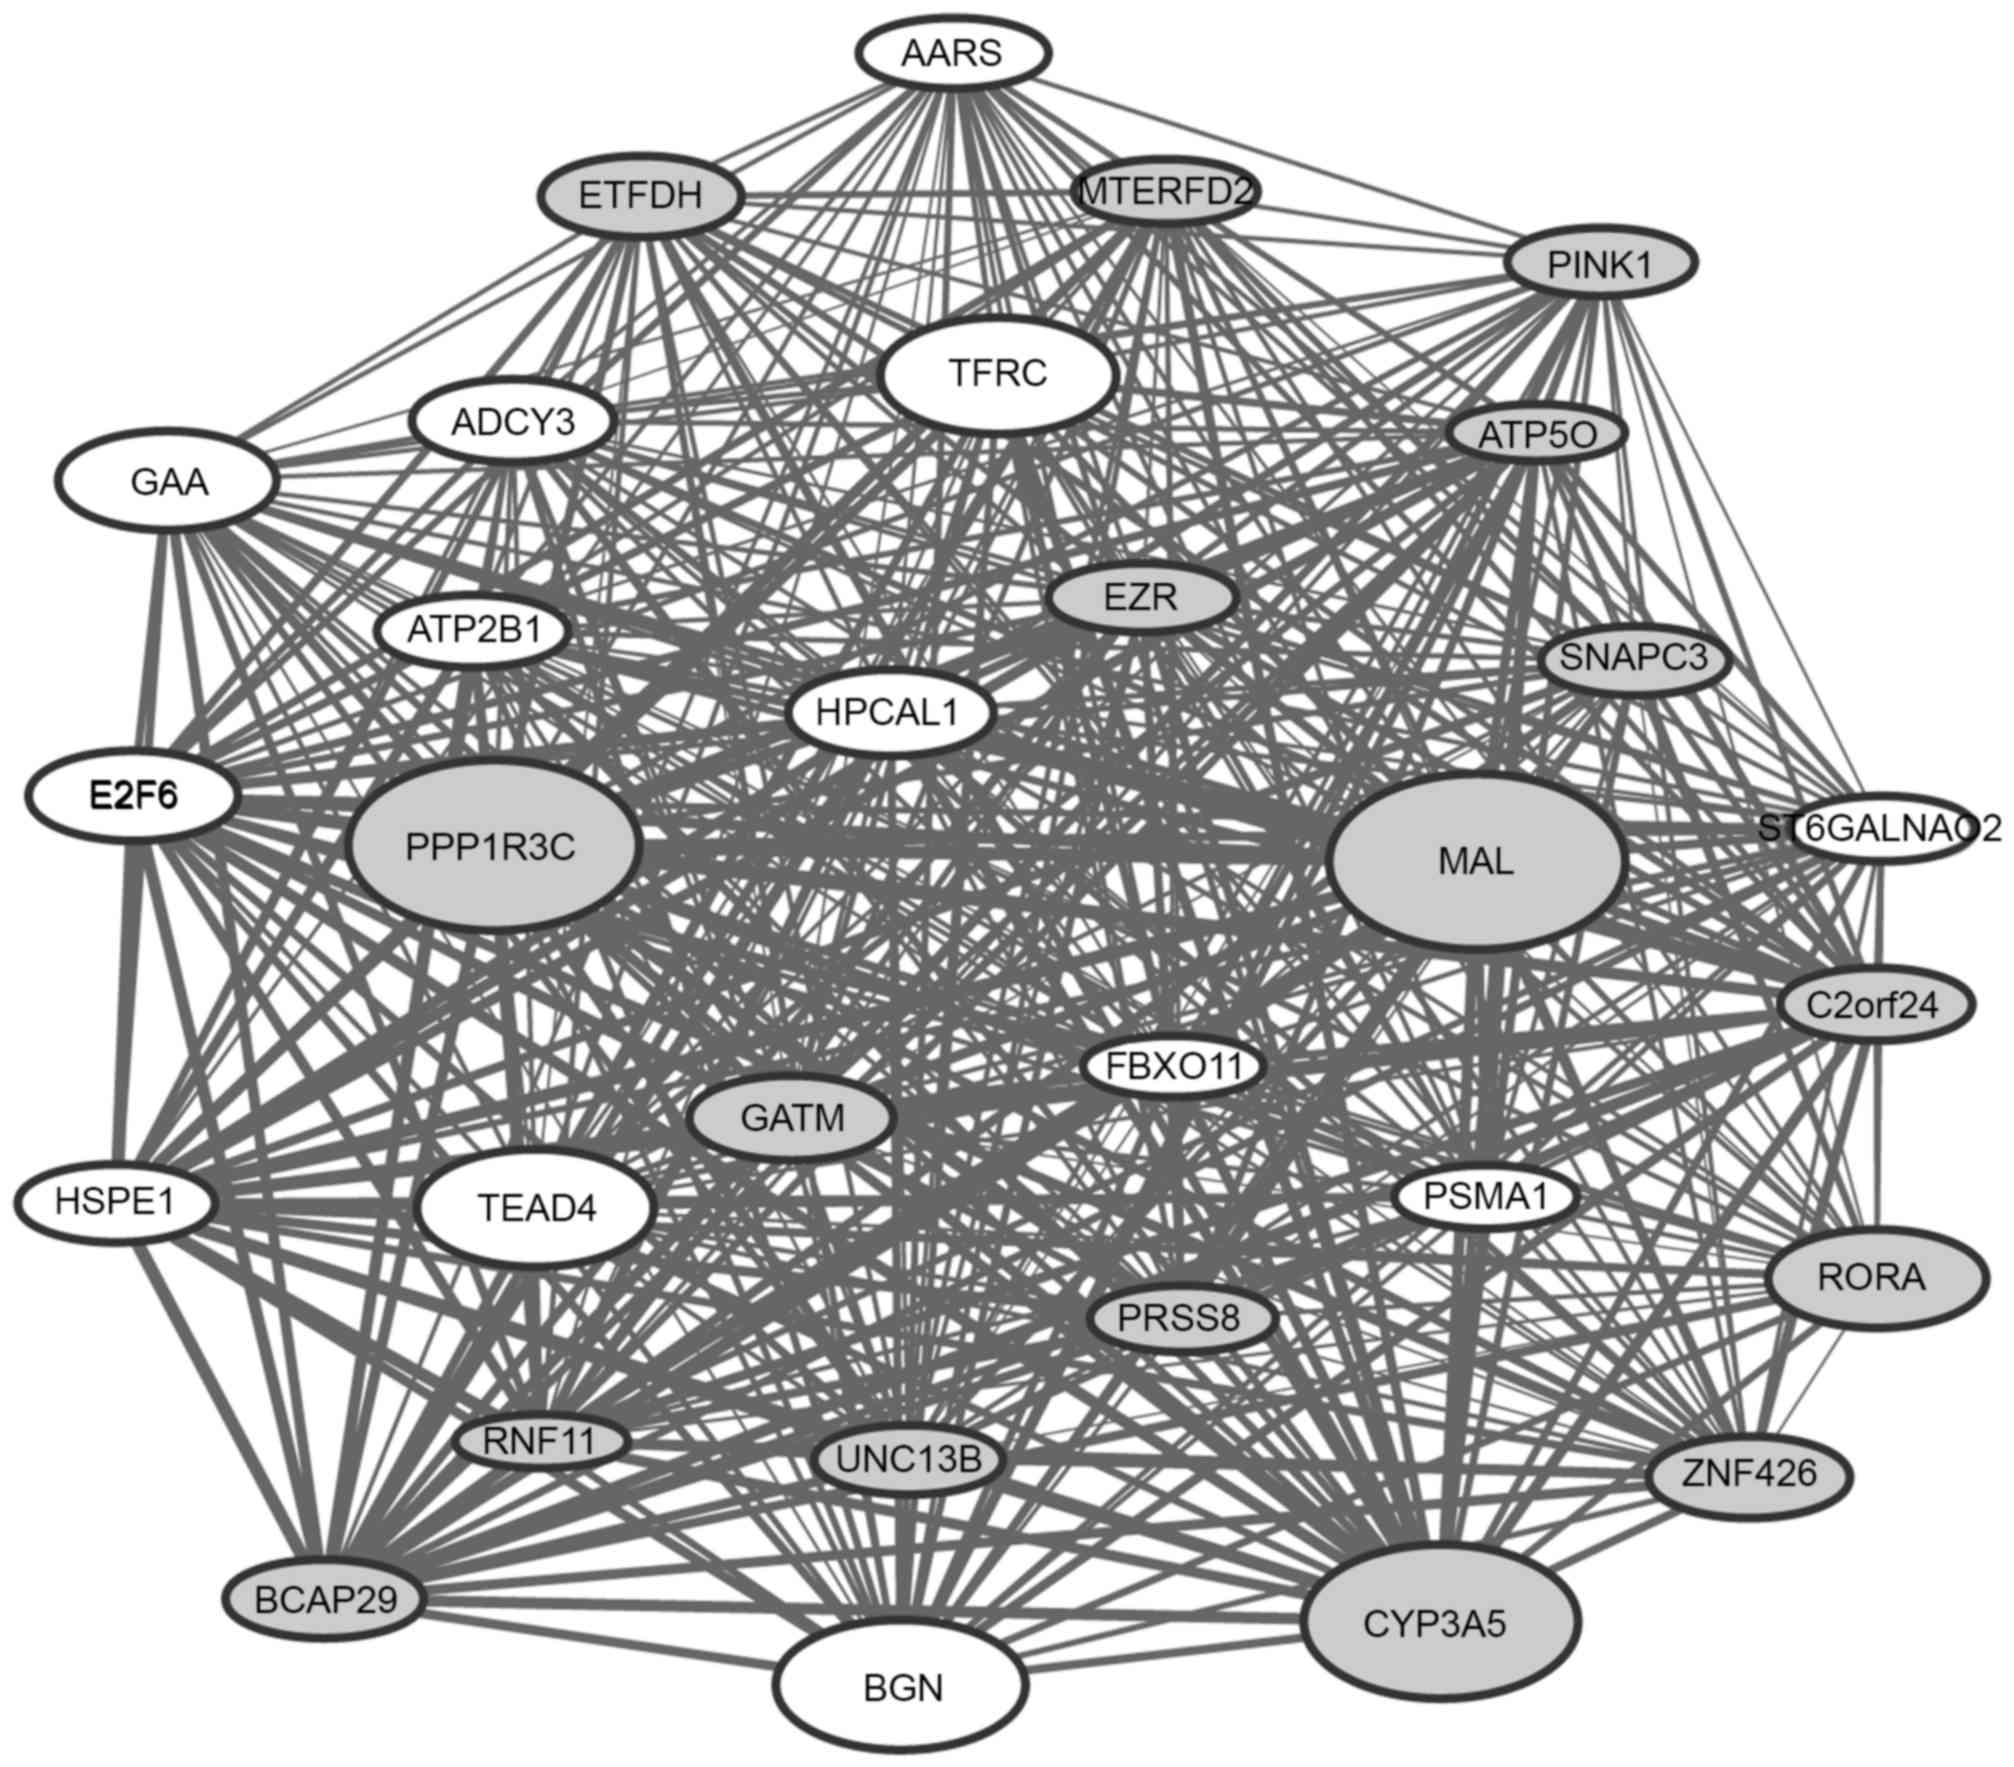
The top 30 genes with the highest connectivity
degree in the modules blue4 and magenta were selected for the
construction of co-expression subnetworks. In the co-expression
subnetworks of the modules blue4 (Fig.
2) and magenta (Fig. 3), there
were 435 gene interactions per module.
It was observed that a number of DEGs [including
cysteine rich secretory protein 3 (CRISP3), neural EGFL like
2 (NELL2), MYB proto-oncogene like 2 (MYBL2) and
plasminogen activator, urokinase (PLAU)] in the
co-expression subnetwork of the module blue4 and a number of DEGs
[including MAL, protein phosphatase 1 regulatory subunit 3C
(PPP1R3C), cytochrome P450 family 3 subfamily A member 5
(CYP3A5) and biglycan (BGN)] in the co-expression
subnetwork of the module magenta had a particularly high
|log2FC|, indicating that these genes may have a greater
extent of association with ESCC.
Enrichment analyses for the DEGs in
the co-expression subnetworks of the modules blue4 and magenta
According to GO enrichment analysis, DEGs in the
co-expression subnetwork of the module blue4 were predominantly
enriched in GO terms regarding cell division, including ‘spindle
organization’ [e.g., ubiquitin conjugating enzyme E2 C
(UBE2C) and SAC3 domain containing 1 (SAC3D1)], ‘cell
cycle process’ [e.g., UBE2C, minichromosome maintenance
complex component 6 (MCM6) and cell division cycle 20
(CDC20)], ‘protein binding’ (e.g., UBE2C, MCM6 and
CDC20) and ‘anaphase-promoting complex’ (APC; e.g.,
UBE2C and CDC20; Table
I). In addition, two KEGG pathways were significantly enriched,
including ‘cell cycle’ (CDC20 and MCM6) and
‘ubiquitin mediated proteolysis’ (e.g., UBE2C and
CDC20; Table II).
 | Table I.Top 5 most significantly enriched GO
terms for the 30 differentially expressed genes with the highest
connectivity degree in the module ‘blue4’ in BP and CC, and all
significantly enriched terms in MF. |
Table I.
Top 5 most significantly enriched GO
terms for the 30 differentially expressed genes with the highest
connectivity degree in the module ‘blue4’ in BP and CC, and all
significantly enriched terms in MF.
| Category | ID | Term | P-value | Count | Genes |
|---|
| BP | GO:0007051 | Spindle
organization | 0.000091 | 5 | UBE2C, SAC3D1,
MYBL2, AURKB, NCOR1 |
| BP | GO:0051225 | Spindle
assembly | 0.000131 | 4 | SAC3D1, MYBL2,
AURKB, NCOR1 |
| BP | GO:0022402 | Cell cycle
process | 0.000602 | 10 | CDKN3, UBE2C,
SAC3D1, MCM6, MYBL2, KAT2B, AURKB, NOLC1, NCOR1, CDC20 |
| BP | GO:0000280 | Nuclear
division | 0.001058 | 6 | UBE2C, SAC3D1,
MYBL2, AURKB, NOLC1, CDC20 |
| BP | GO:0007067 | Mitosis | 0.001058 | 6 | UBE2C, SAC3D1,
MYBL2, AURKB, NOLC1, CDC20 |
| MF | GO:0005515 | Protein
binding | 0.004683 | 22 | CDKN3, GPNMB,
ADRM1, UBE2C, LAMB3, MCM6, NELL2, PLAU, NDRG2, CDC20… |
| MF | GO:0005488 | Binding | 0.032021 | 26 | GNE, CDKN3, GPNMB,
ADRM1, UBE2C, MCM6, NELL2, PLAU, NDRG2, CDC20… |
| CC | GO:0005680 | Anaphase-promoting
complex | 0.013075 | 2 | UBE2C, CDC20 |
| CC | GO:0031974 | Membrane-enclosed
lumen | 0.013075 | 12 | UBE2C, CRAT,
CACYBP, HNRNPA2B1, MCM6, NUDT1, CCDC86, KAT2B, AURKB, CDC20… |
| CC | GO:0005819 | Spindle | 0.013075 | 4 | SAC3D1, AURKB,
NCOR1, CDC20 |
| CC | GO:0000152 | Nuclear ubiquitin
ligase complex | 0.013075 | 2 | UBE2C, CDC20 |
| CC | GO:0044427 | Chromosomal
part | 0.018472 | 5 | MYBL2, KAT2B,
AURKB, H2AFV, NCOR1 |
| Table II.Enriched pathways for differentially
expressed genes in the module ‘blue4’. |
Table II.
Enriched pathways for differentially
expressed genes in the module ‘blue4’.
| ID | Description | P-value | Count | Genes |
|---|
| hsa04110 | Cell cycle | 0.022640607 | 2 | CDC20, MCM6 |
| hsa04120 | Ubiquitin mediated
proteolysis | 0.026418251 | 2 | UBE2C, CDC20 |
DEGs in the co-expression subnetwork of the magenta
module were mainly enriched in GO terms associated with metabolism,
including ‘energy derivation by oxidation of organic compounds’
e.g., adenylate cyclase 3 (ADCY3), electron transfer
flavoprotein dehydrogenase (ETFDH) and glucosidase α, acid
(GAA), ‘primary metabolic process’ [e.g., CYP3A5, TEA
domain transcription factor 4 (TEAD4) and transferrin
receptor (TFRC)], and ‘intracellular membrane-bounded
organelle’ (e.g., TEAD4 and TFRC; Table III). However, no KEGG pathways were
significantly enriched in the DEGs of the co-expression subnetwork
in the magenta module.
| Table III.Top 5 most enriched GO terms for
differentially expressed genes in the ‘magenta’ module in BP and
CC. |
Table III.
Top 5 most enriched GO terms for
differentially expressed genes in the ‘magenta’ module in BP and
CC.
| Category | ID | Term | P-value | Count | Genes |
|---|
| BP | GO:0015980 | Energy derivation
by oxidation of organic compounds | 0.018735 | 5 | ADCY3, ETFDH, GAA,
ATP5O, PPP1R3C |
| BP | GO:0055114 | Oxidation-reduction
process | 0.018735 | 6 | ADCY3, CYP3A5,
ETFDH, GAA, ATP5O, PPP1R3C |
| BP | GO:0006091 | Generation of
precursor metabolites and energy | 0.027604 | 5 | ADCY3, ETFDH, GAA,
ATP5O, PPP1R3C |
| BP | GO:0044238 | Primary metabolic
process | 0.027604 | 23 | CNPPD1, HSPE1,
ATP5O, PPP1R3C, PRSS8, SNAPC3, TEAD4, TFRC, ZNF426, FBXO11… |
| BP | GO:0021680 | Cerebellar Purkinje
cell layer development | 0.032836 | 2 | AARS, RORA |
| CC | GO:0044429 | Mitochondrial
part | 0.022333 | 6 | MTERFD2, ETFDH,
GATM, HSPE1, ATP5O, PINK1 |
| CC | GO:0043231 | Intracellular
membrane-bounded organelle | 0.022333 | 23 | PSMA1, RORA, BGN,
PINK1, SNAPC3, TEAD4, TFRC, EZR, ZNF426, FBXO11… |
| CC | GO:0043227 | Membrane-bounded
organelle | 0.022333 | 23 | PSMA1, RORA, BGN,
PINK1, SNAPC3, TEAD4, TFRC, EZR, ZNF426, FBXO11… |
| CC | GO:0031974 | Membrane-enclosed
lumen | 0.023484 | 11 | MTERFD2, ETFDH,
GATM, HSPE1, PSMA1, RORA, BGN, SNAPC3, TEAD4, FBXO11… |
| CC | GO:0044444 | Cytoplasmic
part | 0.033213 | 18 | RNF11, HSPE1, MAL,
ATP5O, BCAP29, PSMA1, BGN, PINK1, TFRC, EZR… |
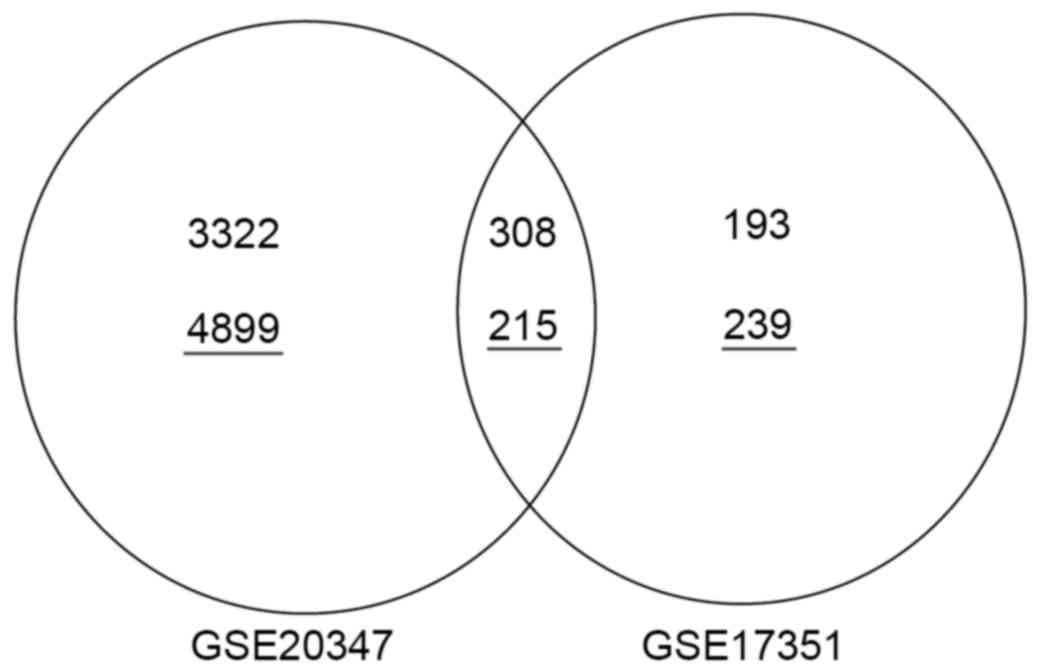
Validation of DEGs
In total, 308 upregulated genes (e.g., UBE2C,
CDC20, MCM6, TFRC and TEAD4) and 215 downregulated genes
(e.g., PPP1R3C and MAL) were identified as
overlapping between the GSE17351 and GSE20347 datasets (Fig. 4).
Discussion
In the present study, a total of 955 DEGs were
identified, including 487 upregulated and 468 downregulated DEGs.
According to WGCNA analysis, two significant co-expression network
modules, blue4 and magenta, were identified. The GO and KEGG
pathway enrichment analyses for the top 30 DEGs with the highest
connectivity degrees in the module blue4 revealed that a number of
DEGs were associated with the ‘cell cycle’ and ‘ubiquitin mediated
proteolysis’ KEGG pathways, including UBE2C, CDC20 and
MCM6.
UBE2C encodes a member of the E2
ubiquitin-conjugating enzyme family, which is involved in protein
ubiquitination (18). UBE2C is
associated with cell cycle progression and checkpoint control, as
it modulates the degradation of short-lived proteins (19). A previous study reported that
UBE2C expression was elevated in 73% (11 of 15) of
esophageal adenocarcinoma samples relative to Barrett's metaplasia,
and the transfection of UBE2C small interfering (si)RNA
induced the inhibition of cell proliferation and a distortion in
cell cycle distribution (20).
Furthermore, key roles of UBE2C have been demonstrated in
other cancer types, including hepatocellular carcinoma (21), cervical carcinoma (22), non-small cell lung cancer (23) and pancreatic ductal adenocarcinoma
(24). UBE2C and CDC20
were identified as being associated with the term
‘anaphase-promoting complex’ in the present study. The APC serves a
crucial role in modulating cell cycle progression via forming two
functionally distinct E3 ubiquitin ligase subcomplexes,
APCCdc20 and APCCadherin 1 (25). The inhibition of CDC20 by siRNA may
induce G2/M cell cycle arrest and suppress cell growth;
CDC20 is negatively regulated by p53 (26).
Accumulating evidence has demonstrated that CDC20
serves a notable function in the development and progression of
human cancer (27). Thus,
UBE2C and CDC20 may be associated with ESCC.
MCM6 is essential for the initiation of eukaryotic genome
replication. A previous study reported that MCM6 is
potentially associated with the lymph node metastasis of ESCC
(28), indicating the crucial role of
MCM6 in ESCC. In the network, UBE2C, CDC20 and
MCM6 were all connected with CRISP3, which had a high
|log2FC|. The low expression of CRISP3 in ESCC
compared with normal tissue was identified in a previous study
(29), consistent with the result of
the present study. The DNA copy number loss of CRISP3 has
been demonstrated in oral squamous cell carcinoma. Thus, it may be
speculated that CRISP3 is associated with the carcinogenesis
of ESCC. Furthermore, NELL2 was observed to have a higher
|log2FC| in the co-expression subnetwork of the module
blue4 in the present study; it was coexpressed with UBE2C,
CDC20, MCM6 and CRISP3. A homolog of NELL2, it
has been demonstrated that the promoter hypermethylation of
NELL1 is higher in ESCC than in normal esophagus tissues,
and that it is associated with poor prognosis in early-stage
esophageal adenocarcinoma (30).
Hence, it may be speculated that NELL2 may function in the
occurrence of ESCC.
In the co-expression subnetwork of the magenta
module, the upregulated TFRC and TEAD4, in addition
to the downregulated PPP1R3C, MAL and CYP3A5 were
observed to have the highest |log2FC|. A previous study
reported that the elevated expression of TFRC was associated
with the distant metastasis of ESCC, and patients with positive
results for TFRC mRNA expression have a notably worse
prognosis (31). Additionally,
TEAD4 is a member of the transcriptional enhancer factor
(TEA) family of transcription factors (32). TEAD and its coactivators may
co-activate gene transcription, and it is pivotal for
physiologically important processes including cell proliferation,
cell differentiation and stem cell maintenance (32). One coactivator of TEAD, Yes-associated
protein, is reported to be overexpressed in primary ESCC tumors
(33). PPP1R3C catalyzes
reversible protein phosphorylation, which is important in a range
of cellular activities. Downregulated PPP1R3C was previously
observed to be associated with lymph node metastasis in ESCC
(34) and was identified as
potentially contributing to the development of ESCC (35). In the present study, TFRC,
TEAD4 and PPP1R3C were enriched in ‘primary metabolic
processes’. Iron metabolism was identified to be altered in
esophageal adenocarcinoma, and the overexpression of TFRC
was associated with increased iron deposition in esophageal
adenocarcinoma (36). Thus, TFRC,
TEAD4 and PPP1R3C may serve important roles in the
development of ESCC.
Downregulated MAL in ESCC has been identified
in previous studies (37,38), which is consistent with the results of
the present study. In esophageal cancer, MAL is able to
suppress esophageal cancer cell motility, invasion and
tumorigenicity and promote apoptosis via the Fas pathway (39), indicating a potential role for
MAL in esophageal cancer. Additionally, genetic
polymorphisms of CYP3A5 in combination with the
sulfotransferase family 1A member 1 *2/*2 genotype are associated
with an increased risk of esophageal cancer (40), suggesting a crucial role for
CYP3A5 in esophageal cancer.
In the present study, DEGs were also validated using
another ESCC gene expression dataset, GSE20347. A total of 308
upregulated genes and 215 downregulated genes were differentially
expressed in the same pattern in GSE20347, including the
aforementioned upregulated genes UBE2C, CDC20, MCM6, TFRC
and TEAD4, in addition to the downregulated genes
PPP1R3C and MAL. The validation results further
indicate that these genes may serve crucial functions in the
progression of ESCC.
However, the present study has a number of
limitations. Potential microRNAs and transcription factors
targeting the identified DEGs should have been identified, and
these predictions should have been validated by experiments. In
further studies, investigation of the etiology of ESCC will be
performed in depth.
In conclusion, in the present study, 487 upregulated
and 468 downregulated DEGs were identified. A number of DEGs (e.g.,
UBE2C, CDC20 and MCM6) enriched in ‘cell cycle’ and
‘ubiquitin mediated proteolysis’, those (e.g., TFRC and
TEAD4) enriched in ‘primary metabolic process’ and
‘intracellular membrane-bounded organelle’, and a number of others
(e.g., CRISP3, NELL2, PPP1R3C, MAL and CYP3A5), may
be important in the initiation and development of ESCC.
Acknowledgements
Not applicable.
Funding
No funding received.
Availability of data and materials
Not applicable.
Author's contributions
XW conceived and designed the research and drafted
the manuscript. GL and QL acquired the data, analyzed and
interpreted the data and performed statistical analysis. CG
conceived and designed the research and revised the manuscript to
present important, intellectual content.
Ethics approval and consent to
participate
Not applicable.
Consent for publication
Not applicable.
Competing interests
The authors declare that they have no competing
interests.
References
|
1
|
Yu VZ, Ko JM, Law S, Wang LD and Lung ML:
Abstract 1158: Differential expression and functional impact of the
alternatively spliced transcripts of extracellular matrix protein 1
in esophageal squamous cell carcinoma. Cancer Res. 76:11582016.
View Article : Google Scholar : PubMed/NCBI
|
|
2
|
Yan S, Zhou C, Zhang W, Zhang G, Zhao X,
Yang S, Wang Y, Lu N, Zhu H and Xu N: β-catenin/TCF pathway
upregulates STAT3 expression in human esophageal squamous cell
carcinoma. Cancer Lett. 271:85–97. 2008. View Article : Google Scholar : PubMed/NCBI
|
|
3
|
Zhang H, Lai R, Li E and Xu L: Abstract
3507: STAT3beta suppresses tumorigenesis via modulating the
phosphorylation dynamics and transcription activity of STAT3alpha
in esophageal squamous cell carcinoma. Cancer Res. 74 19
Suppl:S3507. 2014. View Article : Google Scholar
|
|
4
|
Yao R, Chen Z, Zhou C, Luo M, Shi X, Li J,
Gao Y, Zhou F, Pu J, Sun H and He J: Xerophilusin B induces cell
cycle arrest and apoptosis in esophageal squamous cell carcinoma
cells and does not cause toxicity in nude mice. J Nat Prod.
78:10–16. 2015. View Article : Google Scholar : PubMed/NCBI
|
|
5
|
Chen YK, Tung CW, Lee JY, Hung YC, Lee CH,
Chou SH, Lin HS, Wu MT and Wu IC: Plasma matrix metalloproteinase 1
improves the detection and survival prediction of esophageal
squamous cell carcinoma. Sci Rep. 6:300572016. View Article : Google Scholar : PubMed/NCBI
|
|
6
|
Lee JJ, Natsuizaka M, Ohashi S, Wong GS,
Takaoka M, Michaylira CZ, Budo D, Tobias JW, Kanai M, Shirakawa Y,
et al: Hypoxia activates the cyclooxygenase-2-prostaglandin E
synthase axis. Carcinogenesis. 31:427–434. 2010. View Article : Google Scholar : PubMed/NCBI
|
|
7
|
Langfelder P and Horvath S: WGCNA: An R
package for weighted correlation network analysis. BMC
Bioinformatics. 9:5592008. View Article : Google Scholar : PubMed/NCBI
|
|
8
|
Hu N, Clifford RJ, Yang HH, Wang C,
Goldstein AM, Ding T, Taylor PR and Lee MP: Genome wide analysis of
DNA copy number neutral loss of heterozygosity (CNNLOH) and its
relation to gene expression in esophageal squamous cell carcinoma.
BMC Genomics. 11:5762010. View Article : Google Scholar : PubMed/NCBI
|
|
9
|
Li X: An aggregate function method for
nonlinear programming. Sci In China (A). 34:1467–1473. 1991.
|
|
10
|
Altman NS: An introduction to kernel and
nearest-neighbor nonparametric regression. American Statist.
46:175–185. 1992. View Article : Google Scholar
|
|
11
|
Bolstad BM, Irizarry RA, Astrand M and
Speed TP: A comparison of normalization methods for high density
oligonucleotide array data based on variance and bias.
Bioinformatics. 19:185–193. 2003. View Article : Google Scholar : PubMed/NCBI
|
|
12
|
Smyth GK: Linear models and empirical
bayes methods for assessing differential expression in microarray
experiments. Stat Appl Genet Mol Biol. 3:Article32004. View Article : Google Scholar : PubMed/NCBI
|
|
13
|
Benjamini Y and Hochberg Y: Controlling
the false discovery rate: A practical and powerful approach to
multiple testing. J Royal Stat Soc (Methodological). 57:289–300.
1995.
|
|
14
|
Kohl M, Wiese S and Warscheid B:
Cytoscape: Software for visualization and analysis of biological
networks. Methods Mol Biol. 696:291–303. 2011. View Article : Google Scholar : PubMed/NCBI
|
|
15
|
Rücker G and Rücker C: On using the
adjacency matrix power method for perception of symmetry and for
isomorphism testing of highly intricate graphs. J Chem Inf Comput
Sci. 31:123–126. 1991. View Article : Google Scholar : PubMed/NCBI
|
|
16
|
Wang J, Li M, Chen J and Pan Y: A fast
hierarchical clustering algorithm for functional modules discovery
in protein interaction networks. IEEE/ACM Trans Comput Biol
Bioinform. 8:607–620. 2011. View Article : Google Scholar : PubMed/NCBI
|
|
17
|
Nepusz T, Yu H and Paccanaro A: Detecting
overlapping protein complexes in protein-protein interaction
networks. Nat Methods. 9:471–472. 2012. View Article : Google Scholar : PubMed/NCBI
|
|
18
|
Scheffner M, Nuber U and Huibregtse JM:
Protein ubiquitination involving an E1-E2-E3 enzyme ubiquitin
thioester cascade. Nature. 373:81–83. 1995. View Article : Google Scholar : PubMed/NCBI
|
|
19
|
Jesenberger V and Jentsch S: Deadly
encounter: Ubiquitin meets apoptosis. Nat Rev Mol Cell Biol.
3:112–121. 2002. View
Article : Google Scholar : PubMed/NCBI
|
|
20
|
Lin J, Raoof DA, Wang Z, Lin MY, Thomas
DG, Greenson JK, Giordano TJ, Orringer MB, Chang AC, Beer DG and
Lin L: Expression and effect of inhibition of the
ubiquitin-conjugating enzyme E2C on esophageal adenocarcinoma.
Neoplasia. 8:1062–1071. 2006. View Article : Google Scholar : PubMed/NCBI
|
|
21
|
Ieta K, Ojima E, Tanaka F, Nakamura Y,
Haraguchi N, Mimori K, Inoue H, Kuwano H and Mori M: Identification
of overexpressed genes in hepatocellular carcinoma, with special
reference to ubiquitin-conjugating enzyme E2C gene expression. Int
J Cancer. 121:33–38. 2007. View Article : Google Scholar : PubMed/NCBI
|
|
22
|
Rajkumar T, Sabitha K, Vijayalakshmi N,
Shirley S, Bose MV, Gopal G and Selvaluxmy G: Identification and
validation of genes involved in cervical tumourigenesis. BMC
Cancer. 11:802011. View Article : Google Scholar : PubMed/NCBI
|
|
23
|
Zhao L, Jiang L, Wang L, He J, Yu H, Sun
G, Chen J, Xiu Q and Li B: UbcH10 expression provides a useful tool
for the prognosis and treatment of non-small cell lung cancer. J
Cancer Res Clin Oncol. 138:1951–1961. 2012. View Article : Google Scholar : PubMed/NCBI
|
|
24
|
Zhao ZK, Wu WG, Chen L, Dong P, Gu J, Mu
JS, Yang JH and Liu YB: Expression of UbcH10 in pancreatic ductal
adenocarcinoma and its correlation with prognosis. Tumor Biol.
34:1473–1477. 2013. View Article : Google Scholar
|
|
25
|
McLean JR, Chaix D, Ohi MD and Gould KL:
State of the APC/C: Organization, function, and structure. Crit Rev
Biochem Mol Biol. 46:118–136. 2011. View Article : Google Scholar : PubMed/NCBI
|
|
26
|
Kidokoro T, Tanikawa C, Furukawa Y,
Katagiri T, Nakamura Y and Matsuda K: CDC20, a potential cancer
therapeutic target, is negatively regulated by p53. Oncogene.
27:1562–1571. 2008. View Article : Google Scholar : PubMed/NCBI
|
|
27
|
Smolders L and Teodoro JG: Targeting the
anaphase promoting complex: Common pathways for viral infection and
cancer therapy. Expert Opin Ther Targets. 15:767–780. 2011.
View Article : Google Scholar : PubMed/NCBI
|
|
28
|
Yamabuki T, Daigo Y, Kato T, Hayama S,
Tsunoda T, Miyamoto M, Ito T, Fujita M, Hosokawa M, Kondo S and
Nakamura Y: Genome-wide gene expression profile analysis of
esophageal squamous cell carcinomas. Int J Oncol. 28:1375–1384.
2006.PubMed/NCBI
|
|
29
|
Zinovyeva MV, Monastyrskaya GS, Kopantzev
EP, Vinogradova TV, Kostina MB, Sass AV, Filyukova OB, Uspenskaya
NY, Sukhikh GT and Sverdlov ED: Identification of some human genes
oppositely regulated during esophageal squamous cell carcinoma
formation and human embryonic esophagus development. Dis Esophagus.
23:260–270. 2010. View Article : Google Scholar : PubMed/NCBI
|
|
30
|
Jin Z, Mori Y, Yang J, Sato F, Ito T,
Cheng Y, Paun B, Hamilton JP, Kan T, Olaru A, et al:
Hypermethylation of the nel-like 1 gene is a common and early event
and is associated with poor prognosis in early-stage esophageal
adenocarcinoma. Oncogene. 26:6332–6340. 2007. View Article : Google Scholar : PubMed/NCBI
|
|
31
|
Wada S, Noguchi T, Takeno S and Kawahara
K: PIK3CA and TFRC located in 3q are new prognostic factors in
esophageal squamous cell carcinoma. Ann Surg Oncol. 13:961–966.
2006. View Article : Google Scholar : PubMed/NCBI
|
|
32
|
Pobbati AV and Hong W: Emerging roles of
TEAD transcription factors and its coactivators in cancers. Cancer
Biol Ther. 14:390–398. 2013. View Article : Google Scholar : PubMed/NCBI
|
|
33
|
Muramatsu T, Imoto I, Matsui T, Kozaki K,
Haruki S, Sudol M, Shimada Y, Tsuda H, Kawano T and Inazawa J: YAP
is a candidate oncogene for esophageal squamous cell carcinoma.
Carcinogenesis. 32:389–398. 2011. View Article : Google Scholar : PubMed/NCBI
|
|
34
|
Uchikado Y, Inoue H, Haraguchi N, Mimori
K, Natsugoe S, Okumura H, Aikou T and Mori M: Gene expression
profiling of lymph node metastasis by oligomicroarray analysis
using laser microdissection in esophageal squamous cell carcinoma.
Int J Oncol. 29:1337–1347. 2006.PubMed/NCBI
|
|
35
|
Shen Y, Tantai J and Zhao H: Ranking
candidate genes of esophageal squamous cell carcinomas based on
differentially expressed genes and the topological properties of
the co-expression network. Eur J Med Res. 19:522014. View Article : Google Scholar : PubMed/NCBI
|
|
36
|
Boult J, Roberts K, Brookes MJ, Hughes S,
Bury JP, Cross SS, Anderson GJ, Spychal R, Iqbal T and Tselepis C:
Overexpression of cellular iron import proteins is associated with
malignant progression of esophageal adenocarcinoma. Clin Cancer
Res. 14:379–387. 2008. View Article : Google Scholar : PubMed/NCBI
|
|
37
|
Hu YC, Lam KY, Law S, Wong J and
Srivastava G: Identification of differentially expressed genes in
esophageal squamous cell carcinoma (ESCC) by cDNA expression array:
Overexpression of Fra-1, Neogenin, Id-1, and CDC25B genes in ESCC.
Clin Cancer Res. 7:2213–2221. 2001.PubMed/NCBI
|
|
38
|
Luo A, Kong J, Hu G, Liew CC, Xiong M,
Wang X, Ji J, Wang T, Zhi H, Wu M and Liu Z: Discovery of
Ca2+-relevant and differentiation-associated genes downregulated in
esophageal squamous cell carcinoma using cDNA microarray. Oncogene.
23:1291–1299. 2004. View Article : Google Scholar : PubMed/NCBI
|
|
39
|
Mimori K, Shiraishi T, Mashino K, Sonoda
H, Yamashita K, Yoshinaga K, Masuda T, Utsunomiya T, Alonso MA,
Inoue H and Mori M: MAL gene expression in esophageal cancer
suppresses motility, invasion and tumorigenicity and enhances
apoptosis through the Fas pathway. Oncogene. 22:3463–3471. 2003.
View Article : Google Scholar : PubMed/NCBI
|
|
40
|
Dandara C, Li DP, Walther G and Parker MI:
Gene-environment interaction: The role of SULT1A1 and CYP3A5
polymorphisms as risk modifiers for squamous cell carcinoma of the
oesophagus. Carcinogenesis. 27:791–797. 2006. View Article : Google Scholar : PubMed/NCBI
|