Hepatocellular carcinoma (HCC) is the fifth most
common malignancy and arises most frequently in patients with
cirrhosis (1). It is the second most
common cause of cancer-associated mortality globally with 1.6
million mortalities per year, and it is hypothesized that the high
global incidence rate and late presentation of HCC may be
responsible for this (2,3). Additionally, the general prognosis was
poor with an overall survival rate between 3 and 5% in 2006
(4). Symptoms of HCC include yellow
skin, bloating from fluid in the abdomen, easy bruising from blood
clotting abnormalities, loss of appetite, unintentional weight
loss, nausea, vomiting and tiredness (5,6). The
primary risk factors for HCC were hepatitis C, hepatitis B,
alcoholism, aflatoxin and cirrhosis of the liver (7–10). Liver
transplantation, tyrosine kinase inhibitors and surgical resection
are currently the primary treatment options (11–13). The
treatment of HCC has not been fundamentally improved, which may be
seen in the increasing morbidity and mortality each year (14). Ribavirin is an anti-viral drug used to
treat hepatitis C, respiratory syncytial virus and other viral
infections. If infection is persistent, ribavirin is often used in
combination with peginterferon α-2b or peginterferon α-2a (15,16). It
has been reported that hepatitis C infection was globally
associated with 25% of HCC cases in 2006 (15). Therefore, ribavirin, by itself or in
conjunction with peginterferon α-2b or pegylated interferon, has
been used to treat HCC in patients with viral infections (17–20).
Exploration of the genetic changes in HCC cells is necessary for
the study of the pathogenesis and progression of HCC, as well as to
develop effective treatments. In the present study, a microarray
analysis of mRNA and microRNA (miRNA) was performed in the
treatment of ribavirin on HCC, in order to identify possible
biomarkers and provide novel potential therapeutic targets for
HCC.
The mRNA expression datasets of GSE23031 and
GSE74656, as well as the miRNA expression dataset of GSE22058,
(21–23) were downloaded from the Gene Expressed
Omnibus database (http://www.ncbi.nlm.nih.gov/geo/). They were analyzed
using the platforms GPL570 [HG-U133_Plus_2] Affymetrix Human Genome
U133 Plus 2.0 Array (Thermo Fisher Scientific, Inc., Waltham, MA,
USA), GPL16043 GeneChip® PrimeView™ Human Gene
Expression Array (with External spikx10-in RNAs; Thermo Fisher
Scientific, Inc.) and GPL10457 Rosetta human miRNA qPCR array
(Rosetta Inpharmatics; Merck Sharp & Dohme, Hoddesdon, UK),
respectively. The mRNA data (GSE23031) contained three HCC cell
lines treated with PBS and three HCC cell lines treated with
ribavirin. In the GSE74656, five HCC tissues and five carcinoma
adjacent tissues were selected for the study. In the GSE22058, 96
HCC tissues and 96 carcinoma adjacent tissues were selected to
study. Robust Multi-Array Average (RMA) was an algorithm used to
create an expression matrix from Affymetrix data (24). The raw data were converted into a
recognizable format by R, and the RMA was used for
correction and normalization.
The differentially expressed genes (DEGs) were
identified via the limma package V3.32.10 (http://www.bioconductor.org/packages/3.5/bioc/html/limma.html)
(25). According to the criteria:
P<0.05 and |log(fold change)|>1, the DEGs were identified in
HCC cells treated with ribavirin compared with PBS and designated
DEG-Ribavirin. With the same criteria, the DEGs were identified in
HCC tissues compared with their matched adjacent tissues and
designated DEG-Tumor. Additionally, the differentially expressed
miRNAs (DEMs) were obtained in HCC tissues compared with carcinoma
adjacent tissues with P<0.05 and |log(fold change)|>0.3.
The overlapped DEGs of DEG-Ribavirin and DEG-Tumor
were selected, and the overlapped DEGs with opposite expression
between DEG-Ribavirin and DEG-Tumor were also selected. The
TargetScan database was used to predict biological target mRNAs of
miRNAs that matched the seed region of each miRNA (27). The target mRNAs of DEMs were then
selected using TargetScan. The key miRNAs, which regulated the
overlapped DEGs with opposite expression between DEG-Ribavirin and
DEG-Tumor, were identified. Subsequently, the miRNA-mRNA regulated
pairs were constructed.
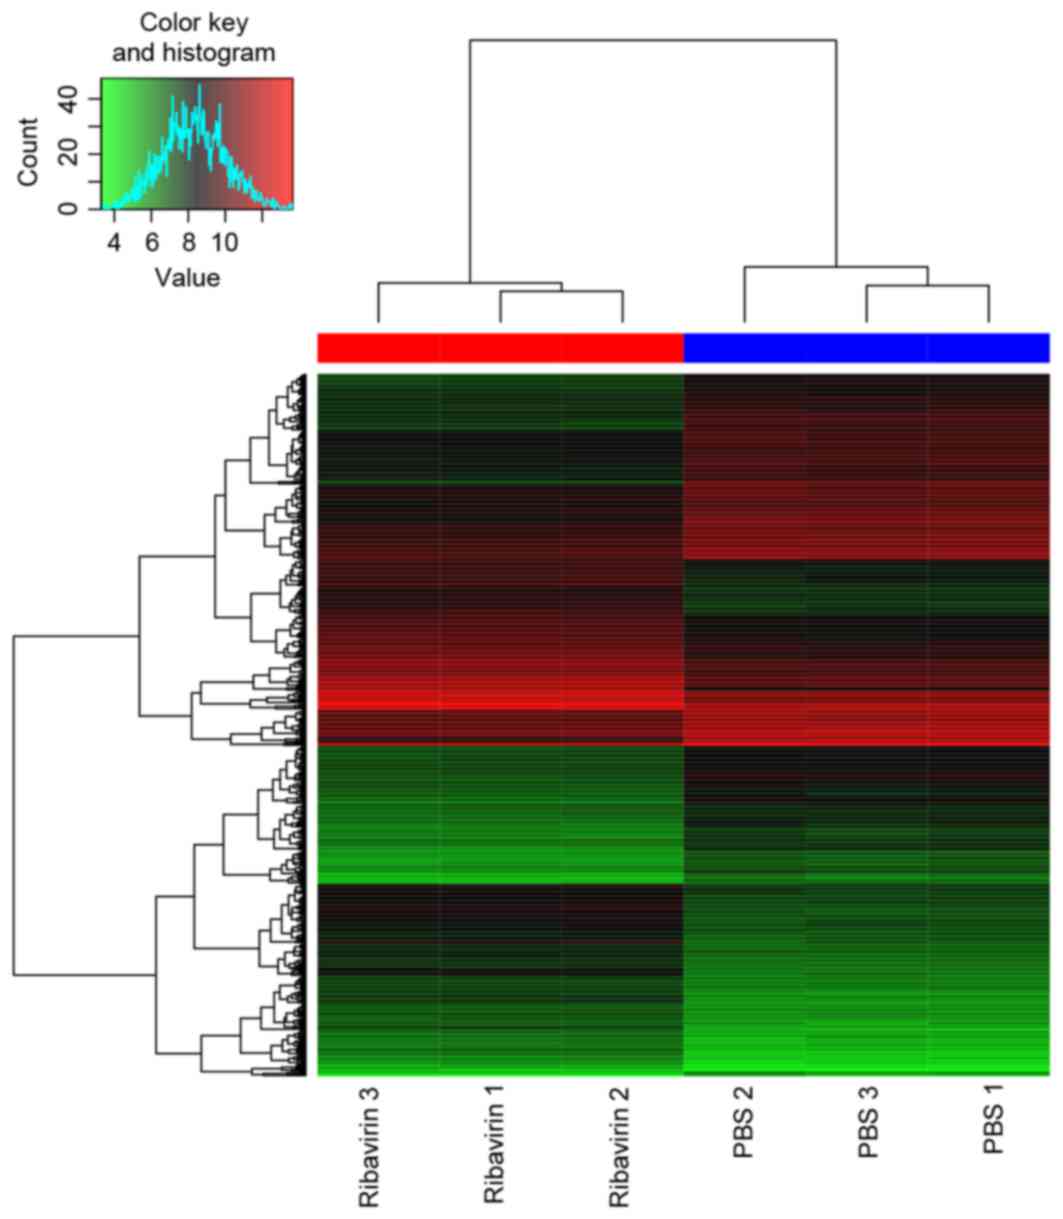
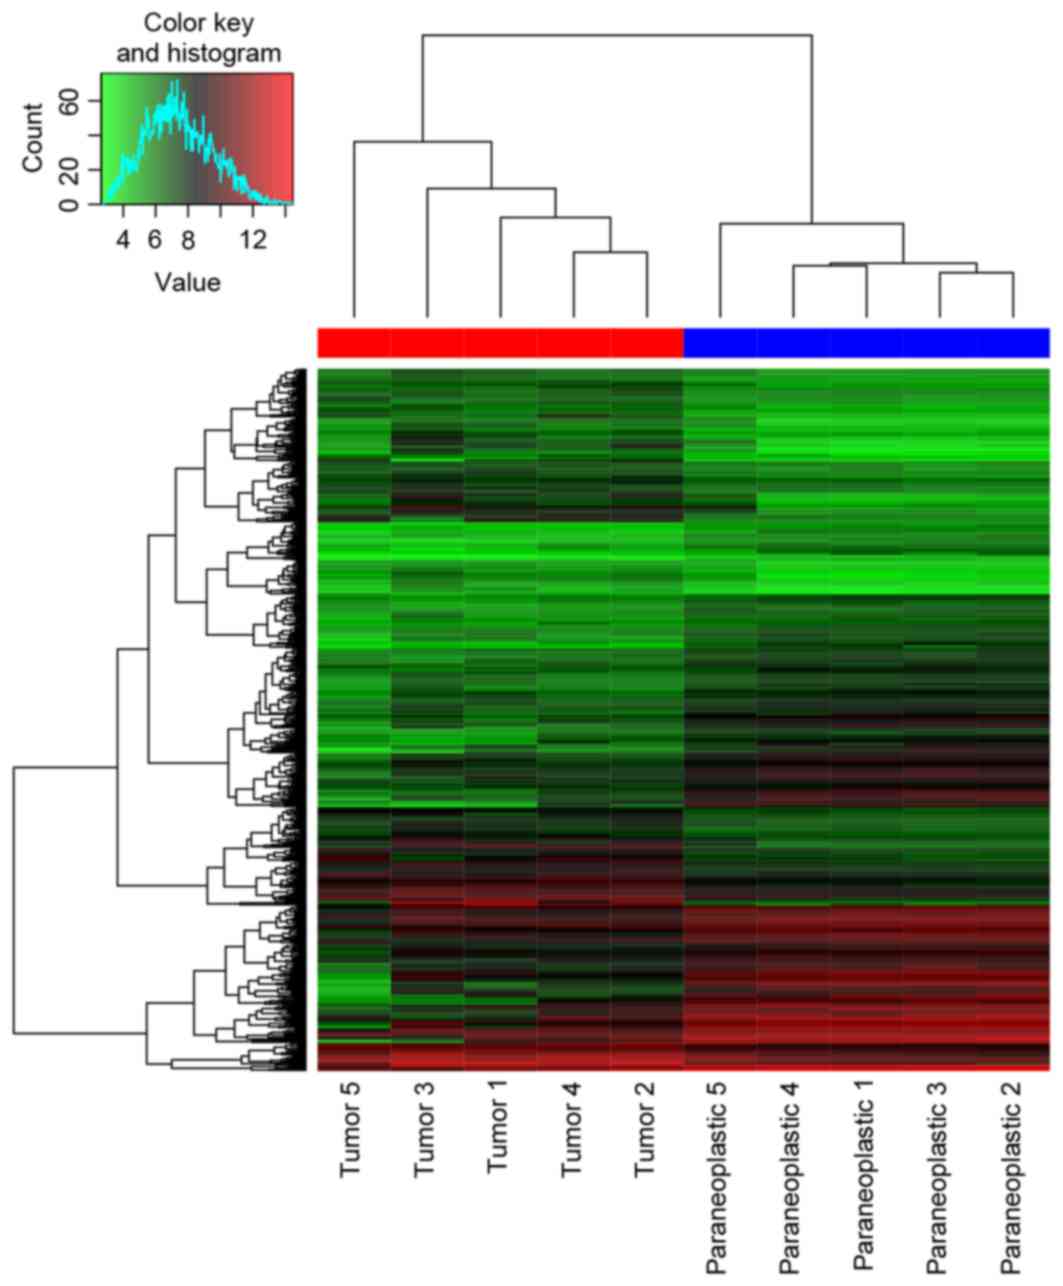
DEGs. A total of 559 DEGs (269 upregulated and 290
downregulated) and 623 DEGs (272 upregulated and 351 downregulated)
were identified in DEG-Ribavirin and DEG-Tumor. The heat map of
them and the top 30 most significant DEGs are presented in Figs. 1 and 2,
Tables I and II, respectively. A total of 220 DEMs were
obtained. The 30 most significant DEMs are presented in Table III.
A total of 121 GO terms and 3 KEGG pathways (cell
cycle pathway, p53 signaling pathway and glycine, serine and
threonine metabolism pathway) of DEG-Ribavirin were obtained. A
total of 383 GO terms and 25 KEGG pathways of DEG-Tumor were
obtained. The top 20 enriched GO terms of DEG-Ribavirin and
DEG-Tumor are presented in Tables IV
and V, respectively. The enriched
KEGG pathways of DEG-Ribavirin and DEG-Tumor are presented in
Tables VI and VII, respectively.
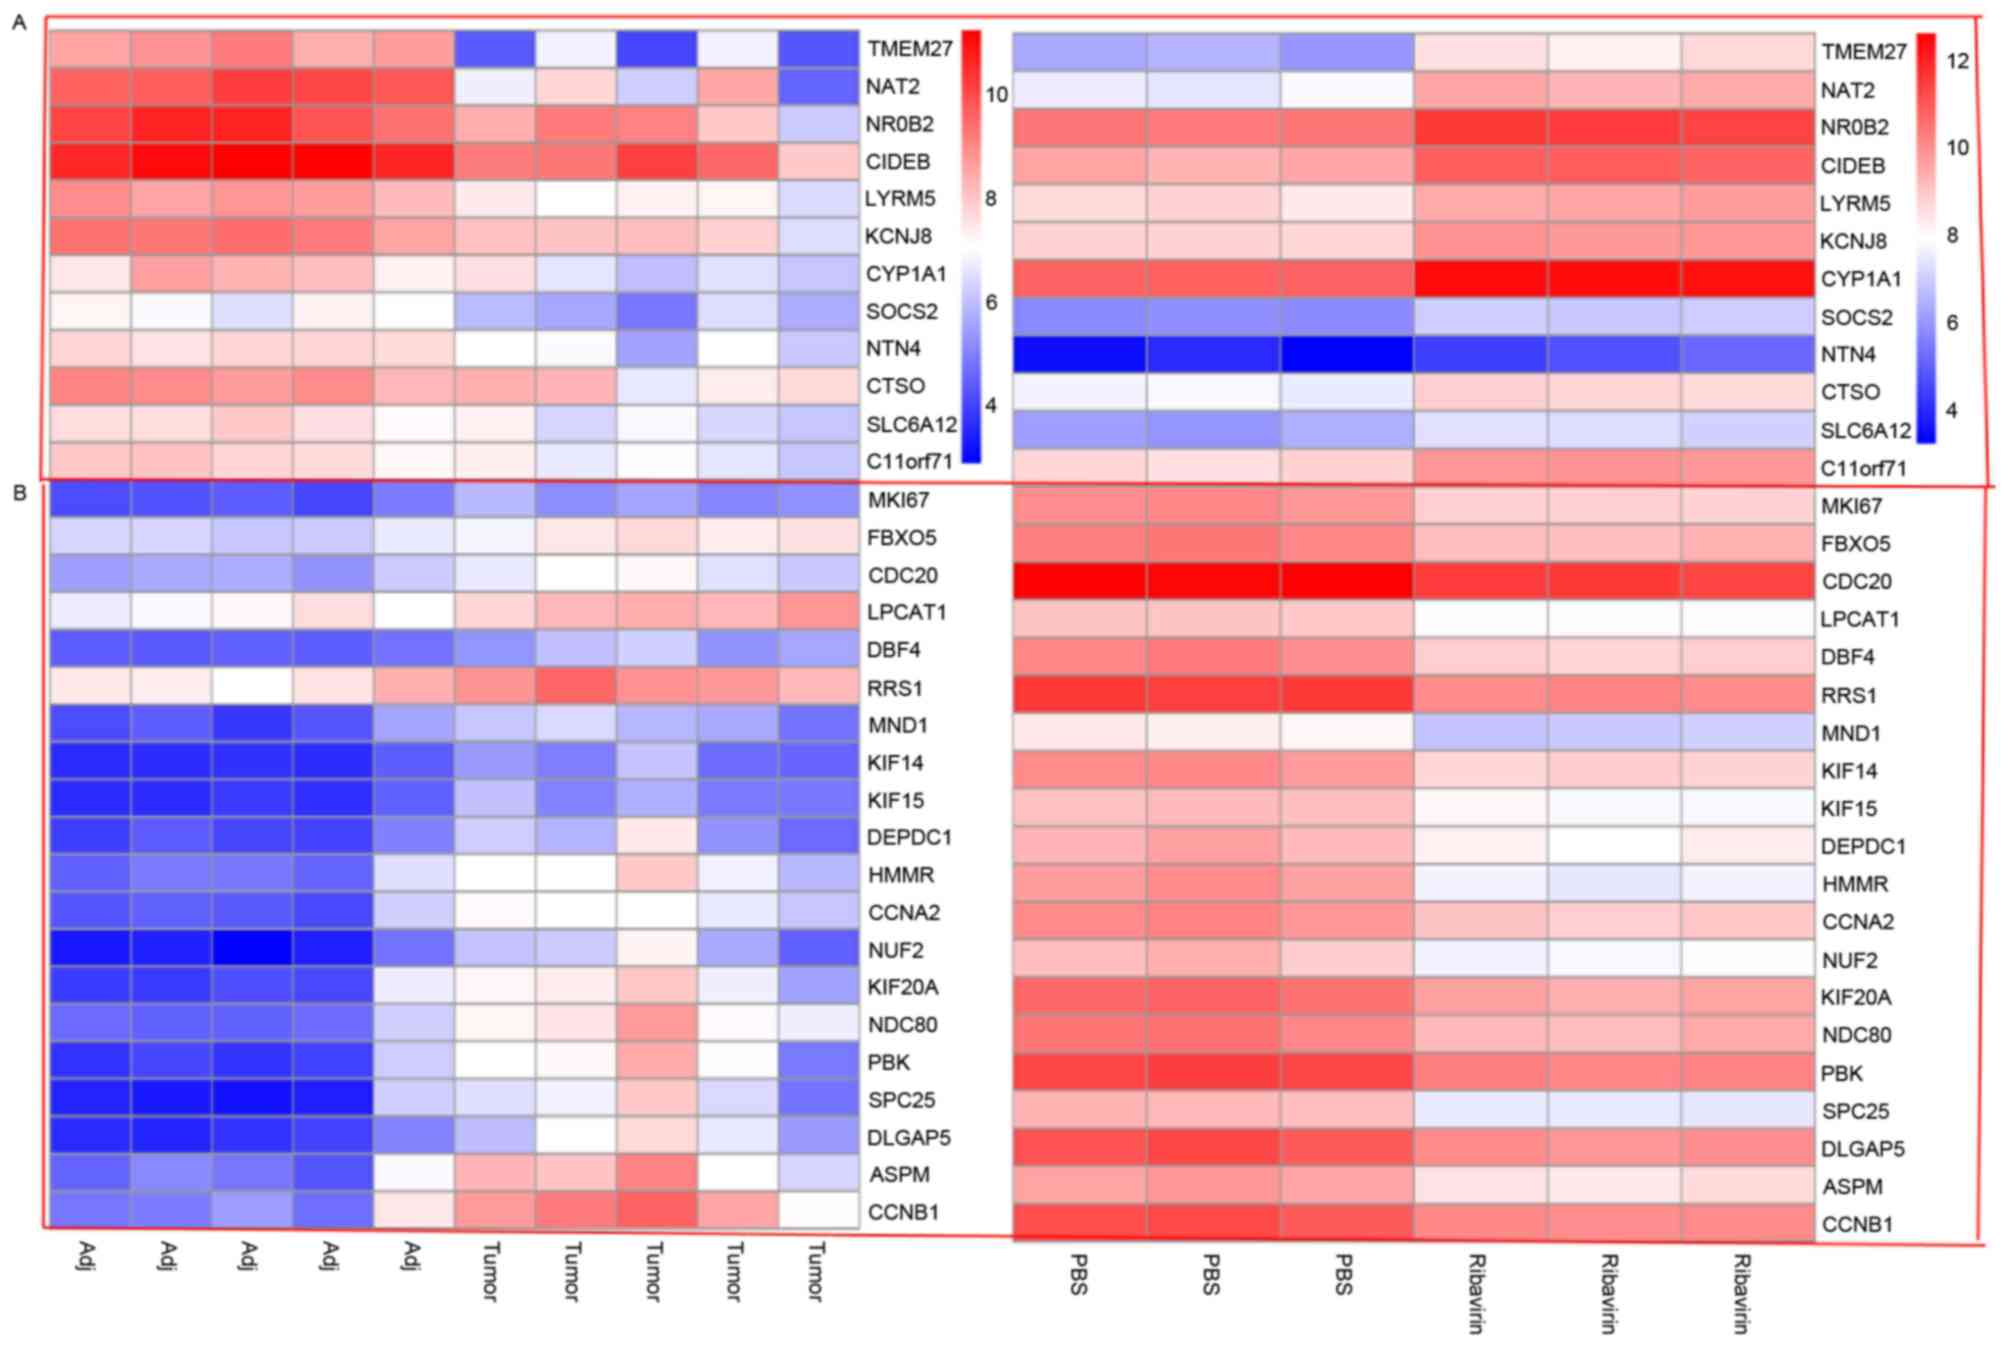
In the present study, the DEGs in HCC cells treated
with ribavirin compared with PBS treated HCC tissue, HCC tissues
and carcinoma adjacent tissues, were firstly identified, and 32
overlapped DEGs with opposite expression between DEG-Ribavirin and
DEG-Tumor were selected. It was notable that NAT2 and
FBXO5 were two mRNAs of them with opposite expression
between DEG-Ribavirin and DEG-Tumor. NAT2 serves a function in the
metabolic activation and detoxification of aromatic amines, which
in turn serves a function in the metabolism of aromatic and
heterocyclic amines, and hydrazines via N-acetylation and
O-acetylation (28). As early as in
1996, Agúndez et al (29)
reported that the slow acetylation was associated with an increased
risk of HCC. Furthermore, it has been demonstrated that NAT2
activity is associated with smoking-associated HCC (30–32). A
number of previous studies that have investigated the association
between NAT2 genotypes and HCC risk have been published
(32–36). FBXO5, also known as early
mitotic inhibitor-1, is a key cell-cycle regulator that promotes
S-phase and M-phase entry by inhibiting anaphasx10-promoting
complex/cyclosome activity (37).
Zhao et al (38) revealed that
FBXO5 was overexpressed in HCC, which is in agreement with
the results of the present study, and also reported that
FBXO5 may control tumor cell proliferation in HCC. In the
present study, it was identified that the expression of NAT2
was lower in HCC cells and HCC tissues. However, expression was
increased following treatment with ribavirin. However, FBXO5
was overexpressed in HCC cells and HCC tissues, and decreased
following treatment with ribavirin. Therefore, it is suspected that
NAT2 and FBXO5 may be biomarkers of ribavirin in the
treatment of HCC.
The cell cycle has been demonstrated to be
associated with the progression and migration of HCC (39–41), and
regulation of the cell cycle is considered an effective strategy
for HCC treatment (42–45). The p53 signaling pathway has been
heavily studied and is reported to serve a function in the
occurrence and development of HCC (45–49). The
association between the glycine, serine and threonine metabolism
pathway and HCC has been less studied, and the glycine, serine and
threonine metabolism pathway was also enriched in DEG-Tumor
tissues. In this study, only three KEGG pathways of DEG-Ribavirin
were obtained, namely cell cycle, p53 signaling pathway and
glycine, serine and threonine metabolism. Cell cycle was the most
significantly enriched function in this study, which was identified
from the enriched GO terms of DEG-Ribavirin (e.g. cell cycle phase,
cell cycle and M phase) and DEG-Tumor (e.g. M phase and cell cycle
phase), as well as the enriched KEGG pathways of DEG-Tumor. The
results of the present study suggest that these three KEGG pathways
may be associated with the pathogenesis and treatment of HCC;
however, more in-depth research is required.
In conclusion, a number of miRNAs (e.g. miR-96,
miR-145 and miR-183) and mRNAs (e.g. NAT2, FBXO5,
CCNB1, DEPDC1 and NTN4) may be associated with the
effects of ribavirin on HCC. Furthermore, they may provide novel
therapeutic targets for drugs of HCC.
|
1
|
El-Serag HB: Epidemiology of viral
hepatitis and hepatocellular carcinoma. Gastroenterology.
142:1264–1273.e1. 2012. View Article : Google Scholar : PubMed/NCBI
|
|
2
|
McGuire S: World Cancer Report 2014.
Geneva, Switzerland: World Health Organization, International
Agency for Research on Cancer, WHO Press, 2015. Adv Nutr.
7:418–419. 2016. View Article : Google Scholar : PubMed/NCBI
|
|
3
|
Ferlay J, Soerjomataram I, Dikshit R, Eser
S, Mathers C, Rebelo M, Parkin DM, Forman D and Bray F: Cancer
incidence and mortality worldwide: Sources, methods and major
patterns in GLOBOCAN 2012. Int J Cancer. 136:E359–E386. 2015.
View Article : Google Scholar : PubMed/NCBI
|
|
4
|
Lopez PM, Villanueva A and Llovet JM:
Systematic review: Evidencx10-based management of hepatocellular
carcinoma-an updated analysis of randomized controlled trials.
Aliment Pharmacol Ther. 23:1535–1547. 2006. View Article : Google Scholar : PubMed/NCBI
|
|
5
|
Kaiser K, Mallick R, Butt Z, Mulcahy MF,
Benson AB and Cella D: Important and relevant symptoms including
pain concerns in hepatocellular carcinoma (HCC): A patient
interview study. Support Care Cancer. 22:919–926. 2014. View Article : Google Scholar : PubMed/NCBI
|
|
6
|
Ji Z, Meng G, Huang D, Yue X and Wang B:
NMFBFS: A NMF-based feature selection method in identifying pivotal
clinical symptoms of hepatocellular carcinoma. Comput Math Methods
Med. 2015:8469422015. View Article : Google Scholar : PubMed/NCBI
|
|
7
|
Paul SB, Shalimar, Sreenivas V,
Gamanagatti SR, Sharma H, Dhamija E and Acharya SK: Incidence and
risk factors of hepatocellular carcinoma in patients with hepatic
venous outflow tract obstruction. Aliment Pharmacol Ther.
41:961–971. 2015. View Article : Google Scholar : PubMed/NCBI
|
|
8
|
Rong G, Wang H, Bowlus CL, Wang C, Lu Y,
Zeng Z, Qu J, Lou M, Chen Y, An L, et al: Incidence and risk
factors for hepatocellular carcinoma in primary biliary cirrhosis.
Clin Rev Allergy Immunol. 48:132–141. 2015. View Article : Google Scholar : PubMed/NCBI
|
|
9
|
Toyoda H, Kumada T, Tada T, Kiriyama S,
Tanikawa M, Hisanaga Y, Kanamori A, Kitabatake S and Ito T: Risk
factors of hepatocellular carcinoma development in non-cirrhotic
patients with sustained virologic response for chronic hepatitis C
virus infection. J Gastroenterol Hepatol. 30:1183–1189. 2015.
View Article : Google Scholar : PubMed/NCBI
|
|
10
|
Zhang XX, Wang LF, Jin L, Li YY, Hao SL,
Shi YC, Zeng QL, Li ZW, Zhang Z, Lau GK and Wang FS: Primary
biliary cirrhosis-associated hepatocellular carcinoma in Chinese
patients: Incidence and risk factors. World J Gastroenterol.
21:3554–3563. 2015. View Article : Google Scholar : PubMed/NCBI
|
|
11
|
Sacco R, Gadaleta-Caldarola G, Galati G,
Lombardi G, Mazza G and Cabibbo G: EASL HCC summit: Liver cancer
management. Future Oncol. 10:1129–1132. 2014. View Article : Google Scholar : PubMed/NCBI
|
|
12
|
Fitzmorris P, Shoreibah M, Anand BS and
Singal AK: Management of hepatocellular carcinoma. J Cancer Res
Clin Oncol. 141:861–876. 2015. View Article : Google Scholar : PubMed/NCBI
|
|
13
|
Park JW, Chen M, Colombo M, Roberts LR,
Schwartz M, Chen PJ, Kudo M, Johnson P, Wagner S, Orsini LS and
Sherman M: Global patterns of hepatocellular carcinoma management
from diagnosis to death: The BRIDGE Study. Liver Int. 35:2155–2166.
2015. View Article : Google Scholar : PubMed/NCBI
|
|
14
|
Scaggiante B, Farra R, Dapas B, Baj G,
Pozzato G, Grassi M, Zanconati F and Grassi G: Aptamer targeting of
the elongation factor 1A impairs hepatocarcinoma cells viability
and potentiates bortezomib and idarubicin effects. Int J Pharm.
506:268–279. 2016. View Article : Google Scholar : PubMed/NCBI
|
|
15
|
Alter MJ: Epidemiology of hepatitis C
virus infection. World J Gastroenterol. 13:2436–2441. 2007.
View Article : Google Scholar : PubMed/NCBI
|
|
16
|
Smith DW, Frankel LR, Mathers LH, Tang AT,
Ariagno RL and Prober CG: A controlled trial of aerosolized
ribavirin in infants receiving mechanical ventilation for severe
respiratory syncytial virus infection. N Engl J Med. 325:24–29.
1991. View Article : Google Scholar : PubMed/NCBI
|
|
17
|
Harada N, Hiramatsu N, Oze T, Morishita N,
Yamada R, Hikita H, Miyazaki M, Yakushijin T, Miyagi T, Yoshida Y,
et al: Risk factors for hepatocellular carcinoma in hepatitis C
patients with normal alanine aminotransferase treated with
pegylated interferon and ribavirin. J Viral Hepat. 21:357–365.
2014. View Article : Google Scholar : PubMed/NCBI
|
|
18
|
Liu CJ, Chu YT, Shau WY, Kuo RN, Chen PJ
and Lai MS: Treatment of patients with dual hepatitis C and B by
peginterferon alpha and ribavirin reduced risk of hepatocellular
carcinoma and mortality. Gut. 63:506–514. 2014. View Article : Google Scholar : PubMed/NCBI
|
|
19
|
Honda T, Ishigami M, Masuda H, Ishizu Y,
Kuzuya T, Hayashi K, Itoh A, Hirooka Y, Nakano I, Ishikawa T, et
al: Effect of peginterferon alfa-2b and ribavirin on hepatocellular
carcinoma prevention in older patients with chronic hepatitis C. J
Gastroenterol Hepatol. 30:321–328. 2015. View Article : Google Scholar : PubMed/NCBI
|
|
20
|
Krastev Z, Jelev D, Antonov K, Petkova T,
Atanasova E, Zheleva N, Tomov B, Boyanova Y and Mateva L:
Ombitasvir, paritaprevir, ritonavir, dasabuvir and ribavirin in
cirrhosis after complete destruction of hepatocellular carcinoma.
World J Gastroenterol. 22:2630–2635. 2016. View Article : Google Scholar : PubMed/NCBI
|
|
21
|
Thomas E, Feld JJ, Li Q, Hu Z, Fried MW
and Liang TJ: Ribavirin potentiates interferon action by augmenting
interferon-stimulated gene induction in hepatitis C virus cell
culture models. Hepatology. 53:32–41. 2011. View Article : Google Scholar : PubMed/NCBI
|
|
22
|
Burchard J, Zhang C, Liu AM, Poon RT, Lee
NP, Wong KF, Sham PC, Lam BY, Ferguson MD, Tokiwa G, et al:
microRNA-122 as a regulator of mitochondrial metabolic gene network
in hepatocellular carcinoma. Mol Syst Biol. 6:4022010. View Article : Google Scholar : PubMed/NCBI
|
|
23
|
Liu AM, Yao TJ, Wang W, Wong KF, Lee NP,
Fan ST, Poon RT, Gao C and Luk JM: Circulating miR-15b and miR-130b
in serum as potential markers for detecting hepatocellular
carcinoma: A retrospective cohort study. BMJ Open. 2:e0008252012.
View Article : Google Scholar : PubMed/NCBI
|
|
24
|
Irizarry RA, Hobbs B, Collin F,
Beazer-Barclay YD, Antonellis KJ, Scherf U and Speed TP:
Exploration, normalization, and summaries of high density
oligonucleotide array probe level data. Biostatistics. 4:249–264.
2003. View Article : Google Scholar : PubMed/NCBI
|
|
25
|
Diboun I, Wernisch L, Orengo CA and
Koltzenburg M: Microarray analysis after RNA amplification can
detect pronounced differences in gene expression using limma. BMC
Genomics. 7:2522006. View Article : Google Scholar : PubMed/NCBI
|
|
26
|
Dennis G Jr, Sherman BT, Hosack DA, Yang
J, Gao W, Lane HC and Lempicki RA: DAVID: Database for annotation,
visualization, and integrated discovery. Genome Biol. 4:P32003.
View Article : Google Scholar : PubMed/NCBI
|
|
27
|
Lewis BP, Burge CB and Bartel DP:
Conserved seed pairing, often flanked by adenosines, indicates that
thousands of human genes are microRNA targets. Cell. 120:15–20.
2005. View Article : Google Scholar : PubMed/NCBI
|
|
28
|
Smith CA, Smith G and Wolf CR: Genetic
polymorphisms in xenobiotic metabolism. Eur J Cancer.
30A:1921–1935. 1994. View Article : Google Scholar : PubMed/NCBI
|
|
29
|
Agundez JA, Olivera M, Ladero JM,
Rodriguez-Lescure A, Ledesma MC, Diaz-Rubio M, Meyer UA and Benítez
J: Increased risk for hepatocellular carcinoma in NAT2-slow
acetylators and CYP2D6-rapid metabolizers. Pharmacogenetics.
6:501–512. 1996. View Article : Google Scholar : PubMed/NCBI
|
|
30
|
Farker K, Schotte U, Scheele J and
Hoffmann A: Impact of N-acetyltransferase polymorphism (NAT2) in
hepatocellular carcinoma (HCC)-an investigation in a department of
surgical medicine. Exp Toxicol Pathol. 54:387–391. 2003. View Article : Google Scholar : PubMed/NCBI
|
|
31
|
Zhang J, Xu F and Ouyang C: Joint effect
of polymorphism in the N-acetyltransferase 2 gene and smoking on
hepatocellular carcinoma. Tumour Biol. 33:1059–1063. 2012.
View Article : Google Scholar : PubMed/NCBI
|
|
32
|
Farker K, Schotte U, Scheele J and
Hoffmann A: Assessment of frequencies of lifestyle factors and
polymorphisms of drug-metabolizing enzymes (NAT2, CYP2E1) in human
hepatocellular carcinoma (HCC) patients in a department of surgical
medicinx10-a pilot investigation. Int J Clin Pharmacol Ther.
40:120–124. 2002. View Article : Google Scholar : PubMed/NCBI
|
|
33
|
Huang YS, Chern HD, Wu JC, Chao Y, Huang
YH, Chang FY and Lee SD: Polymorphism of the N-acetyltransferase 2
gene, red meat intake, and the susceptibility of hepatocellular
carcinoma. Am J Gastroenterol. 98:1417–1422. 2003. View Article : Google Scholar : PubMed/NCBI
|
|
34
|
Blum HE: Hepatocellular carcinoma:
Susceptibility markers. IARC Sci Publ. 154:241–244. 2001.PubMed/NCBI
|
|
35
|
Gelatti U, Covolo L, Talamini R, Tagger A,
Barbone F, Martelli C, Cremaschini F, Franceschi S, Ribero ML,
Garte S, et al: N-Acetyltransferasx10-2, glutathione S-transferase
M1 and T1 genetic polymorphisms, cigarette smoking and
hepatocellular carcinoma: A casx10-control study. Int J Cancer.
115:301–306. 2005. View Article : Google Scholar : PubMed/NCBI
|
|
36
|
Xu B, Wang F, Song C, Sun Z, Cheng K, Tan
Y, Wang H and Zou H: Largx10-scale proteome quantification of
hepatocellular carcinoma tissues by a three-dimensional liquid
chromatography strategy integrated with sample preparation. J
Proteome Res. 13:3645–3654. 2014. View Article : Google Scholar : PubMed/NCBI
|
|
37
|
Gütgemann I, Lehman NL, Jackson PK and
Longacre TA: Emi1 protein accumulation implicates misregulation of
the anaphase promoting complex/cyclosome pathway in ovarian clear
cell carcinoma. Mod Pathol. 21:445–454. 2008. View Article : Google Scholar : PubMed/NCBI
|
|
38
|
Zhao Y, Tang Q, Ni R, Huang X, Wang Y, Lu
C, Shen A, Wang Y, Li C, Yuan Q, et al: Early mitotic inhibitor-1,
an anaphasx10-promoting complex/cyclosome inhibitor, can control
tumor cell proliferation in hepatocellular carcinoma: Correlation
with Skp2 stability and degradation of p27(Kip1). Human Pathol.
44:365–373. 2013. View Article : Google Scholar
|
|
39
|
Feng YM, Feng CW, Chen SY, Hsieh HY, Chen
YH and Hsu CD: Cyproheptadine, an antihistaminic drug, inhibits
proliferation of hepatocellular carcinoma cells by blocking cell
cycle progression through the activation of P38 MAP kinase. BMC
Cancer. 15:1342015. View Article : Google Scholar : PubMed/NCBI
|
|
40
|
Wang Z, Wei W, Sun CK, Chua MS and So S:
Suppressing the CDC37 cochaperone in hepatocellular carcinoma cells
inhibits cell cycle progression and cell growth. Liver Int.
35:1403–1415. 2015. View Article : Google Scholar : PubMed/NCBI
|
|
41
|
Deng L, Yang J, Chen H, Ma B, Pan K, Su C,
Xu F and Zhang J: Knockdown of TMEM16A suppressed MAPK and
inhibited cell proliferation and migration in hepatocellular
carcinoma. Onco Targets Ther. 9:325–333. 2016.PubMed/NCBI
|
|
42
|
Milovanovic P, Rakocevic Z, Djonic D,
Zivkovic V, Hahn M, Nikolic S, Amling M, Busse B and Djuric M:
Nano-structural, compositional and micro-architectural signs of
cortical bone fragility at the superolateral femoral neck in
elderly hip fracture patients vs. healthy aged controls. Exp
Gerontol. 55:19–28. 2014. View Article : Google Scholar : PubMed/NCBI
|
|
43
|
Wilson JM, Kunnimalaiyaan S, Gamblin TC
and Kunnimalaiyaan M: MK2206 inhibits hepatocellular carcinoma
cellular proliferation via induction of apoptosis and cell cycle
arrest. J Surg Res. 191:280–285. 2014. View Article : Google Scholar : PubMed/NCBI
|
|
44
|
Jiang W, Huang H, Ding L, Zhu P, Saiyin H,
Ji G, Zuo J, Han D, Pan Y, Ding D, et al: Regulation of cell cycle
of hepatocellular carcinoma by NF90 through modulation of cyclin E1
mRNA stability. Oncogene. 34:4460–4470. 2015. View Article : Google Scholar : PubMed/NCBI
|
|
45
|
Liu YS, Tsai YL, Yeh YL, Chung LC, Wen SY,
Kuo CH, Lin YM, Padma VV, Kumar VB and Huang CY: Cell cycle
regulation in the estrogen receptor beta (ESR2)-overexpressing
hep3b hepatocellular carcinoma cell line. Chin J Physiol.
58:134–140. 2015.PubMed/NCBI
|
|
46
|
Meng X, Franklin DA, Dong J and Zhang Y:
MDM2-p53 pathway in hepatocellular carcinoma. Cancer Res.
74:7161–7167. 2014. View Article : Google Scholar : PubMed/NCBI
|
|
47
|
Sun J, Wang B and Liu Y, Zhang L, Ma A,
Yang Z, Ji Y and Liu Y: Transcription factor KLF9 suppresses the
growth of hepatocellular carcinoma cells in vivo and positively
regulates p53 expression. Cancer Lett. 355:25–33. 2014. View Article : Google Scholar : PubMed/NCBI
|
|
48
|
Li X, Yu J, Brock MV, Tao Q, Herman JG,
Liang P and Guo M: Epigenetic silencing of BCL6B inactivates p53
signaling and causes human hepatocellular carcinoma cell resist to
5-FU. Oncotarget. 6:11547–11560. 2015.PubMed/NCBI
|
|
49
|
Wang P, Cui J, Wen J, Guo Y, Zhang L and
Chen X: Cisplatin induces HepG2 cell cycle arrest through targeting
specific long noncoding RNAs and the p53 signaling pathway. Oncol
Lett. 12:4605–4612. 2016. View Article : Google Scholar : PubMed/NCBI
|
|
50
|
Baik SH, Lee J, Lee YS, Jang JY and Kim
CW: ANT2 shRNA downregulates miR-19a and miR-96 through the
PI3K/Akt pathway and suppresses tumor growth in hepatocellular
carcinoma cells. Exp Mol Med. 48:e2222016. View Article : Google Scholar : PubMed/NCBI
|
|
51
|
Wang TH, Yeh CT, Ho JY, Ng KF and Chen TC:
OncomiR miR-96 and miR-182 promote cell proliferation and invasion
through targeting ephrinA5 in hepatocellular carcinoma. Mol
Carcinog. 55:366–375. 2016. View Article : Google Scholar : PubMed/NCBI
|
|
52
|
Chen Y, Dong X, Yu D and Wang X: Serum
miR-96 is a promising biomarker for hepatocellular carcinoma in
patients with chronic hepatitis B virus infection. Int J Clin Exp
Med. 8:18462–18468. 2015.PubMed/NCBI
|
|
53
|
Liu Y, Wu C, Wang Y, Wen S, Wang J, Chen
Z, He Q and Feng D: MicroRNA-145 inhibits cell proliferation by
directly targeting ADAM17 in hepatocellular carcinoma. Oncol Rep.
32:1923–1930. 2014. View Article : Google Scholar : PubMed/NCBI
|
|
54
|
Ding W, Tan H, Zhao C, Li X, Li Z, Jiang
C, Zhang Y and Wang L: MiR-145 suppresses cell proliferation and
motility by inhibiting ROCK1 in hepatocellular carcinoma. Tumour
Biol. 37:6255–6260. 2016. View Article : Google Scholar : PubMed/NCBI
|
|
55
|
Ju BL, Chen YB, Zhang WY, Yu CH, Zhu DQ
and Jin J: miR-145 regulates chemoresistance in hepatocellular
carcinoma via epithelial mesenchymal transition. Cell Mol Biol
(Noisy-le-grand). 61:12–16. 2015.PubMed/NCBI
|
|
56
|
Wang G, Zhu S, Gu Y, Chen Q, Liu X and Fu
H: MicroRNA-145 and MicroRNA-133a Inhibited proliferation,
migration, and invasion, while promoted apoptosis in hepatocellular
carcinoma cells via targeting FSCN1. Dig Dis Sci. 60:3044–3052.
2015. View Article : Google Scholar : PubMed/NCBI
|
|
57
|
Li J, Fu H, Xu C, Tie Y, Xing R, Zhu J,
Qin Y, Sun Z and Zheng X: miR-183 inhibits TGF-beta1-induced
apoptosis by downregulation of PDCD4 expression in human
hepatocellular carcinoma cells. BMC Cancer. 10:3542010. View Article : Google Scholar : PubMed/NCBI
|
|
58
|
Liang Z, Gao Y, Shi W, Zhai D, Li S, Jing
L, Guo H, Liu T, Wang Y and Du Z: Expression and significance of
microRNA-183 in hepatocellular carcinoma. ScientificWorldJournal.
2013:3818742013. View Article : Google Scholar : PubMed/NCBI
|
|
59
|
Li ZB, Li ZZ, Li L, Chu HT and Jia M:
MiR-21 and miR-183 can simultaneously target SOCS6 and modulate
growth and invasion of hepatocellular carcinoma (HCC) cells. Eur
Rev Med Pharmacol Sci. 19:3208–3217. 2015.PubMed/NCBI
|