Introduction
There are several, distinct pathways that can drive
cells into apoptosis. For example, cross-linking of major
histocompatibility class II molecules apparently represents an
S-phase independent mechanism of apoptosis (1). Another, basic pathway involves the
over-accumulation of what would normally be pro-proliferative
transcription factors (TFs), for example, E2F1 (2). This over-accumulation presumably occurs
in situations where S-phase is impeded due to a defect in the cell
or due to lack of metabolites or proteins needed for a complete
progression through S-phase. The over-accumulation then leads to
occupancy of pro-apoptosis-effector genes, by the pro-proliferative
TFs. This feed forward process of apoptosis is exemplified by
over-activation of the T-cell receptor signaling pathway in
deletion of self-reactive T-cells in the thymus (3) and by treatment of cells with
interferon-γ (4), which is
pro-proliferative at lower concentrations and pro-apoptotic at
higher concentrations. The importance of a specific
pro-proliferative TF in apoptosis was elegantly demonstrated many
years ago by unexpected tumor development in mice lacking E2F1
(5–7),
a classic pro-proliferative TF that stimulates histone gene and
dihydrofolate reductase gene expression (8,9), in
preparation for S-phase. POU2F1 and RB1 have been shown to regulate
the interferon-γ transition from stimulation of proliferation to
stimulation of apoptosis (4,10).
There are several possible and not necessarily
mutually exclusive mechanisms to explain the basis of feed forward
apoptosis (FFA). One possibility is based on the fact that
apoptosis-effector genes are generally smaller than
proliferation-effector genes (11,12),
leading to the proposal that the occupancy of the
apoptosis-effector genes is simply due to stochastic processes that
favor initial occupancy of proliferation-effector genes, and then
upon reaching a high enough intra-cellular concentration, lead to
occupancy of the apoptosis-effector genes (12,13). A
second possibility, established via an E2F1 model system (14,15),
indicates that E2F1 binding partners will change in the transition
from E2F1 occupancy of proliferation-effector genes to E2F1
occupancy of apoptosis-effector genes.
In the cancer patient setting, evidence of feed
forward apoptosis has been detected in several ways. First, MYC
amplification in neuroblastoma represents a better outcome, with
conventional therapy, unless CASP8 is absent (16). And, using The Cancer Genome Atlas
(TCGA) data, we have recently reported that an increased number of
oncoprotein or tumor suppressor protein mutations in stomach
adenocarcinoma represents a better outcome (17). It is clear that cancer progression
represents a balance of proliferation-effector and
apoptosis-effector gene expression, such that proliferation
overcomes apoptosis in case of terminal cancer (18,19). This
has led to the question of whether individual pro-proliferative TFs
can be classified as supporting apoptosis, presumably despite an
overwhelming impact of other, specific TFs supporting
proliferation. The results presented below represent one of the
first such identifications of a specific feed-forward apoptosis
pathway, that is balanced by a specific but distinct
pro-proliferative TF, in a cancer patient setting.
Materials and methods
Basic approaches
RNA microarray values from the metabric breast
cancer dataset representing pro-proliferative TFs (FOS, E2F1, JUN,
POU2F1, MYC, YY1, STAT3, NFATC1) (20) were obtained from www.cbioportal.org. The microarray values and their
associated barcodes were organized in descending order for each TF.
The barcodes representing the top 20% and bottom 20% values were
obtained and used as selected samples for the Kaplan-Meier (KM)
survival curve analysis tool of cbioportal.org; or for the IBM Statistical Package for
the Social Sciences (SPSS; IBM Corp., Armonk, NY, USA) software,
exactly as described (21) to verify
results using cbioportal.org web tool. The
apoptosis-effector genes used in this study were obtained from a
previous study (12). As previously
shown (12), all apparent human
apoptosis-effector genes were first obtained on the bases of
keyword searches of the human genome browser database. Then, a set
of 34 apoptosis-effector genes was established by inspection. From
this set of 34 apoptosis-effector genes, we identified the
apoptosis-effector genes with AP1 (FOS) and POU2F1-binding sites
within 5,000 base pairs on either side of the gene, inclusive,
using the hg19 genome browser database, with a z-score cutoff of
2.33. The microarray values for each of the apoptosis-effector
genes, with either AP1 (FOS) or POU2F1 binding sites, were obtained
from cbioportal.org.
Distinct breast cancer dataset
The RNASeq values of GZMA were obtained for the
TCGA-BRCA 1105 dataset, from www.cbioportal.org. The microarray data were then
sorted into descending order to identify top 20% and bottom 20%
GZMA RNASeq values. The averages for top 20% and bottom 20% were
calculated, and associated barcodes were analyzed via KM approaches
as detailed above.
GZMA methylation
The beta-score, methylation values of the TCGA-BRCA
GZMA dataset were obtained from cbioportal.org and processed as previously described
(22). The barcodes were sorted and
organized into their respective top 20% and bottom 20% levels for
statistical analyses.
GZMA RNASeq read counts
The RNASeq read counts were generated by downloading
raw RNAseq files from the genome data commons, via approved NIH
dbGaP project no. 6300, and summing up the reads representing the
GZMA section of the genome.
Statistical analysis
The statistical data in this report are presented as
correlation plots, KM analyses and differences in the means. For
correlation plots, a correlation coefficient and P-value were
obtained; for the KM analyses, a log-rank P-value was obtained and
used to establish significance; and for the differences in the
means, as presented in the Tables, a Student's t-test was used to
establish significance. Excel (version 16.12; Microsoft
Corporation, Redmond, WA, USA) was used to obtain correlation
coefficients and MedCalc (version 2017; MedCalc Software, Ostend,
Belgium) was used to obtain the P-values for the linear
correlations. The KM analyses log-rank P-values were obtained with
the SPSS. For the majority of the analyses, there were 381 tumor
samples representing the upper and lower quintiles in the
analyses.
Results
Association of higher FOS expression
with better survival and relatively high expression of FOS
responsive apoptosis-effector genes
To determine whether there were expression levels of
pro-proliferative TFs, that correlated or inversely correlated with
overall breast cancer survival, we first obtained the microarray
values for eight candidate, pro-proliferative TFs as tabulated and
shown in a previous study. (12). The
purpose of this determination was to identify candidate TFs,
whereby one TF with a high expression level could be indicative of
driving FFA, and thereby be associated with better survival; and a
second TF could, with a high expression level, be associated with a
worse survival. Presumably the latter TF would be driving
proliferation in the absence of a functional FFA process for that
TF. The microarray data were organized into groups of barcodes
(samples) that represented the top 20% and bottom 20% of expression
levels for each of the eight pro-proliferative TFs (12). The barcodes for those two groups, for
each TF, were compared in terms of the survival rates, with the
remaining barcodes in the dataset, respectively, using a KM curve,
available via a cbioportal.org web tool. Results
indicated that high levels of FOS were associated with a better
survival and that high levels of POU2F1 were associated with a
worse survival. The other six TFs did not show a statistically
significant association with either survival status and were not
further considered in this study (Table
I).
 | Table I.P-values representing the overall
survival differences for the breast cancer barcodes representing
the top and bottom 20% of expression levels (microarray values) for
the indicated transcription factors. |
Table I.
P-values representing the overall
survival differences for the breast cancer barcodes representing
the top and bottom 20% of expression levels (microarray values) for
the indicated transcription factors.
|
| P-value |
|---|
|
|
|
|---|
| Transcription
factor | Top 20% | Bottom 20% |
|---|
| FOS | 0.011 (better overall
survival) | 0.031 (worse overall
survival) |
| E2F1 | 0.69 | 0.39 |
| JUN | 0.10 | 0.012 |
| POU2F1 | 0.0034 (worse overall
survival) | 0.0027 (better
overall survival) |
| MYC | 0.82 | 0.14 |
| YY1 | 0.13 | 0.42 |
| STAT3 | 0.37 | NS |
| NFATC1 | 0.64 | 0.25 |
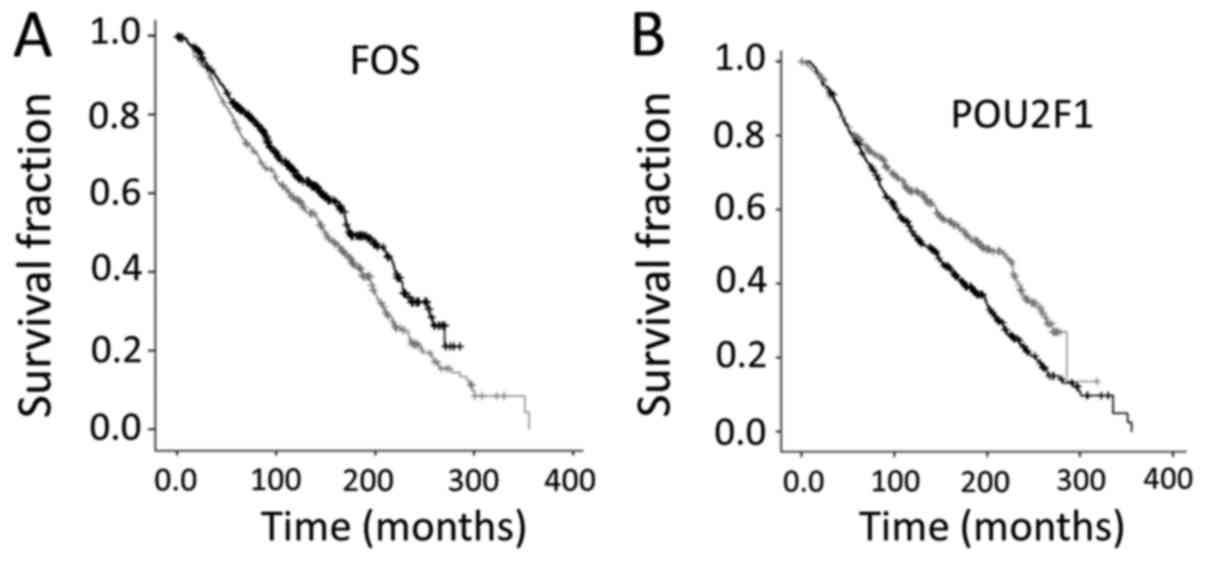
To confirm the above indication, that high levels of
FOS and POU2F1 represented opposite survival rates, the top 20%
expressers and bottom 20% expressers for each of these TFs were
compared in KM analyses, with results consistent with the
conclusions in the previous paragraph, namely that high FOS is
associated with better survival and high POU2F1 associated with
poorer survival (Fig. 1).
To determine whether a higher level of FOS
expression correlated with higher apoptosis-effector gene
expression, we obtained the RNA microarray values for all of the
apoptosis-effector genes characterized as previously described
(12) that contain an AP1 (FOS/JUN)
site within 5,000 base pairs, inclusive, specifically, UQCRC2, BAD,
BAX, and CRADD. We next sorted the FOS expression levels and
obtained the microarray value averages for each of the AP1
site-containing apoptosis-effector genes listed above for the
barcodes that represented the top 20% and bottom 20% of FOS
expression. We then determined whether the top 20% and bottom 20%
microarray value averages represented significant differences, in
the case of each of these apoptosis-effector genes. Only UQCRC2 and
CRADD represented statistically significant differences (Table II). The microarray values for UQCRC2
(in relation to FOS) represented an average of 8.212 for the top
20% FOS expressers and 7.585 for the bottom 20% FOS expressers. The
results of the CRADD analysis, for the categories of top 20% and
bottom 20% FOS expressers, represented an average of 7.385 in the
top 20% FOS expressers and an average of 7.039 for the bottom 20%
FOS expressers.
| Table II.Comparison of microarray value
averages for apoptosis-effector genes UQCRC2 and CRADD, for the FOS
high and low expressers in the breast cancer dataset. |
Table II.
Comparison of microarray value
averages for apoptosis-effector genes UQCRC2 and CRADD, for the FOS
high and low expressers in the breast cancer dataset.
| Effector gene | Top 20% FOS
expressers | Bottom 20% FOS
expressers | P-value (top vs.
bottom) |
|---|
| UQCRC2 | 8.212 | 7.585 | <0.0001 |
| CRADD | 7.385 | 7.039 | <0.0001 |
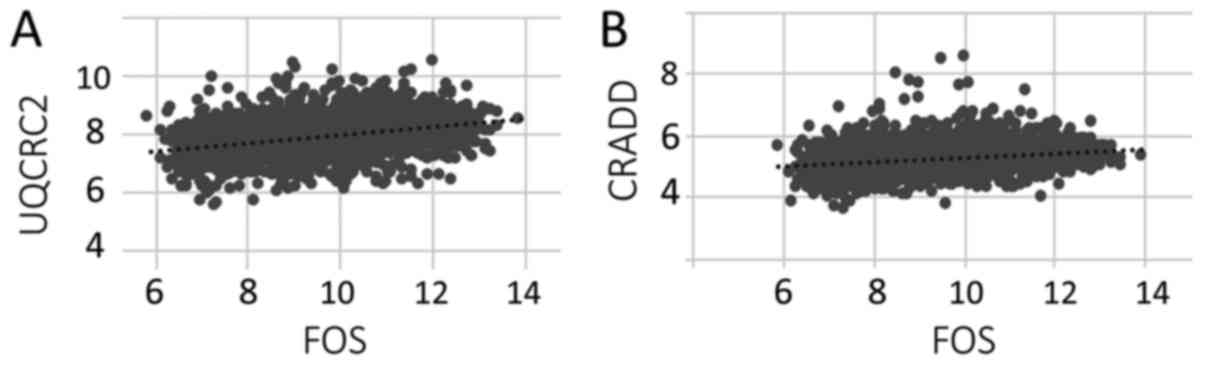
To confirm the correlation of expression levels
between FOS and UQCRC2 or CRADD, we determined the Pearson
correlation coefficient for the FOS microarray values and the
apoptosis-effector gene RNA microarray values. Both the UQCRC2
(Fig. 2A) and CRADD (Fig. 2B) apoptosis-effector genes showed a
linear correlation with the (entire) set of FOS microarray values.
Thus, the correlation data were consistent with the above described
indication that the barcodes representing the top 20% FOS
expressers and bottom 20% of FOS expressers also represented
statistically significant differences in the expression of UQCRC2
and CRADD.
High levels of POU2F1 are generally
not associated with high levels of POU2F1 responsive
apoptosis-effector genes
As noted above (Table
I; Fig. 1B), higher levels of
POU2F1 microarray values are associated with statistically
significant worse survival. To determine whether apoptosis-effector
genes with POU2F1 binding sites represented either more or less
expression when POU2F1 levels were high, we obtained the microarray
values for the following POU2F1-site containing, apoptosis-effector
genes: UQCRC2, GZMA, CRADD, CHEK1, CASP5, CASP3, and COX7B2. We
then sorted the barcodes based on top 20% and bottom 20% POU2F1
expressers. We next obtained the microarray values for the above
indicated apoptosis-effector genes (with the POU2F1-binding sites),
for the top 20% and bottom 20% POU2F1 expression categories,
respectfully (Table III). All of
the apoptosis-effector genes indicated statistically significant
differences in expression levels for the upper and lower POU2F1
expression categories with the exception of COX7B2. In the case of
COX7B2, the microarray values for top and bottom POU2F1 expressers
showed no significant differences. In these POU2F1-site containing
genes, the barcodes at the highest level of POU2F1 expression had
lower levels of apoptosis gene expression, and the barcodes at the
lowest level of POU2F1 expression had higher levels of
apoptosis-effector gene expression. These results are consistent
with POU2F1 as a cancer driver and a TF that is not activating what
would otherwise be POU2F1-responsive, pro-apoptotic genes (Table III). The one exception to this trend
was CASP3 (Table III). In addition,
we determined the Pearson correlation coefficients for the entire
set of microarray values for POU2F1 vs. UQCRC2, GZMA, and CRADD,
respectfully (Fig. 3). These three
apoptosis-effector genes were chosen for the Pearson correlation
coefficient analysis because they represented the largest
separation of expressions values representing the top and bottom
20% POU2F1 expressers (Table III).
(Also, these three apoptosis-genes were studied in the next section
as independent markers of survival.) Results from the Pearson
correlation coefficient analyses (Fig.
3) were consistent with the above indicated distinctions based
on the analyses of the top 20% and bottom 20% of POU2F1 expressers
(Table III).
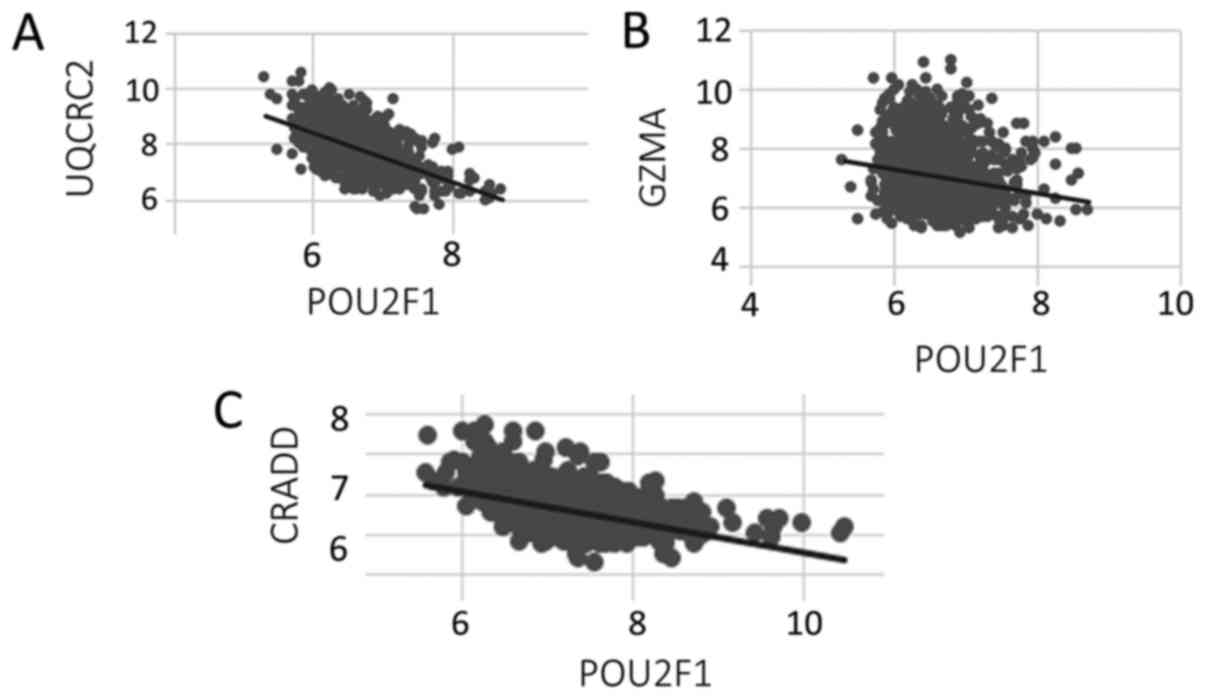 | Figure 3.Scatter plots of POU2F1 microarray
values vs. associated apoptosis-effector genes UQCRC2, GZMA, CRADD.
The linear correlation coefficient plots of (A) POU2F1 vs. UQCRC2,
(B) POU2F1 vs. GZMA and (C) POU2F1 vs. CRADD are negatively
correlated, with r2=0.29, 0.028, 0.21, respectfully. In
all three cases, P<0.00001. POU2F1, POU class 2 homeobox 1;
UQCRC2, ubiquinol-cytochrome C reductase core protein 2; GZMA,
granzyme A; CRADD, CASP2 and RIPK1 domain containing adaptor with
death domain. |
| Table III.Breast cancer expression levels of
POU2F1 transcription factor binding site-containing,
apoptosis-effector genes. |
Table III.
Breast cancer expression levels of
POU2F1 transcription factor binding site-containing,
apoptosis-effector genes.
| Transcription
factor | Top 20% POU2F1
expressers, mean microarray value | Bottom 20% POU2F1
expressers mean microarray value | P-value |
|---|
| POU2F1-independent
predictors of survival rates |
|
|
|
|
UQCRC2 | 7.41 | 8.38 | 0.0001 |
| GZMA | 6.84 | 7.27 | 0.0001 |
| Do not associate with
differing survival rates |
|
|
|
|
CRADD | 6.90 | 7.45 | 0.0001 |
|
CHEK1 | 6.50 | 6.68 | 0.0001 |
|
CASP5 | 5.44 | 5.46 | 0.0558 |
|
CASP3 | 8.67 | 8.57 | 0.0004 |
|
COX7B2 | 5.41 | 5.43 | NS |
Apoptosis-effector genes expression
levels as independent indicators of survival rates
To determine whether the expression levels of the
apoptosis-effector genes could be independent indicators of
survival distinctions, we sorted the barcodes based on the
microarray values for each apoptosis-effector gene, without regard
for the expression of any of the TFs. Barcodes representing the top
20% of UQCRC2 microarray expression levels displayed a greater
overall survival rate (P=0.0037) when compared to all remaining
samples (Table IV). And, the
barcodes representing the bottom 20% of UQCRC2 microarray values
displayed a worse overall survival when compared to all remaining
samples (P=0.05) (Table IV).
Likewise, barcodes representing the top 20% of GZMA microarray
expression levels displayed a greater overall survival rate when
compared to all remaining barcodes (P=0.012). And, barcodes
representing the bottom 20% of GZMA microarray expression levels
displayed a worse overall survival rate when compared to all
remaining samples (P=0.0032) (Table
IV). The expression levels of the remaining apoptosis-effector
genes (Table III) did not indicate
any independent associations with distinct survival rates.
| Table IV.Breast cancer expression levels
apoptosis-effector genes used for survival rate correlations
independent of the pro-proliferative transcription factors. |
Table IV.
Breast cancer expression levels
apoptosis-effector genes used for survival rate correlations
independent of the pro-proliferative transcription factors.
| Transcription
factor | Top 20%
apoptosis-gene expressers, mean microarray value | Bottom 20%
apoptosis-gene expressers, mean microarray value | P-value |
|---|
| UQCRC2 | 8.85 | 6.96 | <0.0001 |
| GZMA | 8.63 | 5.83 | <0.0001 |
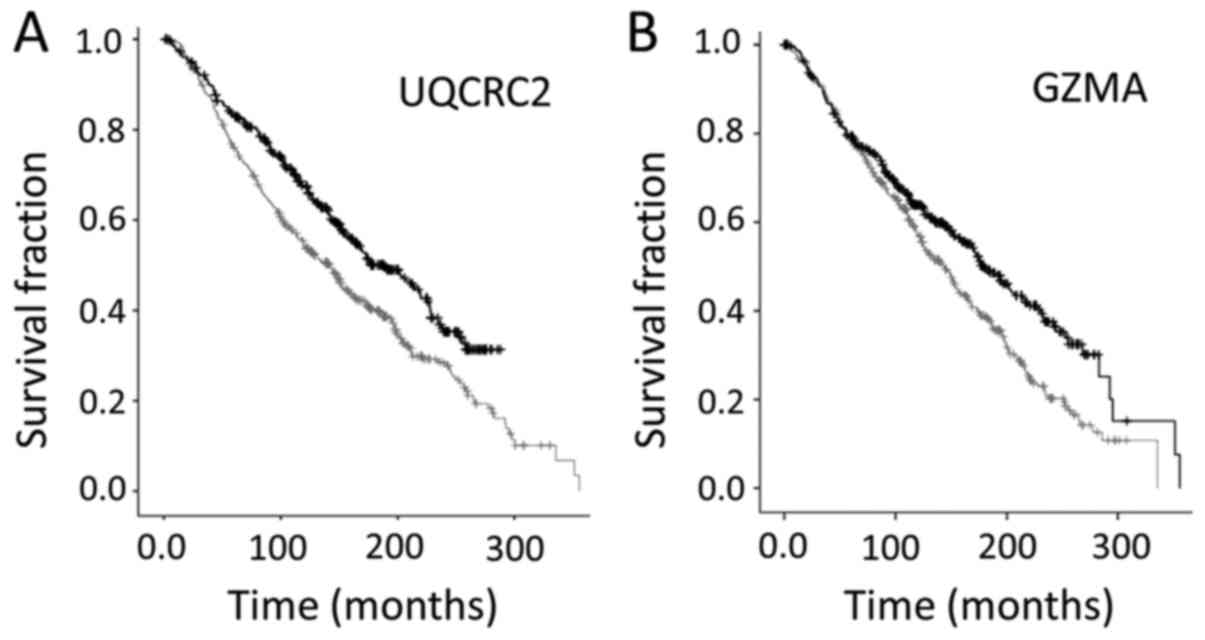
To confirm the above indication, that UQCRC2 and
GZMA represented independent correlations with survival rates, KM
survival curves were created representing in each case the top 20%
and bottom 20% expressers, using the SPSS software (Fig. 4). Results indicated that higher levels
of both UQCRC2 and GZMA were associated with better survival
rates.
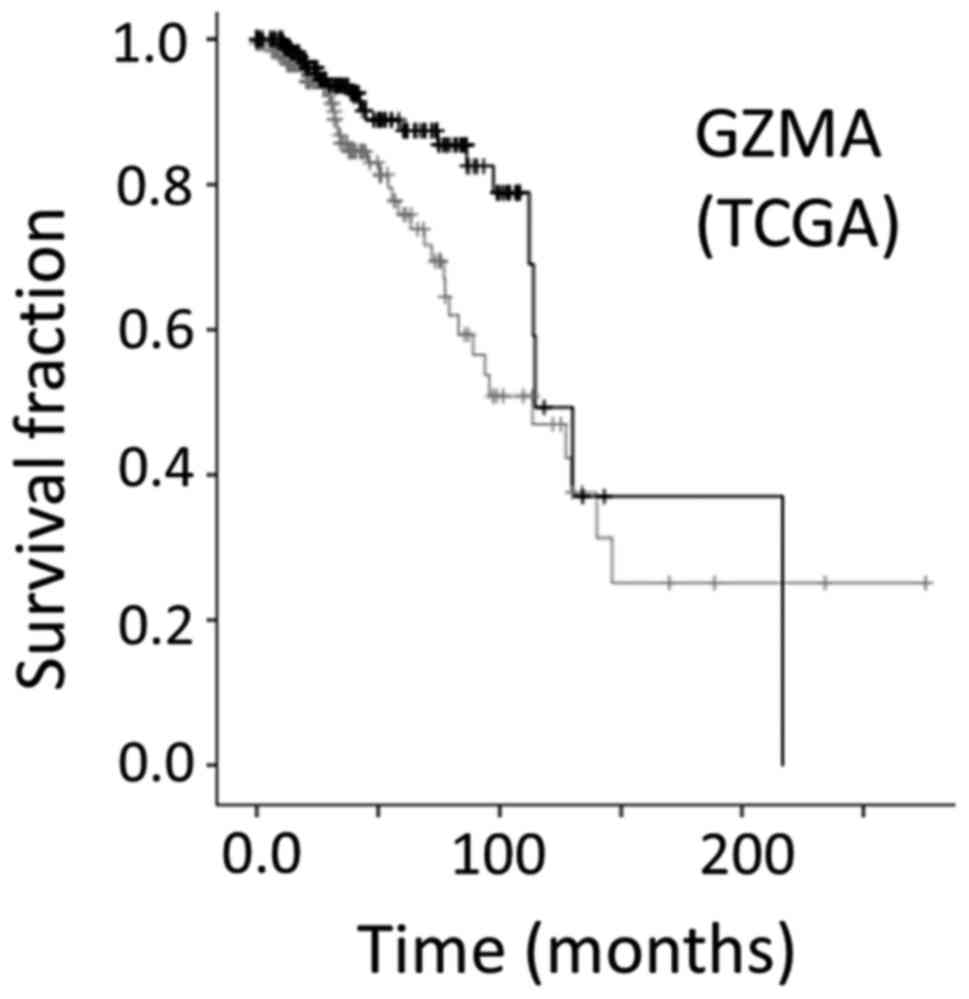
GZMA as an independent indicator for
survival rate in a distinct breast cancer dataset
Overall KM survival curve of patients representing
the top 20% of expressers of the apoptosis gene, GZMA, in a
different breast cancer data set (TCGA-BRCA, with 1105 samples),
displayed a better survival, compared with all remaining barcodes
(P=0.11). There was a worse survival rate for the bottom 20% GZMA
expressers, compared with all remaining barcodes (P=0.032). An
additional, independently constructed KM survival curve was created
to further verify the above information that GZMA displayed
significant survival differences in a second distinct breast cancer
dataset (Fig. 5).
GZMA methylation
To consider a mechanistic explanation for GZMA
differences in the expression levels among the TCGA barcodes, we
hypothesized that GZMA methylation could lead to a repressive
chromatin structure and thereby block access to POU2F1 in the cells
representing the barcodes with high POU2F1 levels and relatively
low levels of GZMA. Thus, we downloaded the TCGA-BRCA methylation
data for GZMA and organized the barcodes into the top 20% and
bottom 20% of GZMA expression levels. (The metabric study did not
have methylation data.) We calculated the GZMA methylation
(beta-score) of the top 20% GZMA expressers to be 0.61; and
calculated the GZMA methylation for the bottom 20% of the GZMA
expressers to be 0.85, representing a higher level of GZMA gene
methylation and a statistically significant difference (Table V).
| Table V.Granzyme A methylation levels for The
Cancer Genome Atlas-BRCA dataset. |
Table V.
Granzyme A methylation levels for The
Cancer Genome Atlas-BRCA dataset.
| Data set | Top 20%
expressers | Bottom 20%
expressers | P-value |
|---|
| TCGA-BRCA | 0.609 | 0.853 | <0.0001 |
Raw RNAseq data verification
Because the above analysis was done with processed
data, we sought to verify the final conclusion, that the apoptosis
effector gene, GZMA, represented a robust biomarker for breast
cancer survival. Thus, we downloaded the original RNASeq files from
the genome data commons for the top and bottom 20% GZMA expressers
and obtained read counts representing GZMA, i.e., hg38 reference
genome position, chr5:55, 102, 648-55, 110, 252. The average number
of reads for the top 20% expressers was 2698; the average number of
reads for the bottom 20% expressers was 107 (P<0.0001).
Discussion
As indicated by the above analyses, available data
are consistent with the idea that feed-forward pathways can
represent specific distinctions, based on what have been
traditionally considered pro-proliferative TFs, between
pro-proliferative and pro-apoptotic pathways. This conclusion was
also recently reached for lower grade glioma and squamous cell lung
cancer (23), where MYC and YY1,
respectively, were identified as apoptosis-drivers. These
distinctions may be useful in determining a more accurate overall
survival rate among cancer patients, as well as possibly assist in
development of therapies. In this study, low POU2F1 barcodes
represented a 25.9 month longer survival, on average.
In the case of the above breast cancer dataset, the
analyses indicated that high levels of FOS were associated with
better survival, and that high levels of POU2F1, as noted in the
previous paragraph, were associated with worse survival outcomes.
To understand the link between FOS and better survival, FOS was
connected to higher expression of apoptosis-effector genes, thereby
indicating a credible pathway for FFA, with FOS as the
apoptosis-driver. In particular, the higher level of FOS expression
was correlated with higher expression of the apoptosis-effector
genes, CRADD and UQCRC2.
To better understand how lower levels of POU2F1
could be associated with a higher survival rate, we examined the
POU2F1 relationship with its putatively responsive,
apoptosis-effector genes: UQCRC2, GZMA, CRADD, CHEK1, CASP5. In all
of these cases, the highest level of gene expression was associated
with the lowest levels of POU2F1. As noted in Results, in two
cases, there was not an inverse correlation with POU2F1 expression
for the POU2F1 putatively responsive, apoptosis-effector genes. In
these latter two cases, there is no explanation for the lack of an
inverse correlation of expression levels, other than the
possibility that the expression of the two apoptosis-effector genes
does not interfere with POU2F1 as a cancer-driver due to a
mechanism that is not related to transcriptional activation, for
example, micro-RNA mediated, negative regulation at the level of
translation. Investigations of such a possibilities will be part of
future work.
While the above connections between TFs and
apoptosis-effector genes indicates a mechanism whereby higher
levels of what are traditionally consider pro-proliferative TFs
could lead to better survival, an additional, practical issue is,
biomarkers for improved for survival rates. As such, we examined
apoptosis-effector gene expression for TF-independent associations
with distinct survival rates, with GZMA and UQCRC2 representing the
most important such biomarker candidates, including the
confirmation of higher GZMA expression levels representing better
overall survival rates in a second breast cancer dataset, namely
the TCGA BRCA dataset. GZMA is expressed at a high level in
cytotoxic T-cells (24), and none of
the above data can indisputably pinpoint the source of the gene
expression studied, i.e., cancer cells or micro-environment cells.
Thus, it is possible that the higher level of GZMA represents a
higher level of cytotoxic T-cell infiltrate that is mediating an
increased level of apoptosis and better survival rates. However,
there is no such specific association of the FOS-responsive UQCRC2
with immune infiltrate cells, and what data is available indicates
mammary tissue and whole blood represent about the same levels of
expression (genome.ucsc.edu), very different from
GZMA.
In sum, the above analyses identified potential FFA
signatures in breast cancer with possible insights into therapy
design and likely survival rate, biomarker identification.
Acknowledgements
Not applicable.
Funding
No funding was received.
Availability of data and materials
The datasets used and/or analyzed during the current
study are available from the corresponding author on reasonable
request.
Authors' contributions
DAF designed the approach to testing the main
hypotheses and conducted the majority of the analyses. DS conducted
the raw RNAseq data verification. JMY conducted the methylation
analyses and assisted with Kaplan-Meier analyses. YT contributed
the analyses of the raw RNASeq files for verifications of processed
data and contributed to drafting the manuscript. GB supervised the
project and contributed extensively to the analysis of the results.
GB also wrote and prepared the manuscript, formulated important
intellectual content and critical reviewed all aspects of data
collection, analysis and preparation.
Ethics approval and consent to
participate
Not applicable.
Consent for publication
Not applicable.
Competing interests
The authors declare that they have no competing
interests.
References
|
1
|
Truman JP, Choqueux C, Charron D and
Mooney N: HLA class II molecule signal transduction leads to either
apoptosis or activation via two different pathways. Cell Immunol.
172:149–157. 1996. View Article : Google Scholar : PubMed/NCBI
|
|
2
|
Ford SA and Blanck G: Signal persistence
and amplification in cancer development and possible, related
opportunities for novel therapies. Biochim Biophys Acta.
1855:18–23. 2015.PubMed/NCBI
|
|
3
|
Macián F, Im SH, García-Cózar FJ and Rao
A: T-cell anergy. Curr Opin Immunol. 16:209–216. 2004. View Article : Google Scholar : PubMed/NCBI
|
|
4
|
Szekeres K, Koul R, Mauro J, Lloyd M,
Johnson J and Blanck G: An Oct-1-based, feed-forward mechanism of
apoptosis inhibited by co-culture with Raji B-cells: Towards a
model of the cancer cell/B-cell microenvironment. Exp Mol Pathol.
97:585–589. 2014. View Article : Google Scholar : PubMed/NCBI
|
|
5
|
Field SJ, Tsai FY, Kuo F, Zubiaga AM,
Kaelin WG Jr, Livingston DM, Orkin SH and Greenberg ME: E2F-1
functions in mice to promote apoptosis and suppress proliferation.
Cell. 85:549–561. 1996. View Article : Google Scholar : PubMed/NCBI
|
|
6
|
Wu X and Levine AJ: p53 and E2F-1
cooperate to mediate apoptosis. Proc Natl Acad Sci USA.
91:3602–3606. 1994. View Article : Google Scholar : PubMed/NCBI
|
|
7
|
Yamasaki L, Jacks T, Bronson R, Goillot E,
Harlow E and Dyson NJ: Tumor induction and tissue atrophy in mice
lacking E2F-1. Cell. 85:537–548. 1996. View Article : Google Scholar : PubMed/NCBI
|
|
8
|
Oswald F, Dobner T and Lipp M: The E2F
transcription factor activates a replication-dependent human H2A
gene in early S phase of the cell cycle. Mol Cell Biol.
16:1889–1895. 1996. View Article : Google Scholar : PubMed/NCBI
|
|
9
|
Banerjee D, Ercikan-Abali E, Waltham M,
Schnieders B, Hochhauser D, Li WW, Fan J, Gorlick R, Goker E and
Bertino JR: Molecular mechanisms of resistance to antifolates, a
review. Acta Biochim Pol. 42:457–464. 1995.PubMed/NCBI
|
|
10
|
Berry DE, Lu Y, Schmidt B, Fallon PG,
O'Connell C, Hu SX, Xu HJ and Blanck G: Retinoblastoma protein
inhibits IFN-gamma induced apoptosis. Oncogene. 12:1809–1819.
1996.PubMed/NCBI
|
|
11
|
McKay BC, Becerril C, Spronck JC and
Ljungman M: Ultraviolet light-induced apoptosis is associated with
S-phase in primary human fibroblasts. DNA Repair (Amst). 1:811–820.
2002. View Article : Google Scholar : PubMed/NCBI
|
|
12
|
Mauro JA and Blanck G: Functionally
distinct gene classes as bigger or smaller transcription factor
traps: A possible stochastic component to sequential gene
expression programs in cancer. Gene. 536:398–406. 2014. View Article : Google Scholar : PubMed/NCBI
|
|
13
|
Garcia M, Mauro JA, Ramsamooj M and Blanck
G: Tumor suppressor genes are larger than apoptosis-effector genes
and have more regions of active chromatin: Connection to a
stochastic paradigm for sequential gene expression programs. Cell
Cycle. 14:2494–2500. 2015. View Article : Google Scholar : PubMed/NCBI
|
|
14
|
Lu H, Liang X, Issaenko OA and Hallstrom
TC: Jab1/CSN5 mediates E2F dependent expression of mitotic and
apoptotic but not DNA replication targets. Cell Cycle.
10:3317–3326. 2011. View Article : Google Scholar : PubMed/NCBI
|
|
15
|
Lu H and Hallstrom TC: The nuclear protein
UHRF2 is a direct target of the transcription factor E2F1 in the
induction of apoptosis. J Biol Chem. 288:23833–4333. 2013.
View Article : Google Scholar : PubMed/NCBI
|
|
16
|
Teitz T, Wei T, Valentine MB, Vanin EF,
Grenet J, Valentine VA, Behm FG, Look AT, Lahti JM and Kidd VJ:
Caspase 8 is deleted or silenced preferentially in childhood
neuroblastomas with amplification of MYCN. Nat Med. 6:529–535.
2000. View Article : Google Scholar : PubMed/NCBI
|
|
17
|
Yavorski JM and Blanck G: TCGA: Increased
oncoprotein coding region mutations correlate with a greater
expression of apoptosis-effector genes and a positive outcome for
stomach adenocarcinoma. Cell Cycle. 15:1–7. 2016. View Article : Google Scholar : PubMed/NCBI
|
|
18
|
Mauro JA, Butler SN, Ramsamooj M and
Blanck G: Copy number loss or silencing of apoptosis-effector genes
in cancer. Gene. 554:50–57. 2015. View Article : Google Scholar : PubMed/NCBI
|
|
19
|
Mauro JA, Yavorski JM and Blanck G:
Stratifying melanoma and breast cancer TCGA datasets on the basis
of the CNV of transcription factor binding sites common to
proliferation- and apoptosis-effector genes. Gene. 614:37–48. 2017.
View Article : Google Scholar : PubMed/NCBI
|
|
20
|
Cerami E, Gao J, Dogrusoz U, Gross BE,
Sumer SO, Aksoy BA, Jacobsen A, Byrne CJ, Heuer ML, Larsson E, et
al: The cBio cancer genomics portal: An open platform for exploring
multidimensional cancer genomics data. Cancer Discov. 2:401–404.
2012. View Article : Google Scholar : PubMed/NCBI
|
|
21
|
Callahan BM, Patel JS, Fawcett TJ and
Blanck G: Cytoskeleton and ECM tumor mutant peptides: Increased
protease sensitivities and potential consequences for the HLA class
I, mutant epitope reservoir. Int J Cancer. 142:988–998. 2017.
View Article : Google Scholar : PubMed/NCBI
|
|
22
|
Yavorski JM and Blanck G: Smoking
correlates with increased cytoskeletal protein-related coding
region mutations in the lung and head and neck datasets of the
cancer genome atlas. Physiol Rep. 4:pii: e13045. 2016. View Article : Google Scholar : PubMed/NCBI
|
|
23
|
Sikaria D, Tu YN, Fisler DA, Mauro JA and
Blanck G: Identification of specific feed-forward apoptosis
mechanisms and associated higher survival rates for low grade
glioma and lung squamous cell carcinoma. J Cancer Res Clin Oncol.
144:459–468. 2018. View Article : Google Scholar : PubMed/NCBI
|
|
24
|
Lieberman J: Granzyme A activates another
way to die. Immunol Rev. 235:93–104. 2010. View Article : Google Scholar : PubMed/NCBI
|