Introduction
Circulating tumor DNA, which is tumor-derived
soluble cell-free DNA (cfDNA) found in plasma, contains the same
mutations as the cellular DNA of the tumor. In 1977, Leon et
al (1) found that the
concentration of cfDNA in patients with cancer was much higher than
in normal controls. Several studies have shown that tumor-derived
DNA is released into blood and enriched in plasma. As tumor-derived
cfDNA contains the same mutations as tumor cellular DNA (2,3), the
former may be used as evidence of the presence of a tumor. Using
cfDNA as a diagnostic sample represents a novel, convenient, and
noninvasive method for tumor detection, as cfDNA derived from
tumors possesses mutations specific to these tumors (4). Furthermore, such analyses are expected
to provide information regarding minimal residual disease
(MRD).
Acute myeloid leukemia (AML) is a highly aggressive
hematologic malignancy; MRD monitoring is crucial for the
successful management of this disease (5). Currently, two strategies are employed
for MRD monitoring of AML- detection of specific gene abnormalities
in leukemia cells by quantitative polymerase chain reaction (qPCR)
and detection of phenotypic abnormal tumor cells by flow cytometry
(6). Several patients with AML harbor
recurrent genetic abnormalities of prognostic significance, such as
PML-RARα, AML1-ETO, and CBFβ-MYH11. The quantitative measurement of
PML-RARα by real-time polymerase chain reaction (PCR) has been
extremely useful for MRD monitoring of AML. However, not all AML
patients may be monitored using qPCR, and flow cytometry is less
satisfactory than qPCR for MRD monitoring (6).
Leukemia cells represent the clonal outgrowth of
hematopoietic stem cells arrested at early stages of myeloid
differentiation. Numerous patients with AML display surface
antigens associated with lymphoid development. In the last few
decades, several studies have reported the prognostic utility of
lymphoid antigen expression in AML (7). Furthermore, monoclonal rearrangements of
immunoglobulin heavy chain (IGH) and/or T-cell receptor (TCR) have
been detected in AML (8,9). For most patients with AML without
recurrent genetic abnormalities, monoclonal rearrangements of IGH
and/or TCR represent useful tools for MRD monitoring. In the
present study, we aimed to use clonal rearrangement of IGH and the
TCR gene in cfDNA as MRD markers in AML. Additionally, we
determined the incidence of monoclonal IGH and TCR gene
rearrangement in patients with AML, using cfDNA as well as DNA from
bone marrow (BM) and peripheral blood (PB) samples. Finally, we
examined the prognostic utility of these variables and their
relationship with early relapse for MRD monitoring.
Patients and methods
Patients
We recruited 235 adult patients diagnosed with AML
at our hospital between September 2009 and September 2014 according
to the World Health Organization (WHO) Classification of Tumors of
Hematopoietic and Lymphoid Tissue (4th edition) criteria. Patients
with acute promyelocytic leukemia were excluded. PB, BM, and plasma
samples were collected and archived before induction chemotherapy,
after two and four courses of consolidation chemotherapies, and
every 3 months thereafter. Control samples were obtained from 40
patients without malignant hematologic disease. The present study
was approved by the ethics committee of Sichuan Academy of Medical
Science and Sichuan Provincial Peoples' Hospital (Sichuan, China)
according to the Declaration of Helsinki. All patients provided
written informed consent.
DNA extraction
PB samples were drawn and then immediately
centrifuged at 3,000 rpm for 5 min. Plasma and cells were collected
and stored in liquid nitrogen. The mononuclear cells of BM samples
were isolated as previously described (8) and stored in liquid nitrogen.
DNA from the PB was extracted using an SBS DNA
extraction kit (SBS, Beijing, China) according to the
manufacturer's instructions. cfDNA and DNA from BM samples were
extracted using a QIAamp DNA Mini kit (Qiagen GmbH, Hilden,
Germany) according to the manufacturer's instructions. To enrich
the cfDNA, we modified the extraction protocol by adding 10% PEG
8000 solution. Briefly, 20 µl of proteinase K was added to 200 µl
of thawed plasma, and the mixed samples were incubated at 56°C for
30 min. Then, after being cooled to room temperature, an equal
volume of 10% PEG 8000 solution was added and the samples were
placed at 4°C for 30 min. Then, 200 µl of 100% ethanol was added to
the samples, which were subsequently eluted using the QIAamp spin
column, in two equivalent increments. The column was then washed
with three different buffers (AW1, AW2, AE; Qiagen GmbH). DNA was
eluted to a volume of 50 µl with the final buffer; 10 µg of cfDNA
was obtained from 3 ml PB.
PCR
The DNA products from plasma, PB, and BM were
analyzed for clonality using the strict quality control protocols
established by Kwok and Higuchi (10). In addition, for each experiment,
cellular DNA from the normal and empty controls was used as a
double-negative control. Raji and Jurkat cells were used as
positive controls for monoclonal IGH and TCR rearrangement,
respectively. PCR was performed in a total volume of 25 µl
containing 12.5 µl of 2× reaction mix (Takara Biotechnology Co.,
Ltd., Dalian, China), 0.1 µl of golden DNA polymerase, 25 µM primer
mix (Invitrogen; Thermo Fisher Scientific, Inc., Waltham, MA, USA;
Table I), DNA template (<0.5 µg),
and dH2O. A Bio-Rad thermal cycler (Bio-Rad Laboratories, Inc.,
Hercules, CA, USA) was used for PCR; the final PCR products were
separated on 8% polyacrylamide gels and confirmed by DNA
sequencing. A sample was defined as monoclonal if the assay showed
a distinct, single band in the appropriate region. If there was no
band or smear, the sample was considered polyclonal. Globin was set
as an internal reference. Touchdown PCR consisted of an initial
denaturation step of 3 min at 95°C; followed by five cycles of
denaturation at 94°C for 30 sec, annealing for 30 sec from 60°C to
55°C decreasing by 1°C every cycle, and extension at 72°C for 40
sec; and then 30 cycles of 30 sec at 94°C, 30 sec at 55°C, and 40
sec at 72°C, with a final extension step of 10 min at 72°C. The
IGH gene was amplified by PCR using a mixture of
oligonucleotides specific for each of the VH leader sequences of
the VH1-6 (11) gene families,
together with a mixture of oligonucleotides complementary to all
possible JH gene segments (JH1-6). Amplification consisted of an
initial denaturation step of 5 min at 94°C for 1 min, annealing at
61°C for 1 min, and extension at 72°C for 1 min, with a final
extension step of 10 min at 72°C. In the second round (nested PCR),
1 µl of amplified DNA (first-round product) was re-amplified using
oligonucleotides representative of framework regions (FWR)-2 and −3
(FWR2/FWR3) together with the mixture of JH1-6 oligonucleotides as
primers. PCR was carried out as described above. Amplification
consisted of an initial denaturation step of 5 min at 94°C,
followed by 30 cycles of denaturation at 94°C for 1 min, annealing
at 55°C for 1 min, and extension at 72°C for 1 min, with a final
extension step of 10 min at 72°C. Touchdown PCR for the TCR gene
consisted of an initial denaturation step of 3 min at 95°C;
followed by five cycles of denaturation at 94°C for 30 sec,
annealing for 30 sec from 60°C to 55°C decreasing by 1°C every
cycle, extension at 72°C for 40 sec; and then 30 cycles of 30 sec
at 94°C, 30 sec at 55°C, 40 sec at 72°C, with a final extension
step of 10 min at 72°C.
 | Table I.Clinical characteristics at
presentation for patients in the IGHneg and TCRneg,
IGHposor TCRpos, IGHpos and TCRpos
genotype groups. |
Table I.
Clinical characteristics at
presentation for patients in the IGHneg and TCRneg,
IGHposor TCRpos, IGHpos and TCRpos
genotype groups.
| Characteristics | IGHneg and
TCRneg | IGHposor
TCRpos | IGHpos and
TCRpos | P-value |
|---|
| Hemoglobin
(g/dl) |
|
|
|
|
|
Median | 86.0 | 77.5 | 74.0 | 0.094 |
|
Range | 59–192 | 64–131 | 5–106 |
|
| Platelets
(109/l) |
|
|
|
|
|
Median | 42 | 37 | 24 | 0.16 |
|
Range | 6–208 | 4–135 | 2–87 |
|
| WBC (109/l) |
|
|
|
|
|
Median | 14.29 | 40.99 | 213.23 | 0.010 |
|
Range | 1.13–39.37 | 19.86–114.65 | 63.18–277.80 |
|
| PB Blast (%) |
|
|
|
|
|
Median | 52 | 71 | 81 | 0.05 |
|
Range | 0–96 | 11–90 | 69–91 |
|
| BW blasts (%) |
|
|
|
|
|
Median | 61 | 64 | 79 | 0.29 |
|
Range | 23–87 | 37–85 | 50–82 |
|
| Serum LDH |
|
|
|
|
|
Median | 369 | 560 | 1725 | 0.010 |
|
Range | 92–949 | 225–1203 | 581–5450 |
|
| Immune marker |
|
|
|
|
|
CD34 | 80 | 90 | 100 | 0.40 |
|
HLA-DR | 80 | 90 | 100 | 0.40 |
|
CD13 | 76 | 90 | 100 | 0.39 |
|
CD33 | 75 | 88 | 100 | 0.36 |
|
CD117 | 68 | 87 | 100 | 0.35 |
|
CD7 | 36 | 40 | 100 | 0.024 |
|
CD19 | 15 | 17 | 75 | 0.016 |
|
CD56 | 0 | 6 | 50 | 0.010 |
|
CD4 | 0 | 0 | 25 | 0.011 |
| Hepatomegaly | 4 | 6 | 11 | 0.32 |
| Splenomegaly | 4 | 13 | 12 | 0.17 |
|
Lymphadenopathy | 13 | 6 | 11 | 0.86 |
| Gum
hypertrophy | 23 | 12 | 12 | 0.61 |
| Skin
infiltrates | 9 | 12 | 12 | 0.87 |
PCR product analysis
PCR products were analyzed by 5% agarose
electrophoresis. A distinct band was interpreted as a clonal
rearrangement. If the results were unclear, polyacrylamide gels
were used to confirm monoclonal rearrangement. DNA sequencing was
performed to validate that the PCR products corresponded to clonal
IGH or TCR rearrangements, and that the initial monoclonal
rearrangement reappeared in follow-up samples. Furthermore, in
follow-up samples, clone conformity of AML samples at diagnosis and
before relapse was tested through capillary electrophoresis.
Multiparameter flow cytometry
Assessment of MRD by multi-parameter flow cytometry
(MFC) was conducted as previously described (12). A minimum of 1000,000 events were
acquired to achieve a potential sensitivity level of 10-4. In each
tube, after excluding debris and doublets, an initial wide gate
(CD45dim gate) is drawn around the CD45dim blast and monocyte
regions on a traditional CD45/SSC display, followed by back-gating
to identify the CD34+ population, as well as CD117 cells on the
CD45/SSC plot. CD19 is used as an exclusion gate on most plots, to
separate out normal immature precursor B cells and plasma cells
from the CD45dim gate.
qPCR
qPCR was used for analysis of the status of
rearranged IGH and TCR over time in remittent patients, as well as
to monitor MRD. The primers used in the present study are shown in
Table II. The results of DNA
sequencing were inputted into VBASE database or IMGT database to
acquire missed or inserted bases. Primer3.0 and BLAST were used to
design primers and probes. The procedure for amplification included
establishment of standard curves by both serial dilution of DNA
templates from patients undertaking initial therapy (10:1 to 10:6)
targeting specific IGH/TCR rearrangements and serial dilution of
DNA templates from normal individuals (10:1 to 10:4) targeting the
internal control gene encoding albumin. qPCR was performed
using the following protocol: 95°C for 60 sec; followed by 40
cycles of 95°C for 15 sec and 60°C for 60 sec. The standard curves
of IGH/TCR for each patient and the control gene encoding albumin
were obtained after qPCR.
| Table II.Oligonucleotide primers used for
PCR. |
Table II.
Oligonucleotide primers used for
PCR.
| Gene name | Primer | Sequence
(5′-3′) |
|---|
| β-Globin | Globin-F |
GATCTGTCCACTCCTGATGCTG |
|
| Globin-R |
ATCAAGCGTCCCATAGACTCAC |
| IGH | VH1 |
CAGGRGCAGCTGGTGCAGTCTGG |
|
| VH2 |
CAGGTCAACTTAAGGGAGTCTGG |
|
| VH3 |
GAGGTGCAGCTGGTGGAGTCTGG |
|
| VH4 |
CAGGTGCAGCTGCAGGAGTCGGG |
|
| VH5 |
GAGGTGCAGCTGTTGCAGTCTGC |
|
| VH6 |
CAGGTACAGCTGCAGCAGTCAGG |
|
| JH1-2 |
TGAGGAGACGGTGACCAGGGTGCC |
|
| JH3 |
TGAAGAGACGGTGACCATTGTCCC |
|
| JH4-5 |
TGAGGAGACGGTGACCAGGGTTCC |
|
| JH6 |
TGAGGAGACGGTGACCGTGGTCCC |
|
| FWR2 |
TGGATCCGACAGGCCCCAGGG |
|
| FWR3 |
ACACGGCCGTGTATTACTGT |
| TCRB | Vβ2: |
AACTATGTTTTGGTATCGTCA |
|
| Vβ4: |
CACGATGTTCTGGTACCGTCAGCA |
|
| Vβ5/1: |
CAGTGTGTCCTGGTACCAACAG |
|
| Vβ6a/11: |
AACCCCTTTATTGGTACCGACA |
|
| Vβ6b/25: |
ATCCCTTTTTTGGTACCAACAG |
|
| Vβ6c: |
AACCCTTTATTGGTATCAACAG |
|
| Vβ7: |
CGCTATGTATTGGTACAAGCA |
|
| Vβ8a: |
CTCCCGTTTTCTGGTACAGACAGAC |
|
| Vβ9: |
CGCTATGTATTGGTATAAACAG |
|
| Vβ10: |
TTATGTTTACTGGTATCGTAAGAAGCC |
|
| Vβ11: |
CAAAATGTACTGGTATCAACAA |
|
|
Vβ12a/3/13a/15: |
ATACATGTACTGGTATCGACAAGAC |
|
| Vβ13b: |
GGCCATGTACTGGTATAGACAAG |
|
| Vβ13c/12b/14: |
GTATATGTCCTGGTATCGACAAGA |
|
| Vβ16: |
TAACCTTTATTGGTATCGACGTGT |
|
| Vβ17: |
GGCCATGTACTGGTACCGACA |
|
| Vβ18: |
TCATGTTTACTGGTATCGGCAG |
|
| Vβ19: |
TTATGTTTATTGGTATCAACAGAATCA |
|
| Vβ20: |
CAACCTATACTGGTACCGACA |
|
| Vβ21: |
TACCCTTTACTGGTACCGGCAG |
|
| Vβ22: |
ATACTTCTATTGGTACAGACAAATCT |
|
| Vβ23/8b: |
CACGGTCTACTGGTACCAGCA |
|
| Vβ24: |
CGTCATGTACTGGTACCAGCA |
|
| Jβ1.1: |
CTTACCTACAACTGTGAATCTGGTG |
|
| Jβ1.2: |
CTTACCTACAACGGTTAACCTGGTC |
|
| Jβ1.3: |
CTTACCTACAACAGTGAGCCAACTT |
|
| Jβ1.4: |
CATACCCAAGACAGAGCTGGGTTC |
|
| Jβ1.5: |
CTTACCTAGGATGGAGAGTCGAGTC |
|
| Jβ1.6: |
CATACCTGTCACGATGAGCCTG |
|
| Jβ2.2: |
CTTACCCAGTACGGTCAGCCT |
|
| Jβ2.6: |
CTCGCCCAGCACGGTCAGCCT |
|
| Jβ2.7: |
CTTACCTGTAACCGTGAGCCTG |
|
| Jβ2.1: |
CCTTCTTACCTAGCACGGTGA |
|
| Jβ2.3: |
CCCGCTTACCGAGCACTGTCA |
|
| Jβ2.4: |
CCAGCTTACCCAGCACTGAGA |
|
| Jβ2.5: |
CGCGCACACCGAGCAC |
| TCRγ | Vγ1f: |
GGAAGGCCCCACAGCGTCTT |
|
| Vγ10: |
AGCATGGGTAAGACAAGCAA |
|
| Vγ9: |
CGGCACTGTCAGAAAGGAATC |
|
| Vγ11: |
CTTCCACTTCCACTTTGAAA |
|
| J γ1.1/2.1: |
TTACCAGGCGAAGTTACTATGAGC |
|
| J γ1.3/2.3: |
GTGTTGTTCCACTGCCAAAGAG |
| albumin | abm-F | GCT GTC ATC TCT TGT
GGG CTG T |
|
| abm-R | AAA CTC ATG GGA GCT
GGT T |
|
| abm-P | CCT GTC ATG CCC ACA
CAA ATC TCT CC |
qPCR was performed using TaqMan probe
detection of both genes at different time points during therapy,
and further quantification was carried out based on the expression
and proportion of both genes, reflecting the MRD level. The
positive standard for MRD was relative IGH/TCR expression of at
least 10:4 according to the European Study Group criteria (13).
Therapeutic regimen
All patients received standard induction
chemotherapy, i.e., doxorubicin 60 mg/m2 or idarubicin 12 mg/m2
administered intravenously (i.v.) for 3 days and cytarabine 200
mg/m2 in 24-h continuous i.v. infusion for 7 days. Dual induction
was administered if BM blasts decreased more than 50% but with
residue blasts exceeding 10% at 7 days after completion of first
induction. High-dose cytarabine was administered for eligible
patients if BM blasts were reduced to less than 50% at 7 days after
completion of initial induction. After complete remission (CR), 4–6
cycles of intermediate-dose cytarabine or high-dose cytarabine were
given for consolidation. Patients with suitable donors received
allogeneic hematopoietic stem cell transplantation.
Statistical analysis
Categorical variables, such as cluster of
differentiation (CD) and leukemic involvement of skin, gum, liver,
and spleen, were compared using the chi squared test and Fisher's
exact tests. Continuous variables, such as platelets, hemoglobin,
and white blood cell (WBC) count, were compared using the
Kruskal-Wallis test followed by a Nemenyi multiple comparisons post
hoc test. Pairwise comparisons of cfDNA vs. BM DNA and cfDNA vs. PB
DNA were conducted using McNemar's tests. Overall survival (OS) was
determined from the date of diagnosis to death or last follow-up.
The Kaplan-Meier estimator was used to estimate OS rates, and
log-rank tests were used for comparison. All statistical analysis
was performed using IBM SPSS v22.0 software (IBM Corp., Armonk, NY,
USA).
Results
Detection of monoclonal IGH and TCR
rearrangements at diagnosis
cfDNA was successfully isolated from all 235
patients, and no cfDNA was extracted from the normal control group
(Fig. 1A). In cfDNA samples, 94 cases
showed monoclonal IGH and/or TCR rearrangement (40%, 94/235); among
these cases, 73 showed monoclonal IGH rearrangement (31.1%,
73/235), 21 showed monoclonal TCR rearrangement (8.9%, 21/235), and
nine showed both monoclonal IGH and TCR rearrangement (Fig. 1B and C). Monoclonal rearrangement was
present at a significantly higher frequency in patients with AML-M4
and -M5 than other type AML (P=0.01).
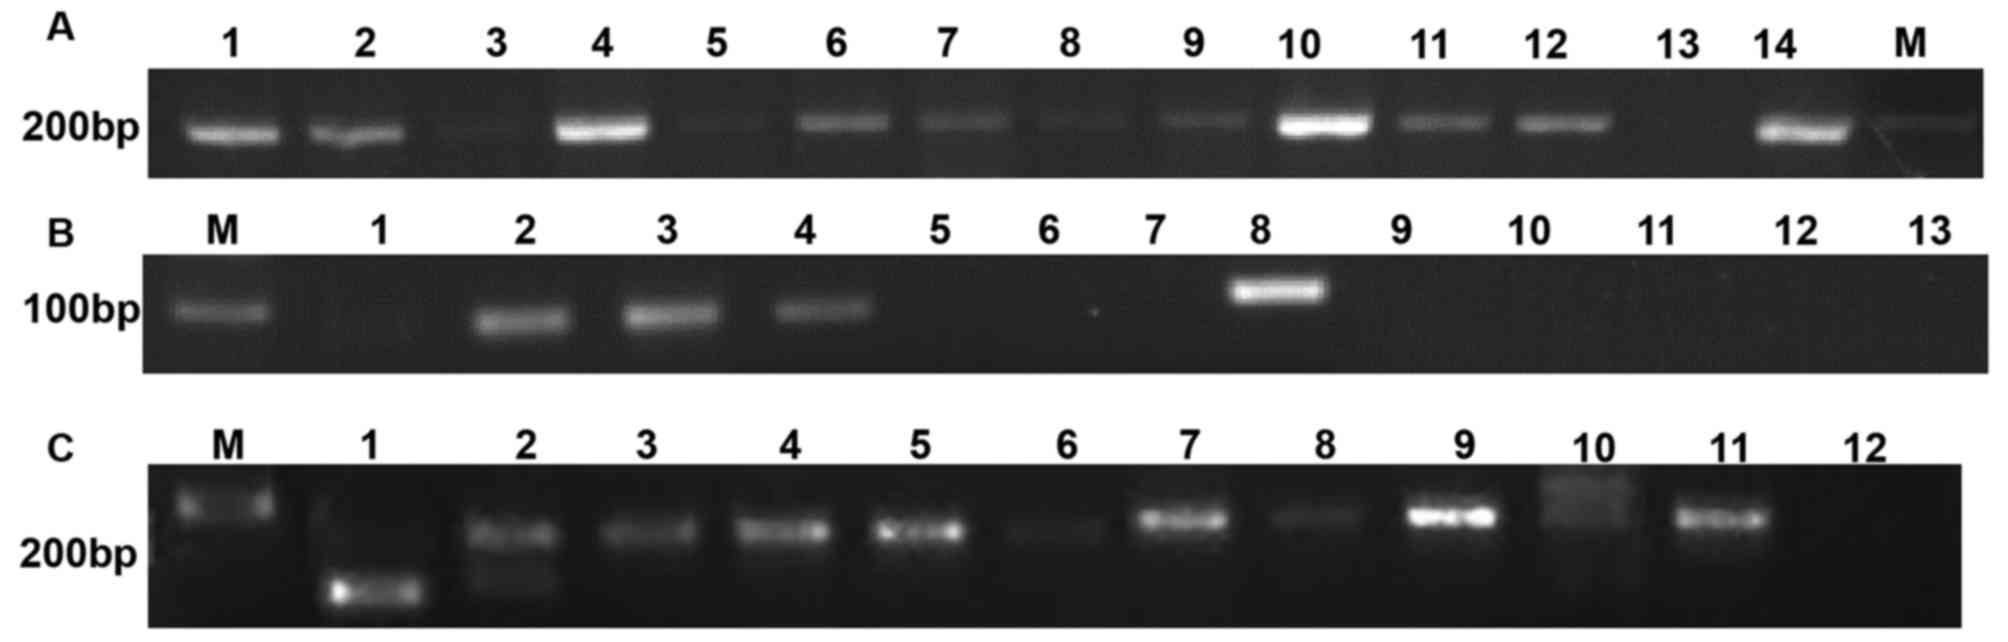 | Figure 1.Example of monoclonal IGH and TCR
rearrangement in cfDNA. (A) Detection of Globin DNA in the plasma
of patients with AML. Lane M, DNA marker. Lanes 1, 2, 4, 6–12, 14
PCR product of cfDNA from AML patients. Lanes 3, 5 and 13 PCR
product of cfDNA from normal control. (B) Detection of monoclonal
TCR rearrangement in cfDNA of patients with AML. Lane M, DNA
marker. Lane 1, negative result from AML patient. Lane 8, positive
control (Raji cells). Lanes 2–4, positive results from AML
patients. Lanes 5–7 and 9–13, negative results from AML patients.
(C) Detection of monoclonal IGH rearrangement in the cfDNA of
patients with AML. Lane M, DNA marker. Lanes 6 and 8, negative
result from AML patient. Lanes 1–5 and 9–11, positive result from
AML patients. Lane 12, negative control. Lane 7, positive control
(Jurkat cells). IGH, immunoglobulin heavy chain; TCR, T-cell
receptor; AML, acute myeloid leukemia; cfDNA, cell free DNA; PCR,
polymerase chain reaction. |
There were no differences between cfDNA and BM DNA
in terms of IGH (χ2=1.32, P=0.25) or TCR (χ2=0.45, P=0.5)
rearrangement, and there were no significant differences between
cfDNA and PB DNA in terms of IGH (χ2=1.32, P=0.25) or TCR (χ2=2.71,
P=0.1) rearrangement.
Clinical characteristics of patients
with AML having different genotypes
Next, we compared the clinical characteristics of
patients with IGH-negative (IGHneg)/TCR-negative (TCRneg),
IGH-positive (IGHpos) or TCR-positive (TCRpos), and IGHpos/TCRpos
genotypes. There were no significant differences in hemoglobin,
platelets, and other clinical characteristics such as gum
hypertrophy, lymphadenopathy, splenomegaly, and hepatomegaly,
across all three groups (Table I).
The median WBC counts were significantly different between the
three groups, ranging from 14.29×10⁹/l to a maximum of
213.23×10⁹/l. However, the increases in the percentages of PB
leukemic blasts and BM blasts were not statistically significant.
Serum lactate dehydrogenase (LDH) levels increased from 369 IU/l in
patients in the IGHneg/TCRneg group to 560 IU/l in patients in the
IGHpos or TCRpos group and reached a maximum in patients in the
IGHpos/TCRpos group (1725 IU/l, P=0.01). Only CD7, CD19, CD56, and
CD4 showed differential expression in the three groups, with
increased frequency observed in the IGHpos/TCRpos group. No
association between CD7, CD19, CD56 and CD4 expression on blast
cells and clinical outcomes was observed (data not shown).
Detection of monoclonal IGH and TCR
rearrangements in remission
Among 94 patients with monoclonal IGH and/or TCR
rearrangements, 44 exhibited abnormal cytogenetics; 5 patients had
t(8;21), 2 had inv(16), 7 had complex abnormality, 7 had del5(q31),
3 had −5, 6 had del7(q22), 4 had −7, 2 had -y, 1 had der(1;14) and
+1, 2 had t(8;16), 3 had t(6;11), and 3 had t(9;11). There were 6
patients for whom cytogenetic results could not be obtained as
unqualified samples, and the remaining 44 patients had normal
cytogenetic results. The molecular genetic results for these 94
patients were as follows: 12 patients carried the AML1-ETO fusion
gene, 3 carried the CBFβ-MHY11 fusion gene, 3 carried the MLL-AF6
fusion gene, 1 carried the CEBPA double mutation, 2 carried the
CEBPA single mutation, 13 carried the NPM1 mutation, 4 carried the
FLT3-ITD mutation, 4 carried the IDH2R140 mutation, 8 carried the
IDH2R170 mutation, 9 carried the DNMT3A mutation, 14 carried the
TET2 mutation, 3 carried the TP53 mutation, and 1 carried the
NRAS/RUNX1 mutation. Thirty-one patients showed normal results for
molecular genetic tests; for 9 patients, results could not be
obtained as the samples were unqualified. There were 21 low-risk,
40 intermediate-risk, and 33 high-risk patients according to ELN
category (13) based on the
cytogenetic and molecular genetic abnormalities detected.
After one to two courses of induction chemotherapy
79 patients achieved CR. Among these, 24 patients received
allo-HSCT and 55 patients received chemotherapy only. The donors
for patients who received allo-HSCT were as follows: One unrelated
matched donor, six related matched donors, and 17 related
HLA-haplotype-mismatched donors. The conditioning regimens and GVHD
prophylaxes were as previously reported, with minor modification
(we used short-term cyclophosphamide 600 mg/m2 on day +1, 400 mg/m2
on days +3, +5, +11 instead of methotrexate) (14). The median follow-up was 27 months and
the range was 7.5 to 60 months. There were 37 recorded relapses and
34 deaths. During follow up, 71 patients were negative for
monoclonal IGH and TCR rearrangements in PB DNA, BM DNA, and cfDNA
after 2–4 courses of consolidation chemotherapy, and eight patients
with continuous positive monoclonal rearrangements relapsed within
6–10 months. Thirty-two patients were continuously negative for
monoclonal IGH and TCR rearrangements during follow-up both from
cfDNA and BM cells, and were in continuous CR with negative MRD
confirmed by BM aspiration and flow cytometry. For the remaining 39
patients, monoclonal IGH or TCR rearrangements were positive both
in cfDNA and in BM DNA prior to clinical relapse (median 28 days
prior to overt clinical relapse, range: 15–59 days). There were 11
patients with extramedullary relapse who showed positive IGH/TCR
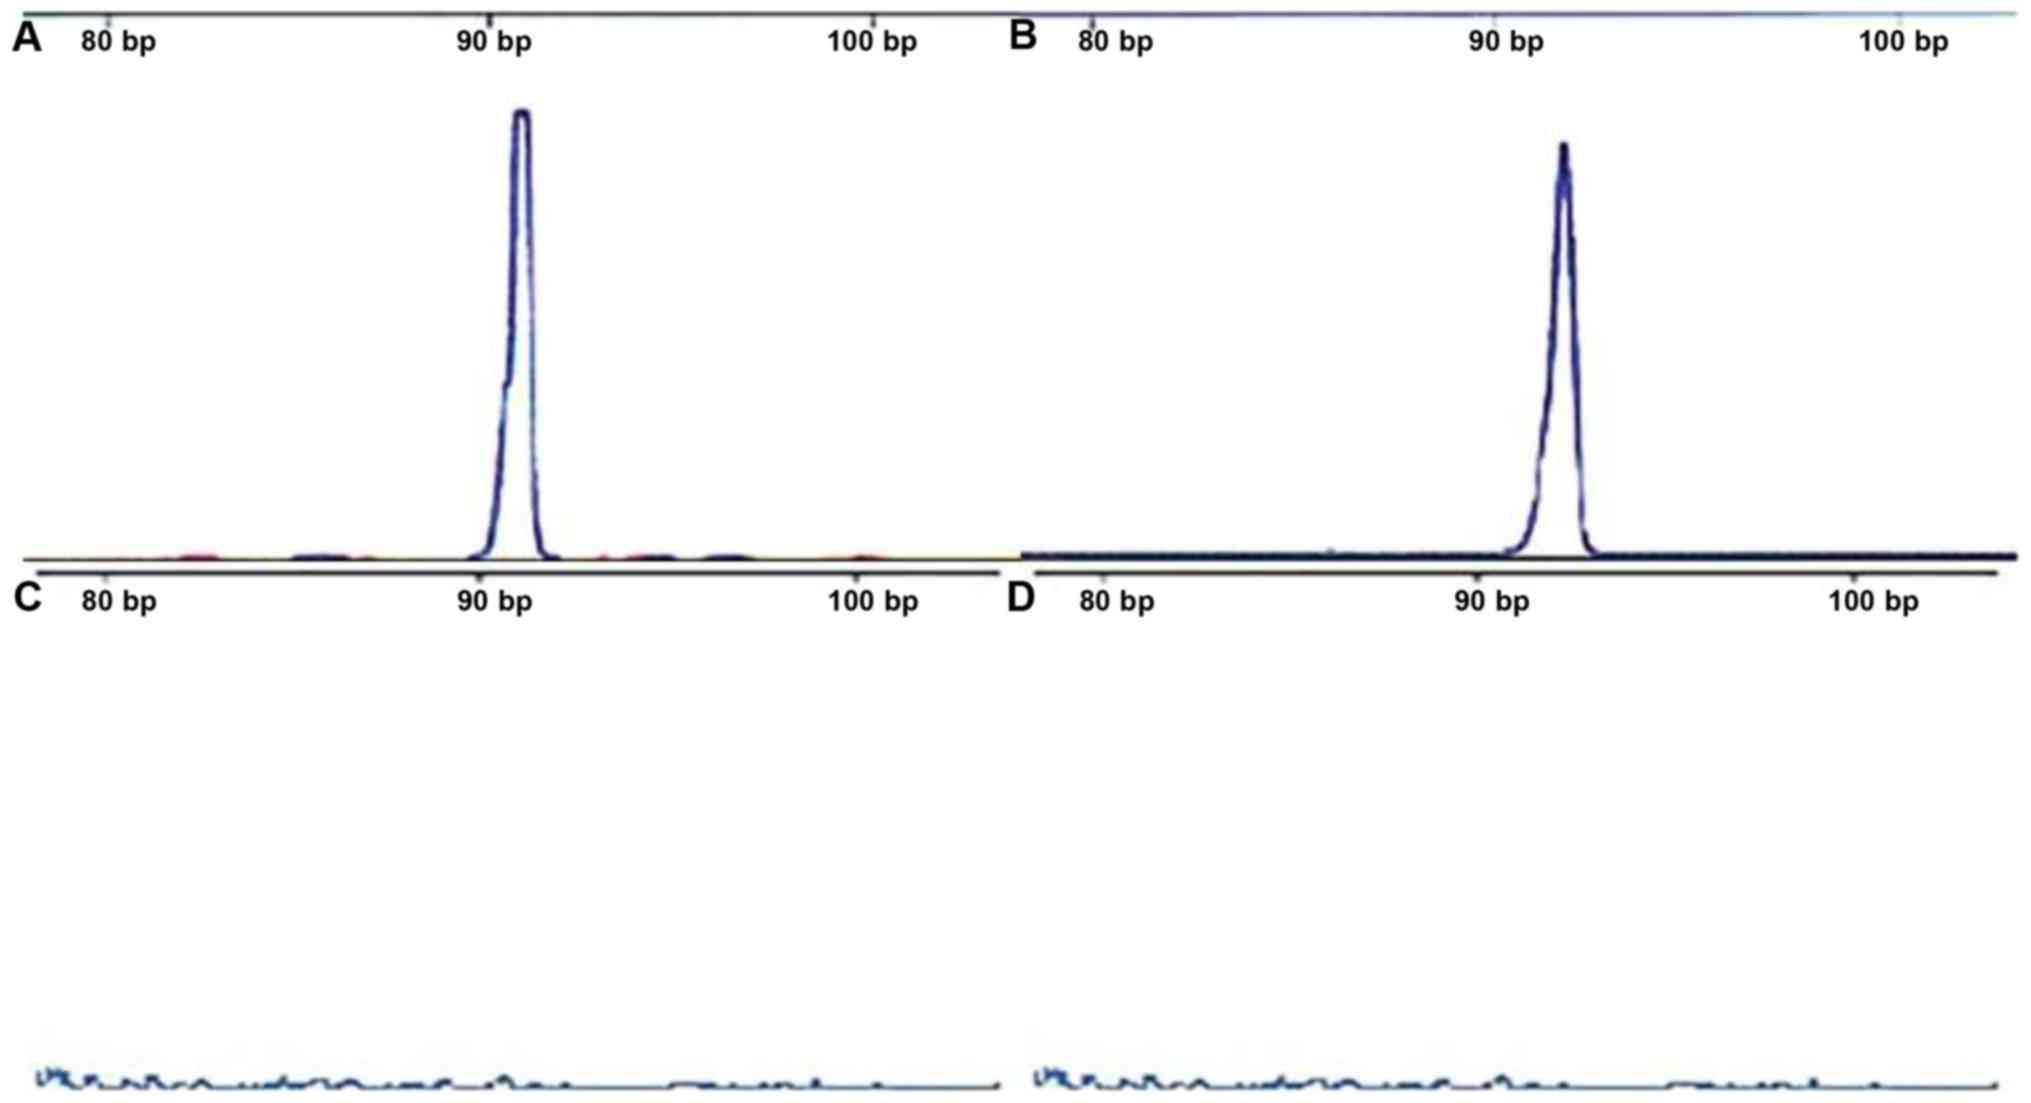
rearrangements in cfDNA but not in BM DNA or PB DNA (Fig. 2). The change occurred earlier in cfDNA
than in BM cells (median, 31 days; Fig.
3).
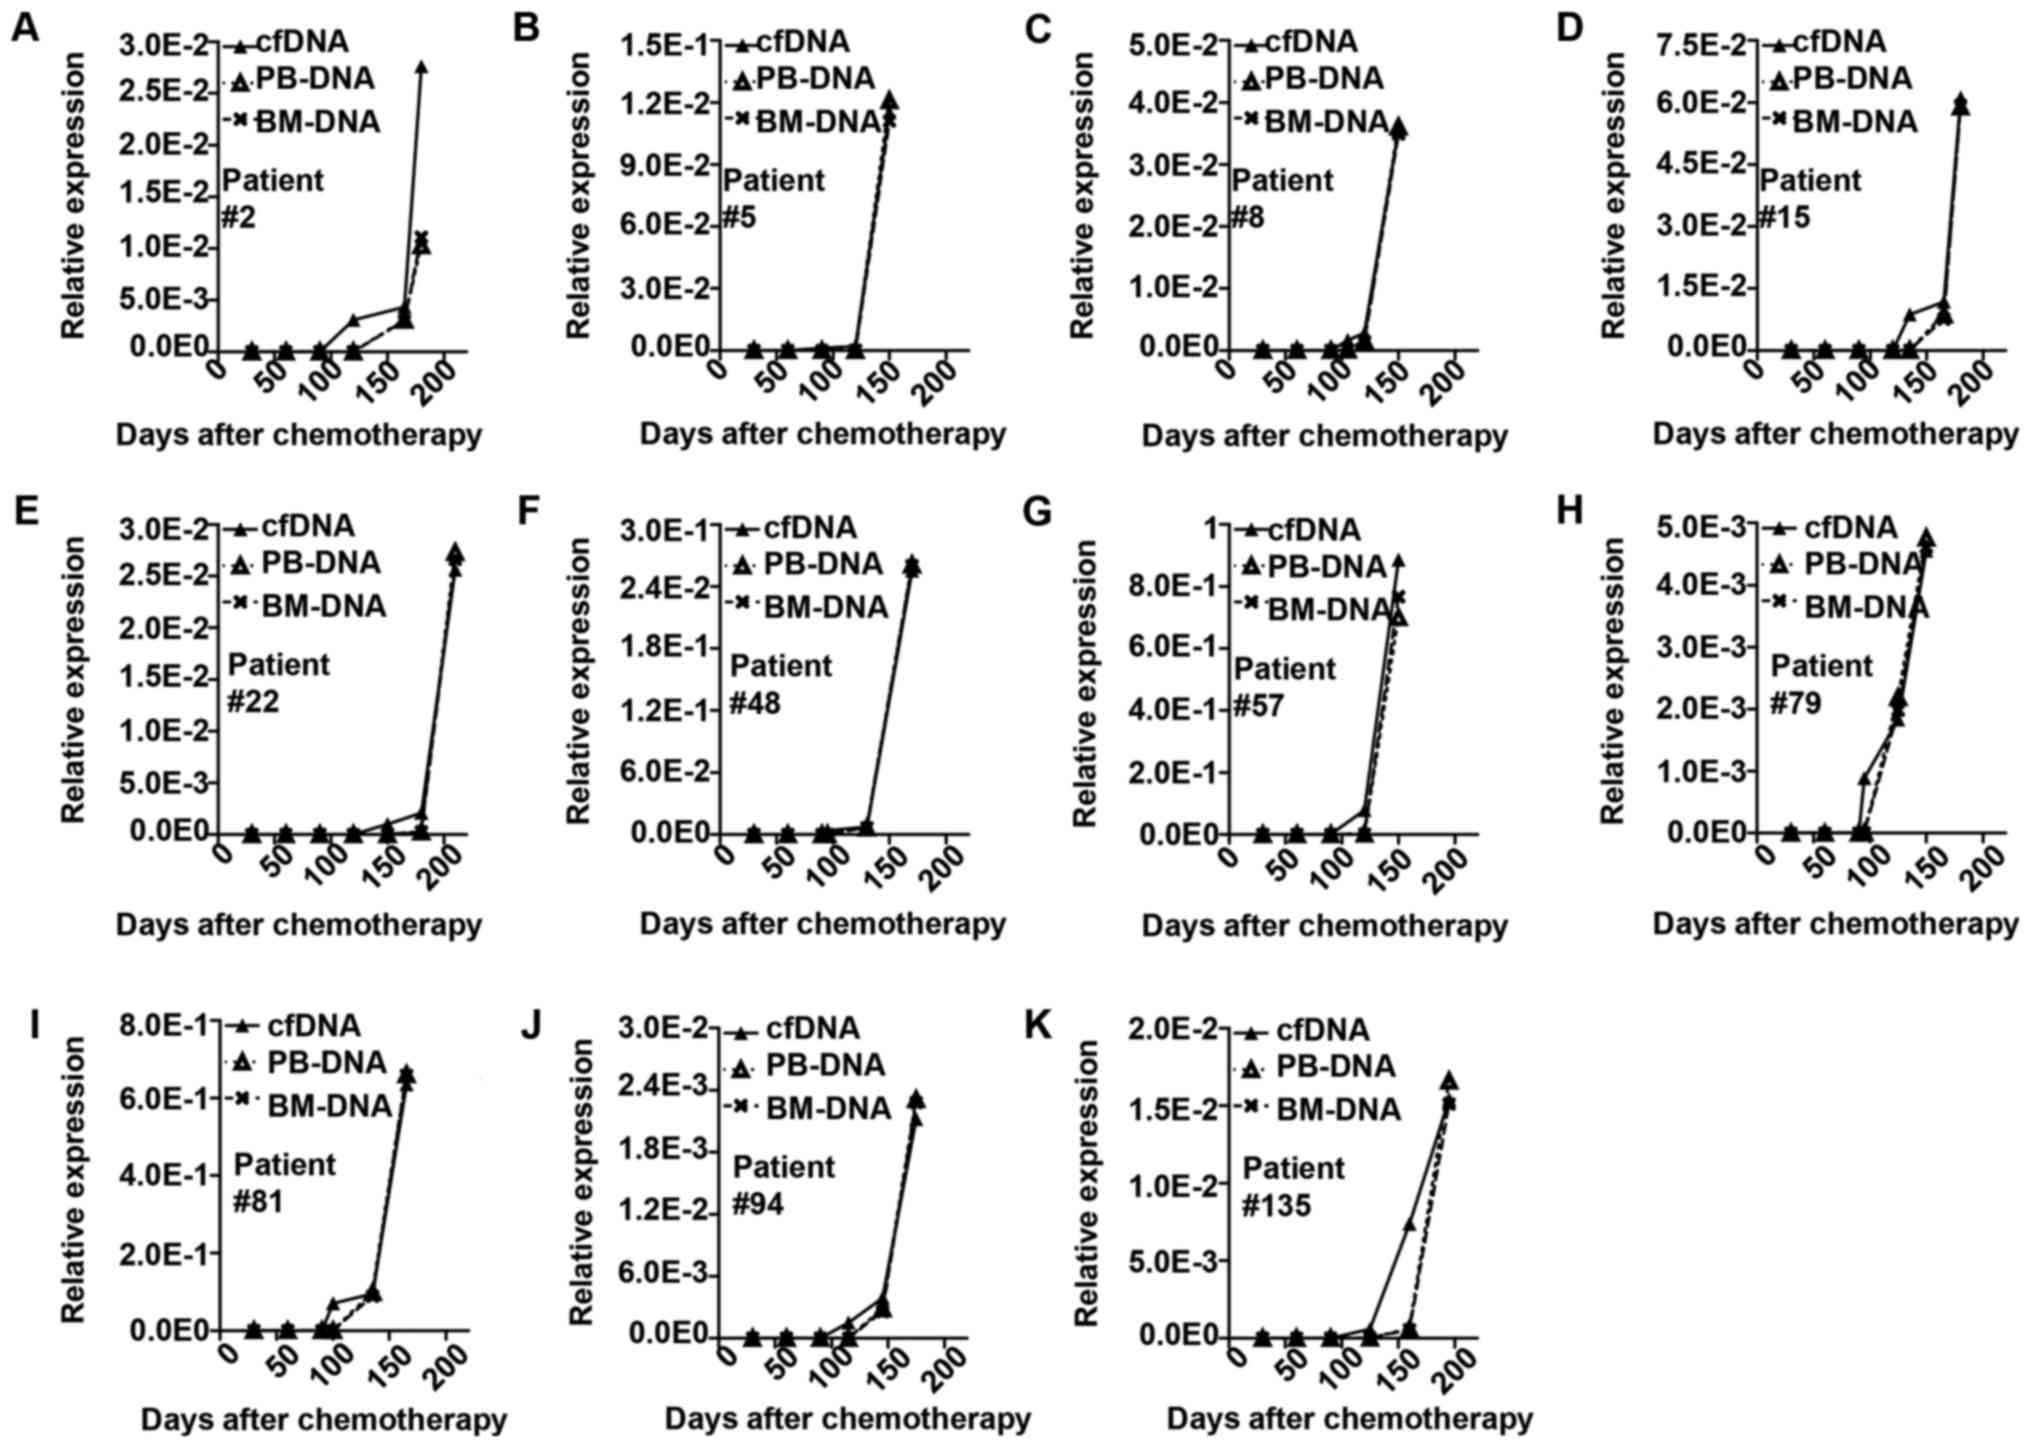 | Figure 3.Representative cases of minimal
residual disease monitored by monoclonal IGH or TCR rearrangement
in cfDNA, BM and PB. The solid line represents change in cfDNA. The
long dotted line represents change in BM. The short dotted line
represents change in PB. (A) Patient no. 2, monoclonal IGH
rearrangement in cfDNA increased at the 120 day after chemotherapy,
while in BM and PB it increased at day 165. The clinical relapse
occurred at day 180. (B) Patient no. 5 IGH in cfDNA at day 90, in
BM and PB day 120, clinical relapse day 150. (C) Patient no. 8 TCR
in cfDNA day 105, in BM and PB day 120, clinical relapse day 150.
(D) Patient no. 15 IGH in cfDNA day 135, in BM and PB day 165,
clinical relapse day 180. (E) Patient no. 22IGH in cfDNA day 150,
in BM and PB day 180, clinical relapse day 210. (F) Patient no. 48
IGH in cfDNA day 95, in BM and PB day 130, clinical relapse day
170. (G) Patient no. 57 IGH in cfDNA day 90, in BM and PB day 120,
clinical relapse day 150. (H) Patient no. 79 IGH in cfDNA day 95,
in BM and PB day 125, clinical relapse day 150. (I) Patient no. 81
IGH in cfDNA day 100, in BM and PB day 135, clinical relapse day
165. (J) Patient no. 94 IGH in cfDNA day 115, in BM and PB day 145,
clinical relapse day 175. (K) Patient no. 135 IGH in cfDNA day 125,
in BM and PB day 160, clinical relapse day 195. IGH, immunoglobulin
heavy chain; TCR, T-cell receptor; cfDNA, cell free DNA; BM, bone
marrow; PB, peripheral blood. |
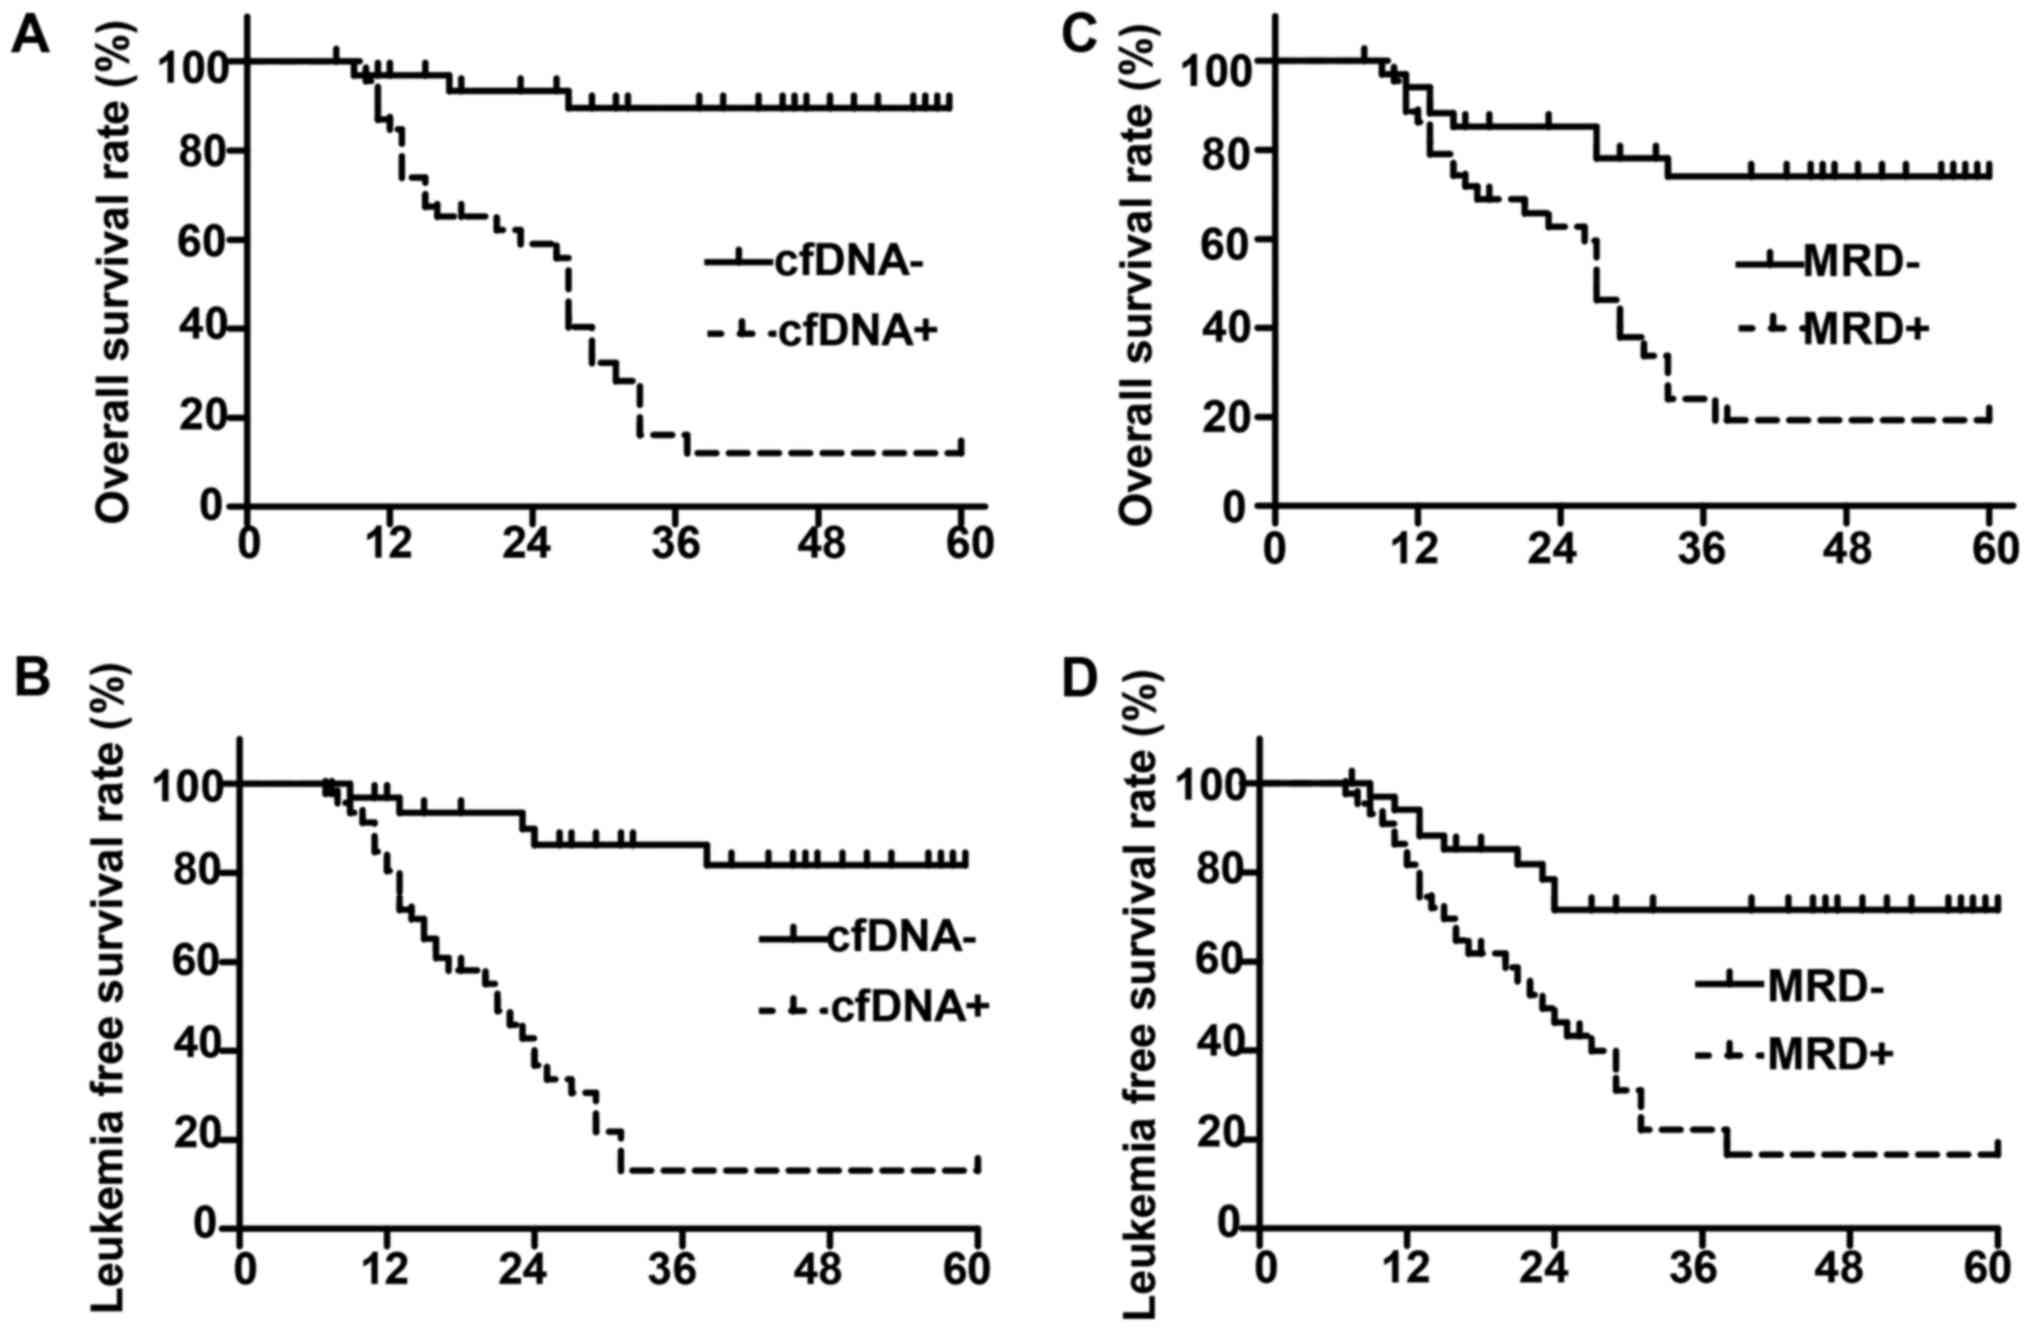
Prognostic impact of monoclonal IGH
and TCR rearrangement status in cfDNA on OS and LFS
For patients who achieved CR, we performed survival
analysis based on the monoclonal IGH and TCR rearrangement status
in cfDNA. We found that the monoclonal IGH and/or TCR rearrangement
status in cfDNA was in agreement with MRD status (Table III). And there were more negative
status in cfDNA been found in low risk patients, followed by
intermediate risk patients, and least in high risk patients
(Table III). We found that patients
with monoclonal IGH or TCR rearrangement in cfDNA at any time point
had worse outcomes, with a 21 months median LFS and 27 months
median OS, whereas patients with persistent negative monoclonal IGH
or TCR rearrangement showed significantly improved outcomes (median
LFS and OS not reached; P<0.01; Fig.
4A and B). The difference in survival based on monoclonal IGH
or TCR rearrangement was similar to that of MRD, as indicated by
flow cytometry analysis (Fig. 4C and
D).
| Table III.Association between cfDNA status and
MRD as determined by flow cytometry and ELN risk group based on
molecular genetic and cytogenetic alterations. |
Table III.
Association between cfDNA status and
MRD as determined by flow cytometry and ELN risk group based on
molecular genetic and cytogenetic alterations.
|
| MRD status n
(%) | ELN risk group n
(%) |
|---|
|
|
|
|
|---|
| cfDNA status | MRD- | MRD+ | Low risk | Intermediate
risk | High risk |
|---|
| cfDNA- | 23 (71.8) | 9
(28.2) | 14 (73.7) | 8
(38.1) | 10 (25.6) |
| cfDNA+ | 12 (25.5) | 35 (74.5) | 5
(26.3) | 13 (61.9) | 29 (74.4) |
Discussion
In the present study, we found that tumor-derived
DNA could be collected from the plasma of patients with AML whose
tumor cells were informative on PCR analysis. cfDNA cannot be
detected in healthy individuals (limit of detection <100 µg/ml)
(15). Some reports have described
the successful amplification of genomic or tumor-associated DNA
from fresh or archived plasma samples, which supports our
observations (16). Moreover, cfDNA
may be associated with highly proliferative tumor cells. Treatment
of patients with cytotoxic drugs is followed by rapid clearance of
DNA from the PB. These findings suggest that soluble tumor-derived
DNA can only be tested during specific disease stages and may be
highly predictive of resistance to treatment and impending relapse
(17). Degradation of clonal DNA by
nucleases in vitro was shown to be one cause of
false-negative PCR results. This technical drawback may be overcome
by adding a nuclease inhibitor such as ethylenediaminetetraacetic
acid (EDTA). Thus, the use of EDTA-anticoagulant tubes is
recommended.
PCR amplification of IGH and TCR rearrangement may
be helpful for diagnosing and predicting the prognosis of
hematologic malignancies. If DNA shows a distinct band with the
same electrophoretic mobility, the sample is defined as monoclonal.
Normal DNA and reactive hyperplastic DNA are polyclonal with
smeared bands (18). Recent studies
have reported that the positive ratios may be as high as 99% for
IGH and 94% for TCR using multiplex primers (19). However, the specific frequency of
antigen receptor gene rearrangement in AML is difficult to
calculate from previously reported data (20) because of the selection of specific AML
subtypes and the use of different experimental protocols with
markedly different sensitivities. Based on the experiences of our
group and others, we adopted a sensitive two-round amplification
method; touchdown PCR may also be performed for analysis of large
samples.
Our results confirmed that some patients with AML
harbor monoclonal IGH and TCR rearrangements; this phenomenon is
referred to as distortion of series or lineage promiscuity. There
are three explanations for this phenomenon: first, most scholars
believe that distortion may be related to pluripotent stem cells.
Cells with crossed rearrangement originate from pluripotent stem
cells; further, tumors may promote changes in stem cells, allowing
them to develop into myeloid cells. Therefore, based on morphology,
tumor cells still exhibit myeloid characteristics. However,
transient mixed gene expression is still observed (21). Second, tumor cells usually exhibit
disruption of normal proliferation and differentiation.
Hematopoietic stem cells in patients with hematological
malignancies may only exhibit gene clonal rearrangement during the
process of maturation to a specific lineage; however, these cells
do not successfully differentiate into the specific cell lineage,
resulting in functional disorders (22). Consequently, IGH and TCR monoclonal
rearrangement may represent markers for the monitoring of some
patients with AML, specifically those without recurrent genetic
abnormalities.
Cen et al (23), proposed that IGH and TCR
rearrangements rarely occur in M4 and M5 subtypes. In contrast,
Boeckx et al (24) suggested
that IGH and TCR rearrangements are irrelevant to FAB
classification. Our results showed that these rearrangements were
more frequent in M4 and M5 subtypes. However, additional
large-scale studies are needed. These above-described results
suggest that malignant clones tend to behave abnormally, providing
evidence for biological differences between cases lacking clonally
rearranged IGH and TCR genes. Importantly, we did not find any
healthy individuals positive for monoclonal rearrangements.
Patients with the IGHpos/TCRpos genotype showed far higher WBC
counts and serum LDH levels and exhibited more frequent occurrence
of lymphoid-associated markers such as CD7, CD19, and CD56. Their
disease-specific survival rates were also significantly lower.
These findings supported the poor prognoses of these patients.
Similarly, Qiu et al (25)
reported that IGH and TCR gene rearrangements were adverse factors
in patients with AML. Therefore, detection and monitoring of IGH
and TCR rearrangements are critical in patients with AML; cfDNA may
have applications in such monitoring procedures. The use of cfDNA
as a sample to detect IGH and TCR rearrangements is also a more
convenient and noninvasive method than the use of other types of
samples, and is expected to yield the same clinical information as
biopsy samples.
Furthermore, we found that gene rearrangements
identified using cfDNA were correlated with pathological results,
suggesting that the use of cfDNA as a sample enables high accuracy.
Importantly, IGH and TCR rearrangements were detected earlier in
cfDNA than in BM cells. In a total of 11 patients, significantly
increased IGH and TCR rearrangements were detected only in cfDNA,
but not in BM cell DNA, prior to clinical relapse. Moreover, the
relapsed patients who had increased IGH and TCR rearrangements in
BM cells prior to clinical relapse succumbed to their disease.
However, the elevated levels of monoclonal IGH or TCR rearrangement
could be detected earlier and more reliably using cfDNA than using
BM cells for the monitoring of MRD. These data suggest that plasma
is more enriched with leukemic cell nucleotides than with normal
nucleotides. BM cell aspirates almost always contain residual
normal cells in addition to leukemic cells, with variations
dependent on the stage of the disease. Unfortunately, it is
impossible to determine the minimum number of leukemic cells
required in the BM to yield positive plasma PCR results. We assumed
that even extramedullary leukemic cells provide nucleotides that
may be detected during cfDNA analysis. Data from studies of solid
tumors support the concept that plasma/serum samples are enriched
with tumor-specific cfDNA (26,27). This
enrichment is perhaps attributable to the high turnover of tumor
cells compared with that in normal tissues. Plasma samples from
patients with leukemia may be more enriched with leukemia-specific
cfDNA than those from patients with solid tumors, as the cells in
the former have greater contact with circulating blood.
Furthermore, monitoring cfDNA may be more important for predicting
leukemic extramedullary relapse than BM relapse. The extramedullar
tissues or organs may show evidence of relapse, while the BM still
shows CR. Extramedullary relapse is common in the central nervous
system, reproductive system, and skin infiltrations such as green
tumors, and can exist alone, but often predicts overall leukemia
recurrence. Treatment of the impending relapse should be initiated
in advance, if possible. Overall there was no difference between
cfDNA and BM in terms of predicting an upcoming relapse when
analyzing remission samples. At present, the methods usually used
to isolate bone marrow mononuclear cells (BMNCs) are density
gradient centrifugation, flow cytometry and immunomagnetic beads.
The purity of BMNCs was higher using immunomagnetic beads or flow
cytometry than density gradient centrifugation but with much higher
cost. We used Ficoll density gradient centrifugation to concentrate
BMNC with lower cost, and then used qPCR for amplification in order
to assure the sensitivity and specificity. And the other advantage
of using cfDNA for MRD detection compared with MFC is that the
sampling procedure for cfDNA is simpler than flow cytometry since
we need only blood to extract cfDNA while we need BM for flow
cytometry. As shown in our results for patients with solitary
extramedullary relapse the cfDNA is superior compared to flow
cytometry.
There are some limitations of our study. First with
much larger sample size the association of monoclonal IGH and/or
TCR rearrangement and CD markers of blast and cytogenetics and
molecular abnormalities would be clearer; second using Ficoll
density gradient centrifugation may lead to contamination by
lymphocytes which may cause false positive result due to oligo
clones of reactive lymphocytes, hopefully a repeated test would
lower the risk; last bias would be limited to the minimum with a
clinical trial cohort.
In conclusion, the use of circulating tumor DNA may
provide a useful, noninvasive approach for the detection of tumor
cells that secrete DNA. In hematologic malignancies, particularly
leukemia, tumor cells frequently circulate in the blood; this
enables the direct examination of blood cells for the presence of
molecular markers at the DNA/RNA level or aberrant protein
expression. Our findings suggest that analysis of circulating
plasma DNA may be useful in cases in which PB cellular analysis is
negative and the BM is positive for the disease.
Acknowledgements
The authors would like to thank Professor Yongqian
Jia (Department of Hematology, West China Hospital, Chengdu, China)
for the gift of several cell lines (Raji and Jurkat) and DNA
probes.
Funding
No funding was received.
Availability of data and material
The datasets used and/or analyzed during the present
study are available from the corresponding author on reasonable
request.
Authors' contributions
LZ and TJ conceived the study and wrote the
manuscript. LZ and YXL performed the majority of the experiments.
TJ, JC and XBH collected and analyzed the clinical data. YXL, JC
and XBH critically revised the manuscript.
Ethics approval and consent to
participate
The present study was approved by the Ethics
Committee of Sichuan Academy of Medical Science and Sichuan
Provincial Peoples' Hospital (Sichuan, China). All patients
provided written informed consent prior to their inclusion within
the study.
Consent for publication
Not applicable.
Competing interests
The authors declare that they have no competing
interests.
Glossary
Abbreviations
Abbreviations:
|
MRD
|
minimal residual disease
|
|
IDAC
|
intermediate-dose cytarabine
|
|
HDAC
|
high dose cytarabine
|
|
AML
|
acute myeloid leukemia
|
|
IHG
|
immunoglobulin heavy chain
|
|
TCR
|
T-cell receptor
|
|
PB
|
peripheral blood
|
|
BM
|
bone marrow
|
|
CD
|
cluster of differentiation
|
|
cfDNA
|
circulating tumor DNA
|
|
DSS
|
disease-specific survival
|
References
|
1
|
Leon SA, Shapiro B, Sklaroff DM and Yaros
MJ: Free DNA in the serum of cancer patients and the effect of
therapy. Cancer Res. 37:646–650. 1977.PubMed/NCBI
|
|
2
|
Li L, Choi JY, Lee KM, Sung H, Park SK,
Oze I, Pan KF, You WC, Chen YX, Fang JY, et al: DNA methylation in
peripheral blood: A potential biomarker for cancer molecular
epidemiology. J Epidemiol. 22:384–394. 2012. View Article : Google Scholar : PubMed/NCBI
|
|
3
|
Aung KL, Board RE, Ellison G, Donald E,
Ward T, Clack G, Ranson M, Hughes A, Newman W and Dive C: Current
status and future potential of somatic mutation testing from
circulating free DNA in patients with solid tumours. Hugo J.
4:11–21. 2010. View Article : Google Scholar : PubMed/NCBI
|
|
4
|
Elshimali YI, Khaddour H, Sarkissyan M, Wu
Y and Vadgama JV: The clinical utilization of circulating cell free
DNA (CCFDNA) in blood of cancer patients. Int J Mol Sci.
14:18925–18958. 2013. View Article : Google Scholar : PubMed/NCBI
|
|
5
|
Vedula RS and Lindsley RC: Measurement of
residual disease in acute myeloid leukemia. Curr Hematol Malig Rep.
12:574–581. 2017. View Article : Google Scholar : PubMed/NCBI
|
|
6
|
Hourigan CS, Gale RP, Gormley NJ,
Ossenkoppele GJ and Walter RB: Measurable residual disease testing
in acute myeloid leukaemia. Leukemia. 31:1482–1490. 2017.
View Article : Google Scholar : PubMed/NCBI
|
|
7
|
Venditti A, Del Poeta G, Buccisano F,
Tamburini A, Cox-Froncillo MC, Aronica G, Bruno A, Del Moro B,
Epiceno AM, Battaglia A, et al: Prognostic relevance of the
expression of Tdt and CD7 in 335 cases of acute myeloid leukemia.
Leukemia. 12:1056–1063. 1998. View Article : Google Scholar : PubMed/NCBI
|
|
8
|
Kyoda K, Nakamura S, Matano S, Ohtake S
and Matsuda T: Prognostic significance of immunoglobulin heavy
chain gene rearrangement in patients with acute myelogenous
leukemia. Leukemia. 11:803–806. 1997. View Article : Google Scholar : PubMed/NCBI
|
|
9
|
Yen CC, Liu JH, Wang WS, Chiou TJ, Fan FS
and Chen PM: Prognostic significance of immunoglobulin and T cell
receptor gene rearrangements in patients with acute myeloid
leukemia: Taiwan experience. Leuk Lymphoma. 35:179–187. 1999.
View Article : Google Scholar : PubMed/NCBI
|
|
10
|
Kwok S and Higuchi R: Avoiding false
positives with PCR. Nature. 339:237–238. 1989. View Article : Google Scholar : PubMed/NCBI
|
|
11
|
Kosari F, Shishehbor F, Saffar H and
Sadeghipour A: PCR-based clonality analysis in diffuse large B-cell
lymphoma using BIOMED-2 primers of IgH (FR3) on formalin-fixed
paraffin-embedded tissue. Arch Iran Med. 16:526–529.
2013.PubMed/NCBI
|
|
12
|
van der Velden VH, Cazzaniga G, Schrauder
A, Hancock J, Bader P, Panzer-Grumayer ER, Flohr T, Sutton R, Cave
H, Madsen HO, et al: Analysis of minimal residual disease by Ig/TCR
gene rearrangements: Guidelines for interpretation of real-time
quantitative PCR data. Leukemia. 21:604–611. 2007. View Article : Google Scholar : PubMed/NCBI
|
|
13
|
Döhner H, Weisdorf DJ and Bloomfield CD:
Acute myeloid leukemia. N Engl J Med. 373:1136–1152. 2015.
View Article : Google Scholar : PubMed/NCBI
|
|
14
|
Wang Y, Liu QF, Xu LP, Liu KY, Zhang XH,
Ma X, Fan ZP, Wu DP and Huang XJ: Haploidentical vs
identical-sibling transplant for AML in remission: A multicenter,
prospective study. Blood. 125:3956–3962. 2015. View Article : Google Scholar : PubMed/NCBI
|
|
15
|
Kuhlmann JD, Schwarzenbach H, Wimberger P,
Poetsch M, Kimmig R and Kasimir-Bauer S: LOH at 6q and 10q in
fractionated circulating DNA of ovarian cancer patients is
predictive for tumor cell spread and overall survival. BMC Cancer.
12:3252012. View Article : Google Scholar : PubMed/NCBI
|
|
16
|
Salvianti F, Pinzani P, Verderio P,
Ciniselli CM, Massi D, De Giorgi V, Grazzini M, Pazzagli M and
Orlando C: Multiparametric analysis of cell-free DNA in melanoma
patients. PLoS One. 7:e498432012. View Article : Google Scholar : PubMed/NCBI
|
|
17
|
Mussolin L, Burnelli R, Pillon M, Carraro
E, Farruggia P, Todesco A, Mascarin M and Rosolen A: Plasma
cell-free DNA in paediatric lymphomas. J Cancer. 4:323–329. 2013.
View Article : Google Scholar : PubMed/NCBI
|
|
18
|
Poopak B, Saki N, Purfatholah AA,
Najmabadi H, Mortazavi Y, Arzanian MT, Khosravipour G, Haghnejad F,
Salari F and Shahjahani M: Pattern of immunoglobulin and T-cell
receptor-δ/γ gene rearrangements in Iranian children with
B-precursor acute lymphoblastic leukemia. Hematology. 19:259–266.
2014. View Article : Google Scholar : PubMed/NCBI
|
|
19
|
Kim Y, Choi YD, Choi C and Nam JH:
Diagnostic utility of a clonality test for lymphoproliferative
diseases in koreans using the BIOMED-2 PCR assay. Korean J Pathol.
47:458–465. 2013. View Article : Google Scholar : PubMed/NCBI
|
|
20
|
Garcia-Castillo H, Leal-Ugarte E, Lazareno
Ortiz PC, Barrera-Chairez E, Rosales-Garcia VH and Barros-Núñez P:
Detection of monoclonal IGH rearrangements in circulating cells
from healthy first-degree relatives of patients with multiple
myeloma. Med Oncol. 31:9002014. View Article : Google Scholar : PubMed/NCBI
|
|
21
|
Huang J, Sun X, Gong X, He Z, Chen L, Qiu
X and Yin CC: Rearrangement and expression of the immunoglobulin
µ-chain gene in human myeloid cells. Cell Mol Immunol. 11:94–104.
2014. View Article : Google Scholar : PubMed/NCBI
|
|
22
|
Haslina Noor MN, Marini R, Rosnah B,
Shafini MY, Haslindawani Wan WM, Nazri Mohd H, Salamah G, Hasnan J
and Rosline H: Immunoglobulin heavy chain gene rearrangement in non
b-cell haematological malignancies. West Indian Med J. 62:701–704.
2013.PubMed/NCBI
|
|
23
|
Cen L, Jiang Y, Chen T, Zhang Y and Zhou
M: Clinical feature and cytogenetic analysis of 80 patients with
acute monocytic leukemia. Zhonghua Yi Xue Yi Chuan Xue Za Zhi.
31:206–209. 2014.(In Chinese). PubMed/NCBI
|
|
24
|
Boeckx N, Willemse MJ, Szczepanski T, van
der Velden VH, Langerak AW, Vandekerckhove P and van Dongen JJ:
Fusion gene transcripts and Ig/TCR gene rearrangements are
complementary but infrequent targets for PCR-based detection of
minimal residual disease in acute myeloid leukemia. Leukemia.
16:368–375. 2002. View Article : Google Scholar : PubMed/NCBI
|
|
25
|
Qiu X, Sun X, He Z, Huang J, Hu F, Chen L,
Lin P, You MJ, Medeiros LJ and Yin CC: Immunoglobulin gamma heavy
chain gene with somatic hypermutation is frequently expressed in
acute myeloid leukemia. Leukemia. 27:92–99. 2013. View Article : Google Scholar : PubMed/NCBI
|
|
26
|
Cilloni D, Renneville A, Hermitte F, Hills
RK, Daly S, Jovanovic JV, Gottardi E, Fava M, Schnittger S, Weiss
T, et al: Real-time quantitative polymerase chain reaction
detection of minimal residual disease by standardized WT1 assay to
enhance risk stratification in acute myeloid leukemia: A European
LeukemiaNet study. J Clin Onco. 27:5195–5201. 2009. View Article : Google Scholar
|
|
27
|
Gianfaldoni G, Mannelli F, Ponziani V,
Longo G, Bencini S, Bosi A and Vannucchi AM: Early reduction of WT1
transcripts during induction chemotherapy predicts for longer
disease free and overall survival in acute myeloid leukemia.
Haematologica. 95:833–836. 2010. View Article : Google Scholar : PubMed/NCBI
|