Introduction
Gastrointestinal stromal tumors (GISTs) are the most
frequently observed intra-abdominal sarcomas and occur primarily
from the gastrointestinal tract or less commonly from the mesentery
and retroperitoneum (1–4). The majority of cases are characterized
by an activated mutation of the receptor tyrosine kinase, KIT
(5), or platelet-derived growth
factor receptor α (6). Patients with
advanced GISTs were successfully treated with imatinib mesylate, a
potent tyrosine kinase inhibitor (TKI), with a median overall
survival period of 5–6 years. However, acquired resistance mainly
resulting from secondary mutation inevitably developed within 2–3
years after treatment (7,8). Salvage TKIs, including sunitinib maleate
and regorafenib, yielded less satisfactory results (9,10).
Therefore, novel biomarkers or treatment targets for TKI-refractory
cases are required.
Genes that regulate cell cycle have a crucial role
in predicting a prognosis for soft tissue sarcomas (11,12). By
reanalyzing available expression profiling data on GISTs (13), our group has previously identified
gene sets, including the cell cycle process or its regulation, that
were strongly associated with the risk of recurrence. Aurora kinase
A (AURKA) was identified as an independent poor prognostic marker
for GIST recurrence (14). A
subsequent study by the authors confirmed that AURKA may also serve
as an independent unfavorable marker for predicting disease
progression or mortality from advanced GISTs and as a potential
treatment target for GISTs (15). The
aforementioned studies have implicated the crucial role of genes
that regulate cell cycle in sarcomas and GISTs. In the present
study, the prognostic effect of genes involved in cell cycle
regulation in GISTs was examined.
Patients and methods
Bioinformatic analysis
In a previous study by the authors (14), using gene set enrichment analysis
(GSEA; downloaded from http://www.broadinstitute.org/gsea/index.jsp), 32
cases in Gene Expression Omnibus dataset GSE8167, previously
reported by Yamaguchi et al (13), were classified into two risk groups
with distinct recurrence-free survival (RFS) and expression
profiles according to the modified criteria of Yen et al
(14) from the Armed Forces Institute
of Pathology (AFIP). Of the 715 Gene Ontology (GO) gene sets, which
exhibited differential expression between two risk groups, 316 were
upregulated in the high-risk phenotype. To identify significant
genes and pathways in these gene sets, leading edge analysis (LEA)
was used in GSEA to examine genes in the leading edge subsets of
the top 10 enriched gene sets (14).
It was hypothesized that genes that appear in multiple subsets are
more likely to be of interest than those that appear in only one
subset. The obtained gene list was uploaded to the Pathway
Interaction Database (PID; http://wiki.nci.nih.gov/pages/viewpage.action?pageId=315491760)
for analyzing the distribution of the molecules within predefined
pathways. The query uses a hypergeometric distribution, which
models the probability of observing k genes from a cluster of n
genes (network frequency) by chance in a pathway or biological
process category containing m genes from a total genome size of N
genes (genome frequency), to compute the probability that each
pathway in the database is hit by molecules in the list. It then
returns a list of pathways ordered by P-value, which indicates the
probability that the specific pathway is enriched by chance
(16). The expression level of each
individual probe was obtained using Z-score transformation. For
genes encoded by more than one probe, average Z-score values were
used for comparison. The differences among the risk groups were
subsequently compared using the t-test.
Tumor samples for immunohistochemistry
study
This study is a retrospective study. A total of 141
patients who received the diagnosis of GIST between 1989 and 2008
at Chang Gung Memorial Hospital (Taoyuan, Taiwan) were enrolled for
immunohistochemistry (IHC) study. These cases were reported
previously (14); they were patients
with localized GIST who had received surgical excision only with no
adjuvant imatinib therapy, had formalin-fixed paraffin-embedded
tissues available for IHC study and were regularly followed up with
appropriate radiological imaging evaluations at Chang Gung Memorial
Hospital. The protocols for tumor sample collection and clinical
record review were approved by the Institutional Review Board of
Chang Gung Memorial Hospital (IRB no. 98-0352B), and all patients
had provided informed consent for the use of their tissues and
clinical data in research. All identifying information of
individual patient was removed.
IHC staining of cell cycle regulation
genes in GIST
A 4-µm section of each specimen was stained for
selected proteins. Primary antibodies used in the present study
were anti-Aurora (catalog no. ANB100-212; 1:1,500) and
anti-polo-like kinase 1 (PLK1; catalog no. NBP1-02851; 1:100)
antibodies from Novus Biologicals, (LLC, Littleton, CO, USA) as
well as anti-cell division cycle 25C (CDC25C; catalog no. ab66235;
1:100), anti-budding uninhibited by benzimidazoles (BUB1; catalog
no. ab4636; 1:100), and anti-targeting protein for Xklp2 (TPX2;
catalog no. ab32795; 1:1,000) antibodies from Abcam, (Cambridge,
UK). The antibodies were diluted as suggested and added to the
slides, which were incubated overnight at 4°C. The slides were then
washed three times for 5 min each in a mixture of tris-buffered
saline and Polysorbate 20 (the mixture is referred to as ‘TBST’
hereafter) prior to visualization using the LSAB2 system,
Peroxidase (K0675; DAKO A/S). The control slides were incubated
with the secondary antibody alone [also contained within the LSAB2
system, Peroxidase (K0675; DAKO A/S]. After 3 TBST washes for 5 min
for each wash, the slides were mounted and blindly analyzed under
microscopy by the authors. Immunostaining was scored.
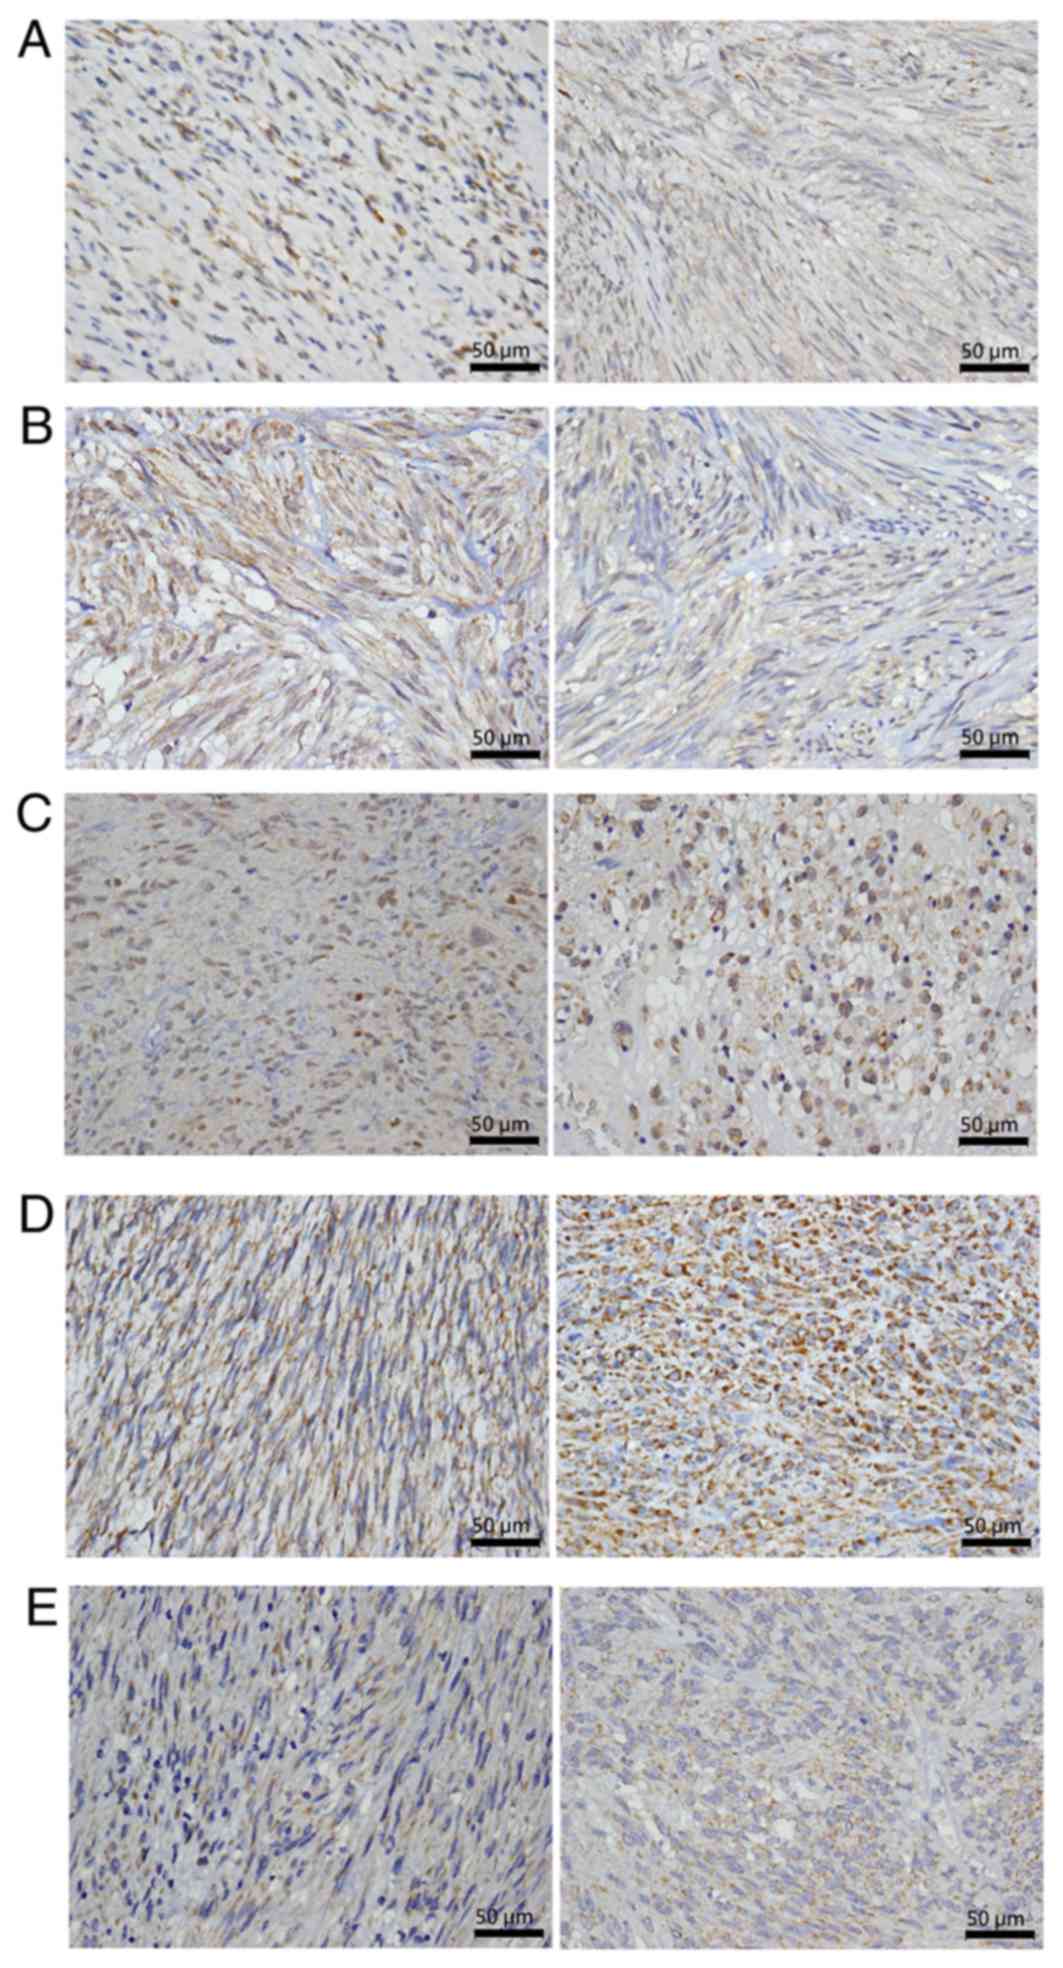
For the assessment of IHC staining, the percentage
of stained target cells was evaluated in 10 optical microscope
fields per tissue section (magnification, ×400) and the average
staining percentage was calculated. For BUB1 and CDC25C, only
nuclear staining was considered positive. Staining intensity was
scored as 1 (mild), 2 (moderate), or 3 (intense). H-scores were
calculated as the percentage of positive staining (0–100%) × the
corresponding staining intensity (0–3) (17). The specimens with low and high
H-scores were classified as having low and high IHC expression,
respectively (cutoff value of H-scores: AURKA=60, TPX2=40, BUB1=50,
CDC25C=50, and PLK1=60; Fig. 1).
Statistical and survival analysis
The associations between clinicopathological
variables and IHC staining patterns of cell cycle regulation genes
were analyzed using the χ2 test or Fisher's exact test
for univariate analysis and using multinomial logistic regression
for multivariate analysis. RFS was measured from the date of
surgery to the date of tumor recurrence documentation. Survival
analysis was estimated using the Kaplan-Meier method, and the
log-rank test was conducted for survival curve comparison. The
prognostic effect of clinicopathological factors and the IHC
staining of genes that regulate cell cycle was determined by
univariate and multivariate (stepwise forward conditional method)
Cox regression analysis. In two-sided tests, P<0.05 was
considered statistically significant. SPSS software (version 10.0;
SPSS, Chicago, IL, USA) was used for all statistical analyses.
Results
Bioinformatic analysis identifies 5
critical genes and their expression levels are associated with risk
groups and survival
Among the top 10 GO gene sets (14), 15 genes were found in ≥9 of the sets
(Table I). These 15 genes were
uploaded to the PID, and 6 significant pathways were predicted.
Among these pathways, ‘PLK1 signaling events’ was the most
significant. A total of 5 genes-AURKA, PLK1, CDC25C, BUB1, and
TPX2- were present in this pathway (Table II). These 5 genes were also
identified in ≥8 GO gene sets that were associated with cell cycle
regulation identified by gene set enrichment analysis (GESA)
(Table I). Therefore, these 5 genes
were selected for further study.
 | Table I.Identification of 15 genes by GSEA
and the presence of these genes in the top 10 enriched gene
sets. |
Table I.
Identification of 15 genes by GSEA
and the presence of these genes in the top 10 enriched gene
sets.
|
| KNTC1 | TTK | NEK2 | BUB1a | BIRC5 | AURKAa | MAD2L1 | ZWINT | ANLN | PLK1a | KIF2C | KIF11 | KIF15 | TPX2a | CDC25Ca |
|---|
| Mitosis | V | V | V | V | V | V | V | V | V | V | V | V | V | V | V |
| Cell cycle
process | V | V | V | V | V | V | V | V | V | V | V | V | V | V | V |
| Mitotic cell
cycle | V | V | V | V | V | V | V | V | V | V | V | V | V | V | V |
| M phase of mitotic
cell cycle | V | V | V | V | V | V | V | V | V | V | V | V | V | V | V |
| Cell cycle
phase | V | V | V | V | V | V | V | V | V | V | V | V | V | V | V |
| M phase | V | V | V | V | V | V | V | V | V | V | V | V | V | V | V |
| Microtubule
cytoskeleton | V | V | V | V | V | V |
|
|
| V | V | V | V | V |
|
| Cell cycle GO
0007049 | V | V | V | V | V | V | V | V | V | V | V | V | V | V | V |
| Regulation of
mitosis | V | V | V | V | V |
| V | V | V |
|
|
| |
| V |
| Non-membrane bound
organelle | V | V | V | V | V | V | V | V | V | V | V | V | V | V | V |
| Table II.Pathways identified by the Pathway
Interaction Database. |
Table II.
Pathways identified by the Pathway
Interaction Database.
| Pathway name | Biomolecules in the
group | P-value |
|---|
| PLK1 signaling
events | AURKA, BUB1,
CDC25C, PLK1 and TPX2 |
2.16×10⁻⁹a |
| Aurora B
signaling | AURKA, BIRC5, BUB1
and KIF2C |
2.05×10⁻⁷a |
| Aurora A
signaling | AURKA, BIRC5 and
TPX2 |
8.55×10⁻⁶a |
| FOXM1 transcription
factor network | BIRC5, NEK2 and
PLK1 |
2.16×10⁻⁵a |
| ATR signaling
pathway | CDC25C and
PLK1 |
0.00109a |
| p73 transcription
factor network | BUB1 and PLK1 |
0.00474a |
Differences in the expression levels of these 5
genes between the AFIP high-risk group and moderate- and low-risk
groups were verified. As indicated in Fig. 2, the expression levels of the 5 genes,
except for CDC25C, were significantly higher in the high-risk group
compared with the moderate- and low-risk groups. Cox regression
analysis revealed that patients with a high expression (Z score
>0) of AURKA, PLK1, CDC25C or TPX2 had significantly lower RFS
compared with those with low expression (Z score ≤0) of these 4
genes. The differences in survival between patients with different
expression levels of BUB1 were of borderline significance (P=0.082)
(Table III).
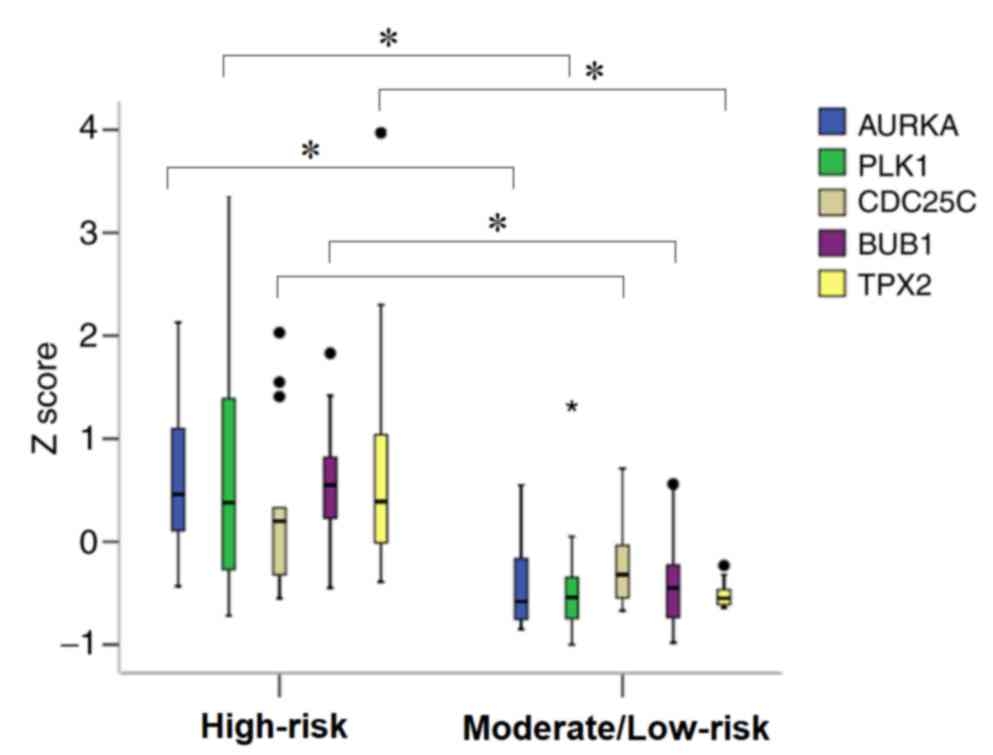 | Figure 2.Comparison of expression level
(indicated by Z scores) of 5 genes, AURKA, PLK1, CDC25C, BUB1 and
TPX2, between the AFIP high- and moderate-/low-risk groups in 32
gastrointestinal stromal tumors (GIST) cases in the Japanese cohort
using the t-test. With the exception of CDC25C, the expression
level of the other 4 genes were significantly higher in the
high-risk group compared with the moderate-/low-risk group.
*P<0.05. AFIP, Armed Forces Institute of Pathology; AURKA,
aurora kinase A; BUB1, budding uninhibited by benzimidazoles 1
homolog; CDC25C; cell division cycle 25C; PLK1, polo like kinase
1. |
| Table III.Univariate analysis of the prognostic
effect of expression level of the 5 genes on recurrence-free
survival. |
Table III.
Univariate analysis of the prognostic
effect of expression level of the 5 genes on recurrence-free
survival.
| Gene | Median survival,
months (95% CI) | HR | Univariate
analysis, 95% CI | P-value |
|---|
| AURKA |
|
|
|
|
|
Low | Not reached | 1 |
| 0.013a |
|
High | 56.000
(21.635–90.365) | 7.242 | 1.527–34.345 |
|
| PLK1 |
|
|
|
|
|
Low | Not reached | 1 |
| 0.006a |
|
High | 53.000
(10.278–95.722) | 8.727 | 1.847–41.221 |
|
| CDC25C |
|
|
|
|
|
Low | Not reached | 1 |
| 0.049a |
|
High | 53.000
(6.515–99.485) | 3.685 | 1.008–13.475 |
|
| BUB1 |
|
|
|
|
|
Low | Not reached | 1 |
| 0.082 |
|
High | 53.000
(7.269–98.731) | 112.965 |
0.549–23248.895 |
|
| TPX2 |
|
|
|
|
|
Low | Not reached | 1 |
| 0.001a |
|
High | 28.000
(16.500–39.500) | 14.204 | 2.994–67.390 |
|
Demographic and clinicopathological
characteristics of patients enrolled for IHC study
To validate the data from microarray analysis, the
expression of the 5 genes (AURKA, PLK1, CDC25C, BUB1 and TPX2) were
examined by using IHC in another group of patients with GIST. The
demographic data and clinicopathological features of the 141
patients are listed in Table IV. In
total, the group contained 74 men and 67 women with a mean age of
57.9 years (range, 22–89 years). The stomach constituted the most
common tumor sites, and the mean tumor size was 7 cm. Under the
AFIP criteria, ~35% of the patients were considered high risk.
| Table IV.Clinicopathological characteristics
of 141 patients with gastrointestinal stromal tumors. |
Table IV.
Clinicopathological characteristics
of 141 patients with gastrointestinal stromal tumors.
| Clinicopathological
features | Patients, n
(%) |
|---|
| Mean age (years,
mean ± SD) | 57.9±12.6 |
| Sex
(M:F) | 74:67 |
| Location |
|
|
Gastric | 83 (58.9) |
|
Non-gastric | 58 (41.1) |
| Tumor
size (cm, mean ± SD) | 7.06±4.93 |
| Mitotic count,
HPF |
|
|
<5/50 | 89 (63.1) |
|
5-10/50 | 16 (11.3) |
|
>10/50 | 36 (25.5) |
| AFIP risk |
|
|
None | 10 (7.1) |
| Very
low | 28 (19.9) |
|
Low | 27 (19.1) |
|
Moderate | 27 (19.1) |
|
High | 49 (34.8) |
| AURKA
immunostaining |
|
|
Low | 73 (51.8) |
|
High | 68 (48.2) |
| TPX2
immunostaining |
|
|
Low | 64 (67.4) |
|
High | 31 (32.6) |
| BUB1 nuclear
immunostaining |
|
|
Low | 64 (45.4) |
|
High | 77 (54.6) |
| CDC25C nuclear
immunostaining |
|
|
Low | 55 (45.5) |
|
High | 66 (54.5) |
| PLK1
immunostaining |
|
|
Low | 79 (56.4) |
|
High | 61 (43.6) |
Association between the
clinicopathological features and expression of the 5 genes in the
IHC-validated patient cohort
All 141 patients had IHC staining for AURAK and
BUB1. Due to limited availability of tissue slides, IHC staining
for TPX2, CDC25C and PLK1 were performed in 95, 121 and 140
patients, respectively. The association between the
clinicopathological characteristics and expression pattern of the 5
genes in the IHC-validated patient cohort is illustrated in
Tables V and VI. Higher AURKA expression was associated
with non-gastric locations and a higher expression of BUB1, CDC25C
and PLK1. Higher TPX2 expression was also associated with higher
expression of BUB1, CDC25C and PLK1. Higher BUB1 IHC staining was
associated with higher expression of 4 other mitotic check proteins
similar to CDC25C and PLK1.
| Table V.Association of IHC intensity of five
genes with clinicopathological characteristics of patients with
gastrointestinal stromal tumors. |
Table V.
Association of IHC intensity of five
genes with clinicopathological characteristics of patients with
gastrointestinal stromal tumors.
|
| AURKA score,
(%) | TPX2 score,
(%) | BUB1 score,
(%) | CDC25C
score, (%) | PLK1 score,
(%) |
|
|
|
|
|
|
|
| Parameters | Low | High | Low | High | Low | High | Low | High | Low | High |
|---|
| Age |
|
|
|
|
|
|
|
|
|
|
|
<60 | 38 (46.3) | 44 (53.7) | 34 (63.0) | 20 (37.0) | 37 (45.1) | 45 (54.9) | 31 (41.9) | 43 (58.1) | 48 (58.5) | 34 (41.5) |
|
≥60 | 35 (59.3) | 24 (40.7) | 30 (73.2) | 11 (26.8) | 27 (45.8) | 32 (54.2) | 24 (51.1) | 23 (48.9) | 31 (53.4) | 27 (46.6) |
|
P-value |
| 0.128 |
| 0.293 |
| 0.940 |
| 0.323 |
| 0.550 |
| Sex |
|
|
|
|
|
|
|
|
|
|
|
Male | 35 (47.3) | 39 (52.7) | 35 (67.3) | 17 (32.7) | 33 (44.6) | 41 (55.4) | 23 (39.0) | 36 (61.0) | 40 (54.1) | 34 (45.9) |
|
Female | 38 (56.7) | 29 (43.3) | 29 (67.4) | 14 (32.6) | 31 (46.3) | 36 (53.7) | 32 (51.6) | 30 (48.4) | 39 (59.1) | 27 (40.9) |
|
P-value |
| 0.264 |
| 0.989 |
| 0.842 |
| 0.163 |
| 0.549 |
| Location |
|
|
|
|
|
|
|
|
|
|
|
Gastric | 53 (63.9) | 30 (36.1) | 36 (62.1) | 22 (37.9) | 36 (43.4) | 47 (56.6) | 33 (47.8) | 36 (52.2) | 43 (52.4) | 39 (47.6) |
|
Non-gastric | 20 (34.5) | 38 (65.5) | 28 (75.7) | 9 (24.3) | 28 (48.3) | 30 (51.7) | 22 (42.3) | 30 (57.7) | 36 (62.1) | 22 (37.9) |
|
P-value |
| 0.001a |
| 0.168 |
| 0.565 |
| 0.546 |
| 0.258 |
| Tumor size, cm |
|
|
|
|
|
|
|
|
|
|
|
<5 | 35 (59.3) | 24 (40.7) | 32 (76.2) | 10 (23.8) | 29 (49.2) | 30 (50.8) | 31 (56.4) | 24 (43.6) | 37 (63.8) | 21 (36.2) |
|
5–10 | 25 (48.1) | 27 (51.9) | 23 (63.9) | 13 (36.1) | 26 (50.0) | 26 (50.0) | 17 (38.6) | 27 (61.4) | 28 (53.8) | 24 (46.2) |
|
>10 | 13 (43.3) | 17 (56.7) | 9 (52.9) | 8 (47.1) | 9 (30.0) | 21 (70.0) | 7 (31.8) | 15 (68.2) | 14 (46.7) | 16 (53.3) |
|
P-value |
| 0.288 |
| 0.193 |
| 0.161 |
| 0.077 |
| 0.275 |
| Mitotic count,
HPF |
|
|
|
|
|
|
|
|
|
|
|
<5/50 | 45 (50.6) | 44 (49.4) | 43 (71.7) | 17 (28.3) | 44 (49.4) | 45 (50.6) | 39 (49.4) | 40 (50.6) | 53 (60.2) | 35 (39.8) |
|
≥5/50 | 28 (53.8) | 24 (46.2) | 21 (60.0) | 14 (40.0) | 20 (38.5) | 32 (61.5) | 16 (38.1) | 26 (61.9) | 26 (50.0) | 26 (50.0) |
|
P-value |
| 0.706 |
| 0.242 |
| 0.207 |
| 0.236 |
| 0.238 |
| AFIP risk |
|
|
|
|
|
|
|
|
|
|
|
Low | 38 (58.5) | 27 (41.5) | 31 (70.5) | 13 (29.5) | 32 (49.2) | 33 (50.8) | 32 (56.1) | 25 (43.9) | 37 (57.8) | 27 (42.2) |
|
Moderate | 14 (51.9) | 13 (48.1) | 13 (72.2) | 5 (27.8) | 15 (55.6) | 12 (44.4) | 9 (36.0) | 16 (64.0) | 17 (63.0) | 10 (37.0) |
|
High | 21 (42.9) | 28 (57.1) | 20 (60.6) | 13 (39.4) | 17 (34.7) | 32 (65.3) | 14 (35.9) | 25 (64.1) | 25 (51.0) | 24 (49.0) |
|
P-value |
| 0.256 |
| 0.586 |
| 0.152 |
| 0.084 |
| 0.576 |
| Table VI.Association of IHC intensity between
five genes. |
Table VI.
Association of IHC intensity between
five genes.
|
| AURKA score,
(%) | TPX2 score,
(%) | BUB1 score,
(%) | CDC25C
score, (%) | PLK1 score,
(%) |
|
|
|
|
|
|
|
|
| Low | High | Low | High | Low | High | Low | High | Low | High |
|---|
| AURKA
score |
|
|
|
|
|
|
|
|
|
|
|
Low | – | – | 29 (70.7) | 12 (29.3) | 41 (56.2) | 32 (43.8) | 35 (56.5) | 27 (43.5) | 50 (69.4) | 22 (30.6) |
|
High | – | – | 35 (64.8) | 19 (35.2) | 23 (33.8) | 45 (66.2) | 20 (33.9) | 39 (66.1) | 29 (42.6) | 39 (57.4) |
|
P-value | – | – |
| 0.542 |
| 0.008a |
| 0.013a |
| 0.001a |
| TPX2
score |
|
|
|
|
|
|
|
|
|
|
|
Low | – | – | – | – | 34 (53.1) | 30 (46.9) | 28 (51.9) | 26 (48.1) | 41 (64.1%) | 23 (35.9) |
|
High | – | – |
|
| 7 (22.6) | 24 (77.4) | 6 (23.1) | 20 (76.9) | 6 (19.4) | 25 (80.6) |
|
P-value | – | – | – | – |
| 0.005a |
| 0.015a |
|
<0.001a |
| BUB1
score |
|
|
|
|
|
|
|
|
|
|
|
Low | – | – | – | – |
| – | 37 (66.1) | 19 (33.9) | 51 (79.7) | 13 (20.3) |
|
High | – | – | – | – | – | – | 18 (27.7) | 47 (72.3) | 28 (36.8) | 48 (63.2) |
|
P-value | – | – | – | – | – | – |
|
<0.001a |
|
<0.001a |
| CDC25C
score |
|
|
|
|
|
|
|
|
|
|
|
Low | – | – | – | – | – | – | – |
| 41 (75.9) | 13 (24.1) |
|
High |
| – | – | – | – | – | – | – | 26 (39.4) | 40 (60.6) |
|
P-value |
| – | – | – | – | – | – |
|
|
<0.001a |
Multivariate analysis was performed in the 80
patients who had IHC for all 5 genes analyzed using multinomial
logistic regression revealed that higher AURKA expression was
independently associated with non-gastric locations and higher PLK1
expression. TPX2 staining was independently associated with higher
PLK1 expression. BUB1 expression was independently associated with
higher CDC25C and PLK1 expression. Higher CDC25C expression was
independently associated with higher BUB1 expression. Higher PLK1
expression was independently associated with higher TPX2 and BUB1
expression (Table VII).
| Table VII.Multivariate analysis of association
of clinicopathological characteristics with IHC intensity of five
genes in 80 GIST patients. |
Table VII.
Multivariate analysis of association
of clinicopathological characteristics with IHC intensity of five
genes in 80 GIST patients.
|
| AURKA score | TPX2 score | BUB1 score | CDC25C score | PLK1 score |
|---|
|
|
|
|
|
|
|
|---|
|
| Odds ratio | P-value | Odds ratio | P-value | Odds ratio | P-value | Odds ratio | P-value | Odds ratio | P-value |
|---|
| Age
(<60/≥60) |
| NS |
| NS |
| NS |
| NS |
| NS |
| Gender
(Male/Female) |
| NS |
| NS |
| NS |
| NS |
| NS |
| Location
(Gastric/Non-gastric) | 4.91
(2.02–11.94) | <0.001 |
| NS |
| NS |
| NS |
| NS |
| Tumor size (<5
cm/5-10 cm/>10 cm) |
| NS |
| NS |
| NS |
| NS |
| NS |
| Mitotic count
(<5/50 HPF/≥5/50 HPF) |
| NS |
| NS |
| NS |
| NS |
| NS |
| AFIP risk
(Low/Moderate/High) |
| NS |
| NS |
| NS |
| NS |
| NS |
| AURKA score
(Low/High) |
| – |
| NS | 1.73
(0.54–5.58) | 0.358 | 1.29
(0.45–3.73) | 0.633 | 1.67
(0.50–5.56) | 0.405 |
| TPX2 score
(Low/High) |
| NS |
| – | 2.21
(0.59–8.26) | 0.24 | 1.56
(0.46–5.34) | 0.476 | 3.76
(1.05–13.51) | 0.042 |
| BUB1 score
(Low/High) | 1.62
(0.63–4.16) | 0.317 | 2.36
(0.62–8.94) | 0.206 |
| – | 3.38
(1.06–10.74) | 0.039 | 7.42
(2.27–24.29) | 0.001 |
| CDC25C score
(Low/High) | 1.38
(0.57–3.34) | 0.481 | 1.58
(0.46–5.42) | 0.463 | 3.37
(1.05–10.76) | 0.041 |
| – | 2.90
(0.88–9.58) | 0.081 |
| PLK1 score
(Low/High) | 3.79
(1.41–10.18) | 0.008 | 3.92
(1.07–14.35) | 0.039 | 7.41
(2.26–24.34) | 0.001 | 2.84
(0.87–9.30) | 0.085 |
| – |
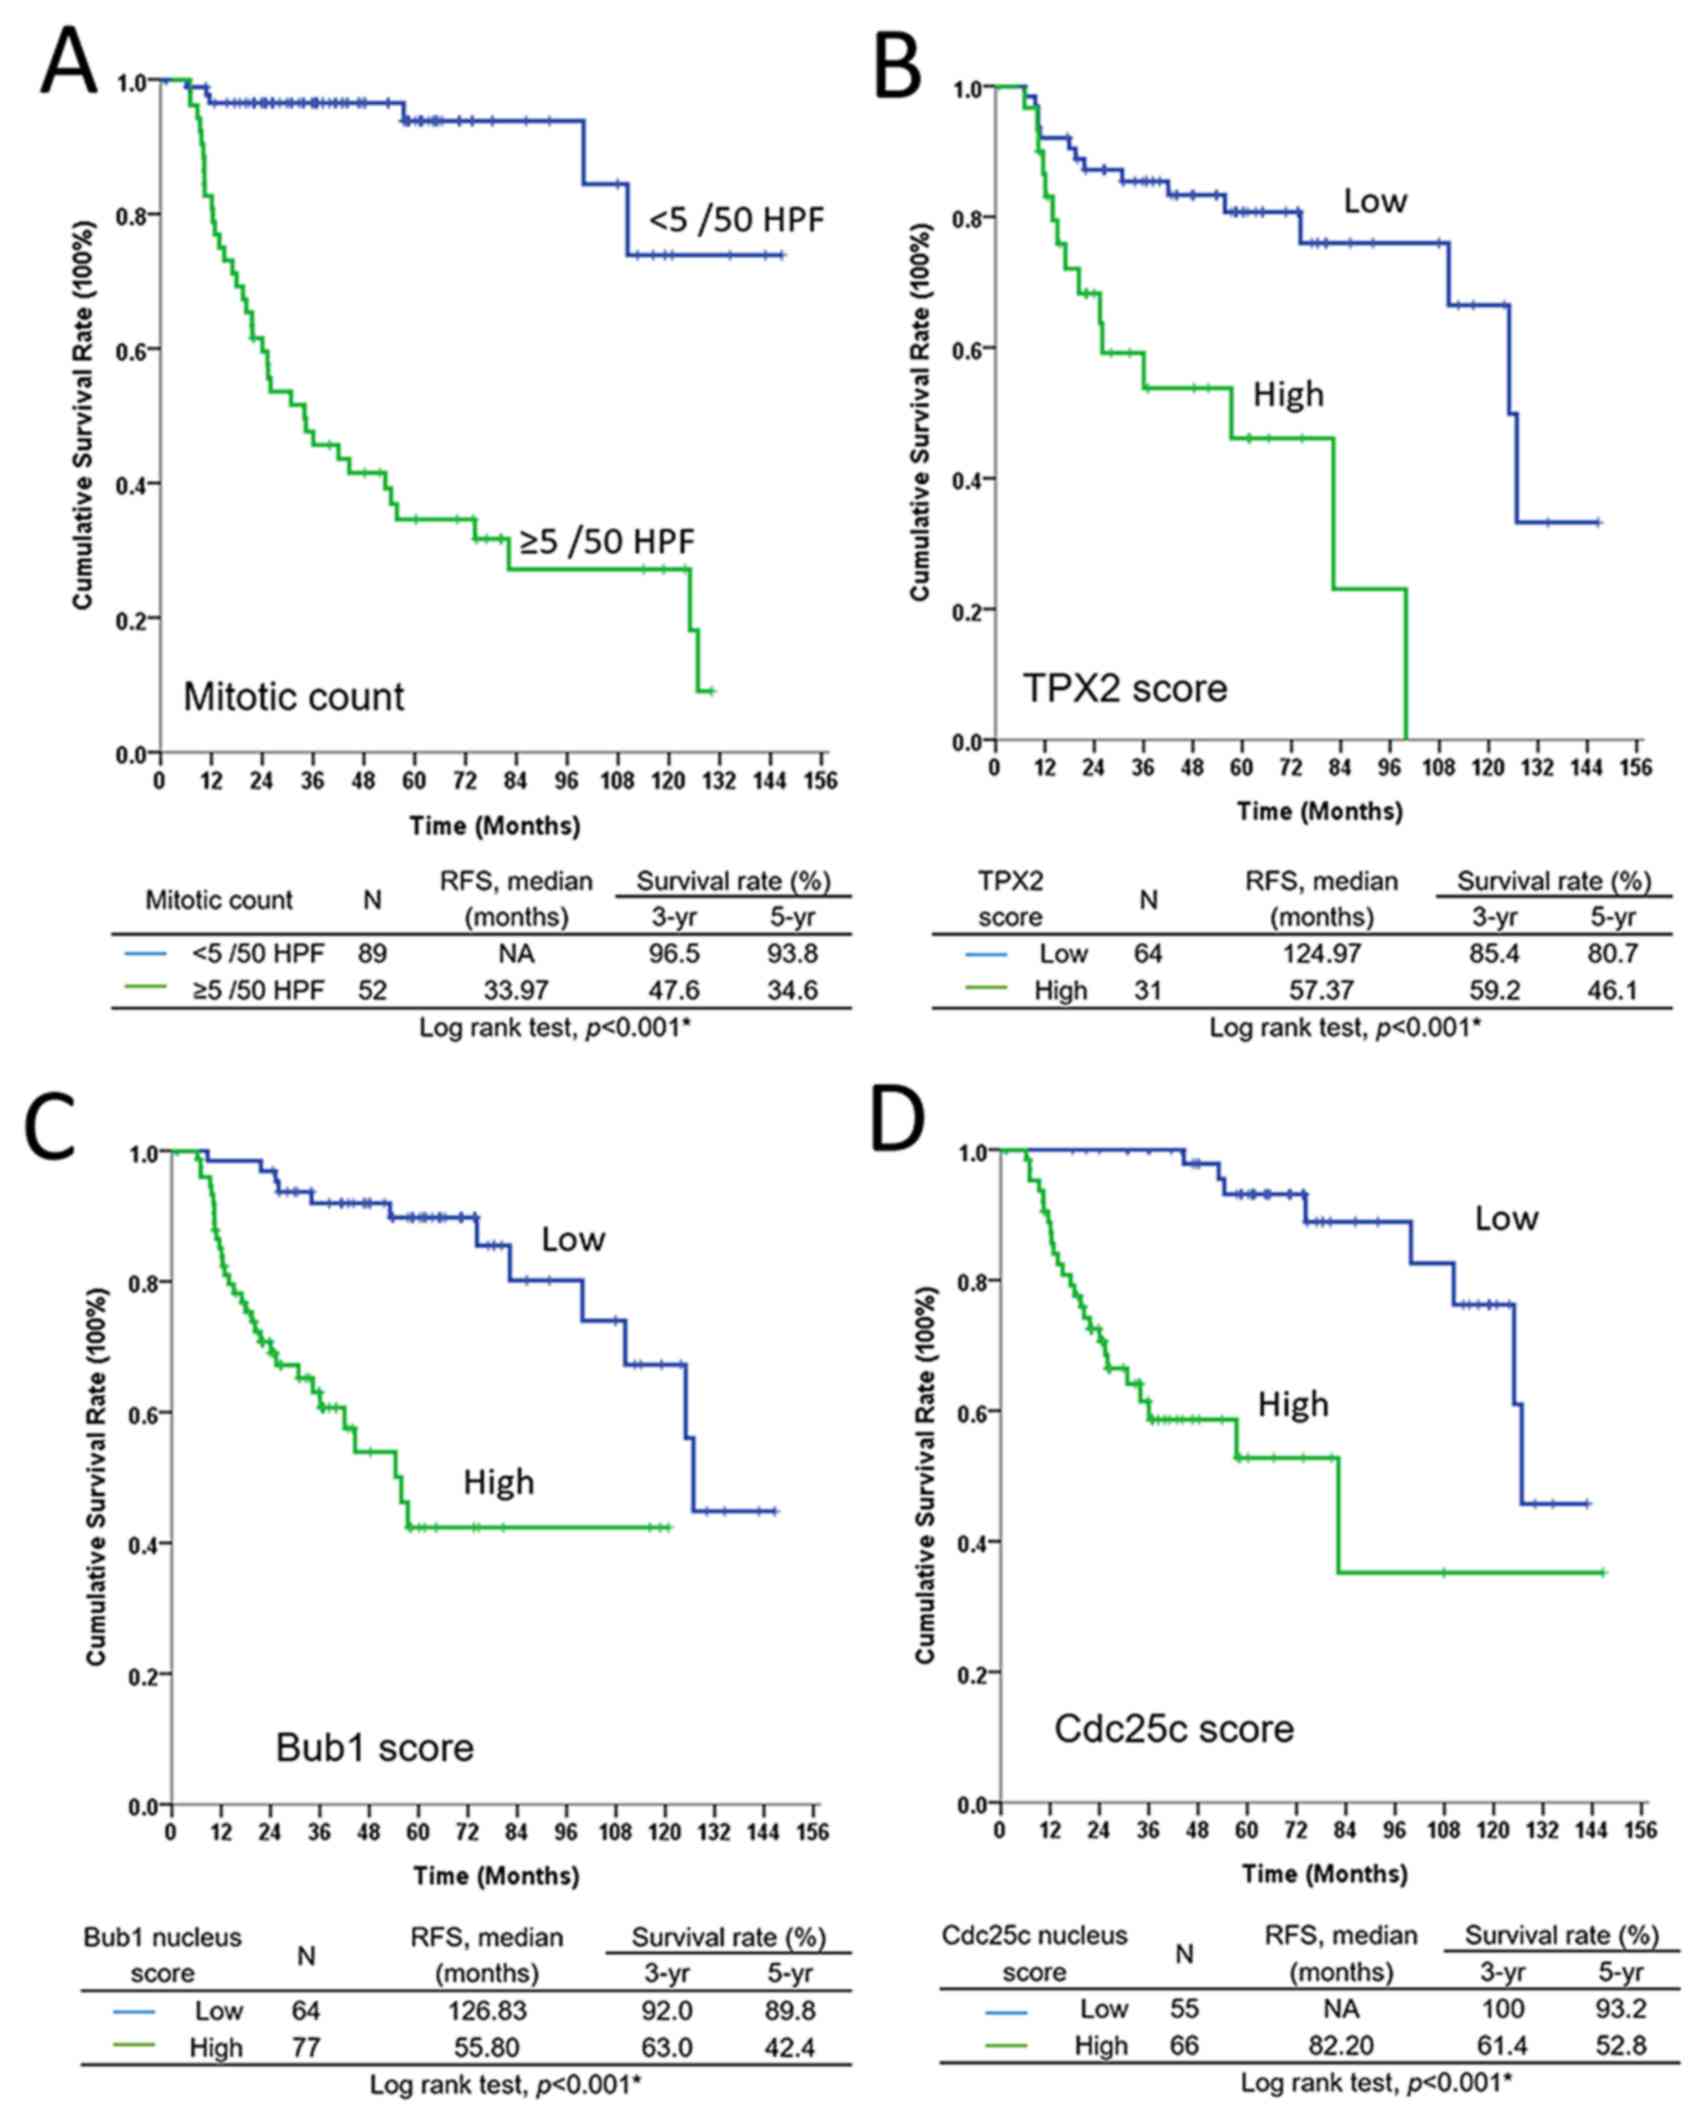
Prognostic effect of
clinicopathological factors and expression of 5 genes on RFS
A total of 43 patients experienced recurrence,
consisting of 11 locoregional relapses, 22 distant metastases and
10 multiple site recurrences. The univariate analysis indicated
that the RFS was significantly affected by the tumor size, mitotic
count, AFIP risk group classification, and expression level of the
5 aforementioned genes (Table
VIII). However, only the mitotic count (P<0.001) and
expression levels of TPX2 (P=0.008), BUB1 (P=0.023), and CDC25C
(P=0.017) were identified as independent unfavorable prognostic
factors for RFS through multivariate analysis (Table VIII). The Kaplan-Meier RFS curves
for these 4 factors are shown in Fig.
3.
| Table VIII.Univariate and multivariate analyses
of the prognostic effects of clinicopathological factors on
recurrence-free survival. |
Table VIII.
Univariate and multivariate analyses
of the prognostic effects of clinicopathological factors on
recurrence-free survival.
|
| Median
survival |
| Univariate
analysis |
| Multivariate
analysis |
|---|
|
|
|
|
|
|
|
|---|
| Factors | Months (95%
CI) | HR | 95% CI | P-value | HR | 95% CI | P-value |
|---|
| Age |
|
|
|
|
|
|
|
| <60
(n=82) | 124.97
(88.15–161.78) | 1 |
| 0.580 |
|
|
|
| ≥60
(n=59) | Not achieved | 1.189 | 0.644–2.194 |
|
|
|
|
| Sex |
|
|
|
|
|
|
|
| Female
(n=67) | Not achieved | 1 |
| 0.104 |
|
|
|
| Male
(n=74) | 124.97
(52.27–197.66) | 1.672 | 0.900–3.104 |
|
|
|
|
| Location |
|
|
|
|
|
|
|
| Gastric
(n=83) | Not achieved | 1 |
| 0.262 |
|
|
|
|
Non-gastric (n=58) | 110.27
(66.15–154.39) | 1.44 | 0.762–2.721 |
|
|
|
|
| Tumor size, cm |
|
|
|
|
|
|
|
| <5
(n=59) | 124.97
(104.1–145.83) | 1 |
|
<0.001a |
|
| >0.05 |
| 5–10
(n=52) | 99.86
(59.64–140.10) | 4.899 | 1.646–14.583 |
|
|
|
|
| >10
(n=30) | 21.67
(15.17–28.17) | 18.436 | 6.324–53.740 |
|
|
|
|
| Mitotic count.
HPF |
|
|
|
|
|
|
|
| <5
/50 (n=89) | Not achieved | 1 |
|
<0.001a | 1 |
|
<0.001a |
| ≥5 /50
(n=52) | 33.97
(15.05–52.88) | 12.086 | 5.094–28.679 |
| 9.207 | 2.958–28.661 |
|
| AFIP risk |
|
|
|
|
|
|
|
| Low
(n=65) | Not achieved | 1 |
|
<0.001a |
|
| >0.05 |
|
Moderate (n=27) | Not achieved | 12 | 1.401–102.793 |
|
|
|
|
| High
(n=49) | 30.80
(17.57–44.04) | 56.914 | 7.791–415.752 |
|
|
|
|
| AURKA score |
|
|
|
|
|
|
|
| Low
(n=73) | Not achieved | 1 |
| 0.040a |
|
| >0.05 |
| High
(n=68) | 99.87
(53.50–146.23) | 1.904 | 1.031–3.517 |
|
|
|
|
| TPX2 score |
|
|
|
|
|
|
|
| Low
(n=64) | 124.97
(108.87–141.07) | 1 |
| 0.001a | 1 |
| 0.008a |
| High
(n=31) | 57.37
(22.95–91.78) | 3.895 | 1.800–8.431 |
| 4.016 | 1.440–11.196 |
|
| BUB1 score |
|
|
|
|
|
|
|
| Low
(n=64) | 126.83
(122.04–131.63) | 1 |
|
<0.001a | 1 |
| 0.023a |
| High
(n=77) | 55.80
(39.99–71.61) | 5.038 | 2.419–10.494 |
| 4.979 | 1.247–19.870 |
|
| CDC25C score |
|
|
|
|
|
|
|
| Low
(n=55) | Not achieved | 1 |
|
<0.001a | 1 |
| 0.017a |
| High
(n=66) | 82.20
(22.76–141.64) | 6.484 | 2.786–15.091 |
| 5.154 | 1.344–19.762 |
|
| PLK1 score |
|
|
|
|
|
|
|
| Low
(n=79) | 126.83
(122.23–131.43) | 1 |
| 0.001a | 1 |
| >0.05 |
| High
(n=61) | 54.40
(35.35–73.45) | 3.132 | 1.615–6.071 |
|
|
|
|
Discussion
In the present analysis, LEA in GSEA was used to
examine the genes in the leading edge subsets of the top 10
enriched gene sets and the resultant list of genes was uploaded to
PID. A total of 5 genes-AURKA, PLK1, CDC25C, BUB1 and TPX2, were
identified. In the patient cohort of dataset GSE8167, all but BUB1
were significant factors for poor RFS. In the IHC-validated patient
cohort, only AURKA exhibited significant overexpression in
non-gastric tumors when compared with gastric tumors (Table V). Although all 5 genes were
considered risk factors for poor RFS based on the univariate
analysis, only the expression levels of CDC25C, BUB1 and TPX2
together with mitotic count exhibited prognostic effects in the
multivariate analysis.
Genes that are involved in the regulation of cell
cycle have a crucial role in sarcomas. A prognostic gene expression
signature-complexity index in sarcomas (CINSARC)-established by
Chibon et al (12) and
composed of 67 genes that are associated with chromosome integrity,
mitotic control and genome complexity were able to predict
metastasis outcomes. Similar findings were reported in studies of
individual subtypes of sarcoma. In a study of uterine
leiomyosarcomas (ULMSs) and their benign counterparts, Shan et
al (18) showed that 26 of the 50
most overexpressed genes in ULMSs were involved in the regulation
of mitosis and spindle function. On the other hand, our group
(14) and Lagarde et al
(11) have identified that genes that
are involved in the progression or regulation of the cell cycle are
strong prognostic factors of GIST recurrence. Most notably, all
three studies have revealed that AURKA as one of the most crucial
genes associated with ULMS and GIST recurrence (11,14,18).
In the present study, instead of random selection,
LEA in GSEA was used in combination with PID to identify
biologically relevant genes/pathways in GISTs. LEA in GSEA was
performed to find genes that frequently appeared in the top 10
enriched gene sets. PID was used to search genes that are involved
in pathways that are important in GISTs. ‘PLK1 signaling events’
was identified as a crucial pathway in GISTs, and 5 genes-AURKA,
PLK1, CDC25, TPX2, and BUB1-in this pathway were examined.
AURKA and PLK1 are the key members of the Aurora
kinase family and polo-like kinase family, respectively. Both
proteins mainly function in the G2-M phase of the cell cycle. In
the late G2 phase of the cell cycle, AURKA and PLK1 are recruited
to the centrosome. PLK1 promotes the recruitment of AURKA that
binds to centrosomin, whereas AURKA is responsible for the initial
activation of PLK1 in G2 (19). TPX2
is a protein that interacts with AURKA and can activate AURKA in
the late G2 and M phases (19).
CDC25C is a phosphatase that is largely inactive in G2. However,
mitotic entry is triggered by a steep increase in cyclin
B-cyclin-dependent kinase 1 activity, which is promoted by
PLK1-activated CDC25C (19). BUB1 is
a critical component of the spindle assembly checkpoint, and the
BUB1-PLK1 kinase complex promotes spindle checkpoint signaling
through the phosphorylation of cell division cycle protein 20
(20). AURKA and PLK1 are involved in
cytokinesis (19,20).
In the study that examined the associations among
the expressions of the 5 genes, the expression levels of PLK1,
BUB1, and CDC25C were observed to be highly associated. This
finding is most likely because of the interaction between PLK1 and
CDC25C during mitotic entry and the formation of BUB1-PLK1 complex
during spindle assembly. In addition, the expression levels of PLK1
was closely associated with that of AURKA, indicating the
interactive function of these proteins in the G2-M phase (Table VII).
Schaefer et al (21) recently identified a tumor suppressor
gene called MYC-associated factor X (MAX) in GISTs. MAX is
localized on chromosome 14q, one of the most frequently deleted
sites in GISTs (22). Inactivated
mutations of MAX can be found in sporadic GISTs and patients with
GISTs and neurofibromatosis type 1. These inactivated mutations of
MAX were also detected in micro-GISTs, indicating that it is an
early event (21).
MAX is a binding partner of MYC and has been
reported as a tumor suppressor in hereditary pheochromocytomas and
small-cell lung cancer (23,24). Previous studies have demonstrated that
MAX may impair MYC function by impairing the ability of MYC to bind
to DNA (25,26). MYC is a crucial regulator of cell
cycle progression. Schaefer et al (21) demonstrated that the inactivation of
MAX resulted in the silencing of the p16 gene, possibly via MYC
activation (27). In addition, MYC
induces cell proliferation that is generally associated with
increases in the activity of CDK2, CDK4 and CDK6 to regulate G1-S
phase progression (28). Therefore,
it was hypothesized that the inactivation of the MAX tumor
suppressor occurs early in GIST progression and leads to p16
inactivation and increased proliferation by enhancing G1-S phase
progression (21). Further cell cycle
dysregulation in high-risk GISTs is most likely due to the
overexpression of genes in the PLK1 signaling pathway, which may be
a result of mutations of other tumor suppressor genes (29–31) with
subsequent increased progression of the G2-M phase and transition
to high-grade cancer (22).
In addition to the expression levels of the
aforementioned 5 genes, the clinicopathological factors that
associated with recurrence included tumor size, mitotic count and
AFIP risk group classification. This finding is reasonable as all
these factors are considered risk factors for recurrence. In the
multivariate analysis, only mitotic count and the expression levels
of TPX2, BUB1 and CDC25C were identified as independent factors for
poor RFS. TPX2, BUB1 and CDC25C have been previously reported to
have prognostic effects on many types of cancer but not on sarcomas
or GISTs (32–38). However, unexpectedly the multivariate
analysis in the present study did not reveal AURKA and PLK1 to have
statistically significant effects on RFS. In a previous study by
the authors, AURKA expression was associated with non-gastric tumor
(14). In the present study, after
including the expression of 4 other genes in the multivariate
analysis, AURKA expression remained independently associated with
non-gastric locations. This result indicated that AURKA might be
responsible for a distinct and more rapidly deteriorating clinical
course of non-gastric GISTs.
Other molecules involved in cell cycle regulation
that may be associated with the progression of GISTs have been
previously reported. For example, in an European Organization for
Research and Treatment of Cancer (EORTC) study, impaired p53, p16,
BCL2 and CHK2 expression was commonly detected in advanced GISTs
(29). Alteration of genes involved
in G2-M phase of cell cycle, including cyclin A, cyclin B1 and
cdc2, were identified to be markers for predicting the aggressive
behavior of GISTs in a Japanese study (39). These studies further supported the
important roles of cell cycle regulators in GISTs.
There are limitations of statistical analysis in the
present study. Due to limited availability of tissue slides, only
AURKA and BUB1 IHC staining were done in all 141 patients. IHC
staining for TPX2, CDC25C and PLK1 were done in 95, 121 and 140
patients, respectively. This definitely jeopardized the final
analysis of this study. A total of 43 patients experienced
recurrence. This relatively low number of recurrence may limit the
statistical power of the study. Hopefully, there may be a larger
cohort of patients through collaboration of multiple hospitals for
further validation in the future. Another issue is that the
possibility of multicollinearity (40) when using Cox regression model for
multivariate analysis cannot be ruled out, since there is a high
number of interactions between all the genes in cell cycle
regulation. Nonetheless, CDC25C and BUB1, the two genes identified
as independent prognostic factors, were also the only two genes
that could be found in the GESA GO gene set ‘regulation of mitosis’
(Table I), indicating their critical
roles in the disease. This result demonstrated that the present
study was still able to identify important genes through Cox
regression analysis.
In conclusion, through bioinformatics analysis and
IHC validation, 5 genes-AURKA, PLK1, CDC25C, BUB1 and TPX2-in the
PLK1 signaling pathway were identified as risk factors for poor
prognosis of GIST. AURKA was significantly overexpressed in
non-gastric GISTs. All 5 genes were considered as risk factors for
poor RFS based on the univariate analysis. The mitotic count and
expression levels of CDC25C, BUB1 and TPX2 retained prognostic
effects in the multivariate analysis. The results of the present
study indicated that the PLK1 signaling pathway might be crucial in
the disease progression of GISTs. Furthermore, genes in this
pathway may serve as predictive markers for adjuvant therapy.
Acknowledgements
Not applicable.
Funding
The present study was supported by grants from the
Department of Health in Taiwan (Center of Excellence for Cancer
Research, Taipei Veterans General Hospital, grant nos.
DOH99-TD-C-111-007 and DOH100-TD-C-111-007 and the National
Research Program for Biopharmaceuticals, grant no.
DOH100-TD-PB-111-TM026), from the National Science Council (grant
nos. NSC 100-2314-B-075-081 and NSC 101-2314-B-075-029), from the
Ministry of Science and Technology, (grant nos. MOST
103-2314-B-075-066, MOST 105-2314-B-075-059 and MOST
106-2314-B-075-065), from the Taipei Veterans General Hospital
(grant nos. V97ER2-010, V98ER2-004, V102E8-003, V103E8-001,
V101C-133, V102C-034, V103C-188, V104C-099, V104E16-001-MY3-1,
V104E16-001-MY3-2, V104D16-001-MY3-3, V105C-094 and V106C-160) and
from the Yen Tjing Ling Medical Foundation (grant nos. CI-100-19,
CI-103-6 and CI-105-4) in Taiwan to Dr CC Yen, as well as by grants
from the Bayer and the Chang Gung Medical Research Program
XMRPG3D0411, XPRPG3D0412, XPRPG3D0413 and XPRPG3D0414 to Dr CN Yeh.
Dr CC Yen and Dr CN Yeh were also partially supported by grants
from the Taiwan Clinical Oncology Research Foundation as well as
Chong Hin Loon Memorial Cancer and Biotherapy Research Center of
National Yang-Ming University, and the Taiwanese Society of
Molecular Medicine, respectively.
Availability of data and materials
The datasets used and/or analyzed during the current
study are available from the corresponding author on reasonable
request.
Authors' contributions
JC, CNY, CC and CCY were responsible for study
design. SH was the pathologist and responsible for the pathology
slide review and scoring. YC, KC and TY were members of the GISTs
team from Chang Gung Memorial Hospital and responsible for clinical
data collection. SC, TC, MY and YC were responsible for data
analysis. JC and YC were also responsible for the completion of
final manuscript.
Ethics approval and consent to
participate
The protocols for tumor sample collection and
clinical record review were approved by the Institutional Review
Board of Chang Gung Memorial Hospital (IRB no. 98-0352B), and all
patients had provided informed consent for the use of their tissues
and clinical data in research. All identifying information of
individual patient was removed.
Patient consent for publication
Consent for publication of data and any associated
images was received from patients.
Conflict of interest
The authors declare that they have no competing
interest.
References
|
1
|
Tran T, Davila JA and El-Serag HB: The
epidemiology of malignant gastrointestinal stromal tumors: An
analysis of 1,458 cases from 1992 to 2000. Am J Gastroenterol.
100:162–168. 2005. View Article : Google Scholar : PubMed/NCBI
|
|
2
|
Miettinen M, Monihan JM, Sarlomo-Rikala M,
Kovatich AJ, Carr NJ, Emory TS and Sobin LH: Gastrointestinal
stromal tumors/smooth muscle tumors (GISTs) primary in the omentum
and mesentery: Clinicopathologic and immunohistochemical study of
26 cases. Am J Surg Pathol. 23:1109–1118. 1999. View Article : Google Scholar : PubMed/NCBI
|
|
3
|
Miettinen M and Lasota J: Gastrointestinal
stromal tumors: Review on morphology, molecular pathology,
prognosis, and differential diagnosis. Arch Pathol Lab Med.
130:1466–1478. 2006.PubMed/NCBI
|
|
4
|
Reith JD, Goldblum JR, Lyles RH and Weiss
SW: Extragastrointestinal (soft tissue) stromal tumors: An analysis
of 48 cases with emphasis on histologic predictors of outcome. Mod
Pathol. 13:577–585. 2000. View Article : Google Scholar : PubMed/NCBI
|
|
5
|
Hirota S, Isozaki K, Moriyama Y, Hashimoto
K, Nishida T, Ishiguro S, Kawano K, Hanada M, Kurata A, Takeda M,
et al: Gain-of-function mutations of c-kit in human
gastrointestinal stromal tumors. Science. 279:577–580. 1998.
View Article : Google Scholar : PubMed/NCBI
|
|
6
|
Heinrich MC, Corless CL, Duensing A,
McGreevey L, Chen CJ, Joseph N, Singer S, Griffith DJ, Haley A,
Town A, et al: PDGFRA activating mutations in gastrointestinal
stromal tumors. Science. 299:708–710. 2003. View Article : Google Scholar : PubMed/NCBI
|
|
7
|
Blanke CD, Demetri GD, von Mehren M,
Heinrich MC, Eisenberg B, Fletcher JA, Corless CL, Fletcher CD,
Roberts PJ, Heinz D, et al: Long-term results from a randomized
phase II trial of standard-versus higher-dose imatinib mesylate for
patients with unresectable or metastatic gastrointestinal stromal
tumors expressing KIT. J Clin Oncol. 26:620–625. 2008. View Article : Google Scholar : PubMed/NCBI
|
|
8
|
Yeh CN, Chen YY, Tseng JH, Chen JS, Chen
TW, Tsai CY, Cheng CT, Jan YY and Chen MF: Imatinib mesylate for
patients with recurrent or metastatic gastrointestinal stromal
tumors expressing KIT: A decade experience from Taiwan. Transl
Oncol. 4:328–335. 2011. View Article : Google Scholar : PubMed/NCBI
|
|
9
|
Demetri GD, van Oosterom AT, Garrett CR,
Blackstein ME, Shah MH, Verweij J, McArthur G, Judson IR, Heinrich
MC, Morgan JA, et al: Efficacy and safety of sunitinib in patients
with advanced gastrointestinal stromal tumour after failure of
imatinib: A randomised controlled trial. Lancet. 368:1329–1338.
2006. View Article : Google Scholar : PubMed/NCBI
|
|
10
|
Demetri GD, Reichardt P, Kang YK, Blay JY,
Rutkowski P, Gelderblom H, Hohenberger P, Leahy M, von Mehren M,
Joensuu H, et al: Efficacy and safety of regorafenib for advanced
gastrointestinal stromal tumours after failure of imatinib and
sunitinib (GRID): An international, multicentre, randomised,
placebo-controlled, phase 3 trial. Lancet. 381:295–302. 2013.
View Article : Google Scholar : PubMed/NCBI
|
|
11
|
Lagarde P, Pérot G, Kauffmann A, Brulard
C, Dapremont V, Hostein I, Neuville A, Wozniak A, Sciot R,
Schöffski P, et al: Mitotic checkpoints and chromosome instability
are strong predictors of clinical outcome in gastrointestinal
stromal tumors. Clin Cancer Res. 18:826–838. 2012. View Article : Google Scholar : PubMed/NCBI
|
|
12
|
Chibon F, Lagarde P, Salas S, Pérot G,
Brouste V, Tirode F, Lucchesi C, de Reynies A, Kauffmann A, Bui B,
et al: Validated prediction of clinical outcome in sarcomas and
multiple types of cancer on the basis of a gene expression
signature related to genome complexity. Nat Med. 16:781–787. 2010.
View Article : Google Scholar : PubMed/NCBI
|
|
13
|
Yamaguchi U, Nakayama R, Honda K, Ichikawa
H, Hasegawa T, Shitashige M, Ono M, Shoji A, Sakuma T, Kuwabara H,
et al: Distinct gene expression-defined classes of gastrointestinal
stromal tumor. J Clin Oncol. 26:4100–4108. 2008. View Article : Google Scholar : PubMed/NCBI
|
|
14
|
Yen CC, Yeh CN, Cheng CT, Jung SM, Huang
SC, Chang TW, Jan YY, Tzeng CH, Chao TC, Chen YY, et al:
Integrating bioinformatics and clinicopathological research of
gastrointestinal stromal tumors: Identification of aurora kinase A
as a poor risk marker. Ann Surg Oncol. 19:3491–3499. 2012.
View Article : Google Scholar : PubMed/NCBI
|
|
15
|
Yeh CN, Yen CC, Chen YY, Cheng CT, Huang
SC, Chang TW, Yao FY, Lin YC, Wen YS, Chiang KC, et al:
Identification of aurora kinase A as an unfavorable prognostic
factor and potential treatment target for metastatic
gastrointestinal stromal tumors. Oncotarget. 5:4071–4086. 2014.
View Article : Google Scholar : PubMed/NCBI
|
|
16
|
Schaefer CF, Anthony K, Krupa S, Buchoff
J, Day M, Hannay T and Buetow KH: PID: The pathway interaction
database. Nucleic Acids Res. 37:D674–D679. 2009. View Article : Google Scholar : PubMed/NCBI
|
|
17
|
Hirsch FR, Varella-Garcia M, Bunn PA Jr,
Di Maria MV, Veve R, Bremmes RM, Barón AE, Zeng C and Franklin WA:
Epidermal growth factor receptor in non-small-cell lung carcinomas:
Correlation between gene copy number and protein expression and
impact on prognosis. J Clin Oncol. 21:3798–3807. 2003. View Article : Google Scholar : PubMed/NCBI
|
|
18
|
Shan W, Akinfenwa PY, Savannah KB,
Kolomeyevskaya N, Laucirica R, Thomas DG, Odunsi K, Creighton CJ,
Lev DC and Anderson ML: A small-molecule inhibitor targeting the
mitotic spindle checkpoint impairs the growth of uterine
leiomyosarcoma. Clin Cancer Res. 18:3352–3365. 2012. View Article : Google Scholar : PubMed/NCBI
|
|
19
|
Lens SM, Voest EE and Medema RH: Shared
and separate functions of polo-like kinases and aurora kinases in
cancer. Nat Rev Cancer. 10:825–841. 2010. View Article : Google Scholar : PubMed/NCBI
|
|
20
|
Jia L, Li B and Yu H: The Bub1-Plk1 kinase
complex promotes spindle checkpoint signalling through Cdc20
phosphorylation. Nat Commun. 7:108182016. View Article : Google Scholar : PubMed/NCBI
|
|
21
|
Schaefer IM, Wang Y, Liang CW, Bahri N,
Quattrone A, Doyle L, Mariño-Enríquez A, Lauria A, Zhu M,
Debiec-Rychter M, et al: MAX inactivation is an early event in GIST
development that regulates p16 and cell proliferation. Nat Commun.
8:146742017. View Article : Google Scholar : PubMed/NCBI
|
|
22
|
Schaefer IM, Mariño-Enríquez A and
Fletcher JA: What is new in gastrointestinal stromal tumor? Adv
Anat Pathol. 24:259–267. 2017. View Article : Google Scholar : PubMed/NCBI
|
|
23
|
Romero OA, Torres-Diz M, Pros E, Savola S,
Gomez A, Moran S, Saez C, Iwakawa R, Villanueva A, Montuenga LM, et
al: MAX inactivation in small cell lung cancer disrupts MYC-SWI/SNF
programs and is synthetic lethal with BRG1. Cancer Discov.
4:292–303. 2014. View Article : Google Scholar : PubMed/NCBI
|
|
24
|
Comino-Méndez I, Gracia-Aznárez FJ,
Schiavi F, Landa I, Leandro-Garcia LJ, Letón R, Honrado E,
Ramos-Medina R, Caronia D, Pita G, et al: Exome sequencing
identifies MAX mutations as a cause of hereditary pheochromocytoma.
Nat Genet. 43:663–667. 2011. View
Article : Google Scholar : PubMed/NCBI
|
|
25
|
Maltais L, Montagne M, Bédard M, Tremblay
C, Soucek L and Lavigne P: Biophysical characterization of the
b-HLH-LZ of ΔMax, an alternatively spliced isoform of Max found in
tumor cells: Towards the validation of a tumor suppressor role for
the Max homodimers. PLoS One. 12:e01744132017. View Article : Google Scholar : PubMed/NCBI
|
|
26
|
Comino-Méndez I, Leandro-García LJ,
Montoya G, Inglada-Pérez L, de Cubas AA, Currás-Freixes M, Tysoe C,
Izatt L, Letón R, Gómez-Graña Á, et al: Functional and in silico
assessment of MAX variants of unknown significance. J Mol Med
(Berl). 93:1247–1255. 2015. View Article : Google Scholar : PubMed/NCBI
|
|
27
|
Tabor V, Bocci M, Alikhani N, Kuiper R and
Larsson LG: MYC synergizes with activated BRAFV600E in mouse lung
tumor development by suppressing senescence. Cancer Res.
74:4222–4229. 2014. View Article : Google Scholar : PubMed/NCBI
|
|
28
|
Malumbres M: Physiological relevance of
cell cycle kinases. Physiol Rev. 91:973–1007. 2011. View Article : Google Scholar : PubMed/NCBI
|
|
29
|
Romeo S, Debiec-Rychter M, Van Glabbeke M,
Van Paassen H, Comite P, Van Eijk R, Oosting J, Verweij J, Terrier
P, Schneider U, et al: Cell cycle/apoptosis molecule expression
correlates with imatinib response in patients with advanced
gastrointestinal stromal tumors. Clin Cancer Res. 15:4191–4198.
2009. View Article : Google Scholar : PubMed/NCBI
|
|
30
|
King SI, Purdie CA, Bray SE, Quinlan PR,
Jordan LB, Thompson AM and Meek DW: Immunohistochemical detection
of Polo-like kinase-1 (PLK1) in primary breast cancer is associated
with TP53 mutation and poor clinical outcom. Breast Cancer Res.
14:R402012. View Article : Google Scholar : PubMed/NCBI
|
|
31
|
Li Z, Sun Y, Chen X, Squires J,
Nowroozizadeh B, Liang C and Huang J: p53 mutation directs AURKA
overexpression via miR-25 and FBXW7 in prostatic small cell
neuroendocrine carcinoma. Mol Cancer Res. 13:584–591. 2015.
View Article : Google Scholar : PubMed/NCBI
|
|
32
|
Hsu PK, Chen HY, Yeh YC, Yen CC, Wu YC,
Hsu CP, Hsu WH and Chou TY: TPX2 expression is associated with cell
proliferation and patient outcome in esophageal squamous cell
carcinoma. J Gastroenterol. 49:1231–1240. 2014. View Article : Google Scholar : PubMed/NCBI
|
|
33
|
Glaser ZA, Love HD, Guo S, Gellert L,
Chang SS, Herrell SD, Barocas DA, Penson DF, Cookson MS and Clark
PE: TPX2 as a prognostic indicator and potential therapeutic target
in clear cell renal cell carcinoma. Urol Oncol. 35:286–293. 2017.
View Article : Google Scholar : PubMed/NCBI
|
|
34
|
Tomii C, Inokuchi M, Takagi Y, Ishikawa T,
Otsuki S, Uetake H, Kojima K and Kawano T: TPX2 expression is
associated with poor survival in gastric cancer. World J Surg
Oncol. 15:142017. View Article : Google Scholar : PubMed/NCBI
|
|
35
|
Wang Z, Katsaros D, Shen Y, Fu Y, Canuto
EM, Benedetto C, Lu L, Chu WM, Risch HA and Yu H: Biological and
clinical significance of MAD2L1 and BUB1, genes frequently
appearing in expression signatures for breast cancer prognosis.
PLoS One. 10:e01362462015. View Article : Google Scholar : PubMed/NCBI
|
|
36
|
Sun Q, Zhao H, Zhang C, Hu T, Wu J, Lin X,
Luo D, Wang C, Meng L, Xi L, et al: Gene co-expression network
reveals shared modules predictive of stage and grade in serous
ovarian cancers. Oncotarget. 8:42983–42996. 2017.PubMed/NCBI
|
|
37
|
Li L, Xu DB, Zhao XL and Hao TY:
Combination analysis of Bub1 and Mad2 expression in endometrial
cancer: Act as a prognostic factor in endometrial cancer. Arch
Gynecol Obstet. 288:155–165. 2013. View Article : Google Scholar : PubMed/NCBI
|
|
38
|
Wang Z, Trope CG, Florenes VA, Suo Z,
Nesland JM and Holm R: Overexpression of CDC25B, CDC25C and
phospho-CDC25C (Ser216) in vulvar squamous cell carcinomas are
associated with malignant features and aggressive cancer
phenotypes. BMC Cancer. 10:2332010. View Article : Google Scholar : PubMed/NCBI
|
|
39
|
Nakamura N, Yamamoto H, Yao T, Oda Y,
Nishiyama K, Imamura M, Yamada T, Nawata H and Tsuneyoshi M:
Prognostic significance of expressions of cell-cycle regulatory
proteins in gastrointestinal stromal tumor and the relevance of the
risk grade. Hum Pathol. 36:828–837. 2005. View Article : Google Scholar : PubMed/NCBI
|
|
40
|
Alin A: Multicollinearity. Wiley
Interdiscip Rev Comput Stat. 2:370–374. 2010. View Article : Google Scholar
|