Introduction
Hepatocellular carcinoma (HCC) is the most common
type of primary liver cancer in adults, the fifth most common type
of cancer and the third leading cause of cancer-associated
mortality worldwide (1). HCC is
closely associated with chronic viral hepatitis infection and
exposure to toxins, including alcohol and aflatoxin (2). Other diseases can markedly increase the
risk of HCC, including chronic liver inflammation, hemochromatosis
and α1-antitrypsin deficiency (3,4). Chronic
infections of hepatitis B and/or C contribute to the development of
HCC by repeatedly causing the immune system to attack the liver
cells, and consumption of large amounts of alcohol can have a
similar effect (5). The prevalence of
aflatoxin and hepatitis B has caused relatively high rates of HCC
in a number of developing countries (6,7). Aflatoxin
is produced by certain Aspergillus fungus species, and is a
carcinogen known to contribute to the carcinogenesis of HCC
(6). Tumors can develop following a
mutation to cellular machinery, causing the cell to replicate at a
higher rate and/or the avoidance of apoptosis (8). Numerous genes have been reported to
serve roles in HCC carcinogenesis, which may be exploitable for the
development of effective prevention and treatment regimens for HCC
(9,10). Downregulated expression of human PMS1
homolog 2, mismatch repair system component (hPMS2) provides
a growth advantage and stimulates proliferation of HCC cells, and
it is believed that hPMS2 is involved at an early stage of HCC
(11). Knockdown of DLC1 has
been demonstrated to aid MYC in the induction of hepatoblast
transformation in vitro, and in the development of HCC in
vivo (12). Another study
demonstrated that the ‘cell cycle’ pathway and cell division cycle
25a may be crucial in the pathogenesis and progression of HCC
(13). In addition, hypermethylation
of DNA has been implicated as an early event in
hepatocarcinogenesis (14). A
mate-analysis study provided empirical evidence that abnormal
suppressor of cytokine signaling 1 (SOCS1)
promoter-methylation may contribute to the pathogenesis of HCC
(15). Retinol metabolism genes and
serine hydroxymethyltransferase 1 have also been indicated to be
epigenetically regulated through promoter DNA methylation in
alcohol-associated HCC (16).
However, our incomplete understanding of the molecular and cellular
mechanisms that drive HCC limits the available therapeutic options.
In the present study, three gene expression profiles and a DNA
methylation profile were jointly analyzed in order to identify
biomarkers of HCC.
Materials and methods
Gene expression and DNA methylation
profiles
The gene expression profiles, GSE95698, GSE49515
(17) and GSE76427, and DNA
methylation prolife, GSE73003, were downloaded from the Gene
Expression Omnibus (GEO) database (www.ncbi.nlm.nih.gov/geo/). A total of 3 human HCC
tissue samples (HCC group) and their matching paracancerous tissue
samples (control group) were selected from GSE95698, and the genes
were detected using the Agilent-039494 SurePrint G3 Human GE V2
8×60 K Microarray 039381 platform. Data regarding 20 peripheral
blood samples from 10 HCC patients (HCC group) and 10 healthy
people (control group) were selected from the GSE49515 profile, and
the genes were detected with Affymetrix Human Genome U133 Plus 2.0
Array. A total of 115 HCC tissue samples (HCC group) and 52
paracancerous tissue samples (control group) were selected from
GSE76427, which were detected using an Illumina HumanHT-12 V4.0
expression beadchip. A total of 20 HCC tissue samples (HCC group)
and 20 non-tumor tissue samples (control group) were selected from
GSE73003, which were detected using an Illumina HumanMethylation27
BeadChip (Human Methylation27_270596_V1.2).
Data processing and differential
analysis
For the gene expression profiles of GSE95698,
GSE49515 and GSE76427, the raw data were obtained and normalized
using the preprocess Core function package (version 3.5; http://www.bioconductor.org/packages/release/bioc/html/preprocessCore.html).
If multiple probes corresponded to the same gene, the average
expression of these probes was used as the expression value of the
gene. Subsequently, the differentially expressed genes (DEGs) in
the HCC group compared with control group for the 3 sets of gene
expression profiles were identified using the limma software
package (version 3.18.13; http://www.bioconductor.org/packages/2.13/bioc/html/limma.html).
P<0.05 and |log (fold-change)|>0.5 were used as the DEG
threshold criteria. Thus, 3 sets of DEGs were obtained and the
overlapping DEGs were selected for further study. For the DNA
methylation profile of GSE73003, the preprocess Core function
package (version 3.5) was used for normalization, and the
differentially methylated sites (DMSs) were identified with the
β-distribution test and t-test using a threshold of P<0.05.
Overlaps between the overlapping DEGs and the differentially
methylated sites were further studied.
Functional- and pathway-enrichment
analyses of the overlapping DEGs
The Database for Annotation, Visualization and
Integrated Discovery (DAVID; version 6.8; http://david.ncifcrf.gov/) is a widely used web-based
tool for functional and pathway enrichment analyses (18). In the present study, it was used to
perform Gene Ontology (GO) and Kyoto Encyclopedia of Genes and
Genomes (KEGG) pathway enrichment analysis of the overlapping DEGs.
The GO terms and KEGG pathways with P<0.05 were selected.
Construction of the protein-protein
interaction (PPI) network
Search Tool for the Retrieval of Interacting Genes
(STRING; http://string-db.org) is a biological
database and web resource used to identify known and predicted PPIs
(19). In the present study, the PPI
network of the overlapping DEGs was constructed using STRING
(version 10.0) and visualized using Cytoscape software (version
3.5.1; http://www.cytoscape.org/download.php). Significant
nodes were selected using a threshold score of >500 (obtained
via STRING).
Patients
A total of 5 HCC patients (3 male and 2 female; age
range, 32–65 years old; mean age 52.5 years old) were accepted in
the Second People's Hospital of Tianjin (Tianjin, China) between
November 2016 and May 2017. Tumor and paracancerous tissue
specimens were collected. All patients signed informed consent
prior to enrollment in the study, and all procedures were conducted
under the ethical approval of the Second People's Hospital of
Tianjin and the Chinese national research committee.
Reverse transcription-quantitative
polymerase chain reaction (RT-qPCR)
RT-qPCR and methylation-specific PCR (MSP) were
performed to detect the mRNA expression level and methylation
status of Denticleless protein homolog (DTL), Dual
specificity phosphatase 1 (DUSP1), Nuclear factor
k-light-chain gene enhancer of activated B cells inhibitor, a
(NFKBIA) and SOCS2. The total RNA was extracted using
TRIzol (Invitrogen; Scientific, Inc., Waltham, MA, USA). The
PrimeScript® 1st Stand cDNA Synthesis kit
(Takara Biotechnology Co., Ltd., Dalian, China), the
SYBR® Premix Ex Taq™ kit (Takara Bio, Inc., Otsu, Japan)
and the Applied Biosystems™ QuantStudio™ 5 Real-Time PCR System
(Applied Biosystems; Thermo Fisher Scientific, Inc.) were used to
conduct RT-PCR, according to the manufacturer's instructions. The
reaction conditions of reverse transcription were as follows: 30°C
for 10 min, 42°C for 60 min, and 95°C for 5 min. The EZ-DNA
Methylation-Gold kit™ (Zymo Research Corp., Irvine, CA,
USA) was used to conduct MSP, according to the manufacturer's
instructions. All primers were designed and synthesized by Takara
Biomedical Technology Co., Ltd. (Beijing, China), and their
sequences are listed in Table I.
β-actin was used as an internal control. The thermocycling
conditions were as follows: 95°C for 5 min; followed by 40 cycles
of 95°C for 15 sec, 60°C for 30 sec, and 72°C for 35 sec; and a
final 5 min at 72°C extension. The 2−ΔΔCt method was
used to calculate the relative expression value of the target gene
(20).
 | Table I.Primer sequences. |
Table I.
Primer sequences.
| Gene | Primer sequences
(5′-3′) | Size (bp) |
|---|
| DTL (mRNA) |
| 490 |
|
Forward |
CCTCTGTCCGATCCTCCAAA |
|
|
Reverse |
AAAGATTTTCAGTCCCGCGG |
|
| DTL (methyl) |
| 152 |
|
Forward |
TTTTTTGTTCGATTTTTTAAAGACG |
|
|
Reverse |
TAATAACCCTACAACTCTACCCGAA |
|
| DUSP1 (mRNA) |
| 490 |
|
Forward |
AGAATGTTCCTGACTCGGCA |
|
|
Reverse |
AAGCAAAATCCAATCCCGGG |
|
| DUSP1 (methyl) |
| 142 |
|
Forward |
AGGCGAAAATATATAAGTTAAGCGA |
|
|
Reverse |
AATACCGAATCAAAAACATTCTACG |
|
| NFKBIA (mRNA) |
| 560 |
|
Forward |
AGCGATGGGGTCTCACTATG |
|
|
Reverse |
TCCAACAGCTTAGGTCAGGG |
|
| NFKBIA
(methyl) |
| 147 |
|
Forward |
ATTTTAGTTTTTTAAGTAGGTGCGA |
|
|
Reverse |
ATAAAACAAAAAAATCACTTACGTT |
|
| SOCS2 (mRNA) |
| 630 |
|
Forward |
GCTTGGGGTTAAATGGTGCA |
|
|
Reverse |
AAGGGATGGGGCTCTTTCTC |
|
| SOCS2 (methyl) |
| 181 |
|
Forward |
GTATTGATTTTAAGGAAGGACGC |
|
|
Reverse |
CCTACGAAAATAACTCCTCCG |
|
| β-actin (mRNA) |
| 308 |
|
Forward |
CATCTCTTGCTCGAAGTCCA |
|
|
Reverse |
ATCATGTTTGAGACCTTCAACA |
|
| β-actin
(methyl) |
| 110 |
|
Forward |
ATTATTATTGGTAATGAGCGGTTTC |
|
|
Reverse |
TTCATAATAAAATTAAATATAATTTCGTA |
|
Statistical analysis
SPSS (version 17; SPSS Inc., Chicago, IL, USA) was
used for all statistical analyses, and data are expressed as the
mean ± standard deviation. Student's t-test was used to compare 2
groups. P<0.05 was considered to indicate a statistically
significant difference.
Results
DEGs and DMSs
A total of 1,402 (562 upregulated and 840
downregulated), 2,049 (859 upregulated and 1,190 downregulated) and
2,159 (1,339 upregulated and 820 downregulated) DEGs were
separately identified in the HCC group compared with control group
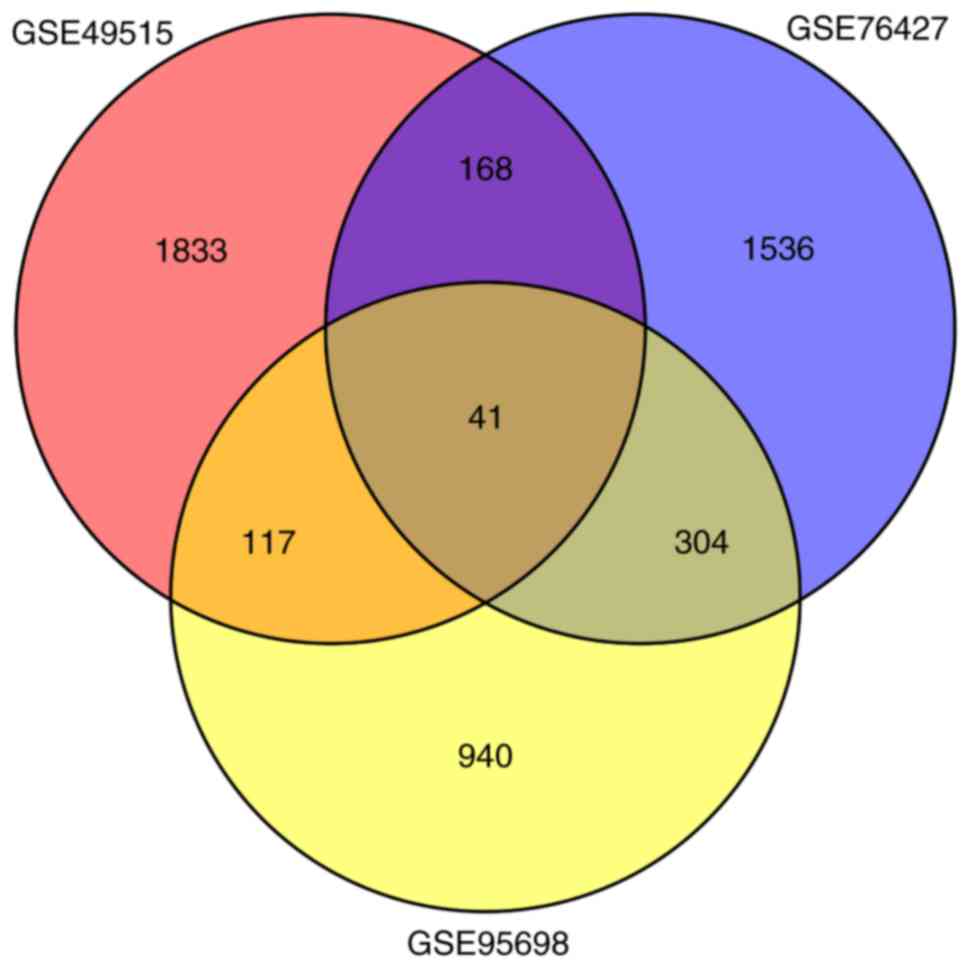
in GSE95698, GSE49515 and GSE76427, respectively. A total of 41
overlaps were identified among all 3 sets of DEGs (Fig. 1; Table
II). Among these, 8 genes were upregulated simultaneously
[CCNB1, CEP55, DTL, Endothelial cell specific molecule 1
(ESM1), NEU1, RRM2, UHRF1 and VPS72], and 14
genes were downregulated simultaneously (CCL21, CYP1A1, DAO,
DUSP1, GABARAPL1, GADD45B, HSD11B1, NFIL3, NFKBIA, NR4A2, NSUN6,
RHOB, SLC27A2 and TRIB1) in the 3 sets of DEGs.
| Table II.Overlapping differentially expressed
genes in the hepatocellular carcinoma group compared with the
control group in GSE95698, GSE49515 and GSE76427. |
Table II.
Overlapping differentially expressed
genes in the hepatocellular carcinoma group compared with the
control group in GSE95698, GSE49515 and GSE76427.
| A, GSE49515 |
|---|
|
|---|
| Genes | Mean lgFC | P-value |
|---|
| CCNB1 | 0.80 |
2.09×10⁻³ |
| CEP55 | 1.14 |
1.25×10⁻³ |
| DTL | 0.83 |
9.88×10⁻³ |
| ESM1 | 0.53 |
4.88×10⁻³ |
| NEU1 | 0.78 |
2.31×10⁻⁷ |
| RRM2 | 0.56 |
2.41×10⁻² |
| UHRF1 | 1.04 |
7.11×10⁻⁴ |
| VPS72 | 0.65 |
7.69×10⁻⁵ |
| CCL21 | −0.60 |
8.37×10⁻⁵ |
| CYP1A1 | −0.57 |
1.40×10⁻⁴ |
| DAO | −3.93 |
1.53×10⁻⁸ |
| DUSP1 | −1.11 |
1.64×10⁻⁵ |
| GABARAPL1 | −0.73 |
3.31×10⁻⁵ |
| GADD45B | −0.66 |
9.85×10⁻⁷ |
| HSD11B1 | −0.90 |
6.32×10⁻³ |
| NFIL3 | −1.66 |
1.04×10⁻⁶ |
| NFKBIA | −0.78 |
4.47×10⁻³ |
| NR4A2 | −2.5 |
2.49×10⁻⁶ |
| NSUN6 | −0.6 |
4.80×10⁻³ |
| RHOB | −0.88 |
1.13×10⁻⁵ |
| SLC27A2 | −1.43 |
1.49×10⁻⁴ |
| TRIB1 | −0.53 |
1.26×10⁻³ |
| ABHD6 | 1.02 |
1.20×10⁻⁷ |
| AKR7A3 | 0.92 |
1.65×10⁻⁵ |
| ALDH8A1 | 0.85 |
1.12×10⁻² |
| ANG | 1.51 |
1.13×10⁻⁵ |
| C11orf24 | 0.58 |
2.66×10⁻⁴ |
| CLEC1B | 2.09 |
3.86×10⁻³ |
| CYP2J2 | 0.52 |
1.12×10⁻² |
| EOMES | 0.64 |
4.07×10⁻² |
| GHR | 1.62 |
1.67×10⁻⁵ |
| GZMK | 0.67 |
4.42×10⁻³ |
| ITPRIPL2 | 0.55 |
1.58×10⁻³ |
| PDK4 | 0.61 |
4.69×10⁻³ |
| RARRES3 | 1.98 |
1.48×10⁻⁴ |
| SESTD1 | −0.54 |
1.81×10⁻⁴ |
| SOCS2 | 0.85 |
1.26×10⁻⁵ |
| ST3GAL6 | 0.56 |
5.16×10⁻³ |
| TMEM45A | 1.28 |
3.71×10⁻² |
| UGP2 | 0.86 |
8.84×10⁻⁶ |
| XAF1 | 0.81 |
1.55×10⁻² |
|
| B,
GSE76427 |
|
| Genes | Mean
lgFC | P-value |
|
| CCNB1 | 0.62 |
1.77×10⁻¹³ |
| CEP55 | 0.75 |
3.33×10⁻¹² |
| DTL | 0.60 |
3.92×10⁻¹⁰ |
| ESM1 | 1.13 |
8.87×10⁻¹³ |
| NEU1 | 0.71 |
5.27×10⁻¹¹ |
| RRM2 | 0.51 |
1.55×10⁻¹³ |
| UHRF1 | 0.59 |
1.34×10⁻¹² |
| VPS72 | 0.56 |
3.47×10⁻¹⁷ |
| CCL21 | −0.81 |
1.01×10⁻⁴ |
| CYP1A1 | −0.72 |
1.69×10⁻² |
| DAO | −0.56 |
7.49×10⁻⁶ |
| DUSP1 | −0.77 |
1.65×10⁻⁵ |
| GABARAPL1 | −1.27 |
3.43×10⁻¹⁷ |
| GADD45B | −1.40 |
2.45×10⁻¹⁵ |
| HSD11B1 | −0.59 |
1.83×10⁻² |
| NFIL3 | −0.53 |
1.39×10⁻⁶ |
| NFKBIA | −0.63 |
4.06×10⁻¹¹ |
| NR4A2 | −0.51 |
9.59×10⁻⁴ |
| NSUN6 | −0.89 |
1.34×10⁻¹⁷ |
| RHOB | −1.09 |
1.25×10⁻¹⁰ |
| SLC27A2 | −0.83 |
3.90×10⁻⁷ |
| TRIB1 | −0.99 |
1.79×10⁻¹² |
| ABHD6 | −0.87 |
3.63×10⁻¹⁶ |
| AKR7A3 | −1.04 |
1.15×10⁻⁸ |
| ALDH8A1 | −1.12 |
2.44×10⁻¹⁶ |
| ANG | −0.70 |
4.79×10⁻⁶ |
| C11orf24 | −0.74 |
3.27×10⁻¹² |
| CLEC1B | −3.49 |
2.37×10⁻³² |
| CYP2J2 | −0.88 |
3.49×10⁻¹⁰ |
| EOMES | −0.68 |
1.94×10⁻⁷ |
| GHR | −2.04 |
5.96×10⁻²² |
| GZMK | −0.58 |
7.91×10⁻⁴ |
| ITPRIPL2 | −0.55 |
5.94×10⁻⁶ |
| PDK4 | −0.97 |
5.40×10⁻⁷ |
| RARRES3 | −0.55 |
4.11×10⁻⁵ |
| SESTD1 | 0.78 |
4.46×10⁻¹⁸ |
| SOCS2 | −1.42 |
6.75×10⁻¹⁶ |
| ST3GAL6 | −1.31 |
4.97×10⁻¹⁷ |
| TMEM45A | −0.88 |
1.55×10⁻⁵ |
| UGP2 | −0.74 |
1.02×10⁻¹³ |
| XAF1 | −0.89 |
2.72×10⁻⁸ |
|
| C,
GSE95698 |
|
| Genes | Mean
lgFC | P-value |
|
| CCNB1 | 2.29 |
1.92×10⁻² |
| CEP55 | 2.00 |
2.17×10⁻² |
| DTL | 3.32 |
1.93×10⁻³ |
| ESM1 | 6.12 |
1.75×10⁻³ |
| NEU1 | 1.18 |
2.25×10⁻² |
| RRM2 | 2.23 |
4.49×10⁻² |
| UHRF1 | 2.63 |
1.79×10⁻² |
| VPS72 | 1.16 |
2.32×10⁻² |
| CCL21 | −2.05 |
4.34×10⁻² |
| CYP1A1 | −5.69 |
6.24×10⁻⁵ |
| DAO | −4.92 |
4.83×10⁻² |
| DUSP1 | −1.66 |
1.55×10⁻² |
| GABARAPL1 | −1.64 |
1.07×10⁻² |
| GADD45B | −2.17 |
2.79×10⁻³ |
| HSD11B1 | −3.30 |
1.10×10⁻² |
| NFIL3 | −1.04 |
3.03×10⁻² |
| NFKBIA | −0.90 |
4.79×10⁻² |
| NR4A2 | −2.76 |
9.34×10⁻³ |
| NSUN6 | −1.85 |
2.99×10⁻² |
| RHOB | −1.94 |
1.13×10⁻² |
| SLC27A2 | −3.15 |
4.95×10⁻² |
| TRIB1 | −1.88 |
1.74×10⁻² |
| ABHD6 | −2.22 |
9.50×10⁻³ |
| AKR7A3 | −2.81 |
2.15×10⁻² |
| ALDH8A1 | −3.97 |
3.41×10⁻² |
| ANG | −2.44 |
3.99×10⁻² |
| C11orf24 | −1.00 |
4.95×10⁻² |
| CLEC1B | −7.55 |
6.77×10⁻⁵ |
| CYP2J2 | −3.32 |
2.29×10⁻² |
| EOMES | −3.02 |
6.40×10⁻³ |
| GHR | −4.4 |
2.30×10⁻² |
| GZMK | −2.42 |
2.89×10⁻² |
| ITPRIPL2 | 0.99 |
3.91×10⁻² |
| PDK4 | −2.39 |
4.18×10⁻² |
| RARRES3 | −1.76 |
9.60×10⁻³ |
| SESTD1 | 1.88 |
3.61×10⁻² |
| SOCS2 | −2.21 |
2.07×10⁻² |
| ST3GAL6 | −2.76 |
2.32×10⁻³ |
| TMEM45A | −2.25 |
1.37×10⁻² |
| UGP2 | −1.42 |
3.12×10⁻² |
| XAF1 | −1.51 |
1.79×10⁻² |
For GSE73003, a total of 6,349 (2,854 upregulated
and 3,495 downregulated) DMSs were identified in the HCC group
compared with the control group, and the top 40 most-significant
DMSs are listed in Table III. A
total of 12 genes were among the 41 overlapping DEGs and the
differentially methylated genes, and they are presented in Fig. 2. The expressions of DTL, DUSP1,
eomesodermin (EOMES), ESM1, NFKBIA and SOCS2
were negatively with their methylation levels.
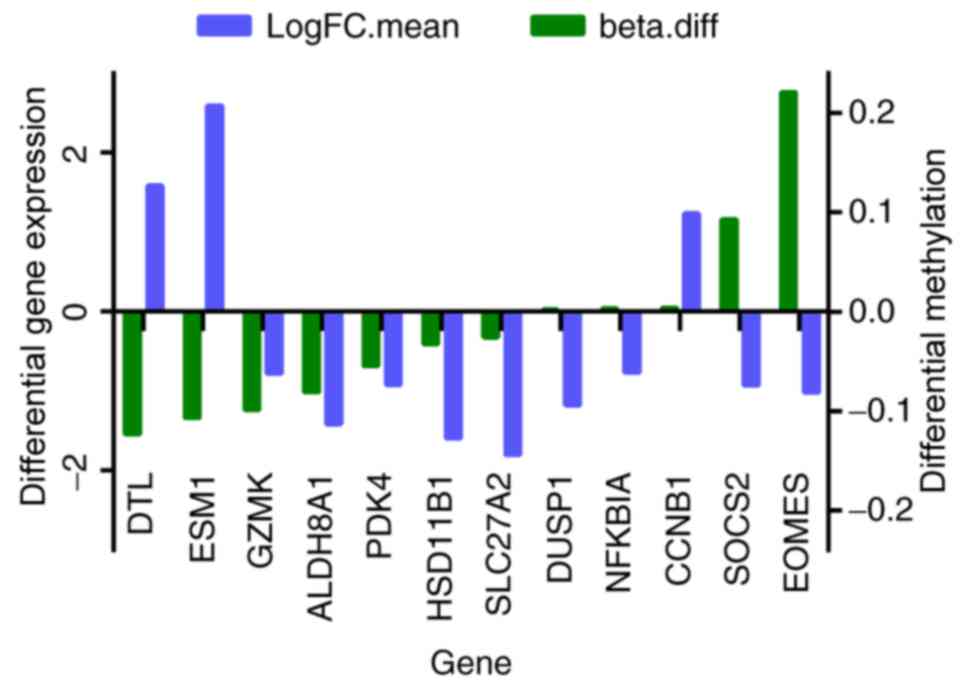 | Figure 2.In total, 12 overlapping genes were
differentially expressed and methylated in the HCC group compared
with control. Beta.diff, fold-change in gene methylation level;
LogFC.mean, fold-change in gene differential expression; HCC,
hepatocellular carcinoma; DTL, denticleless E3 ubiquitin protein
ligase; ESM1, endothelial cell specific molecule 1; GZMK, granzyme
K; ALDH8A1, aldehyde dehydrogenase 8 family, member A1; PDK4,
pyruvate dehydrogenase kinase 4; HSD11B1, hydroxysteroid 11-beta
dehydrogenase 1; SLC27A2, solute carrier family 27 member 2; DUSP1,
dual specificity phosphatase 1; NFKBIA, nuclear factor of kappa
light polypeptide gene enhancer in B cells inhibitor, α; CCNB1,
cyclin B1; SOCS2, suppressor of cytokine signaling 2; EOMES,
eomesodermin. |
| Table III.The top 40 most significant
differentially methylated sites in the hepatocellular carcinoma
group compared with the control group. |
Table III.
The top 40 most significant
differentially methylated sites in the hepatocellular carcinoma
group compared with the control group.
| Gene | Regulation | P-value | Db-value |
|---|
| LYPD3 | Up |
1.13×10⁻¹¹ | 0.26 |
| FLJ21159 | Up |
1.70×10⁻¹¹ | 0.26 |
| ZNF154 | Up |
2.94×10⁻¹¹ | 0.52 |
| ZNF540 | Up |
7.96×10⁻¹¹ | 0.33 |
| GPR25 | Up |
8.68×10⁻¹¹ | 0.20 |
| MS4A3 | Down |
9.61×10⁻¹¹ | −0.23 |
| LDHB | Up |
1.62×10⁻¹⁰ | 0.44 |
| ALOX12 | Up |
1.65×10⁻¹⁰ | 0.12 |
| PRKG2 | Down |
1.99×10⁻¹⁰ | −0.31 |
| FLJ25773 | Down |
2.10×10⁻¹⁰ | −0.24 |
| PKDREJ | Up |
2.14×10⁻¹⁰ | 0.17 |
| TBC1D1 | Up |
2.47×10⁻¹⁰ | 0.13 |
| SLC39A12 | Down |
2.94×10⁻¹⁰ | −0.30 |
| SERHL | Up |
2.98×10⁻¹⁰ | 0.26 |
| C6orf206 | Up |
3.19×10⁻¹⁰ | 0.32 |
| C11orf2 | Up |
3.22×10⁻¹⁰ | 0.06 |
| CCDC37 | Up |
3.39×10⁻¹⁰ | 0.32 |
| LILRA1 | Down |
3.79×10⁻¹⁰ | −0.21 |
| OR51B4 | Down |
4.22×10⁻¹⁰ | −0.27 |
| HDAC1 | Down |
4.30×10⁻¹⁰ | −0.05 |
| XLF | Down |
5.08×10⁻¹⁰ | −0.04 |
| KCTD4 | Up |
5.57×10⁻¹⁰ | 0.24 |
| INA | Up |
5.58×10⁻¹⁰ | 0.34 |
| ABHD9 | Up |
6.00×10⁻¹⁰ | 0.42 |
| AQP6 | Down |
6.06×10⁻¹⁰ | −0.07 |
| ANKRD33 | Up |
6.90×10⁻¹⁰ | 0.19 |
| TSPYL5 | Up |
9.71×10⁻¹⁰ | 0.26 |
| RPS6KC1 | Down |
1.19×10⁻⁹ | −0.07 |
| FLJ13149 | Down |
1.33×10⁻⁹ | −0.06 |
| FCAR | Down |
1.38×10⁻⁹ | −0.22 |
| CD1B | Down |
1.40×10⁻⁹ | −0.23 |
| KLK2 | Down |
1.50×10⁻⁹ | −0.21 |
| CDH18 | Down |
1.50×10⁻⁹ | −0.34 |
| BOLL | Up |
1.67×10⁻⁹ | 0.24 |
| SGNE1 | Up |
1.67×10⁻⁹ | 0.25 |
| CYP11B1 | Down |
1.75×10⁻⁹ | −0.38 |
| S100A8 | Down |
1.92×10⁻⁹ | −0.21 |
| MAPKAP1 | Down |
2.01×10⁻⁹ | −0.06 |
| QTRT1 | Down |
2.21×10⁻⁹ | −0.09 |
| KLK9 | Down |
2.32×10⁻⁹ | −0.20 |
| FLJ46481 | Down |
2.35×10⁻⁹ | −0.24 |
Enriched GO terms and KEGG
pathways
The overlapping DEGs were enriched in 11 GO terms
and 3 KEGG pathways, listed in Tables
IV and V, respectively.
| Table IV.Enriched GO terms of the overlapping
differentially expressed genes. |
Table IV.
Enriched GO terms of the overlapping
differentially expressed genes.
| Category | Term | Number of enriched
genes | P-value |
|---|
| BP | GO:0044255:
Cellular lipid metabolic process | 8 | <0.01 |
| BP | GO:0008610: Lipid
biosynthetic process | 5 | 0.01 |
| BP | GO:0071310:
Cellular response to organic substance | 8 | 0.03 |
| BP | GO:1901701:
Cellular response to oxygen-containing compound | 5 | 0.04 |
| BP | GO:0043436: Oxoacid
metabolic process | 5 | 0.04 |
| BP | GO:0031668:
Cellular response to extracellular stimulus | 3 | 0.04 |
| BP | GO:0044242:
Cellular lipid catabolic process | 3 | 0.04 |
| BP | GO:0006082: Organic
acid metabolic process | 5 | 0.05 |
| CC | GO:0043231:
Intracellular membrane-bounded organelle | 23 | 0.05 |
| MF | GO:0016712:
Oxidoreductase activity, acting on paired donors, with
incorporation or reduction of molecular oxygen, reduced flavin or
flavoprotein as one donor, and incorporation of one atom of
oxygen | 2 | <0.01 |
| MF | GO:0020037: Heme
binding | 2 | 0.03 |
| Table V.Enriched Kyoto Encyclopedia of Genes
and Genomes pathways of the overlapping differentially expressed
genes. |
Table V.
Enriched Kyoto Encyclopedia of Genes
and Genomes pathways of the overlapping differentially expressed
genes.
| Term | Number of enriched
genes | P-value | Genes |
|---|
| cfa04115: P53
signaling pathway | 3 | 0.012539936 | CCNB1, RRM2,
GADD45B |
| cfa04068: Foxo
signaling pathway | 3 | 0.046310836 | CCNB1, GABARAPL1,
GADD45B |
| cfa01100: Metabolic
pathways | 7 | 0.081506099 | CYP2J2, CYP1A1,
RRM2, ST3GAL6, HSD11B1, DAO, UGP2 |
The PPI network
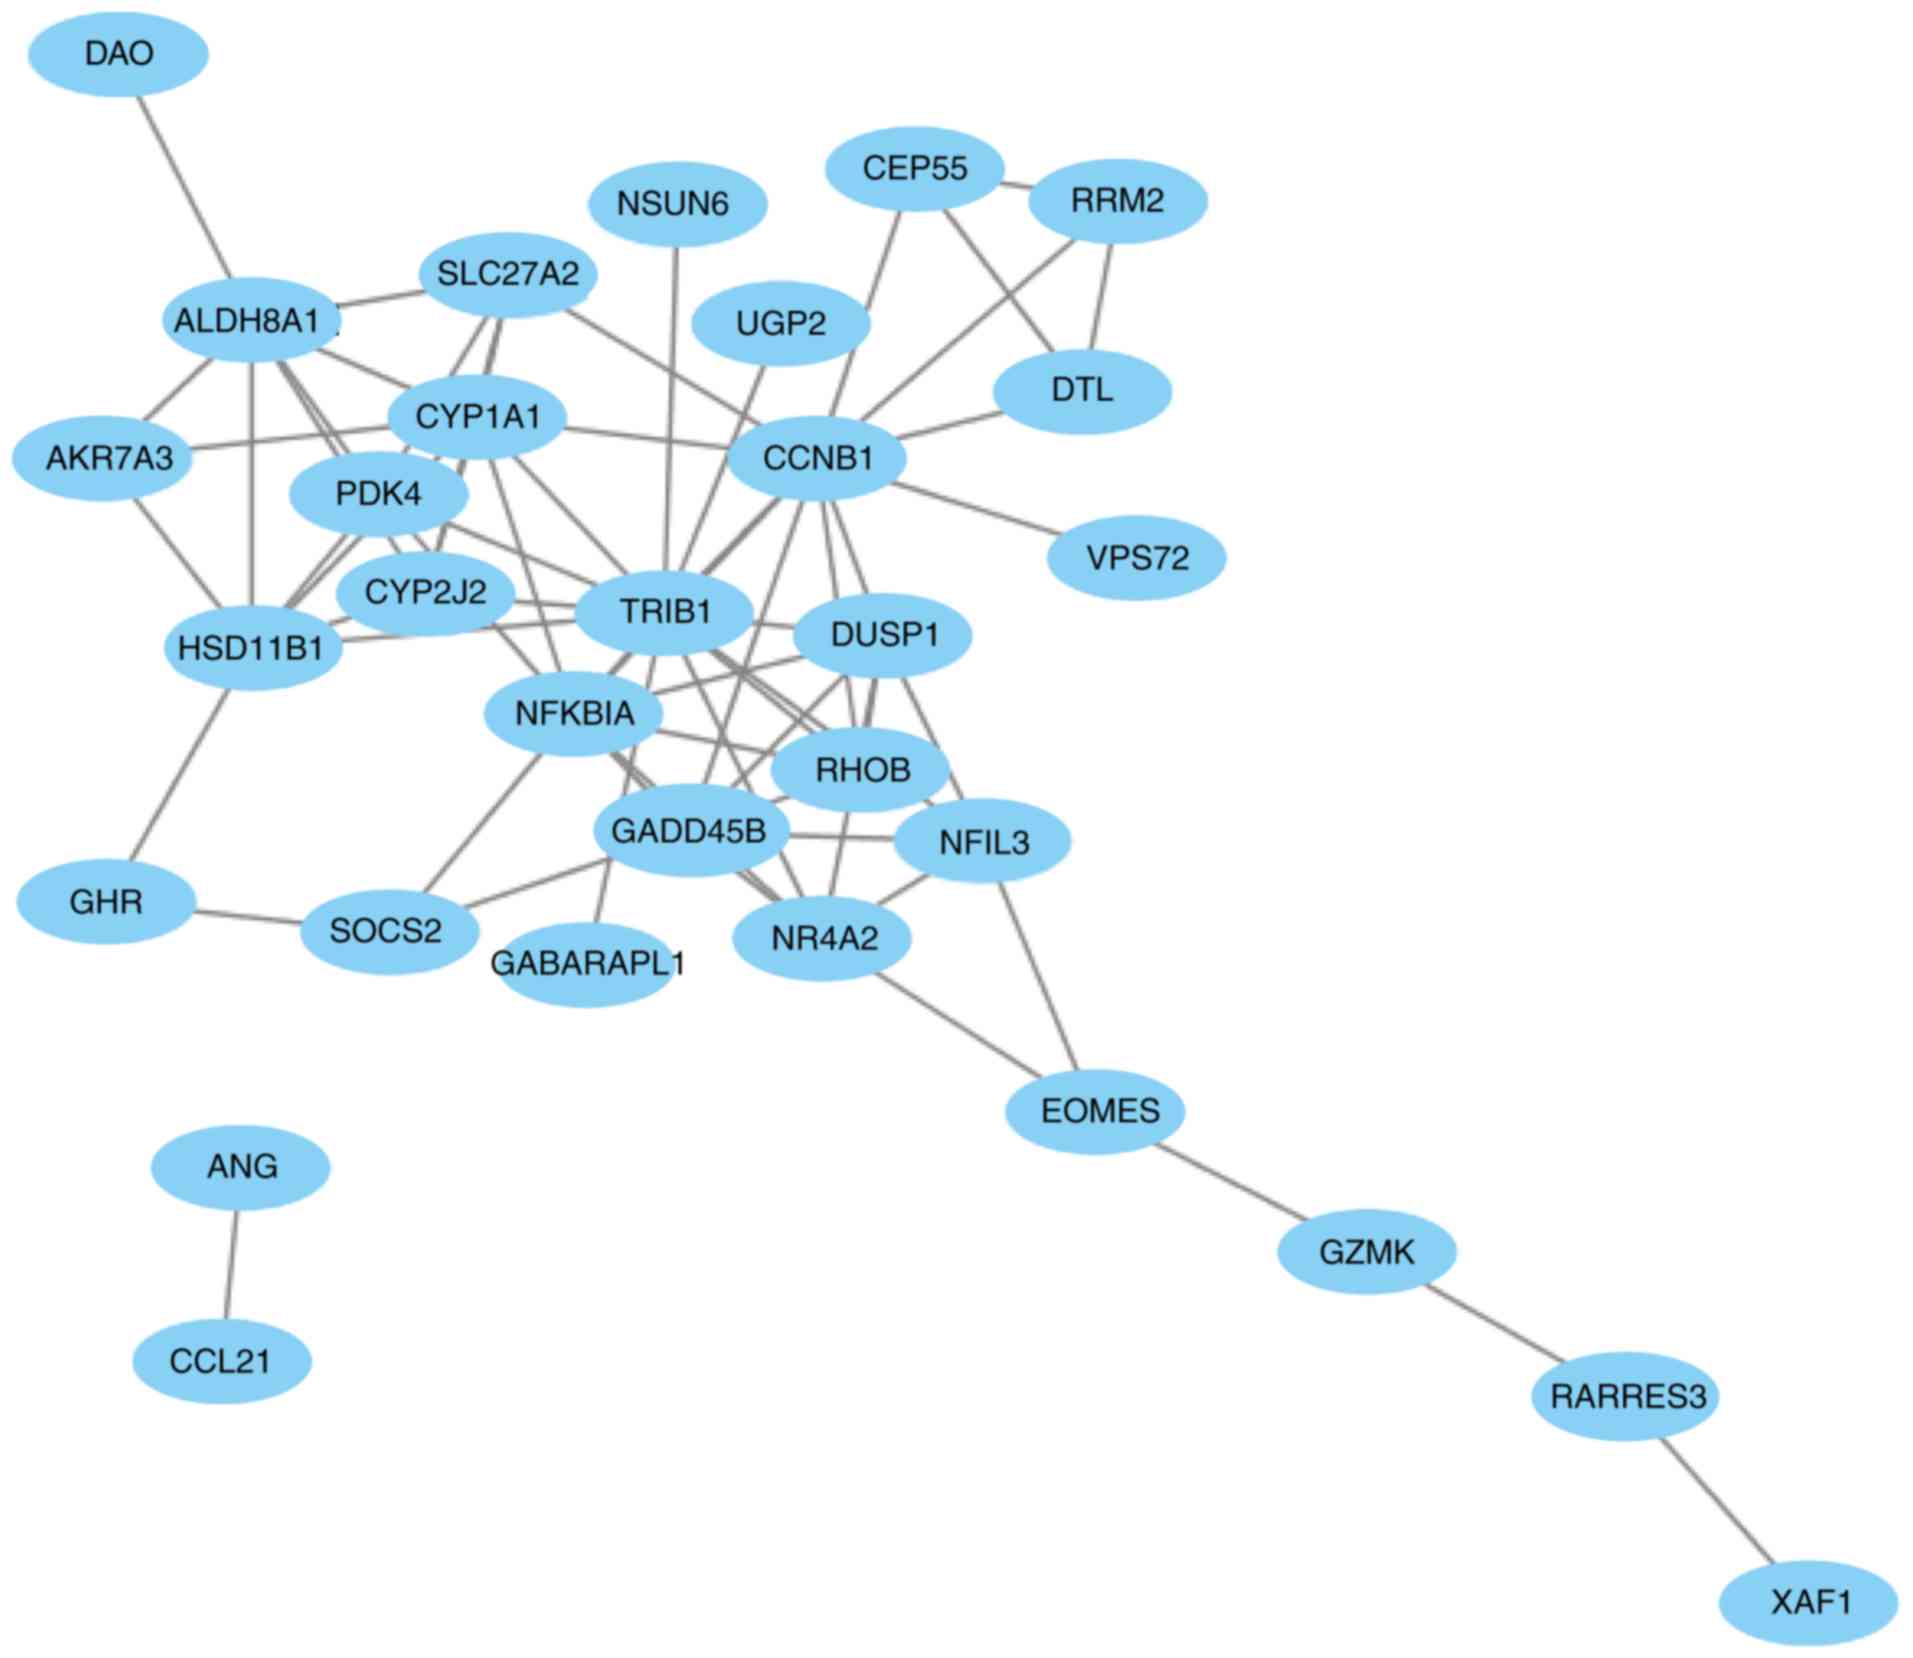
The PPI network of the 41 overlapping DEGs,
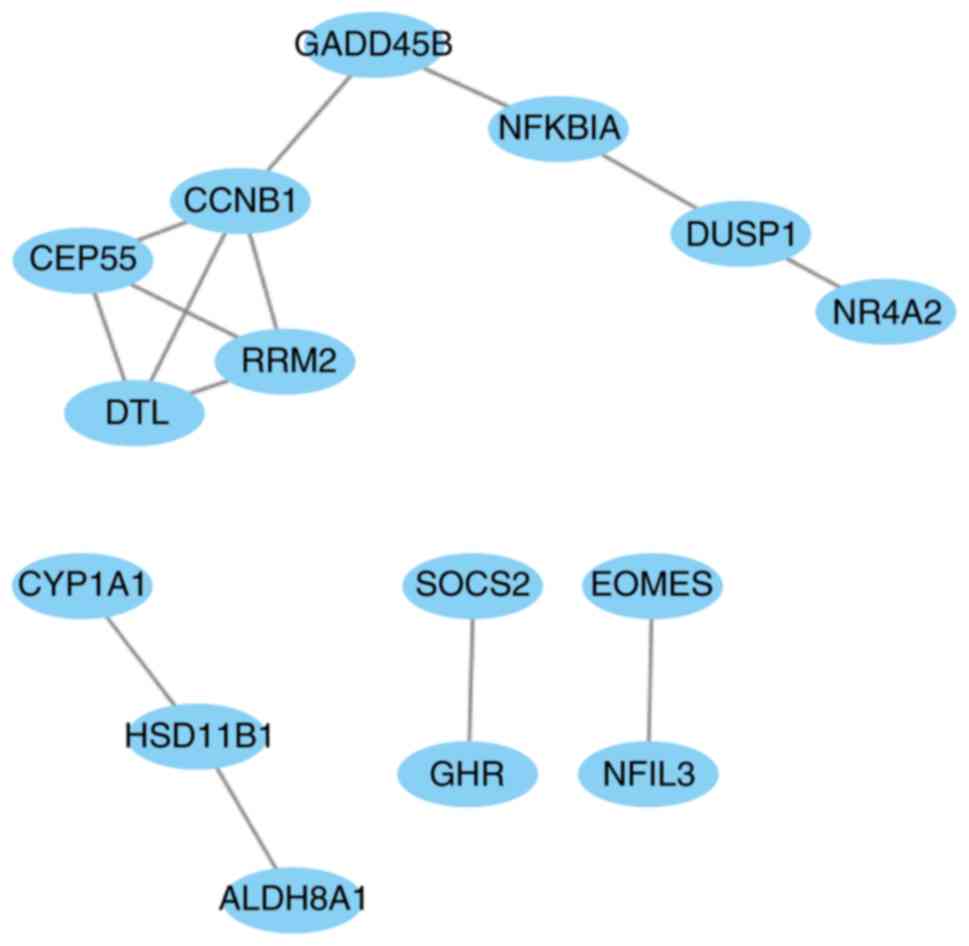
including 66 interaction pairs, is presented in Fig. 3. Furthermore, the PPI network of nodes
with scores >500 is presented in Fig.
4, including DTL, DUSP1, NFKBIA and SOCS2.
DTL was differentially expressed (upregulated) and
differentially methylated (hypomethylated). DUSP1, NFKBIA
and SOCS2 were differentially expressed (downregulated) and
differentially methylated (upregulated). The results of RT-qPCR and
MSP are presented in Fig. 5. The mRNA
expression of DTL was significantly increased in HCC tissue
compared with paracancerous samples, and the mRNA expression of
DUSP1, NFKBIA and SOCS2 was significantly decreased
(P<0.05). Furthermore, the opposite effect on the methylation
levels of these genes was observed (P<0.05). These results were
consistent with those of the bioinformatics differential expression
analysis.
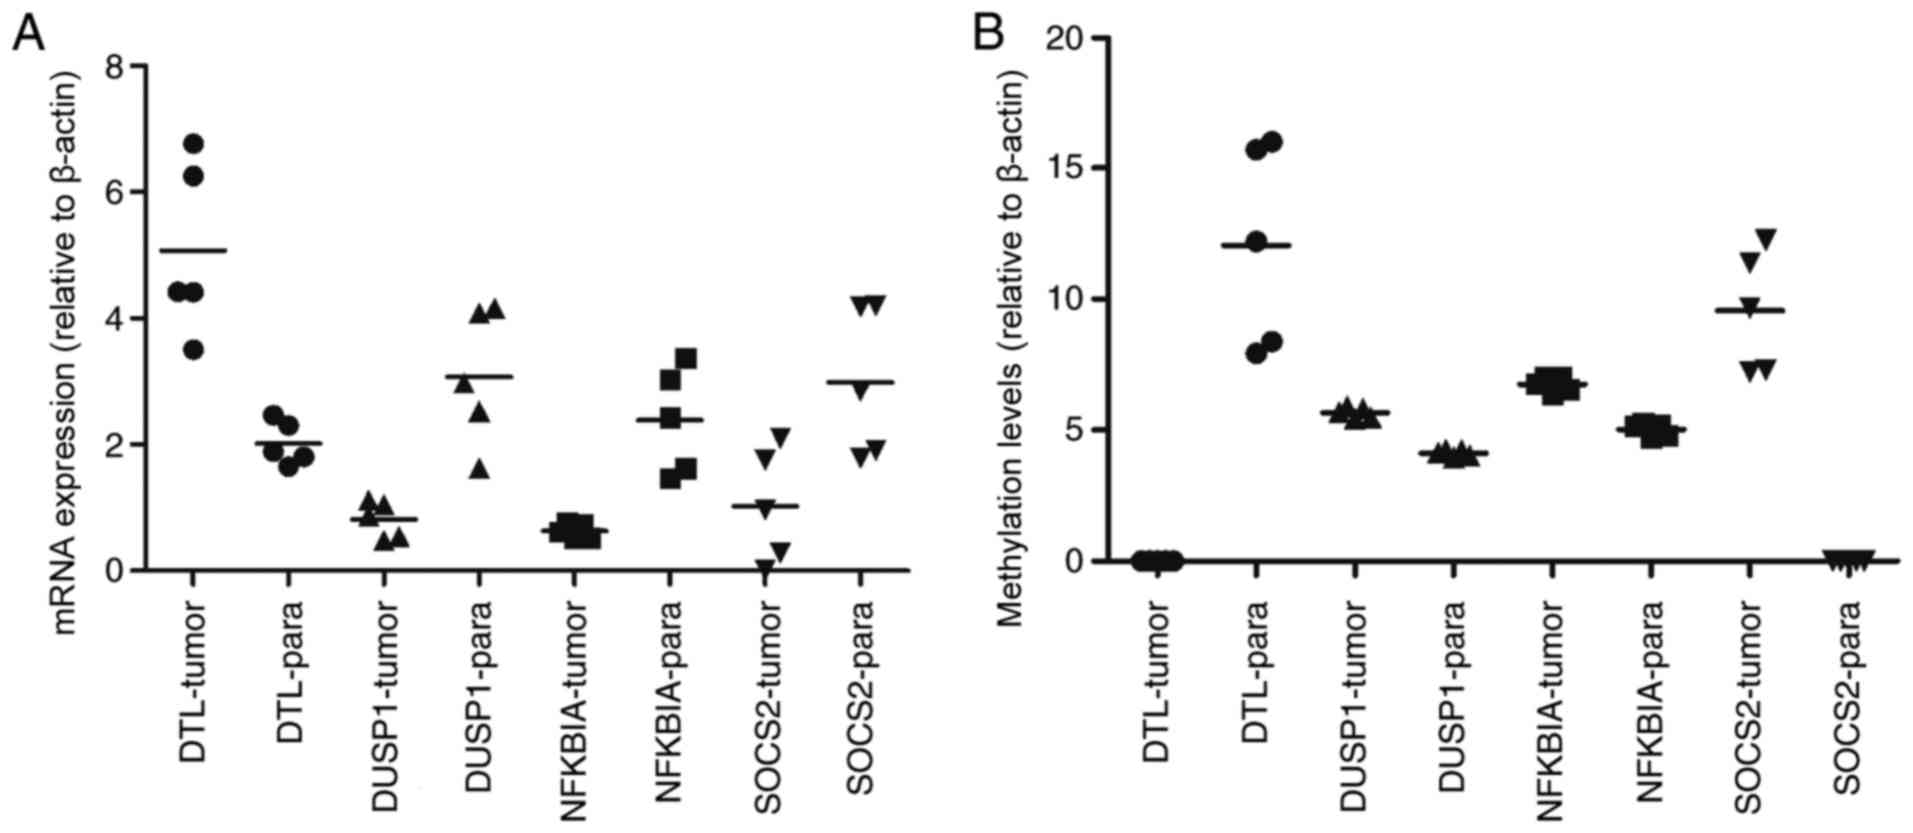 | Figure 5.Clinical verification of mRNA
expression and methylation levels of DTL, DUSP1, NFKBIA and
SOCS2 in HCC tumor and paracancerous samples. (A) Comparison
of tumor vs. paracancerous mRNA expression levels: DTL, P=0.0007;
DUSP1, P=0.0268; NFKBIA, P=0.0008, and SOCS2, P=0.0091. (B)
Comparison of tumor vs. paracancerous methylation levels: DTL,
P<0.0001; DUSP1, P<0.0001; NFKBIA, P<0.0001, and SOCS2,
P<0.0001. -tumor, measured in tumor samples, -para measured in
paracancerous samples. |
Discussion
Recent advances have significantly improved our
understanding of the molecular pathogenesis of HCC and its complex
genetic landscape (21–23). The integration of multiple profiling
data may provide additional insight into the molecular mechanisms
of HCC. In the present study, 41 genes were simultaneously
differentially expressed in 3 expression profiles, and they were
enriched in 3 KEGG pathways: ‘p53 signaling’, ‘Foxo signaling’ and
‘metabolic’ pathways (Table V). The
‘p53 signaling’ pathway influences a myriad of diverse cellular
processes, and p53 has been suggested to be activated in >50%
human cancer types (24). The ‘p53
signaling’ pathway has been associated cancer occurrence and in
mediating the response to cancer therapies (25). Kirstein and Vogel (26) summarized the pathological mechanisms
of HCC carcinogenesis and progression. It was demonstrated that the
most frequently identified mutations in HCC led to inactivation of
p53. Cisplatin has been effectively used in the treatment of HCC,
and p53 signaling is a potential target of cisplatin treatment
(27). Paired box 5 (PAX5) has been
suggested to be a functional tumor suppressor involved in HCC
through direct regulation of the p53 signaling pathway, and Ras
association domain family member 10 has been demonstrated to
suppress human HCC growth by activating p53 signaling (28,29). The
tyrosine kinase inhibitor, genistein, has been demonstrated to
induce apoptosis and cell cycle arrest in HepG2 cells by activating
the p53 signaling pathway (30). The
forkhead box O1 (Foxo) signaling pathway participates in the
regulation of multiple biological processes, including cellular
responses to oxidative stress, cellular apoptosis and cell
proliferation (31–33). It was reported that juglanthraquinone
C could induce the apoptosis of HCC cells by activating the Foxo
signaling pathway (34). PS341
(Bortezomib) was the first proteasome-inhibitor drug to be approved
in clinical treatment for multiple myeloma, functioning by
mediating targeted therapy against HCC through the Foxo3 signaling
pathway (35). A previous study
reported that Foxo-inhibition resulted in the myeloid maturation
and death of acute myeloid leukemia cells. Leukemic cells resistant
to Foxo-inhibition responded to JUN N-terminal kinase inhibition
(36). Metabolic pathways mainly
comprise metabolism of substance and energy, involved in a variety
growth and development processes, and the occurrence and
development of disease. Lu et al (37) hypothesized that blocking the
cholesterol metabolic pathway may have potential therapeutic
applications for patients with HCC. Björnsson (38) explored the central metabolic pathway
in HCC using a differential rank conservation algorithm, revealing
the involvement of ‘fatty acid metabolism’. Therefore, ‘p53
signaling’, ‘Foxo signaling’ and ‘metabolic’ pathways may serve
roles in the pathogenesis of HCC, and may guide future research
into the development of novel HCC therapies.
Combination analysis of the 41 overlapping DEGs
revealed that the expression and methylation of 6 genes was
downregulated in HCC (DTL, DUSP1, EOMES, ESM1, NFKBIA and
SOCS2). In order to further investigate the association
between these genes, a PPI network was constructed. DTL, DUSP1,
NFKBIA and SOCS2 were nodes a score >500 (Fig. 4). Denticleless protein homolog (DTL)
is a cell cycle-regulated nuclear and centrosome protein a protein
(39). It was confirmed to be a
critical target of miR-215, and DTL-knockdown by siRNA
resulted in enhanced G2-arrest, p53 and p21 induction, and reduced
cell proliferation of osteosarcoma and colon cancer cells (39). A previous study reported that
overexpression of DTL promoted proliferation of tumor cells
and was associated with a malignant outcome in esophageal squamous
cell carcinoma (40). Another study
reported that gastric carcinoma patients with
DTL-overexpressing tumors had a relatively poor overall
survival rate compared with those not exhibiting DTL
expression (P=0.0498) and disease-free survival rate (P=0.0324)
(41). DUSP1 has been demonstrated to
be involved in cell cycle inhibition, apoptosis and senescence
(42). A South Korean study revealed
that DUSP1 functioned as a tumor suppressor during
hepatocarcinogenesis, and that the DUSP1 expression was
associated with the activation of p53 (43). Hao et al (44) revealed that disruption of a positive
regulatory loop between DUSP1 and p53 promoted HCC development and
progression. Wei et al (45)
found that miR-101 inhibited macrophage-induced growth of
HCC tumors by regulating tumor growth factor-β secretion via
targeting DUSP1. NFKBIA inhibits NF-κB by forming a
heterodimer with NF-κB, and preventing its translocation to the
nucleus (46). A previous study
investigation revealed the distribution frequency of the
NFKBIA genotype and haplotype polymorphisms between HCC and
control specimens (47). It has been
reported that the expression of NFKBIA is decreased in liver
cancer tissue compared with control tissue, and that negative
NFKBIA expression predicted poor prognosis in patients with
primary HCC (48). A nested
case-control study in Shanghai (China) suggested that genetic
variants of NFKB1 influenced liver cancer-susceptibility in
the Chinese population (49).
SOCS2 has been reported to inhibit tumor metastasis
(50). The expression of SOCS2
has also been demonstrated to be markedly reduced in HCC and
associated with aggressive tumor progression and poor prognosis in
patients with HCC (51). Although
ESM1 and EOMES were differentially expressed and
methylated in the HCC group compared with control group, the
differences were non-significant (P=0.061, 0.053, respectively) and
they were minimally involved in the PPI networks. Therefore, we
hypothesize that ESM1 and EOMES do not serve
important roles in the pathogenesis.
In summary, DTL, DUSP1, NFKBIA and
SOCS2 were closely associated with HCC, and may provide
useful insight for developing the treatment and prognosis of HCC.
In the present study, it was confirmed that DTL expression
was upregulated in HCC, and DUSP1, NFKBIA and SOCS2
were downregulated, and the opposite effects on their methylation
levels were observed (Fig. 5). We
hypothesize that DTL, DUSP1, NFKBIA and SOCS2 may be
involved in HCC carcinogenesis. In conclusion, the present study
identified potential biomarkers of HCC, including DTL, DUSP1,
NFKBIA and SOCS2. Furthermore, the ‘p53 signaling’,
‘Foxo signaling’ and ‘metabolic’ pathways may be involved in the
carcinogenesis of HCC, and may provide insight into the development
of novel HCC therapies. Future work will involve detection of these
potential biomarkers in large clinical samples by
immunohistochemistry (IHC).
Acknowledgements
Not applicable.
Funding
The present study was supported by the Tianjin
Clinical Research Center for Organ Transplantation (grant no.
15ZXLCSY00070) and the Tianjin Municipal Science and Technology
Commission (grant no. 17ZXMFSY00040).
Availability of data and materials
All data generated or analyzed during the present
study are included in this published article.
Authors' contributions
All authors had access to the data and were
responsible for the concept and design of the study, data
analysis/interpretation and critical revision and approval of the
article. CM and WJ were responsible for data collection. WJ was
responsible for drafting the article. CM and XS were responsible
for statistical analyses.
Ethics approval and consent to
participate
Not applicable.
Consent for publication
Not applicable.
Competing interests
The authors declare that they have no competing
interests.
References
|
1
|
Chen KW, Ou TM, Hsu CW, Horng CT, Lee CC,
Tsai YY, Tsai CC, Liou YS, Yang CC, Hsueh CW and Kuo WH: Current
systemic treatment of hepatocellular carcinoma: A review of the
literature. World J Hepatol. 7:1412–1420. 2015. View Article : Google Scholar : PubMed/NCBI
|
|
2
|
Sinn DH, Lee J, Goo J, Kim K, Gwak GY,
Paik YH, Choi MS, Lee JH, Koh KC, Yoo BC and Paik SW:
Hepatocellular carcinoma risk in chronic hepatitis B virus-infected
compensated cirrhosis patients with low viral load. Hepatology.
62:694–701. 2015. View Article : Google Scholar : PubMed/NCBI
|
|
3
|
Debes JD, Chan AJ, Balderramo D, Kikuchi
L, Ballerga Gonzalez E, Prieto JE, Tapias M, Idrovo V, Davalos MB,
Cairo F, et al: Hepatocellular carcinoma in South America:
Evaluation of risk factors, demographics, and therapy. Liver Int.
38:136–143. 2018. View Article : Google Scholar : PubMed/NCBI
|
|
4
|
Petrick JL, Campbell PT, Koshiol J,
Thistle JE, Andreotti G, Beane-Freeman LE, Buring JE, Chan AT,
Chong DQ, Doody MM, et al: Abstract 3007: Tobacco smoking, alcohol
use and risk of hepatocellular carcinoma and intrahepatic
cholangiocarcinoma: The Liver Cancer Pooling Project. Cancer Res.
77:2017. View Article : Google Scholar
|
|
5
|
Zampino R, Pisaturo MA, Cirillo G, Marrone
A, Macera M, Rinaldi L, Stanzione M, Durante-Mangoni E, Gentile I,
Sagnelli E, et al: Hepatocellular carcinoma in chronic HBV-HCV
co-infection is correlated to fibrosis and disease duration. Ann
Hepatol. 14:75–82. 2015.PubMed/NCBI
|
|
6
|
Hamid AS, Tesfamariam IG, Zhang Y and
Zhang ZG: Aflatoxin B1-induced hepatocellular carcinoma in
developing countries: Geographical distribution, mechanism of
action and prevention. Oncol Lett. 5:1087–1092. 2013. View Article : Google Scholar : PubMed/NCBI
|
|
7
|
Alavian SM and Haghbin H: Relative
Importance of Hepatitis B and C viruses in hepatocellular carcinoma
in EMRO countries and the Middle East: A systematic review. Hepat
Mon. 16:e351062016. View Article : Google Scholar : PubMed/NCBI
|
|
8
|
Balan S, Finnigan J and Bhardwaj N:
Dendritic cell strategies for eliciting mutation-derived tumor
antigen responses in patients. Cancer J. 23:131–137. 2017.
View Article : Google Scholar : PubMed/NCBI
|
|
9
|
Xu Y, Li L, Xiang X, Wang H, Cai W, Xie J,
Han Y, Bao S and Xie Q: Three common functional polymorphisms in
microRNA encoding genes in the susceptibility to hepatocellular
carcinoma: A systematic review and meta-analysis. Gene.
527:584–593. 2013. View Article : Google Scholar : PubMed/NCBI
|
|
10
|
Lyragonzález I, Floresfong LE,
Gonzálezgarcía I, Medina-Preciado D and Armendáriz-Borunda J:
Adenoviral gene therapy in hepatocellular carcinoma: A review.
Hepatol Int. 7:48–58. 2013. View Article : Google Scholar : PubMed/NCBI
|
|
11
|
Zekri AR, Sabry GM, Bahnassy AA, Shalaby
KA, Abdel-Wahabh SA and Zakaria S: Mismatch repair genes (hMLH1,
hPMS1, hPMS2, GTBP/hMSH6, hMSH2) in the pathogenesis of
hepatocellular carcinoma. World J Gastroenterol. 11:3020–3026.
2005. View Article : Google Scholar : PubMed/NCBI
|
|
12
|
Zimonjic DB and Popescu NC: Role of DLC1
tumor suppressor gene and MYC oncogene in pathogenesis of human
hepatocellular carcinoma: Potential prospects for combined targeted
therapeutics (review). Int J Oncol. 41:393–406. 2012. View Article : Google Scholar : PubMed/NCBI
|
|
13
|
Lu X, Sun W, Tang Y, Zhu L, Li Y, Ou C,
Yang C, Su J, Luo C, Hu Y and Cao J: Identification of key genes in
hepatocellular carcinoma and validation of the candidate gene,
cdc25a, using gene set enrichment analysis, meta-analysis and
cross-species comparison. Mol Med Rep. 13:1172–1178. 2016.
View Article : Google Scholar : PubMed/NCBI
|
|
14
|
Kondo Y, Kanai Y, Sakamoto M, Mizokami M,
Ueda R and Hirohashi S: Genetic instability and aberrant DNA
methylation in chronic hepatitis and cirrhosis-A Comprehensive
Study of loss of heterozygosity and microsatellite instability at
39 Loci and DNA hypermethylation on 8 CpG islands in microdissected
specimens from patients with hepatocellular carcinoma. Hepatology.
32:970–979. 2000. View Article : Google Scholar : PubMed/NCBI
|
|
15
|
Zhao RC, Zhou J, He JY, Wei YG, Qin Y and
Li B: Aberrant promoter methylation of SOCS-1 gene may contribute
to the pathogenesis of hepatocellular carcinoma: A meta-analysis. J
Buon. 21:142–151. 2016.PubMed/NCBI
|
|
16
|
Udali S, Guarini P, Ruzzenente A,
Ferrarini A, Guglielmi A, Lotto V, Tononi P, Pattini P, Moruzzi S,
Campagnaro T, et al: DNA methylation and gene expression profiles
show novel regulatory pathways in hepatocellular carcinoma. Clin
Epigenetics. 7:432015. View Article : Google Scholar : PubMed/NCBI
|
|
17
|
Zimmerli L, Hou BH, Tsai CH, Jakab G,
Mauch-Mani B and Somerville S: The xenobiotic beta-aminobutyric
acid enhances Arabidopsis thermotolerance. Plant J. 53:144–156.
2008. View Article : Google Scholar : PubMed/NCBI
|
|
18
|
Tiezzi F, Parker-Gaddis KL, Cole JB, Clay
JS and Maltecca C: A genome-wide association study for clinical
mastitis in first parity US Holstein cows using single-step
approach and genomic matrix re-weighting procedure. PLoS One. 2015
Feb 6;10(2): e0114919 View Article : Google Scholar : PubMed/NCBI
|
|
19
|
Szklarczyk D, Franceschini A, Wyder S,
Forslund K, Heller D, Huerta-Cepas J, Simonovic M, Roth A, Santos
A, Tsafou KP, et al: STRING v10: Protein-protein interaction
networks, integrated over the tree of life. Nucleic Acids Res.
43:(Database Issue). D447–D452. 2015. View Article : Google Scholar : PubMed/NCBI
|
|
20
|
Livak KJ and Schmittgen TD: Analysis of
relative gene expression data using real-time quantitative PCR and
the 2(-Delta Delta C(T)) method. Methods. 25:402–408. 2001.
View Article : Google Scholar : PubMed/NCBI
|
|
21
|
Jayachandran M: An updated portrait of
pathogenesis, molecular markers and signaling pathways of
hepatocellular carcinoma. Curr Pharm Design. 23:2356–2365. 2017.
View Article : Google Scholar
|
|
22
|
Liu Y, Yang Z, Du F, Yang Q, Hou J, Yan X,
Geng Y, Zhao Y and Wang H: Molecular mechanisms of pathogenesis in
hepatocellular carcinoma revealed by RNA-sequencing. Mol Med Rep.
16:6674–6682. 2017. View Article : Google Scholar : PubMed/NCBI
|
|
23
|
Chen J, Qian Z, Li F, Li J and Lu Y:
Integrative analysis of microarray data to reveal regulation
patterns in the pathogenesis of hepatocellular carcinoma. Gut
Liver. 11:112–120. 2017. View
Article : Google Scholar : PubMed/NCBI
|
|
24
|
Stegh AH: Targeting the p53 signaling
pathway in cancer therapy-the promises, challenges and perils.
Expert Opin Ther Targets. 16:67–83. 2012. View Article : Google Scholar : PubMed/NCBI
|
|
25
|
Grochola LF, Zeronmedina J, Mériaux S and
Bond GL: Single-nucleotide polymorphisms in the p53 signaling
pathway. Cold Spring Harb Perspect Biol. 2:a0010322010. View Article : Google Scholar : PubMed/NCBI
|
|
26
|
Kirstein MM and Vogel A: The pathogenesis
of hepatocellular carcinoma. Dig Dis. 32:545–553. 2014. View Article : Google Scholar : PubMed/NCBI
|
|
27
|
Wang P, Cui J, Wen J, Guo Y, Zhang L and
Chen X: Cisplatin induces HepG2 cell cycle arrest through targeting
specific long noncoding RNAs and the p53 signaling pathway. Oncol
Lett. 12:4605–4612. 2016. View Article : Google Scholar : PubMed/NCBI
|
|
28
|
Liu W, Li X, Chu ES, Go MY, Xu L, Zhao G,
Li L, Dai N, Si J, Tao Q, et al: Paired box gene 5 is a novel tumor
suppressor in hepatocellular carcinoma through interaction with p53
signaling pathway. Hepatology. 53:843–853. 2011. View Article : Google Scholar : PubMed/NCBI
|
|
29
|
Jin Y, Cao B, Zhang M, Zhan Q, Herman JG,
Yu M and Guo M: RASSF10 suppresses hepatocellular carcinoma growth
by activating P53 signaling and methylation of RASSF10 is a
docetaxel resistant marker. Genes Cancer. 6:231–240.
2015.PubMed/NCBI
|
|
30
|
Hong X, Liu PQ, Liang JX and Yun FU:
Genistein induces apoptosis through upregulation of p53 signaling
pathway. J Trop Med. 9:893–896, 910.
|
|
31
|
Lehtinen MK, Yuan Z, Boag PR, Yang Y,
Villén J, Becker EB, DiBacco S, de la Iglesia N, Gygi S, Blackwell
TK and Bonni A: A conserved MST-FOXO signaling pathway mediates
oxidative-stress responses and extends life span. Cell.
125:987–1001. 2006. View Article : Google Scholar : PubMed/NCBI
|
|
32
|
Da NI, Xue S, Lian F and Wang WJ:
Platelet-derived growth factor stimulates vascular smooth muscle
cell proliferation through AKT-FoxO signaling pathway. Mol Cardiol
China. 2011.
|
|
33
|
Huang P, Zhou Z, Wang H, Wei Q, Zhang L,
Zhou X, Hutz RJ and Shi F: Effect of the IGF-1/PTEN/Akt/FoxO
signaling pathway on the development and healing of water immersion
and restraint stress-induced gastric ulcers in rats. Int J Mol Med.
30:650–658. 2012. View Article : Google Scholar : PubMed/NCBI
|
|
34
|
Hou YQ, Yao Y, Bao YL, Song ZB, Yang C,
Gao XL, Zhang WJ, Sun LG, Yu CL, Huang YX, et al: Juglanthraquinone
C induces intracellular ROS increase and apoptosis by activating
the Akt/Foxo signal pathway in HCC cells. Oxid Med Cell Longev.
2016:49416232016. View Article : Google Scholar : PubMed/NCBI
|
|
35
|
Yang Z, Liu S, Zhu M, Zhang H, Wang J, Xu
Q, Lin K, Zhou X, Tao M, Li C and Zhu H: PS341 inhibits
hepatocellular and colorectal cancer cells through the FOXO3/CTNNB1
signaling pathway. Sci Rep. 6:220902016. View Article : Google Scholar : PubMed/NCBI
|
|
36
|
Sykes SM, Lane SW, Bullinger L,
Kalaitzidis D, Yusuf R, Saez B, Ferraro F, Mercier F, Singh H,
Brumme KM, et al: AKT/FOXO signaling enforces reversible
differentiation blockade in myeloid leukemias. Cell. 146:697–708.
2011. View Article : Google Scholar : PubMed/NCBI
|
|
37
|
Lu M, Hu XH, Li Q, Xiong Y, Hu GJ, Xu JJ,
Zhao XN, Wei XX, Chang CC, Liu YK, et al: A specific cholesterol
metabolic pathway is established in a subset of HCCs for tumor
growth. J Mol Cell Biol. 5:404–415. 2013. View Article : Google Scholar : PubMed/NCBI
|
|
38
|
Björnsson E: The differential rank
conservation algorithm (DIRAC) reveals deregulation of central
metabolic pathways in hepatocellular carcinoma. 2014.
|
|
39
|
Song B, Wang Y, Titmus MA, Botchkina G,
Formentini A, Kornmann M and Ju J: Molecular mechanism of
chemoresistance by miR-215 in osteosarcoma and colon cancer cells.
Mol Cancer. 9:962010. View Article : Google Scholar : PubMed/NCBI
|
|
40
|
Kawaguchi T, Komatsu S, Ichikawa D,
Hirajima S, Kosuga T, Konishi H, Shiozaki A, Fujiwara H, Okamoto K
and Otsuji E: Overexpression of denticleless E3 ubiquitin protein
ligase homolog (DTL) is related to tumor cell proliferation and
malignant outcome in esophageal squamous cell carcinoma. J Am Coll
Surgeons. 221 Suppl 2:e132–e133. 2015. View Article : Google Scholar
|
|
41
|
Kobayashi H, Komatsu S, Ichikawa D,
Kawaguchi T, Hirajima S, Miyamae M, Okajima W, Ohashi T, Kosuga T,
Konishi H, et al: Overexpression of denticleless E3 ubiquitin
protein ligase homolog (DTL) is related to poor outcome in gastric
carcinoma. Oncotarget. 6:36615–36624. 2015. View Article : Google Scholar : PubMed/NCBI
|
|
42
|
Gang L, Qun L, Liu WD, Li YS, Xu YZ and
Yuan DT: MicroRNA-34a promotes cell cycle arrest and apoptosis and
suppresses cell adhesion by targeting DUSP1 in osteosarcoma. Am J
Transl Res. 9:5388–5399. 2017.PubMed/NCBI
|
|
43
|
Kato I, Maita H, Takahashi-Niki K, Saito
Y, Noguchi N, Iguchi-Ariga SM and Ariga H: Oxidized DJ-1 inhibits
p53 by sequestering p53 from promoters in a DNA-binding
affinity-dependent manner. Mol Cell Biol. 33:340–359. 2013.
View Article : Google Scholar : PubMed/NCBI
|
|
44
|
Hao PP, Li H, Lee MJ, Wang YP, Kim JH, Yu
GR, Lee SY, Leem SH, Jang KY and Kim DG: Disruption of a regulatory
loop between DUSP1 and p53 contributes to hepatocellular carcinoma
development and progression. J Hepatol. 62:1278–1286. 2015.
View Article : Google Scholar : PubMed/NCBI
|
|
45
|
Wei X, Tang C, Lu X, Liu R, Zhou M, He D,
Zheng D, Sun C and Wu Z: MiR-101 targets DUSP1 to regulate the
TGF-β secretion in sorafenib inhibits macrophage-induced growth of
hepatocarcinoma. Oncotarget. 6:18389–18405. 2015. View Article : Google Scholar : PubMed/NCBI
|
|
46
|
Ramos-Marquès E, Zambrano S, Tiérrez A,
Bianchi ME, Agresti A and García-Del Portillo F: Single-cell
analyses reveal an attenuated NF-κB response in the
Salmonella-infected fibroblast. Virulence. 8:719–740. 2016.
View Article : Google Scholar : PubMed/NCBI
|
|
47
|
Cheng CW, Su JL, Lin CW, Su CW, Shih CH,
Yang SF and Chien MH: Effects of NFKB1 and NFKBIA gene
polymorphisms on hepatocellular carcinoma susceptibility and
clinicopathological features. PLoS One. 8:e561302013. View Article : Google Scholar : PubMed/NCBI
|
|
48
|
Wang WJ, Ren G, Qi JD, Liu SH and Liang J:
Expression changes of NFKBIA in hepatocellular carcinoma and its
significance. Shandong Medical Journal. 22:16–19. 2015.
|
|
49
|
Gao J, Xu HL, Gao S, Zhang W, Tan YT,
Rothman N, Purdue M, Gao YT, Zheng W, Shu XO and Xiang YB: Genetic
polymorphism of NFKB1 and NFKBIA genes and liver cancer risk: A
nested case-control study in Shanghai, China. BMJ Open.
4:e0044272014. View Article : Google Scholar : PubMed/NCBI
|
|
50
|
Cui M, Ji S, Hou J, Fang T, Wang X, Ge C,
Zhao F, Chen T, Xie H, Cui Y, et al: The suppressor of cytokine
signaling 2 (SOCS2) inhibits tumor metastasis in hepatocellular
carcinoma. Tumour Biol. 37:13521–13531. 2016. View Article : Google Scholar : PubMed/NCBI
|
|
51
|
Qiu X, Zheng J, Guo X, Gao X, Liu H, Tu Y
and Zhang Y: Reduced expression of SOCS2 and SOCS6 in
hepatocellular carcinoma correlates with aggressive tumor
progression and poor prognosis. Mol Cell Biochem. 378:99–106. 2013.
View Article : Google Scholar : PubMed/NCBI
|