Introduction
Head and neck squamous cell carcinoma (HNSCC) is one
of the leading causes of cancer deaths worldwide. In general the
overall cure of HNSCC is less than 50% and in case of metastasis,
patients only have a life expectancy of 6 to 10 months (1). According to an analysis in 2009 of over
3,000 cases of primary head and neck tumours in Germany, the
outcome has not improved significantly from 1995 to 2006, despite
new treatment strategies. Therefore substances suppressing tumour
growth and invasion would be desirable.
Chelidonium majus, the greater celandine has
been used for hundreds of years in monastic medicine against
several widespread diseases and is described in detail in Jonathan
Hartwell's compendium (2) ‘Plants
used against Cancer’.
Chelidonine is an isoquinoline alkaloid and the main
alkaloid of Chelidonium majus. It has been reported to have
anti-cancer properties in a variety of tumor systems. Chelidonine
and a Chelidonium majus alkaloid extract, were shown to
overcome drug resistance by inhibition of the expression of
p-glycoprotein (MDR-1) and several enzymes of the cytochrome
P450 system, involved in xenobiotic metabolism in leukemia and
colon cancer cells and the induction of caspase-dependent apoptosis
(3). However, published results
concerning the effectivity and cancer-selectivity of chelidonine
are still controversial. However, until now C. majus alkaloids have
not been tested as possible therapeutic agents in HNSCC cell lines
and corresponding non-malignant primary cells of the mucosa of the
upper respiratory tract.
We analyzed the cytotoxicity of the chelidonine,
triggering of apoptosis as well as the impact on differential gene
expression. Furthermore the influence of chelidonine on the
motility of HNSCC cells was studied in a 3-dimensional,
spheroid-based invasion assay. Results are discussed critically
with respect to previously published projects.
Materials and methods
Reagents
Chelidonine was purchased at Sigma-Aldrich; Merck
KGaA, Darmstadt, Germany). A 50 mM stock solution was prepared in
absolute ethanol and stored in aliquots at −20°C.
Cell lines and cell culture
The cell line FADU originating from a hypopharyngeal
carcinoma was grown with RPMI-1640 medium (Seromed, Munich,
Germany), supplemented with 10% fetal bovine serum (FBS). HLaC78
and HLaC79 cell lines originated from larynx carcinoma (4) and were kept in RPMI-1640 medium. HSmC78
was established from a submandibular gland carcinoma (5) and also cultured with RPMI/10% FBS.
HLaC79-Tax was obtained by selective sub-cultivation of a
paclitaxel-resistant clone. It was kept as its original cell line
supplemented with 10 (HLaC79-Tax) paclitaxel. As primary cells
mucosal fibroblasts and keratinocytes were used. Fibroblast
cultures were generated by explant cultures from tonsil specimen in
Dulbecco's modified Eagle's medium (DMEM)/10% FBS. Isolation of
keratinocytes was performed as described (6). Keratinocytes were propagated in
Keratinocyte Medium 2 (PromoCell, Heidelberg, Germany).
Cell viability and proliferation
assay
Cells were seeded at 5,000 cells/well in 96-well
plates. They were treated with increasing concentrations of
chelidonine for 48 h. Cell proliferation was measured after 48 h by
replacing the culture medium with medium containing 1 mg/ml MTT.
After 4 h incubation, MTT-staining solution was replaced by
isopropanol and cells were incubated at 37°C for 45 min. The colour
conversion of MTT to a blue formazon dye was measured with an ELISA
reader at a wavelength of 570 nm. The amount of formazon dye is in
direct proportion to the number of metabolically active cells in
the culture. Relative toxicity was calculated as % surviving cells
by setting control cells treated with vehicle as 100% surviving
cells.
Growth assay of 3D cell cultures
Tumour spheroids were generated by seeding 2,000
cells/well of FADU cells on ultra-low-attachment (ULA) 96-well
round-bottomed plates (Corning Life Sciences BV, Amsterdam,
Netherlands). They were incubated with chelidonine in increasing
concentrations (10, 25 or 50 µM chelidonine). Controls were
incubated with corresponding amounts of 70% EtOH. Images were
captured every 24 h for 7 days. Size of spheroids was measured with
ImageJ software [National Institutes of Health (NIH), Bethesda, MD,
USA].
In vitro motility assays
Tumour spheroids were generated by seeding 5,000
cells/well of HLaC78 or FADU on ultra-low-attachment (ULA) 96-well
round-bottomed plates (Corning Life Sciences BV). For the migration
assay spheroids of HLaC78 and FADU were placed on different
extracellular matrix substrates. The surface of flat-bottomed
96-well plates were coated with 0.1% gelatin, 5 µg/ml fibronectin,
50 µg/ml laminin, 50 µg/ml collagen I (all purchased from
Sigma-Aldrich; Merck KGaA) or 125 µg/ml Matrigel®
(Becton-Dickinson, Heidelberg, Germany) for 2 h at room
temperature. Wells were washed twice with phosphate-buffered saline
(PBS) and subsequently blocked with 1% bovine serum albumin in PBS
for 1 h. On ULA plates cultivated 72 h old spheroids of both cell
lines were manually transferred to the coated wells with a
multichannel pipette. Spheroids were incubated with or without
chelidonine. Migration was recorded by photographing spheroids
after 1 and 18 h with a Leica DMI 4000 inverted fluorescence
microscope (Leica Microsystems, Wetzlar, Germany). Quantification
of migrated cell layers was carried out with the ImageJ software
(NIH).
RNA extraction and RNA quality
control
RNA of treated and control cell cultures was
isolated with the RNeasy Kit (Qiagen GmbH, Hilden, Germany)
according to the manufacturer's instructions. For using it in
expression arrays, RNA quality was assessed with the RNA 6000 Nano
Kit using the Bioanalyzer 2100 instrument (Agilent Technologies,
Böblingen, Germany). RNA integrity numbers (RINs) of our samples
ranged between 9.4 and 9.9.
Microarray analysis
For microarray hybridization, 100 ng total RNA were
amplified and labelled using the IVT Express Kit and hybridized to
GeneChip PrimeView Human Gene Expression arrays (both from
Affymetrix, Inc., Santa Clara, CA, USA) according to the
manufacturer's instructions.
Raw microarray data was background corrected,
normalized and summarized to probe set expression values using the
Robust Multi-array Average (RMA) algorithm (7,8). Data
preprocessing and calculation of fold changes between treated and
untreated expression values was performed with the Affymetrix
Expression Console and the Affymetrix Transcriptome analysis
Console (Affymetrix; Thermo Fisher Scientific, Inc., Waltham, MA,
USA). Microarray data were deposited in MIAME-compliant form at
Gene Expression Omnibus (http://www.ncbi.nlm.nih.gov/geo) with the identifier
GSE107464.
Taqman quantitative PCR
In order to analyze expression alterations caused by
chelidonine HNSCC cell lines FADU, HLaC78 and HSmC78 cell lines
were treated for 48 h with chelidonine (10 µM). RNA was
subsequently isolated (see above) and Real-Time TaqMan®
PCR (AppliedBiosystems.com) was performed in
triplicates on a Real-time PCR cycler (Applied Biosystems,
Darmstadt, Germany) using the TaqMan gene expression assays for
ABCB1 (MDR-1), CYP1A1 and CYP1B1, CYP3B4, GSTP1 and caspase-3.
Relative quantification was calculated according to the
2−ΔΔCq method (9).
Expression values were normalized to the expression of GAPDH as an
endogenous control which proved to be expressed most stably
throughout the cell lines.
Tube formation assay
The ability of endothelial cells to form
three-dimensional capillary-like structures in vitro was
analysed with the tube formation assay.
Ibidi angiogenesis-slides (15-well; Ibidi GmbH,
Munich, Germany) were coated with growth factor reduced basement
membrane extract (BME; Trevigen, Gaithersburg, MD, USA). After
polymerization of BME, the gels were overlaid with growth medium
containing 1×10⁴ HUVECs and with or without chelidonine.
Cells were incubated for 6 h and images were captured. Evaluation
of pictures was performed by Wimasis GmbH (Munich, Germany). For
quantification, four parameters were analyzed: Tube length, number
of branching points, covered area and number of loops.
Statistical analysis
All statistical analyses and graphs were performed
using GraphPad Prism 4 (GraphPad Software, Inc., La Jolla, CA,
USA). Data are presented as the mean ± standard deviation of three
independent MTT experiments or eight measured spheroids. An
unpaired t-test (angiogenesis, migration measurements) or ANOVA
with Dunnett's multiple comparison test (qRT-PCR) were used.
P<0.05 was considered to indicate a statistically significant
difference.
Results
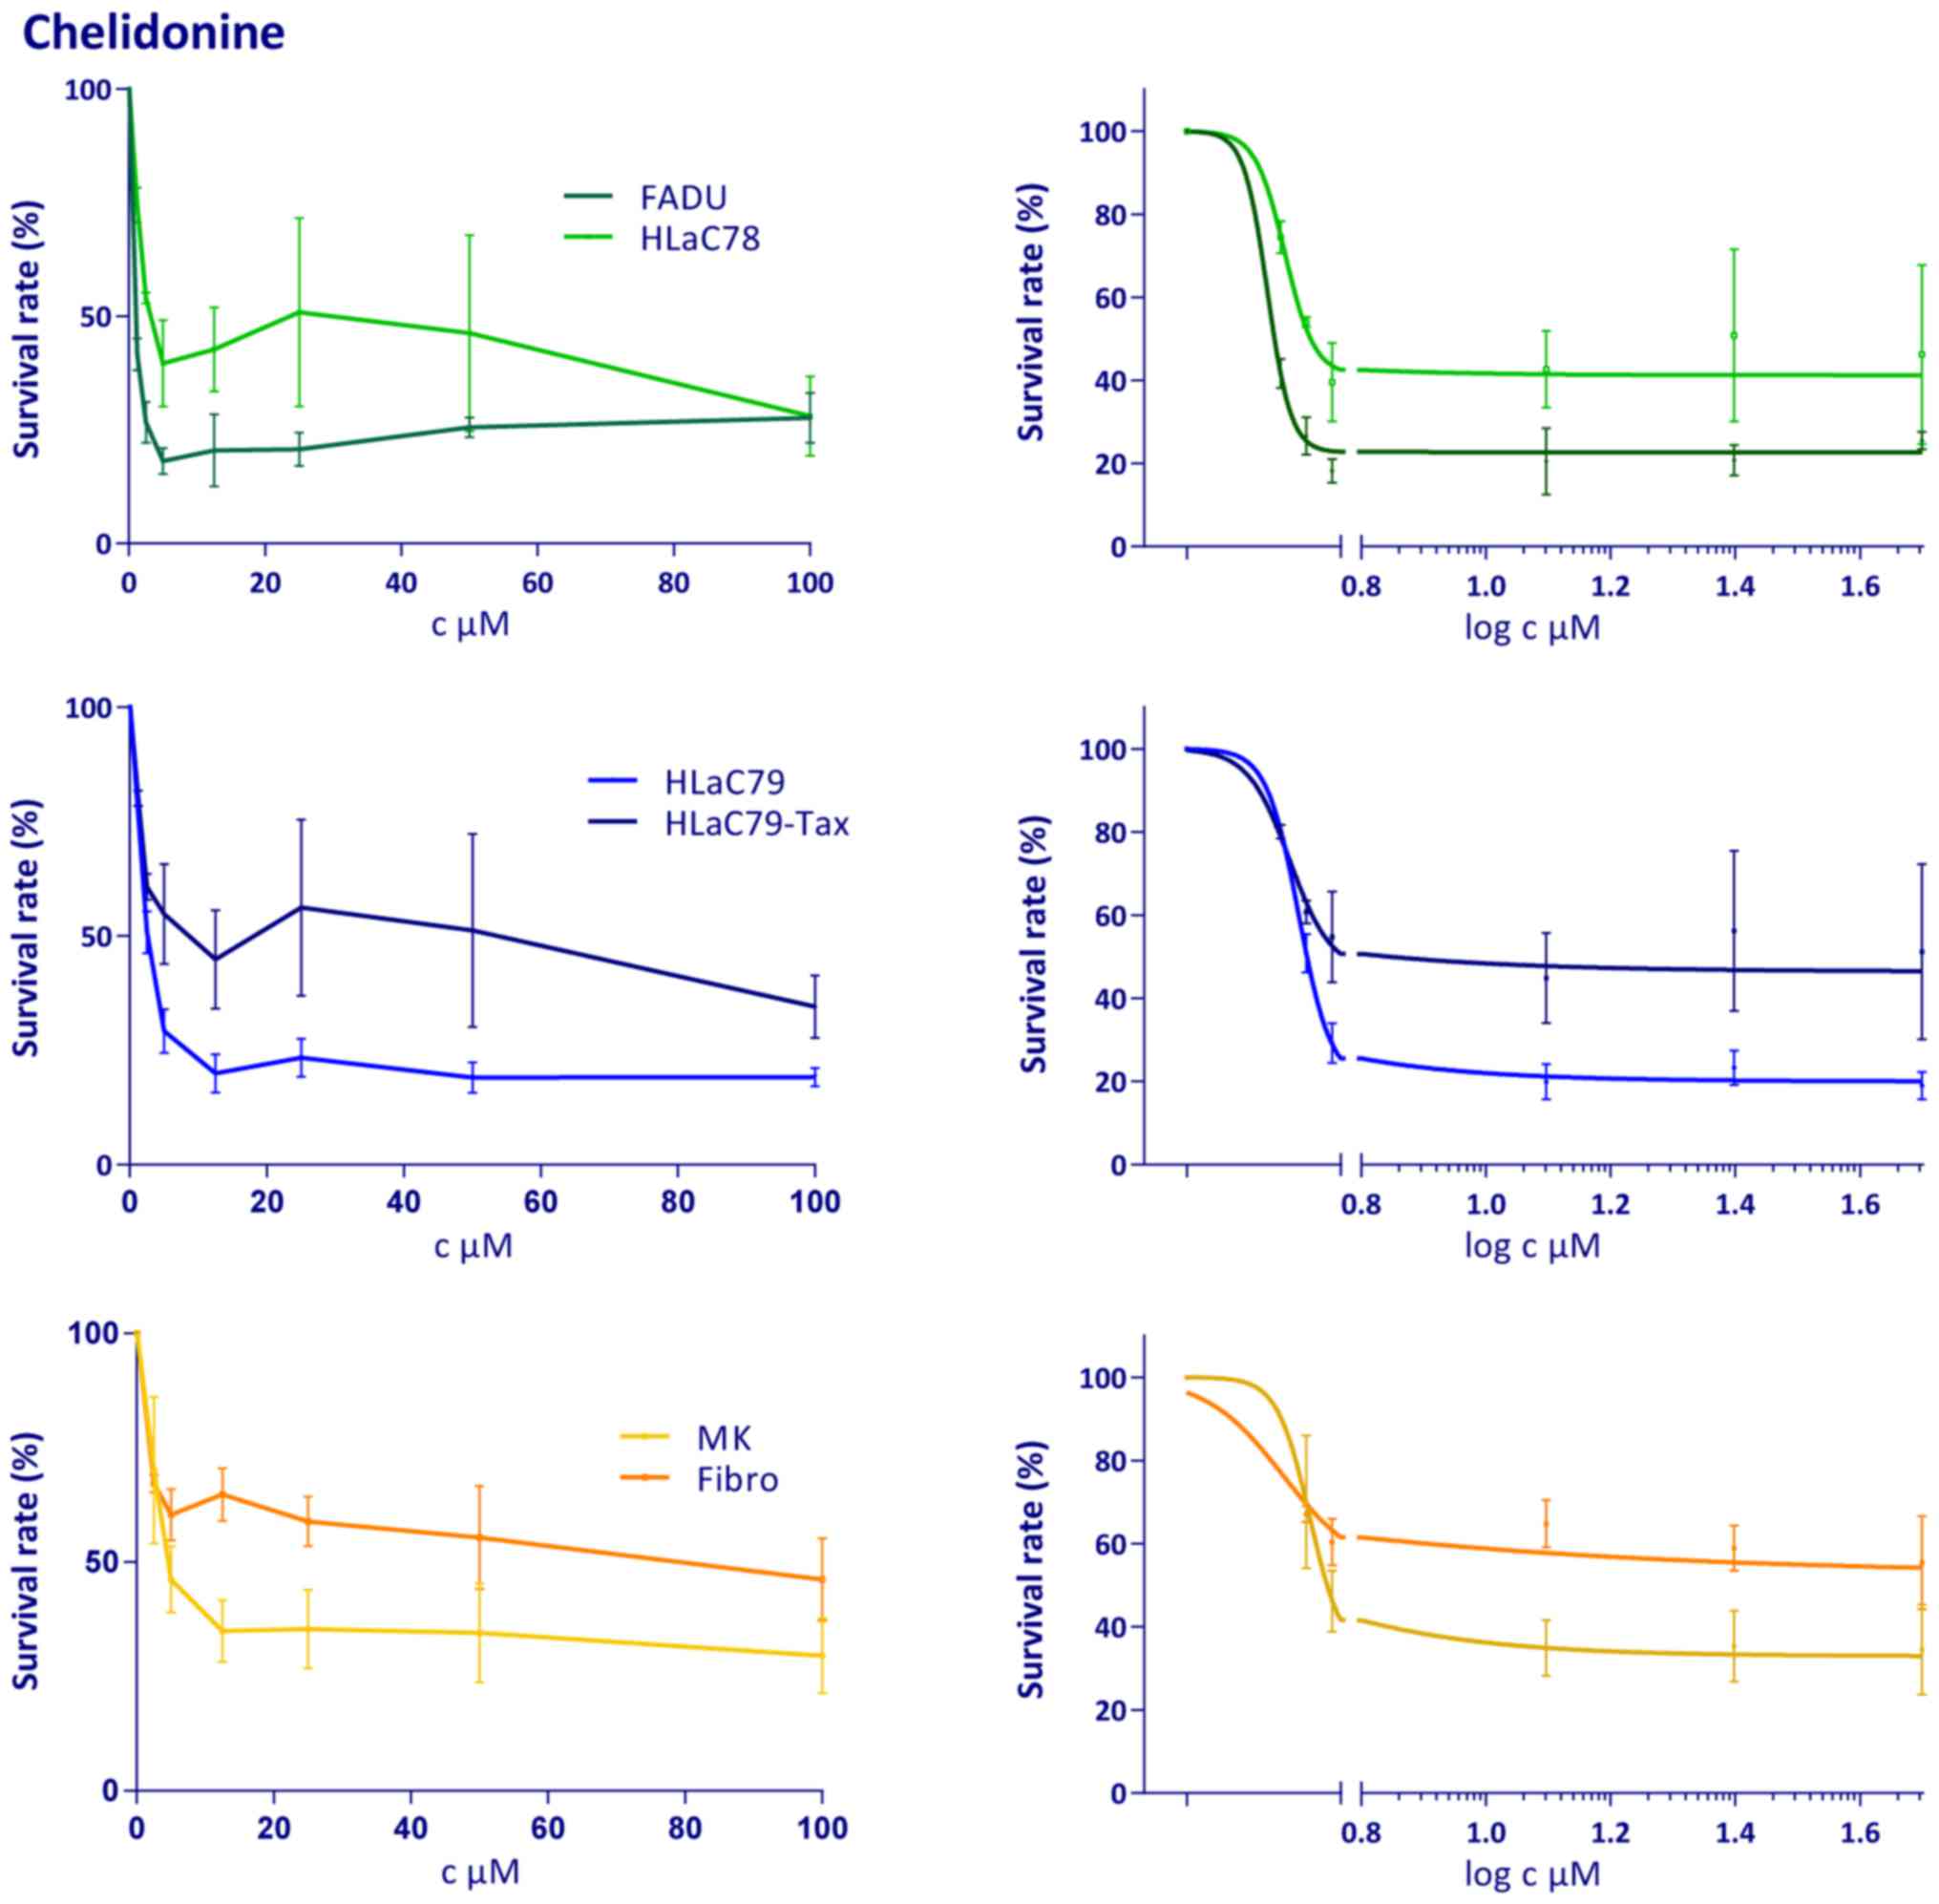
Cytotoxicity
The cell lines FADU, HLaC78, HLaC79, HLaC79-Tax and
primary mucosal keratinocytes and fibroblasts were treated with
increasing concentrations of chelidonine (1.25, 2.5, 5, 12.5, 25,
50 and 100 µM). Cell viability and cytotoxicity were measured with
the MTT assay (Fig. 1). Mean
percentage inhibition was calculated from at least three
independent experiments.
MTT assays with chelidonine revealed no clear
dose-dependent decrease in cell survival. Survival rates decreased
rapidly with low doses and remained approximately constant from the
10 µM dose level on (Fig. 1). A
complete growth inhibition could not be achieved in any cell line,
even at very high doses. Comparison of HLaC79 with its
corresponding paclitaxel-resistant clonal descendant revealed a
significantly higher resistance of the drug-resistant cell line at
doses exceeding 10 µM (Fig. 1).
HLaC78 proved to be more resistant to chelidonine treatment than
FaDu (Fig. 1). Mucosal keratinocytes
were similarly growth inhibited as HNSCC cell lines. Growth
inhibition similarly stagnated at concentrations higher than 10 µM
(Fig. 1). Fibroblasts proved to be
less susceptible to chelidonine treatment. Due to the steep curve
progression at low concentrations and the flat plateau at higher
concentrations, EC50 concentrations of 1.0 µM (FaDu) and
1.6 µM (HLaC78) with very wide ranges were calculated by graphpad
prism.
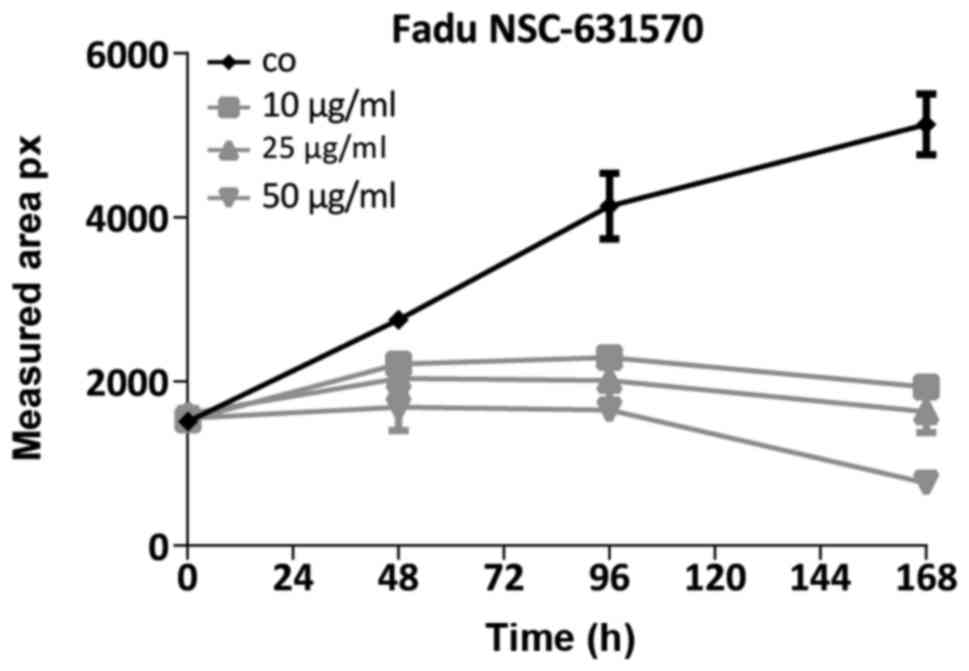
Growth inhibition of FaDu
spheroids
Growth inhibition in spheroids was determined by
measuring the size of the spheroids every 24 h after treatmentwith
different concentrations of chelidonine. Interestingly growth
dynamics of FaDu spheroids resembled those of monolayer cultures.
The growth of spheroids was diminished by 10 µm chelidonine, while
higher concentrations did not enhance growth inhibition (Fig. 2).
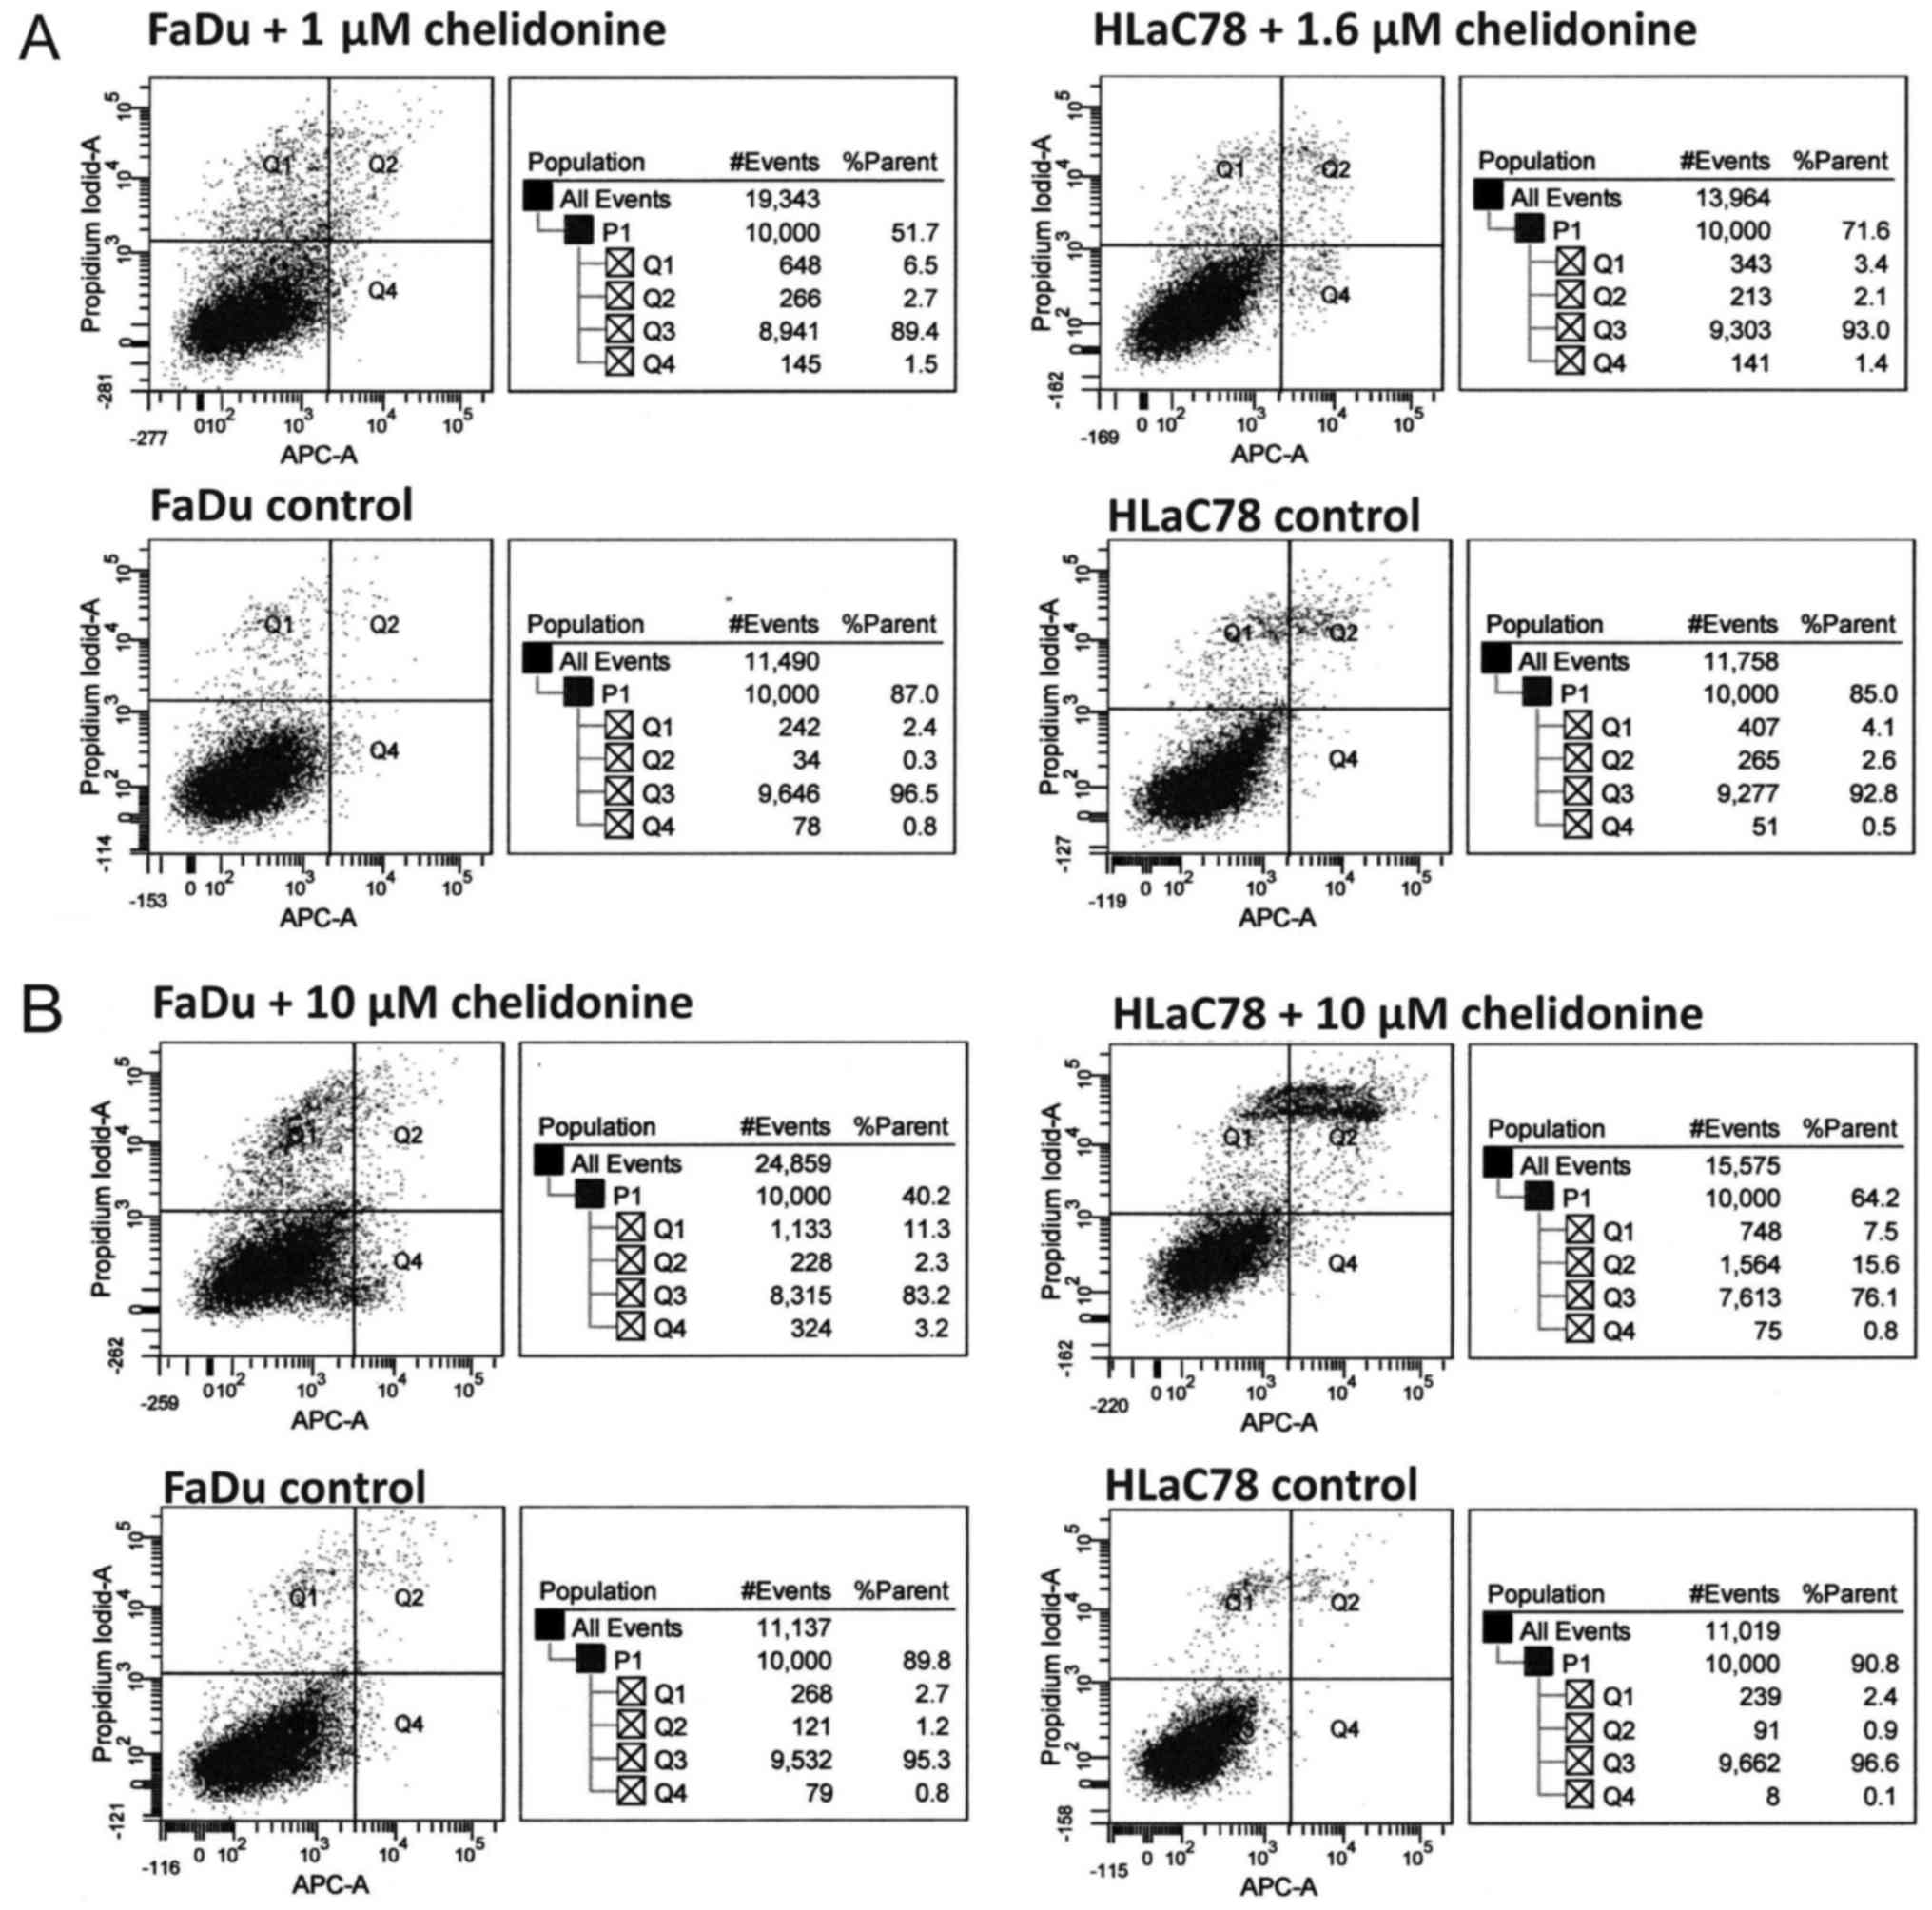
Apoptosis
Apoptosis of chelidonine treated and untreated FaDu
and HLaC78 cells were determined after 24 h of incubation using the
Annexin V staining kit and FACS analysis.
Despite killing cells at the EC50 doses
(1 µM in FaDu, 1.6 µM in HLaC78), as demonstrated by the preceding
MTT assays, chelidonine did not trigger apoptosis (Fig. 2A). As the EC50 of
chelidonine couldn't be determined exactly by statistical
calculation (see above), the effect of a higher concentration of
chelidonine (10 µM) was also tested. Using this higher
concentration, the apoptotic cell population of FaDu cells was
rising to 3.2%. In contrast, in HLaC78 indefinite (Q1) and late
apoptotic/necrotic cell death fractions (Q2) increased, but a
significant increase of pre-apoptotic cell fractions did not
occur.
Representative examples of FaDu and HLaC78 FACS
results are shown in Fig. 3.
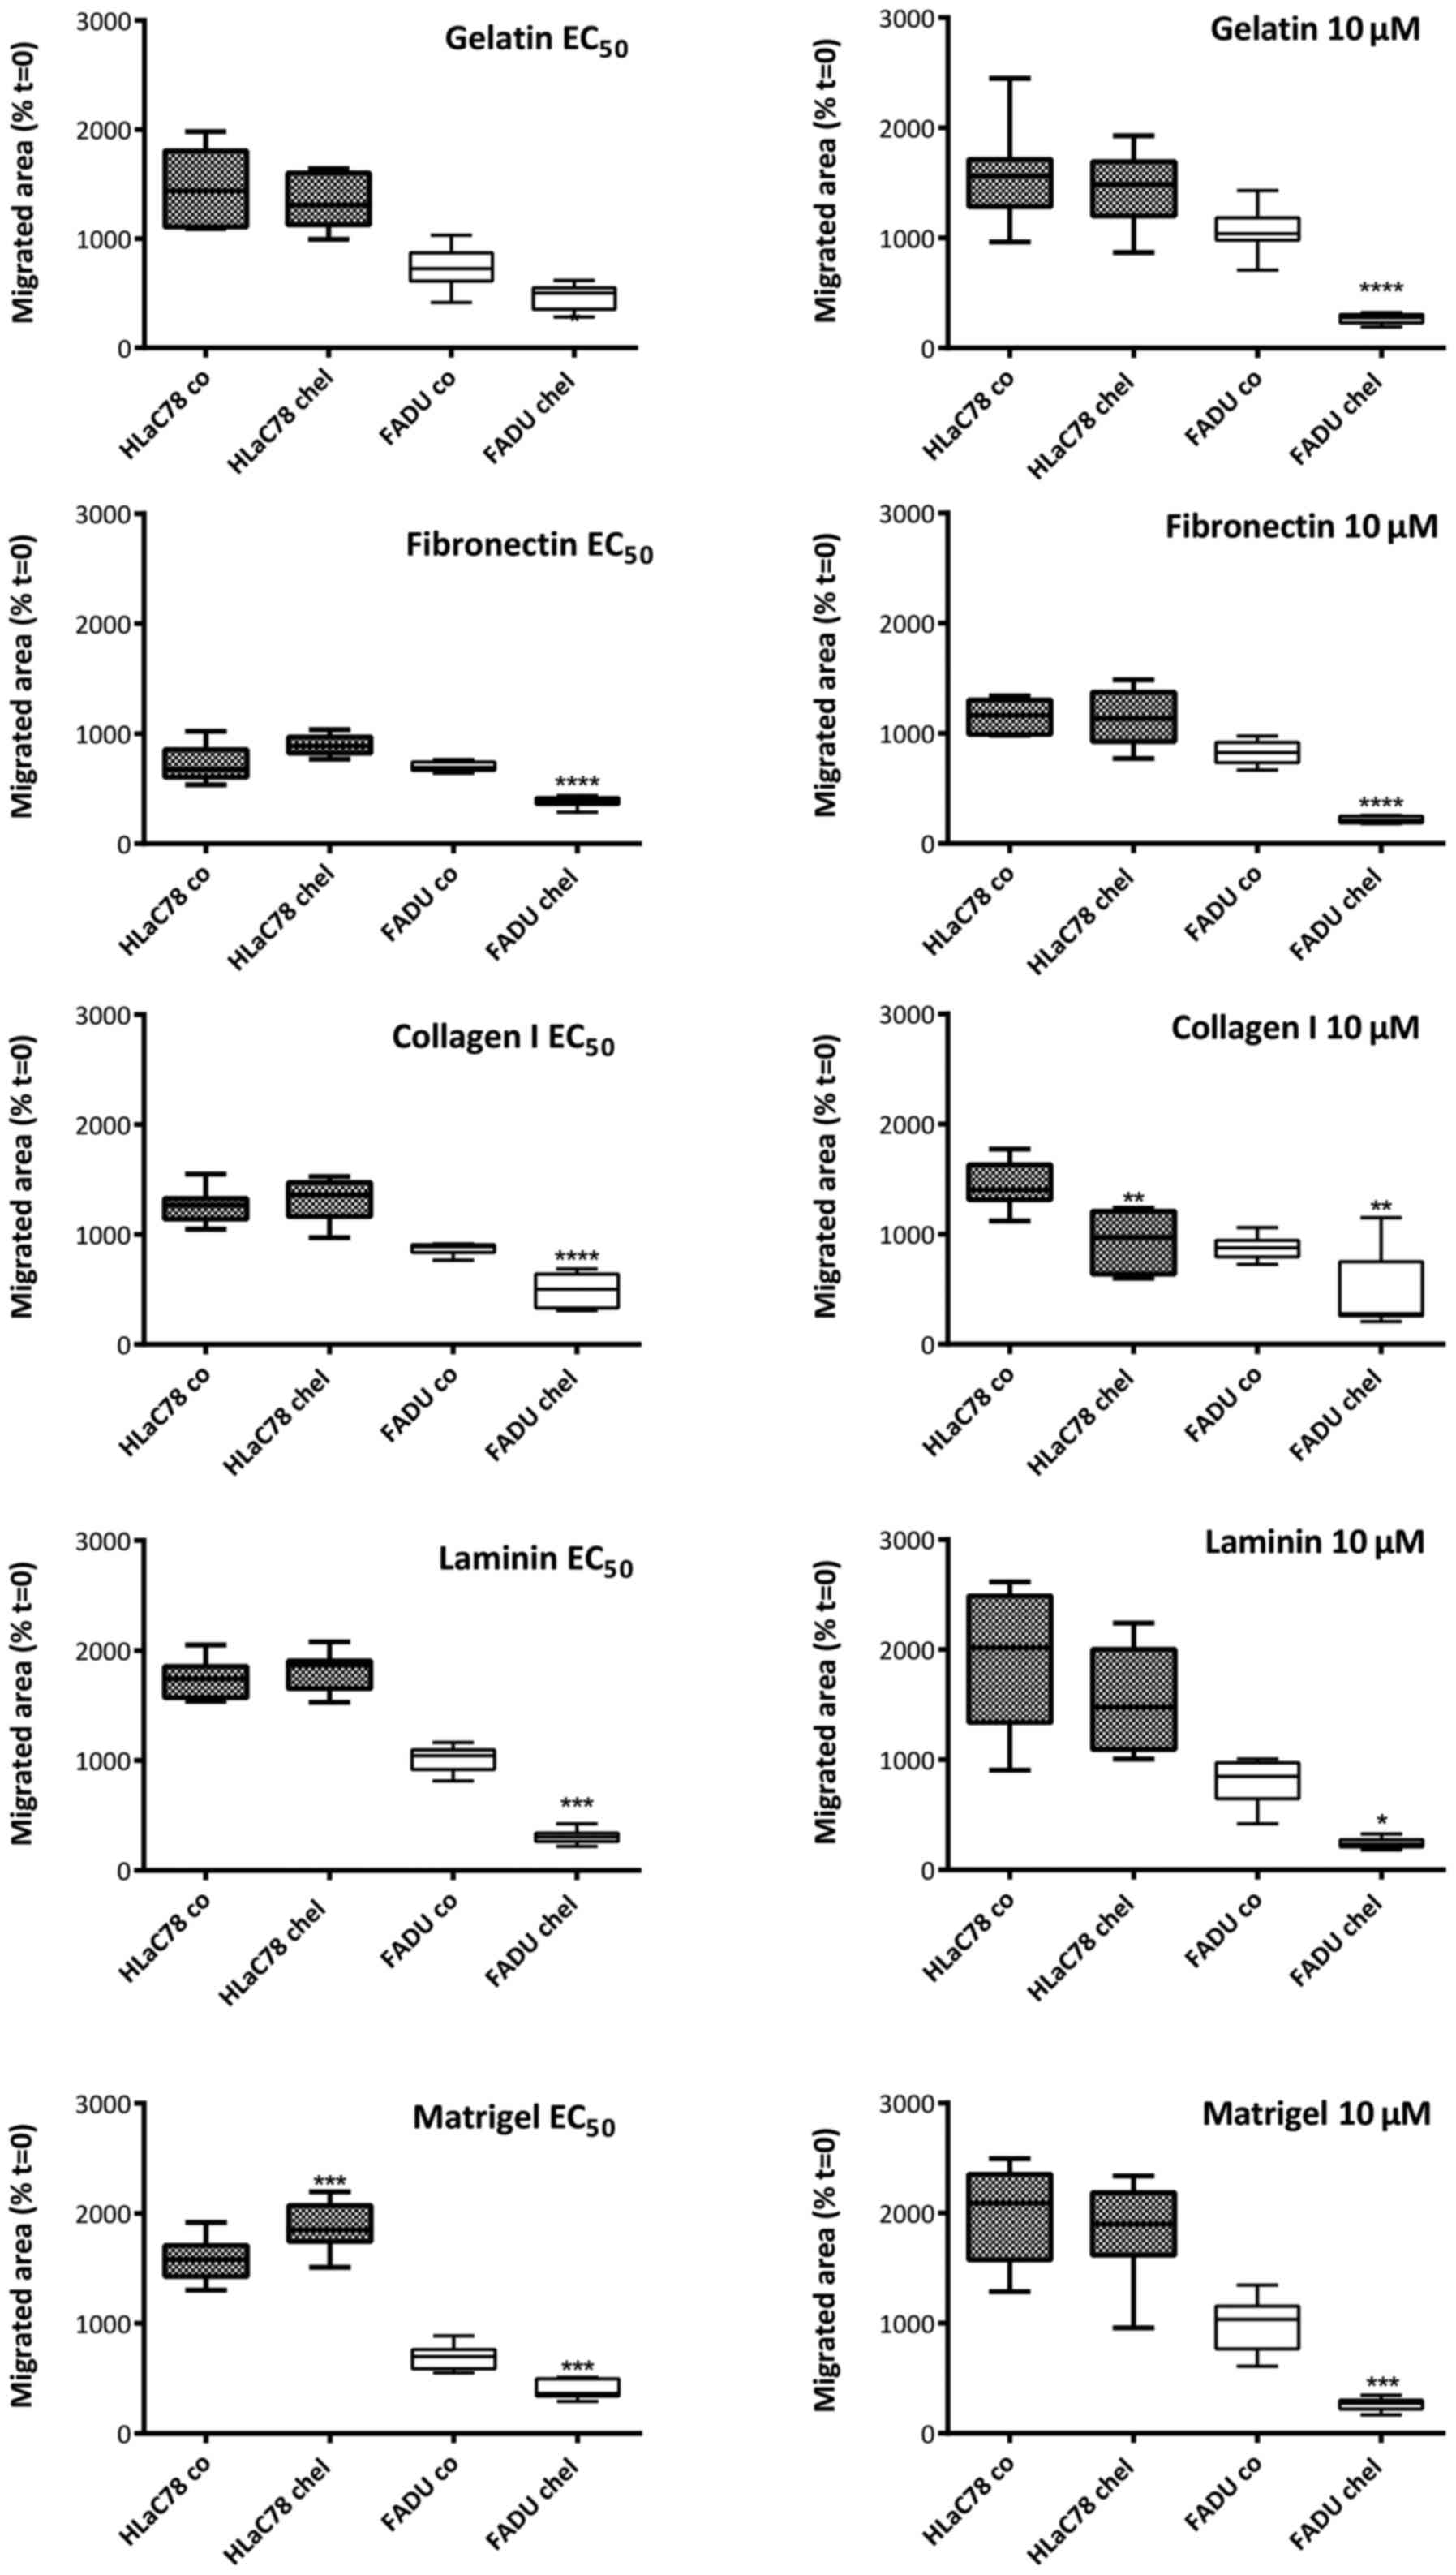
Cell motility on extracellular matrix
(ECM) proteins
Investigation of invasion and motility was carried
out using spheroid-based experiments. In contrast to the commonly
used Boyden Chamber assay this kind of invasion measurement proved
to be reliable and reproducible and considers substrate
specificity.
Spheroids of FADU and HLaC78 were grown in
ultra-low-attachment-plate (ULA-plate) wells and subsequently
transferred manually to wells, coated with different ECM
substrates: gelatin, fibronectin, laminin, collagen I and
Matrigel® and treated with or without chelidonine.
Images of the cells were captured after attachment of the spheroids
to ECM (1 h, t=0) and after 18 h (t=18).
For quantification of cells migrating out of
spheroids the coated wells at t=0 and t=18 were photographed and
outgrown areas were measured with ImageJ software (area
calculation). For each condition 8 spheroids were measured.
For calculation of cell motility the area at t=0 was
set at 100% and the percentage of invaded area was calculated.
Results are graphically summarized in Fig. 4.
At the calculated EC50 doses chelidonine
did not suppress the migration of HLaC78 cells. FaDu cells instead
were suppressed in their migration activity on all applied ECM
proteins in the presence of 1 µM chelidonine (Fig. 5). The elevated dose of 10 µM
significantly decreased migration of FaDu cells as expected. In the
highly invasive cell line HLaC78 even 10 µM chelidonine failed to
inhibit migration on four of five substrates.
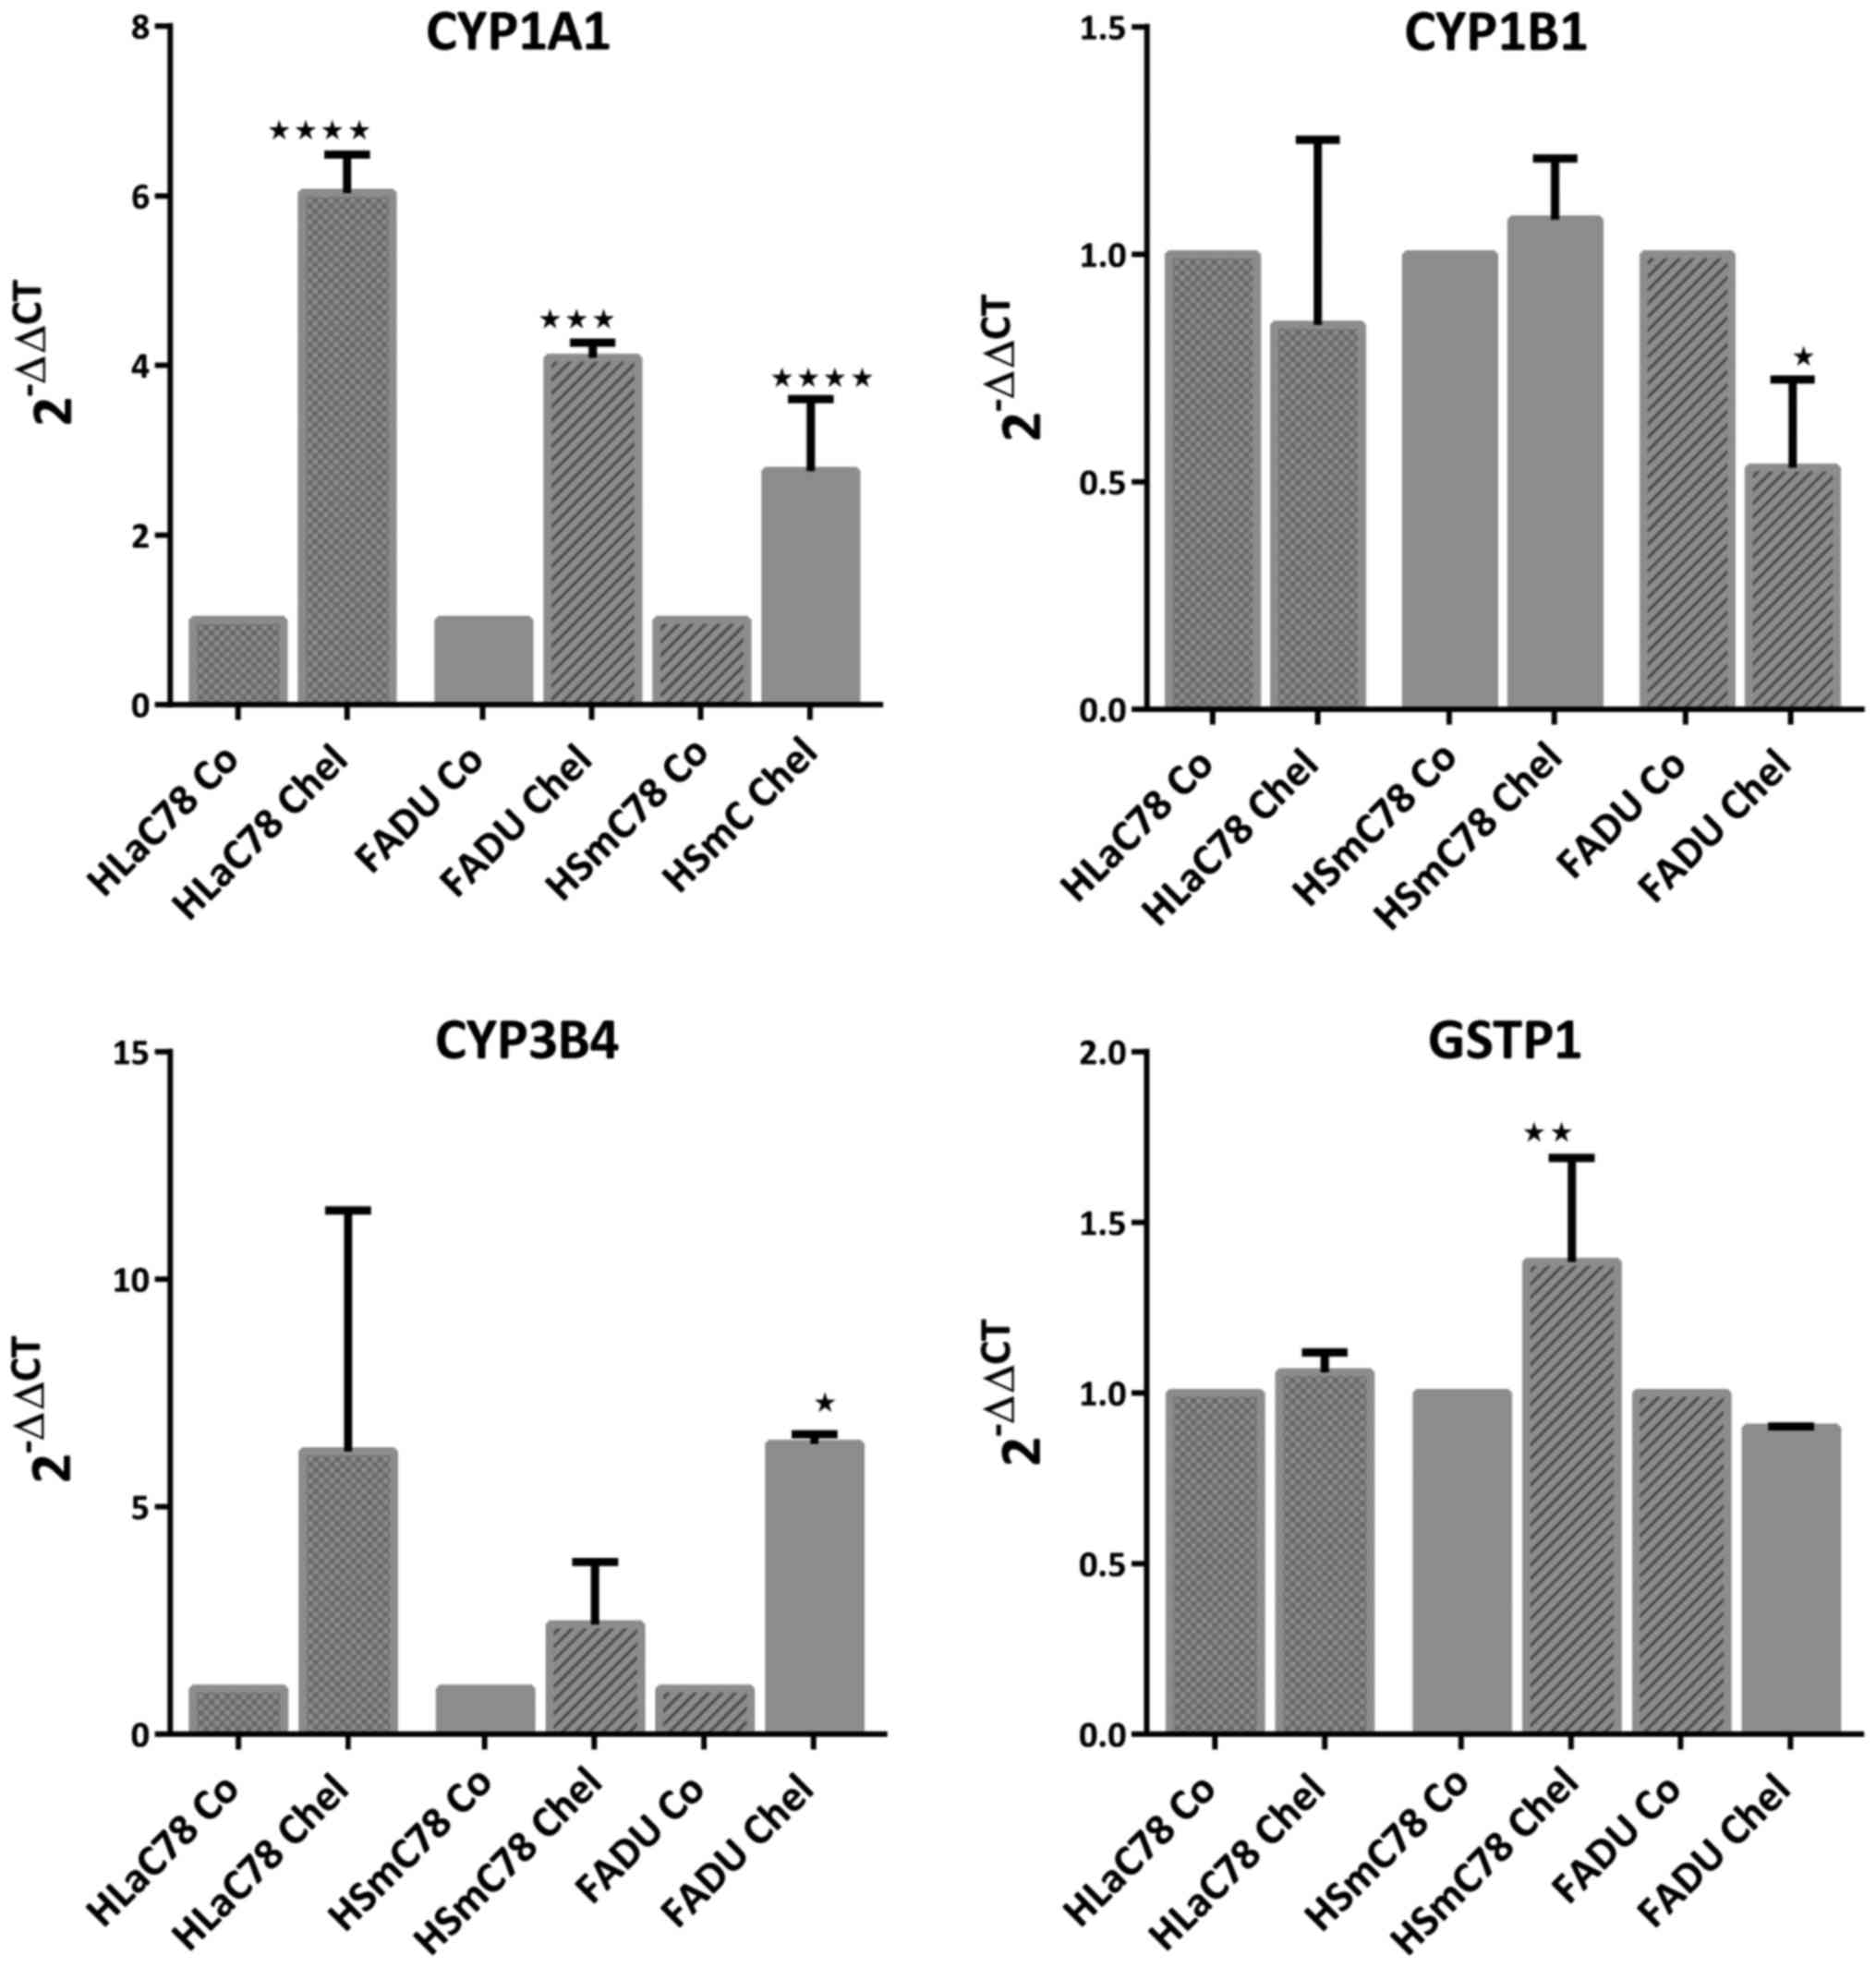
Gene expression
Microarrays of chelidonine treated FaDu cells did
not reveal significant changes in expression of genes, which could
be assigned to particular pathways or cell processes, even at the
elevated dose of 10 µM. Complete Data sets of microarrays are
deposited at Gene Expression Omnibus (http://www.ncbi.nlm.nih.gov/geo) with the identifier
GSE107464. For this reason we decided to examine the expression of
a set of genes, previously reported to be differentially expressed
upon chelidonine treatment (3). Thus,
we analyzed the expression of enzymes of drug metabolism
p-glycoprotein (ABCB1/mdr-1), cytochrome P450, family 1, members A1
and B1, and family 3, member A4 (CYP1A1, CYP1B1, CYP3A4) as well as
gluthation-S-transferase P1 (GSTP1). All these genes have been
reported to be strongly downregulated by chelidonine in Caco-2
colon carcinoma cells (3), suggesting
reduced drug resistance in chelidonine treated cells. The same
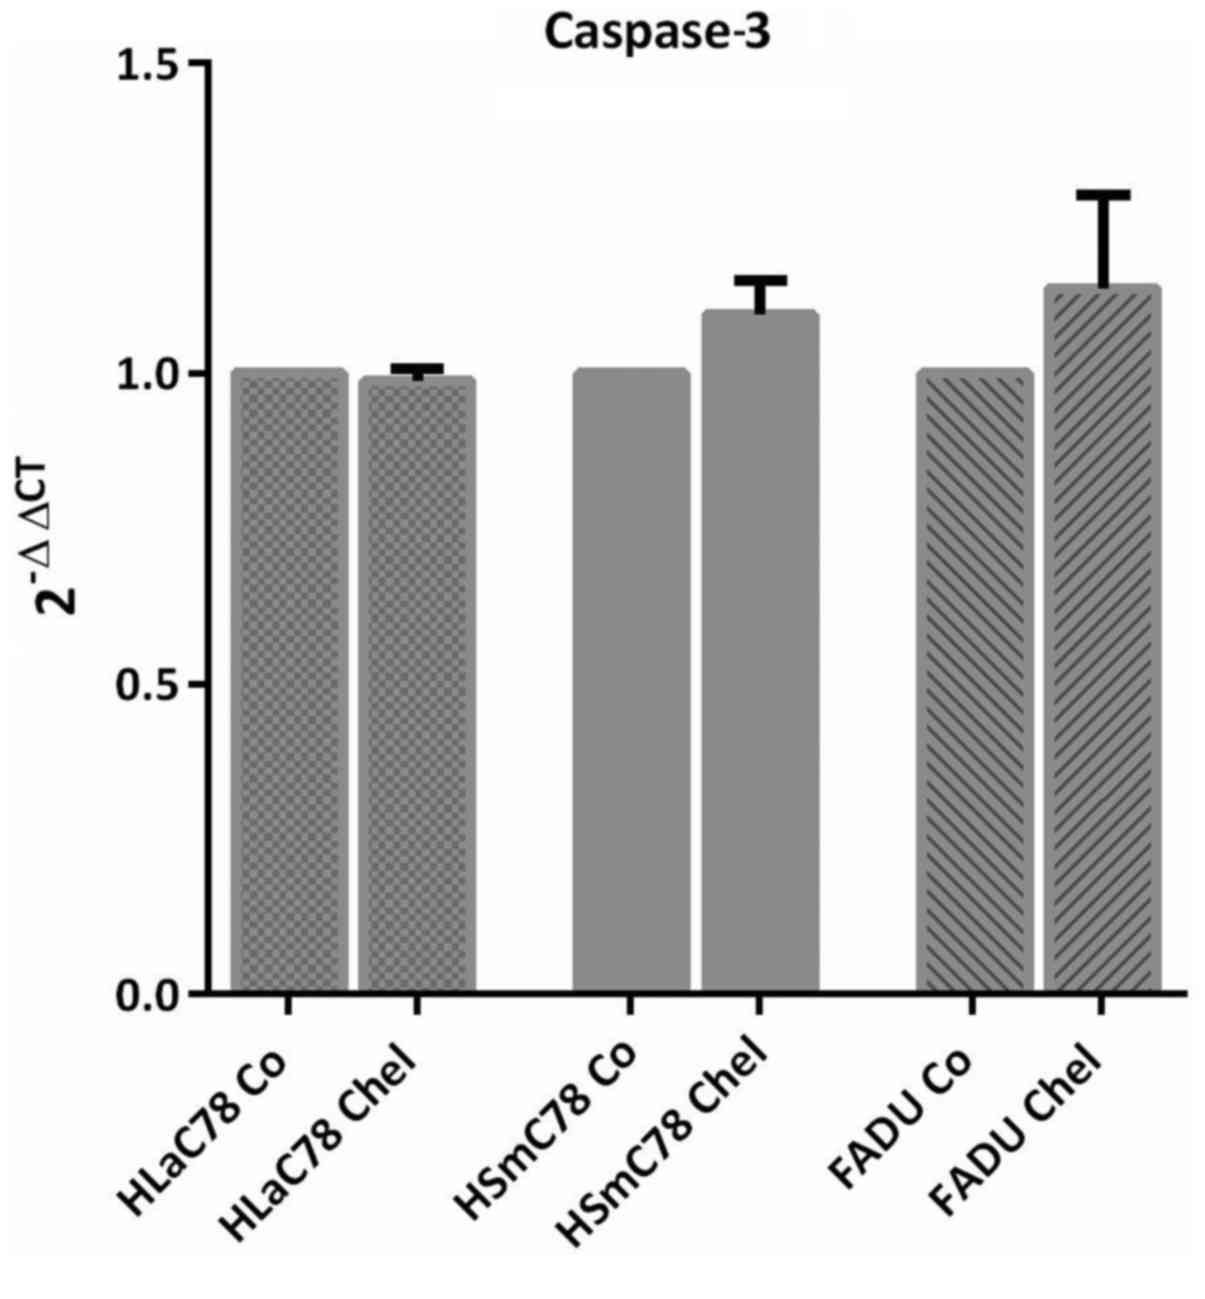
group has shown that caspase-3 was upregulated in Caco-2 cells.
Therefore, we studied expression of caspase-3 in HNSCC upon
chelidonine treatment.
None of the cytochrome P450 genes was downregulated
by chelidonine in the HNSCC system (Fig.
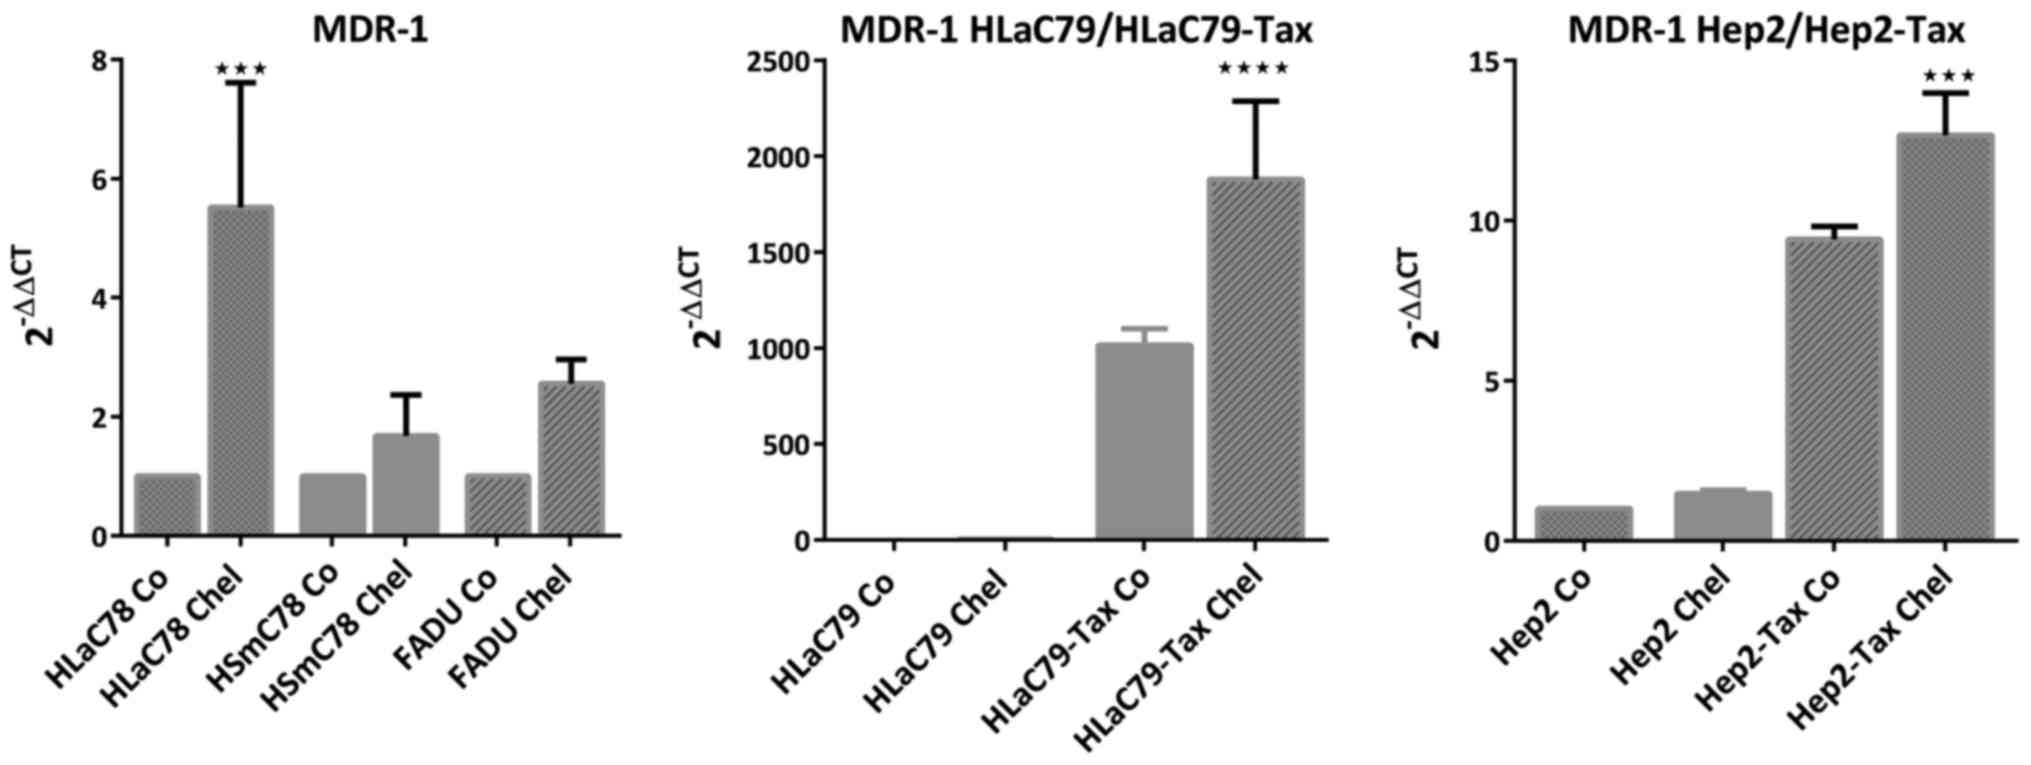
5). Similarly p-glycoprotein (MDR1) was upregulated by
chelidonine in HNSCC cell lines. Particularly in
MDR1-overexpressing taxol-resistant cell lines HLaC79-Tax and
Hep2-Tax transcription of the MDR-1 gene increased significantly
(Fig. 6).
Caspase-3 expression, which had been reported to be
upregulated by chelidonine (3)
reflects the results of the current apoptosis assay (see Fig. 3) and was not significantly upregulated
in HNSCC cell lines after chelidonine treatment (Fig. 7).
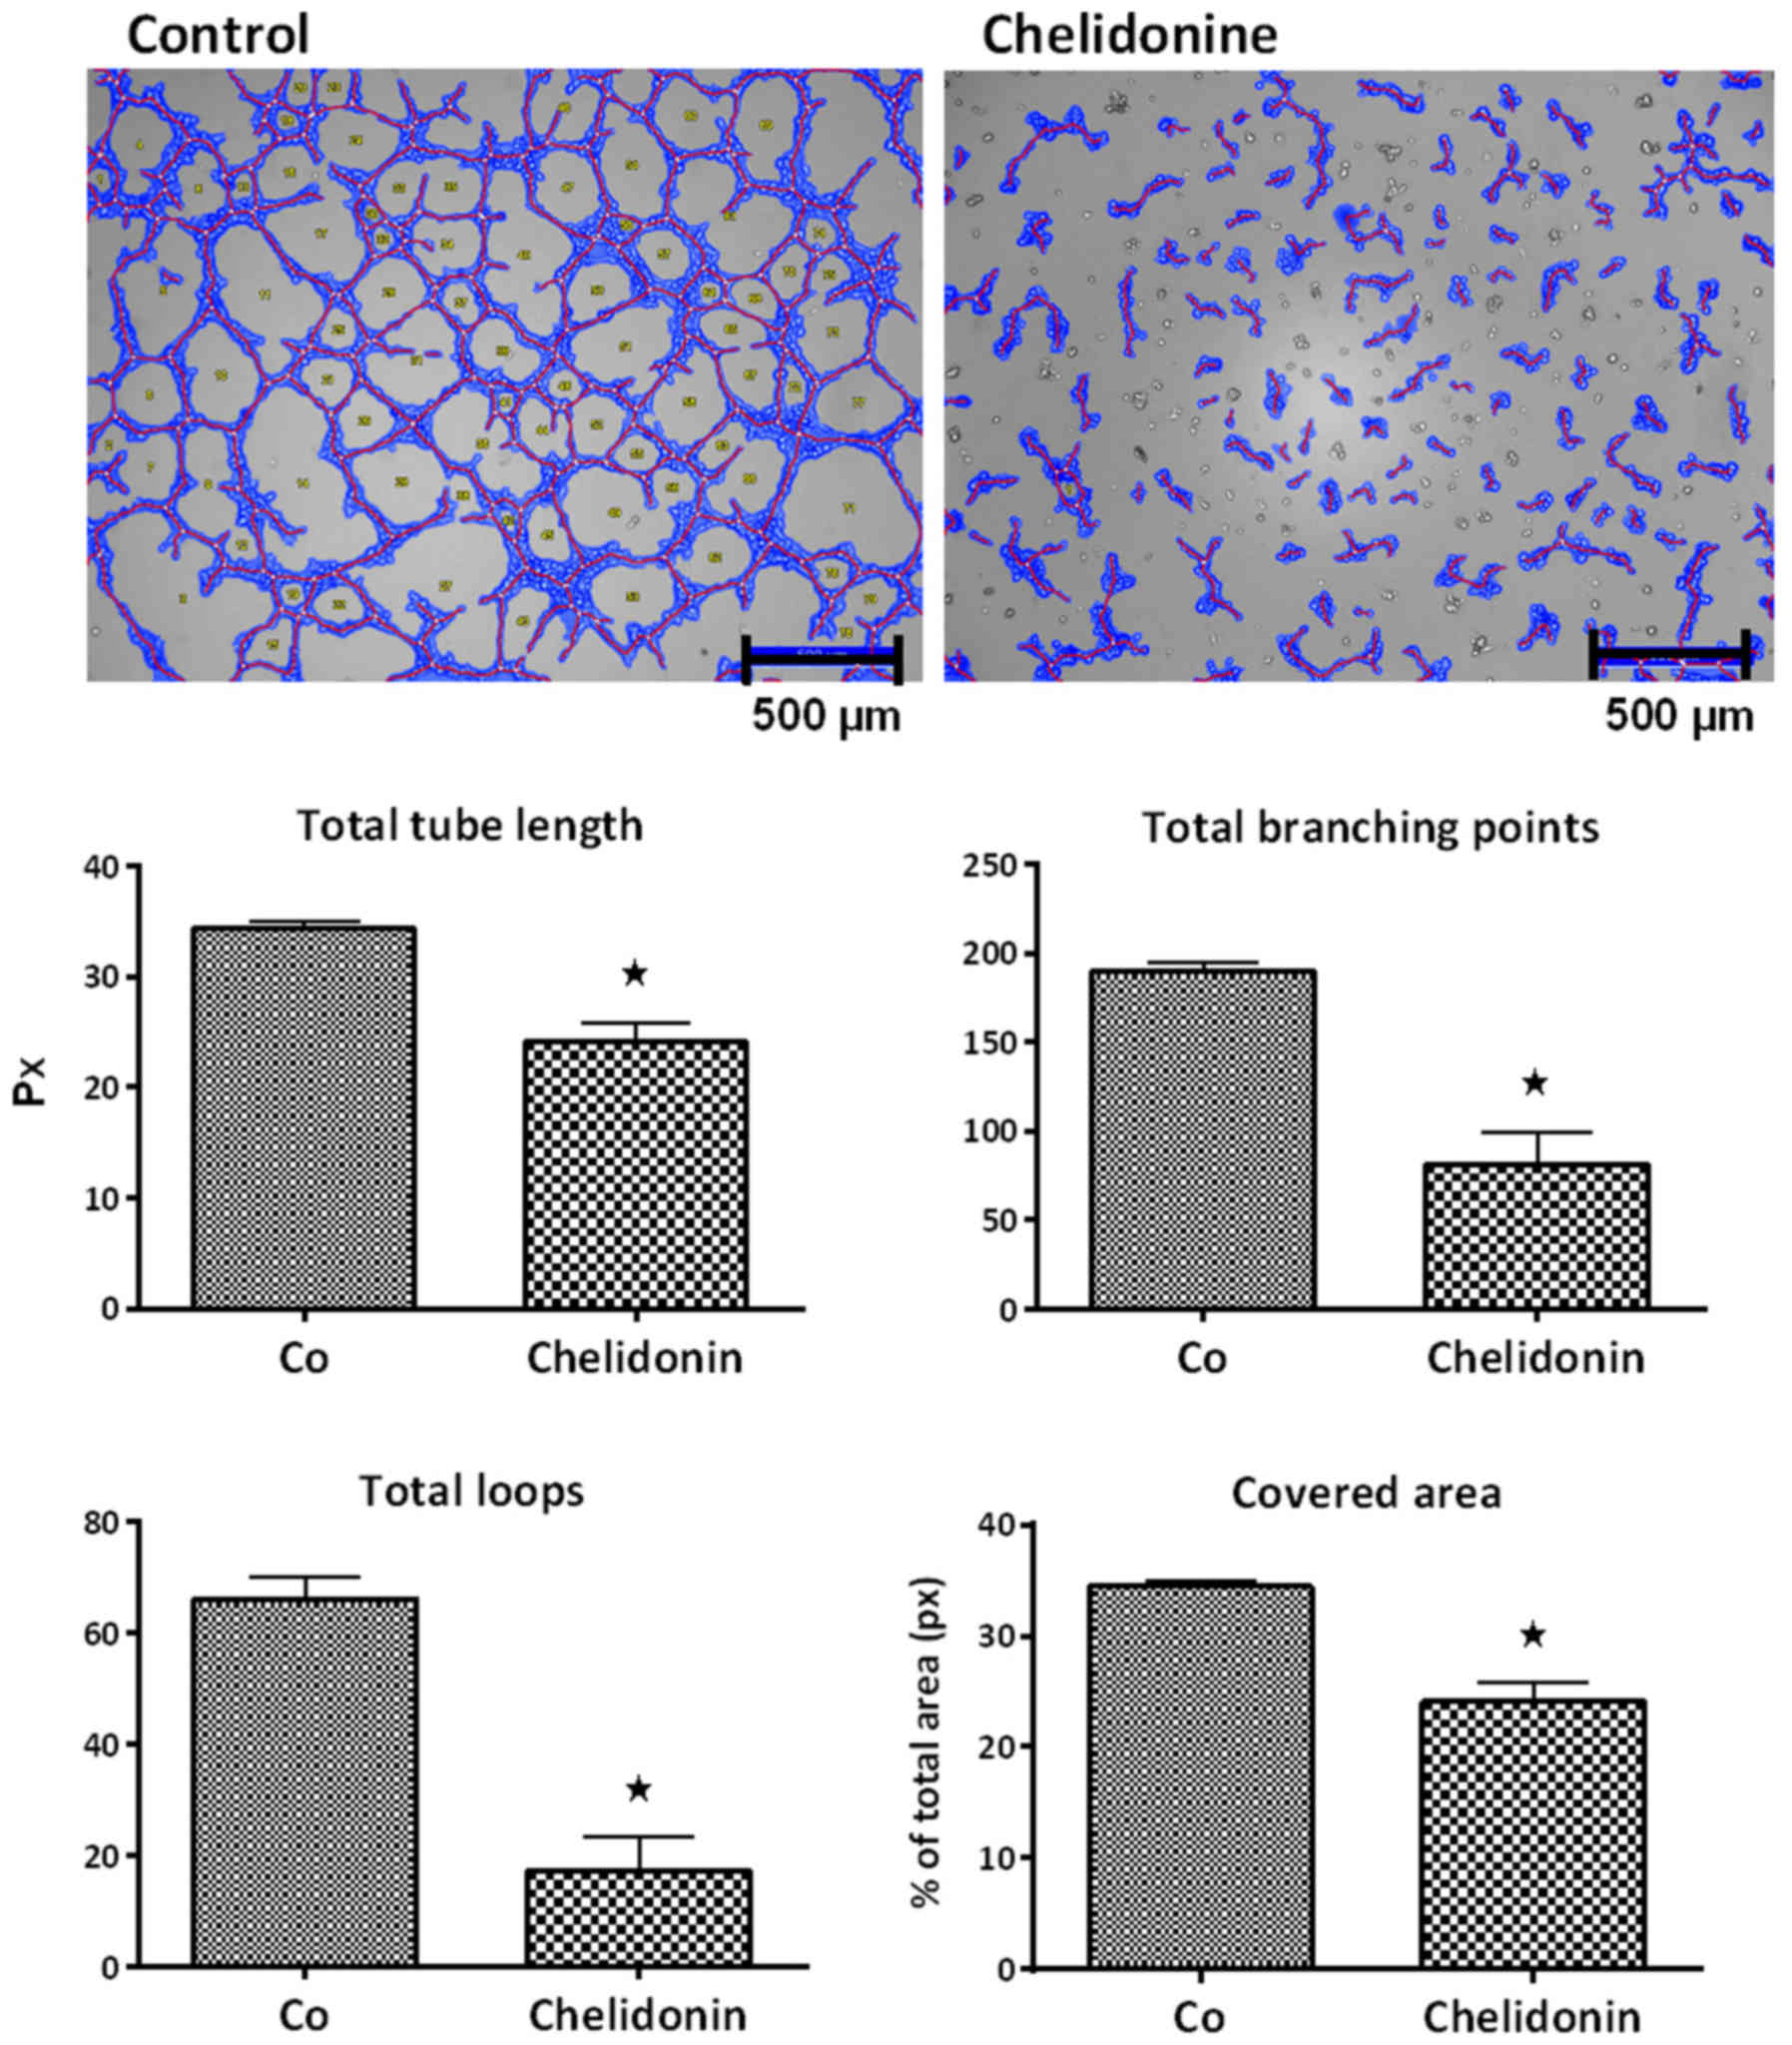
Angiogenesis
The anti-angiogenic potential of chelidonine was
determined using the tube formation assays. The tube formation
ability of human umbilical vein endothelial cells (HUVEC) on
Matrigel substrate in presence of 2 µM chelidonine was examined.
HUVEC showed disturbed tube formation in response to low dose
chelidonine (Fig. 8). Quantification
of inhibition using the WimTube image analysis revealed a
significant decrease in total tube length, total branching points,
total loops and covered area for chelidonine. Quantitative results
are summarized in Fig. 8.
Discussion
Within the present study, the main alkaloid of
Chelidonium majus, chelidonine, was examined for its effect
on HNSCC cell lines in vitro. Particularly, the influence of
this drug with respect to cell growth, apoptosis, migration and
angiogenesis on tumor cells as well as its cytotoxicity against
primary cells and tumour cells in a 3-dimensional context have been
investigated.
Chelidonine has previously been shown to act
cytotoxic on chemo-sensitive and chemo-resistant leukaemia, colon
cancer, hepatic cancer and cervical cancer cell lines (3). Within the present study chelidonine
EC50 values ranged between 0.14 and 111 µM, with the
highest resistance in p-glycoprotein expressing cell lines.
Here dose-response curves of chelidonine showed a
characteristic course through all cell lines/primary cell cultures
with a very steep decrease of viability between 0 and 10 µM doses.
Also characteristic was a plateau in dose-response curves, reached
at ~0 µM chelidonine. In a few cell lines viability even increased
at higher doses (data not shown).
This observation is nearly identical to that of
Panzer et al (10), who also
failed to get clear dose-dependent viability inhibition. The
results in monolayer cultures were confirmed by the spheroid growth
assay, where maximal growth suppression was reached with 10 µm
chelidonine. Increased doses did not enhance cytotoxic effects
further. Furthermore, Panzer et al (10) described a more pronounced inhibitory
effect of chelidonine on normal monkey kidney cells than on
foreskin fibroblasts, which corresponds to the low sensitivity of
mucosal fibroblasts in contrast to mucosal keratinocytes towards
chelidonine in the present study. Therefore it seems that
chelidonine is not selectively cytotoxic for tumor cells.
In contrast to the study of El-Readi (3) and others (11,12),
chelidonine was not able to trigger apoptosis in HNSCC cell lines
significantly. Caspase-3 was not upregulated by chelidonine in
HNSCC cell lines, thus confirming the results of the apoptosis
assay (Fig. 3).
Differential gene expression was investigated using
Affymetrix prime view cDNA arrays with the most sensitive cell line
FaDu and the EC50 concentration 1 µM as well as 10 µM
chelidonine. Data analysis using the Transcription Analysis Console
(Affymetrix) revealed no clear activation or repression of genes
assignable to particular pathways or cell processes. For this
reason we decided to refer to the only published gene expression
study on chelidonine (3) and analyzed
expression of some key genes of drug metabolism and apoptosis,
which have been shown to be strongly influenced by chelidonine in
Caco-2 cells (3). The genes, involved
in drug metabolism cytochrome P450 1A1, 1B1, 3A4 (CYP1A1, CYP1B1,
CYP3A4 and glutathione-S-transferase P1 (GSTP1) as well as the
multi-drug-resistance mediating p-glycoprotein (MDR1) have been
reported to be downregulated by chelidonine in Caco-2 colon
carcinoma cells. The authors concluded that the tested colon cancer
cells overcome drug resistance upon chelidonine treatment. With
HNSCC cell lines these results could not be confirmed. Chelidonine
clearly increased expression of the xenobiotic metabolism genes
CYP1A1 and CYP3A4, whereas expression of GSTP1 and CYP1B1 remained
unchanged in most cases. MDR1 was significantly upregulated in
drug-resistant cell lines HLaC79-Tax and Hep2-Tax upon chelidonine
treatment. As a consequence, the results of the present study would
indicate an increased drug resistance in HNSCC cell lines caused by
chelidonine in vitro. The role of the mainly extrahepatic
occurring CYP1 family, which belongs to the cytochrome P450 system,
and particularly that of CYP1A1 is controversially discussed.
CYP1A1, mainly occurring in non-hepatic tissue, has been shown to
be involved in carcinogenesis by activating pro-carcinogens, such
as N-nitrosamines. On the other hand it has been shown to act
cancer-preventive by metabolizing and thus activating dietary
compounds, such as flavonoids [for review see Androutsopoulos et
al (13)]. Therefore, it could
not be decided, if the in HNSCC cells observed overexpression of
CYP1A1, due to chelidonine, contributes to the cytotoxicity
of the drug or to a progression in drug resistance.
Tube formation assay with HUVEC cells, plated on BME
and cultivated with chelidonine, revealed a significant inhibition
of angiogenesis. To date, there are no comparable studies on
angiogenesis in connection with chelidonine. In the present study,
however, we have to consider, that the nature of the tube formation
assay is merely suitable for the evaluation of endogenous
inhibition processes within the endothelial cells. No other cells
or growth factors participated in this experimental setup. These
possible endogenous angiogenesis inhibition may be based on the
interference with endothelial adhesion factors, intrinsic pathways
or other targets in endothelial cells (14).
Cell migration is crucial for tumor formation and
progression by invading surrounding tissues (15). Particularly in HNSCC, this process can
be life-threatening, even without (distant) metastasis. The 3D
based spheroid migration assay used in the present study, reflects
the heterogenic tumor microenvironment better than commonly used
Transwell-based assays. Additionally, it considers interactions
with different ECM proteins. Tumor cells organized as 3D spheroids,
mimic non-vascularized tumors with discrete zones of growing and
quiescent cells, as well as a necrotic center (16). The cell lines HLaC78 and FaDu show the
tendency to leave the spheroid as a model for multicellular tissue
upon getting in contact with ECM-coated surfaces, with HLaC78
invading more aggressive than FaDu. This tumor invasion model was
used to evaluate the influence of chelidonine on the migration on
gelatin, laminin, fibronectin, collagen type I and
Matrigel®. Chelidonine effectively suppressed migration
of FaDu on all ECM surfaces tested, even at the EC50
dose of 1 µm. In the invasive cell line HLaC78 however, only the
elevated dose of 10 µm chelidonine was sufficient to inhibit
migration on collagen. This observation is in agreement with the
findings of Kim et al (17),
who previously proposed chelidonine to be a potential drug for
treatment of metastatic/invasive tumors, on basis of in
vitro studies with breast cancer cell lines.
Summarizing our results, chelidonine turned out to
be disappointing concerning cancer cell type specificity. Both
primary and cancer cells were affected by chelidonine. There was no
clear dose-dependent action and a strong apoptotic reaction could
not be achieved in HNSCC cell lines.
Acknowledgements
Not applicable.
Funding
No funding was received.
Availability of data and material
The datasets used and/or analyzed during the current
study are available from the corresponding author on reasonable
request.
Authors' contributions
RH performed all cell culture experiments and
RT-qPCR. JR assisted with the molecular biological experiments. CP
was responsible for cell culture maintenance. MS evaluated the
results and assisted in writing the manuscript.
Ethics approval and consent to
participate
Written informed consent was obtained beforehand,
and the study was approved by the Institutional Ethics Committee on
human research of the Julius-Maximilians-University Wuerzburg
(Approval no. 16/06).
Consent for publication
Not applicable.
Competing interests
The authors declare that they have no competing
interests.
Glossary
Abbreviations
Abbreviations:
|
ECM
|
extracellular matrix
|
|
HNSCC
|
head and neck squamous cell
carcinoma
|
|
OSCC
|
oral squamous cell carcinoma
|
|
MDR-1
|
gene locus multi drug resistance-1,
coding for p-glycoprotein
|
|
VEGF
|
vascular endothelial growth factor
|
References
|
1
|
Goerner M, Seiwert TY and Sudhoff H:
Molecular targeted therapies in head and neck cancer-an update of
recent developments. Head Neck Oncol. 2:82010. View Article : Google Scholar : PubMed/NCBI
|
|
2
|
Hartwell JL: Plants used against cancer a
survey Quarterman Publications. Lawrence, Mass: 1982
|
|
3
|
El-Readi MZ, Eid S, Ashour ML, Tahrani A
and Wink M: Modulation of multidrug resistance in cancer cells by
chelidonine and Chelidonium majus alkaloids. Phytomedicine.
20:282–294. 2013. View Article : Google Scholar : PubMed/NCBI
|
|
4
|
Zenner HP, Lehner W and Herrmann IF:
Establishment of carcinoma cell lines from larynx and submandibular
gland. Arch Otorhinolaryngol. 225:269–277. 1979. View Article : Google Scholar : PubMed/NCBI
|
|
5
|
Zenner HP, Herrmann IF, Bremer W and
Stahl-Maugé C: Head and neck carcinoma models. In vivo reproduction
in athymic mice and in vitro culture. Acta Otolaryngol. 95:371–381.
1983. View Article : Google Scholar : PubMed/NCBI
|
|
6
|
Schmidt M, Grünsfelder P and Hoppe F:
Induction of matrix metalloproteinases in keratinocytes by
cholesteatoma debris and granulation tissue extracts. Eur Arch
Otorhinolaryngol. 257:425–429. 2000. View Article : Google Scholar : PubMed/NCBI
|
|
7
|
Irizarry RA, Hobbs B, Collin F,
Beazer-Barclay YD, Antonellis KJ, Scherf U and Speed TP:
Exploration, normalization, and summaries of high density
oligonucleotide array probe level data. Biostatistics. 4:249–264.
2003. View Article : Google Scholar : PubMed/NCBI
|
|
8
|
Bolstad BM, Irizarry RA, Astrand M and
Speed TP: A comparison of normalization methods for high density
oligonucleotide array data based on variance and bias.
Bioinformatics. 19:185–193. 2003. View Article : Google Scholar : PubMed/NCBI
|
|
9
|
Livak KJ and Schmittgen TD: Analysis of
relative gene expression data using real-time quantitative PCR and
the 2−ΔΔCT method. Methods. 25:402–408. 2001.
View Article : Google Scholar : PubMed/NCBI
|
|
10
|
Panzer A, Joubert AM, Bianchi PC, Hamel E
and Seegers JC: The effects of chelidonine on tubulin
polymerisation, cell cycle progression and selected signal
transmission pathways. Eur J Cell Biol. 80:111–118. 2001.
View Article : Google Scholar : PubMed/NCBI
|
|
11
|
Paul A, Bishayee K, Ghosh S, Mukherjee A,
Sikdar S, Chakraborty D, Boujedaini N and Khuda-Bukhsh AR:
Chelidonine isolated from ethanolic extract of Chelidonium majus
promotes apoptosis in HeLa cells through p38-p53 and PI3K/AKT
signalling pathways. Zhong Xi Yi Jie He Xue Bao. 10:1025–1038.
2012. View Article : Google Scholar : PubMed/NCBI
|
|
12
|
Havelek R, Seifrtova M, Kralovec K,
Krocova E, Tejkalova V, Novotny I, Cahlikova L, Safratova M,
Opletal L, Bilkova Z, et al: Comparative cytotoxicity of
chelidonine and homochelidonine, the dimethoxy analogues isolated
from Chelidonium majus L. (Papaveraceae), against human leukemic
and lung carcinoma cells. Phytomedicine. 23:253–266. 2016.
View Article : Google Scholar : PubMed/NCBI
|
|
13
|
Androutsopoulos VP, Tsatsakis AM and
Spandidos DA: Cytochrome P450 CYP1A1: Wider roles in cancer
progression and prevention. BMC Cancer. 9:1872009. View Article : Google Scholar : PubMed/NCBI
|
|
14
|
El-Kenawi AE and El-Remessy AB:
Angiogenesis inhibitors in cancer therapy: Mechanistic perspective
on classification and treatment rationales. Br J Pharmacol.
170:712–729. 2013. View Article : Google Scholar : PubMed/NCBI
|
|
15
|
Vinci M, Box C, Zimmermann M and Eccles
SA: Tumor spheroid-based migration assays for evaluation of
therapeutic agents. Methods Mol Biol. 986:253–266. 2013. View Article : Google Scholar : PubMed/NCBI
|
|
16
|
Mehta G, Hsiao AY, Ingram M, Luker GD and
Takayama S: Opportunities and challenges for use of tumor spheroids
as models to test drug delivery and efficacy. J Control Release.
164:192–204. 2012. View Article : Google Scholar : PubMed/NCBI
|
|
17
|
Kim O, Hwangbo C, Kim J, Li DH, Min BS and
Lee JH: Chelidonine suppresses migration and invasion of MDA-MB-231
cells by inhibiting formation of the integrin-linked
kinase/PINCH/α-parvin complex. Mol Med Rep. 12:2161–2168. 2015.
View Article : Google Scholar : PubMed/NCBI
|