Introduction
Cervical cancer is the fourth most prevalent type of
malignancy in females worldwide (1).
It is responsible for an estimated 520,000 new diagnoses and
270,000 mortalities annually (2). In
China, it ranks as the eighth most frequent type of cancer in
females, and the second most frequent cancer in females aged
between 15 and 44. A previous study reported that 43% of diagnosed
patients are <45, and 20–28% are <40 years old (3). In recent years, there has been a
decrease in the incidence and mortality rates for cervical cancer
in developed countries, which has been attributed to the
effectiveness of screening tests. However, the incidence rate
remains high in developing countries, accounting for 85% of all
cases (4). Surgery is the curative
treatment for cervical cancer. The earlier in disease progression a
diagnosis is achieved, the better the prognosis and overall patient
survival time are likely to be.
Sophisticated online tools combined with
high-throughput analysis and general data availability enable the
scientific community to uncover novel information regarding genes
associated with cancer development at an unprecedented rate
(5). Molecular biomarkers are
associated with the detection/diagnosis of the disease, whereas
prognostic biomarkers offer information about its course and the
likelihood of recurrence (6).
Predictive biomarkers estimate the response to treatment. The
presence, absence or change in specific cell biomarkers may
indicate the development of cancer. Ultimately, the identification
and detection of these cancer-specific biomarkers may be of use in
the early diagnosis and monitoring of the disease (7–9).
Microarrays, including DNA, microRNA, protein and
antibody microarrays, are multiplex labs-on-a-chip. They can be
used to assay significant amounts of biological material using
high-throughput screening. This screening uses miniaturized and
multiplexed parallel processing and detection methods. It is
popular technology in recent years (10,11) and is
commonly used to obtain data regarding genetic alterations during
tumorigenesis (12,13). This data may be critical in the
identification of biomarkers. In the present study, data from three
mRNA microarray datasets and a microRNA dataset were used to
analyze the differentially expressed genes (DEGs) and microRNAs
(DEMs) in cervical cancer compared with normal cervical tissue.
Bioinformatics methods, including function and pathway enrichment
analysis using Kyoto Encyclopedia of Genes and Genomes (KEGG) and
Gene Ontology (GO), and survival analysis using the OncoLnc tool,
were used to identify the key genes in cervical cancer.
Materials and methods
Microarray datasets and data
processing
A total of 3 human cervical cancer mRNA expression
datasets [GSE9750 (14), GSE46857
(15) and GSE67522 (16)] and 1 human cervical cancer miRNA
expression dataset [GSE30656 (17)]
were selected randomly and downloaded from the Gene Expression
Omnibus database (GEO). All the datasets contained a comparison
between cervical cancer and normal cervix tissue samples. The three
gene expression datasets included 54 cervical cancer tissue
samples, and 38 normal cervix tissue samples from women without
cervical cancer. The miRNA dataset comprised of 10 normal cervix
tissue samples, and 19 squamous cell carcinoma or adenocarcinoma
tissue samples. All four datasets were produced and uploaded to GEO
by independent research groups. These datasets were based on 4
different Affymetrix platforms, including GPL96, GPL16690, GPL10558
and GPL6955 (Thermo Fisher Scientific, Inc., Waltham, MA, USA);
these are all preferred platforms for biomarker cancer
research.
GEO2R, an online tool comparing groups in GEO
datasets, was used to identify DEGs and DEMs between cervical
cancer and normal tissue samples. Genes were selected with the
criteria of Benjamini and Hochberg adjusted P<0.01, and log
fold-change >1 or <-1. Finally, the ‘Calculate and draw
custom Venn diagrams’ online tool (http://bioinformatics.psb.ugent.be/webtools/Venn/) was
used to identify the significantly upregulated or downregulated
genes across all three GEO mRNA datasets.
Protein-protein interaction (PPI)
network construction and functional pathway enrichment
analysis
The Search Tool for the Retrieval of Interacting
Genes (STRING) database was used to identify and visualize the
functional interactions between proteins (18). The Database for Annotation,
Visualization and Integrated Discovery (DAVID), an online program
that aids in the understanding of the biological function of genes,
was used to perform a functional enrichment analysis of the DEGs,
including Gene Ontology (GO) and Kyoto Encyclopedia of Genes and
Genomes (KEGG) pathway enrichment analyses (19). A false discovery rate threshold was
set at P<0.05.
Validation of miRNA targets
The miRecords tool was used to identify the
validated target genes of the DEMs. The miRecords tool provides a
comprehensive search for scientific papers regarding miRNAs and
their target genes from the National Centre for Biotechnology
Information (20). The ‘Calculate and
draw custom Venn diagrams’ tool was used to identify the target
genes of the identified DEMs within the list of identified
DEGs.
Survival analysis
The OncoLnc tool (www.oncolnc.org) was used to conduct an overall
survival analysis for patients with cervical cancer. OncoLnc is an
online tool for interactively exploring the survival data of 8,647
patients from 21 cancer studies in The Cancer Genome Atlas (TCGA),
along with mRNA and miRNA RNA-Seq expression data from TCGA. The
tool allows the production of Kaplan-Meier plots stratified by gene
expression levels. Log-rank P-values in survival analysis were
recorded. 80th (upper) percentiles and 20th (lower) percentiles
were considered as high and low groups. The OncoLnc tool was also
used to conduct an overall survival analysis for other types of
cancer, including breast, lung, colorectal and prostate cancer. To
research further into the association of cervical cancer with the
DEGs regulated by DEMs, including Ras homolog family member B
(RhoB) and Stathmin 1 (STMN1), all cervical cancer data were
downloaded from TCGA. Using this data, the association between
RhoB/STMN1 expression and survival time for patients with cervical
cancer was analyzed.
DEGs basic expression state in
different organs
The Human Protein Atlas (HPA; www.proteinatlas.org), an open-access database of the
genome-wide expression of genes in various organ types (21), was used to identify the basic
expression level of DEGs in different human organs. In the present
study, three datasets were used; the HPA dataset (RNA-seq data mean
values for different individual samples from each tissue reported
as mean transcripts per million), the Genotype-Tissue Expression
(GTEx) project dataset (RNA-seq data reported as median reads per
kilobase per million mapped reads) and the Functional Annotation of
the Mammalian Genome (FANTOM5) dataset (obtained through cap
analysis of gene expression, reported as tags per million).
Statistical analysis
Statistical analysis was performed with GraphPad
Prism 7 (GraphPad Software, Inc., La Jolla, CA, USA) and Microsoft
Excel 2017 (Microsoft Corporation, Redmond, WA, USA). Kaplan-Meier
analysis and log-rank test were used in overall survival analysis
(by OncoLnc) and pathway enrichment analysis (by DAVID). ANOVA and
a Student-Newman-Keuls-q post hoc test were used for multiple group
comparisons. P<0.05 was considered to indicate a statistically
significant difference.
Results
Identification of DEGs in microarray
datasets and PPI network construction
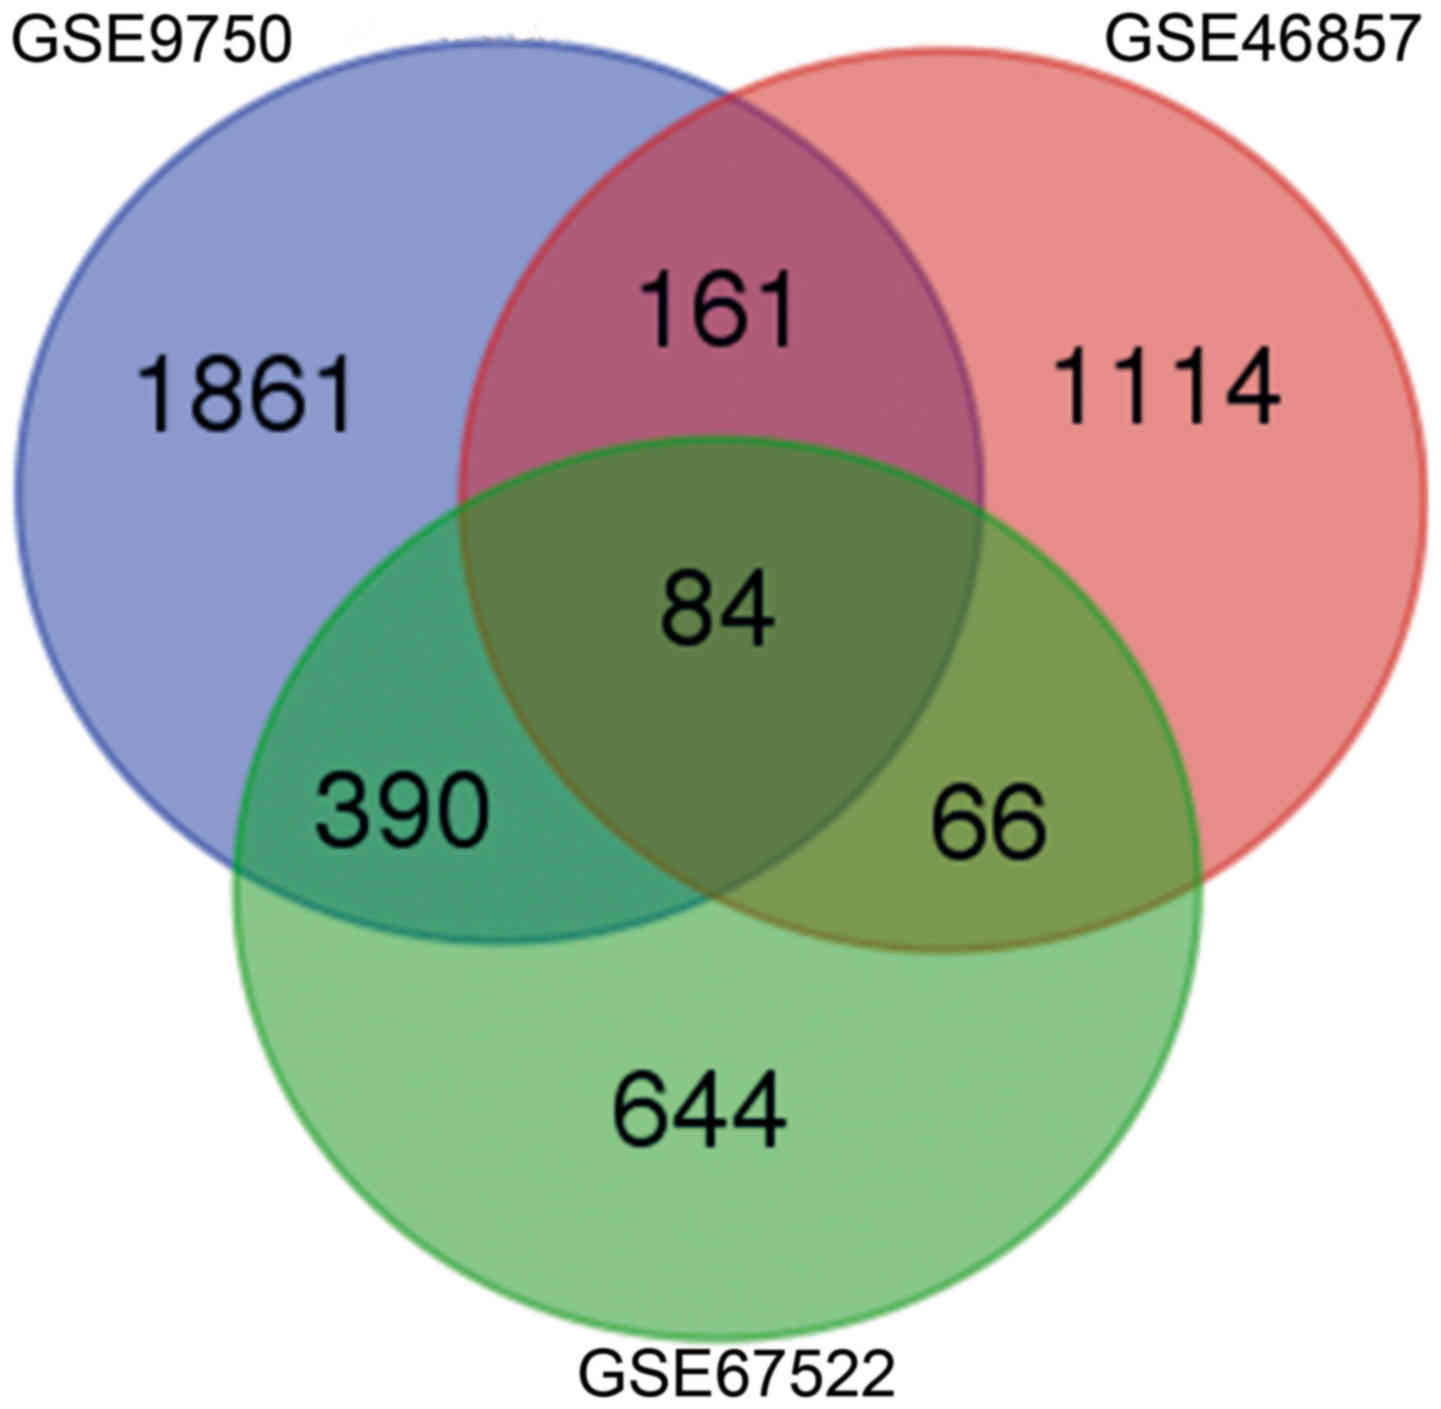
A total of 2,496, 1,425 and 1,184 DEGs were
identified in cervical cancer tissue compared with normal tissue
samples in the GSE9750, GSE46857 and GSE67522 datasets,
respectively. The 73 genes with a consistent trend in three
microarrays towards being either upregulated or downregulated were
considered DEGs in all three datasets (Fig. 1; Table
I). Specifically, 45 genes were consistently upregulated and 28
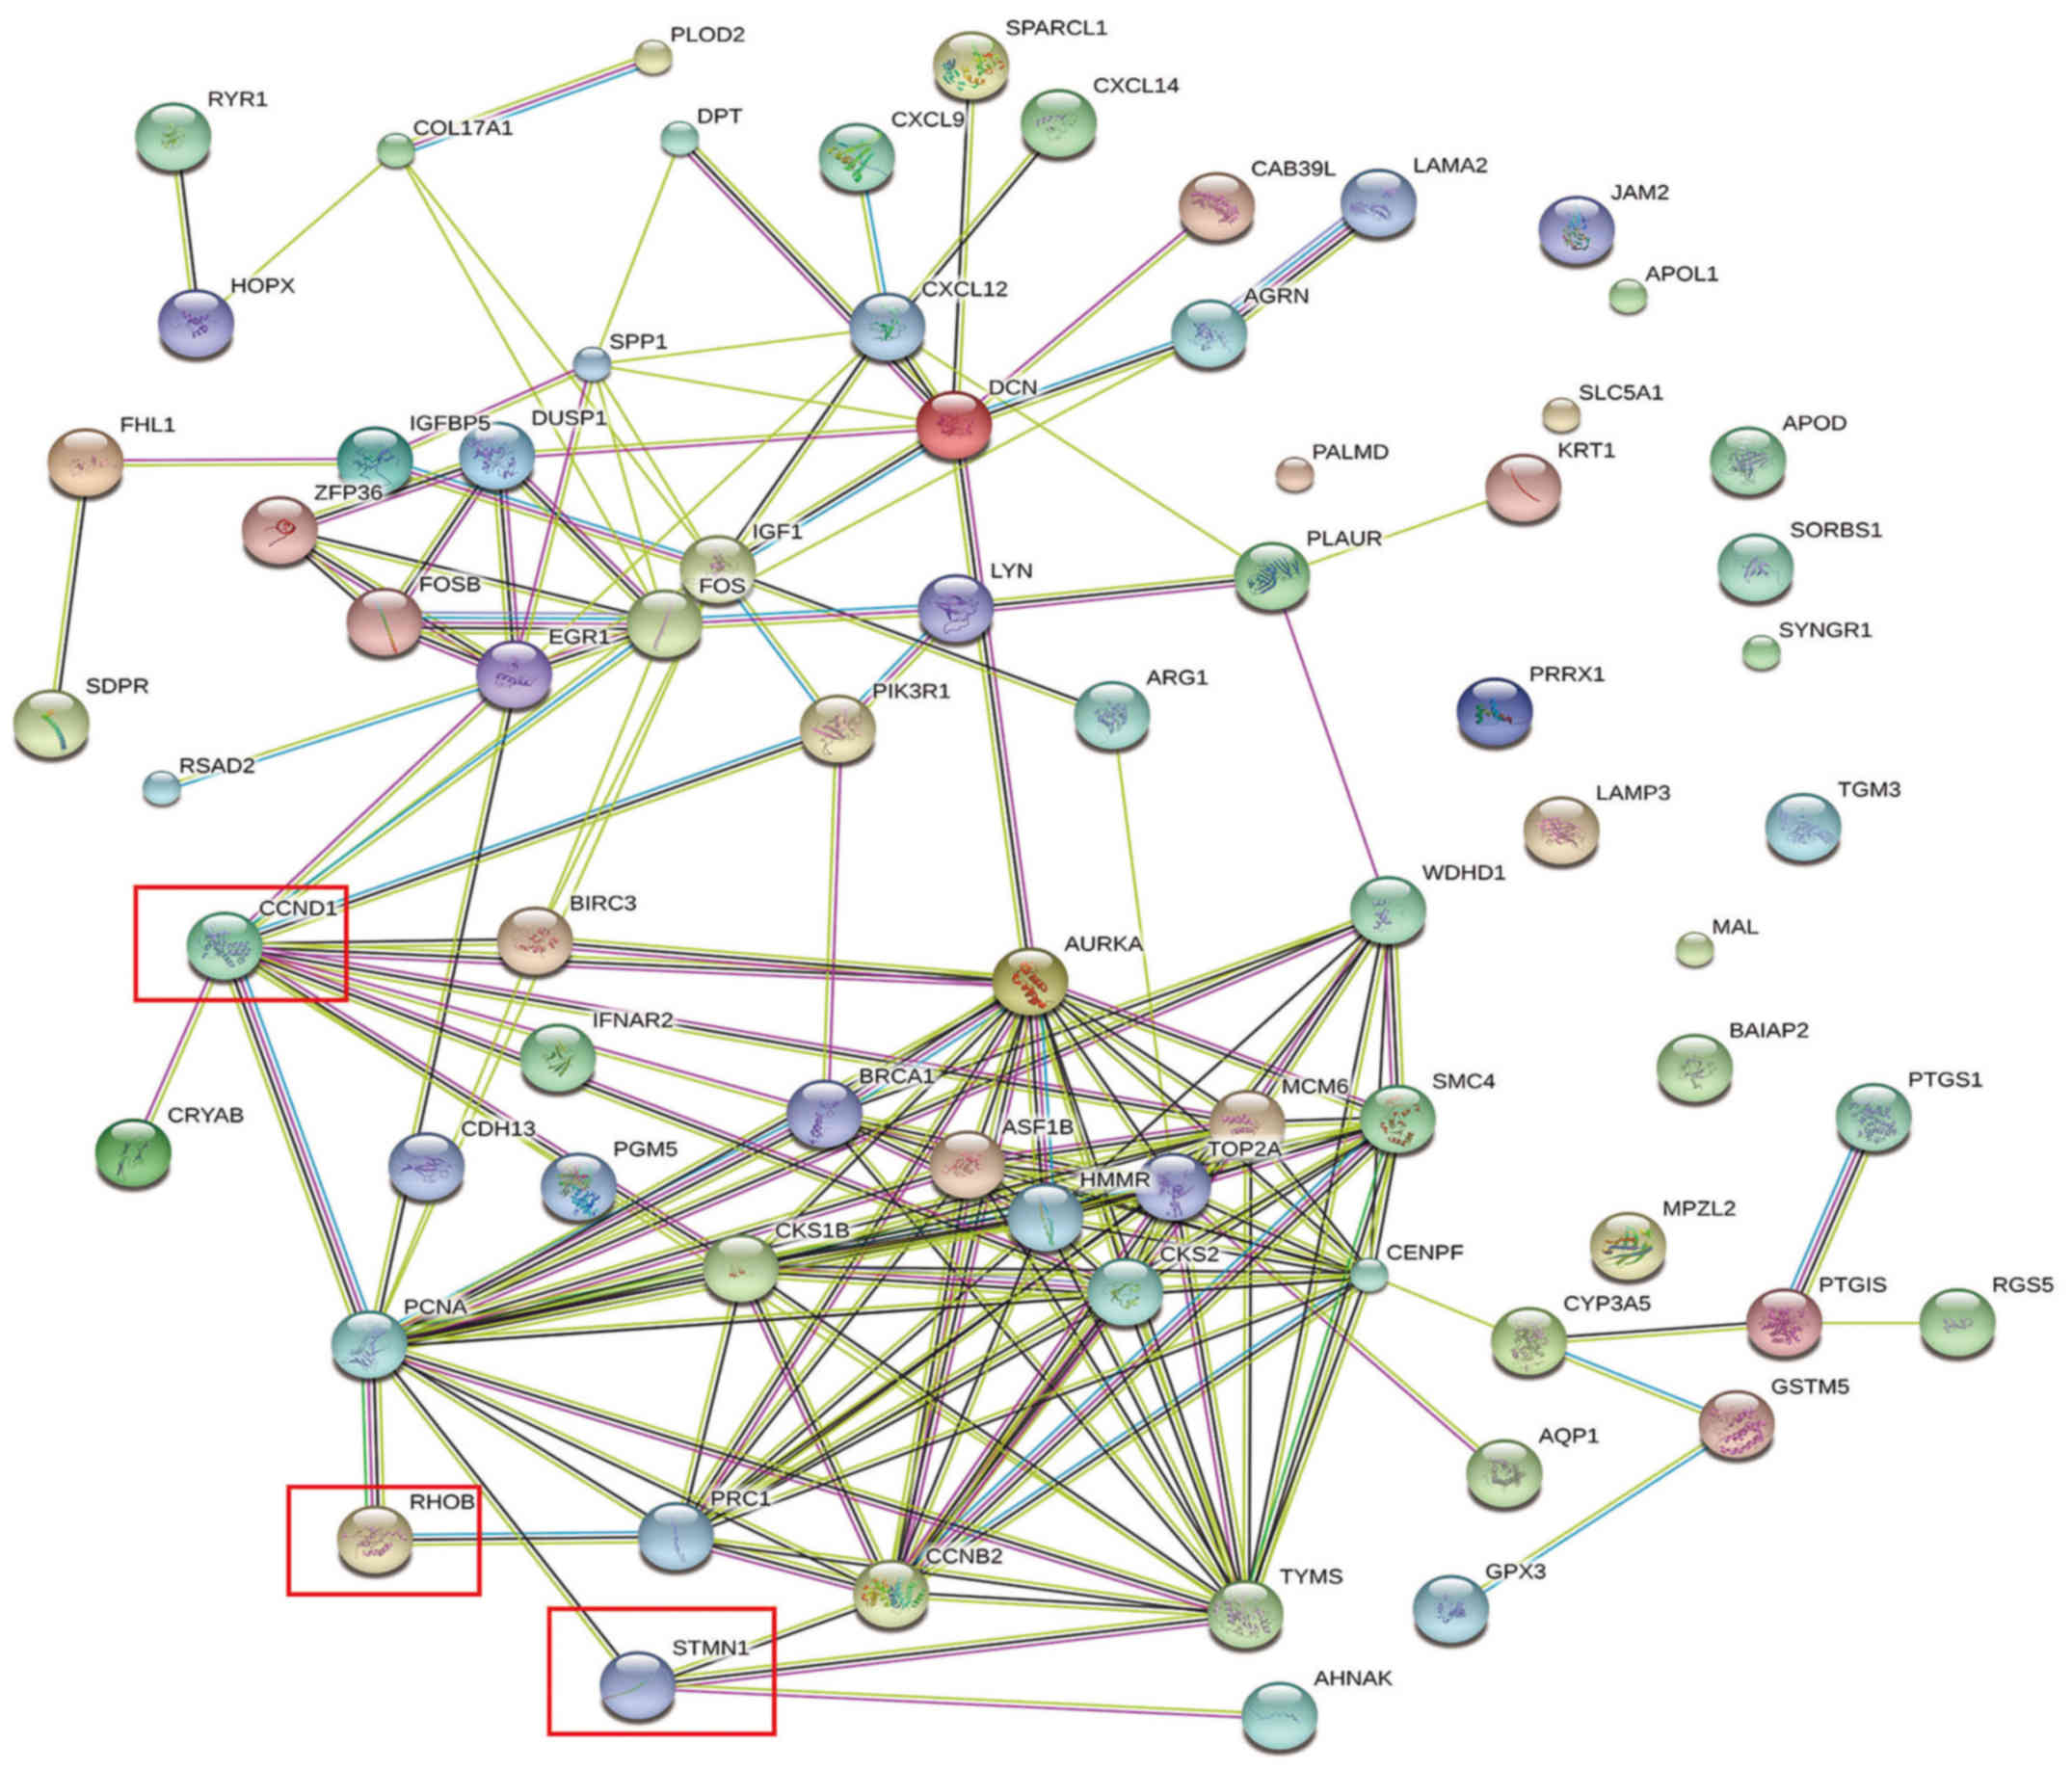
genes were consistently downregulated. A PPI network was
constructed of the DEGs (Fig. 2).
 | Table I.List of 84 genes, 11 of which
exhibited an inconsistent trend, that were identified as
upregulated or downregulated using the GSE9750, GSE46857 and
GSE67522 microarray datasets. |
Table I.
List of 84 genes, 11 of which
exhibited an inconsistent trend, that were identified as
upregulated or downregulated using the GSE9750, GSE46857 and
GSE67522 microarray datasets.
| A, Upregulated
DEGs |
|---|
| IGF1, KRT1, AHNAK,
FHL1, PRRX1, CYP3A5, ZFP36, CCND1, IGFBP5, PALMD, APOD, PIK3R1,
PGM5, FOSB, GSTM5, DCN, BAIAP2, SYNGR1, HOPX, CXCL14, MPZL2, LAMA2,
CDH13, CRYAB, MAL, EGR1, ARG1, DUSP1, TGM3, DPT, RGS5, SDPR,
SORBS1, FOS, RHOB, CXCL12, JAM2, SPARCL1, AQP1, COL17A1, CAB39L,
SLC5A1, GPX3, PTGS1, PTGIS |
|
| B, Downregulated
DEGs |
|
| BRCA1, LAMP3, ASF1B,
RYR1, SMC4, AURKA, CKS1B, PCNA, SPP1, TYMS, APOL1, PLOD2, STMN1,
CKS2, LYN, AGRN, CCNB2, PRC1, TOP2A, CXCL9, WDHD1, RSAD2, HMMR,
MCM6, IFNAR2, PLAUR, CENPF, BIRC3 |
|
| C, Genes with an
inconsistent trend |
|
| PEG3, NTRK2, BNIP3,
MYH11, SVEP1, TRIM13, UNC93A, ARMCX1, IL17RC, KRT7, SLC6A8 |
Functional pathway enrichment
analysis
DAVID was used to analyze the potential biological
functions and pathways of the identified DEGs. Biological processes
including ‘integrin-mediated signaling pathway’, ‘proteolysis’ and
‘collagen catabolic processes’ were enriched in the DEGs.
Furthermore, 7 KEGG pathways were enriched in the upregulated
genes, including ‘ECM-receptor interaction’, ‘focal adhesion’ and
‘PI3K-Akt signaling’ pathways (Table
II).
| Table II.Functional/pathway enrichment analysis
of the differentially expressed genes from 3 cervical cancer mRNA
expression profiles. |
Table II.
Functional/pathway enrichment analysis
of the differentially expressed genes from 3 cervical cancer mRNA
expression profiles.
| Term | Description | Count | P-value |
|---|
| hsa05222 | Small cell lung
cancer | 5 |
3.34×10⁻³ |
| hsa04620 | Toll-like receptor
signaling pathway | 5 |
6.45×10⁻³ |
| hsa04510 | Focal adhesion | 6 |
1.59×10⁻² |
| hsa04512 | ECM-receptor
interaction | 4 |
2.42×10⁻² |
| hsa05200 | Pathways in
cancer | 7 |
3.29×10⁻² |
| hsa04062 | Chemokine signaling
pathway | 5 |
4.94×10⁻² |
| hsa04150 | mTOR signaling
pathway | 3 |
5.71×10⁻² |
| hsa00590 | Arachidonic acid
metabolism | 3 |
6.51×10⁻² |
| hsa04110 | Cell cycle | 4 |
6.56×10⁻² |
| hsa05214 | Glioma | 3 |
7.99×10⁻² |
| hsa04115 | p53 signaling
pathway | 3 |
9.11×10⁻² |
| hsa04730 | Long-term
depression | 3 |
9.34×10⁻² |
| hsa05218 | Melanoma | 3 |
9.80×10⁻² |
miRNA-DEG pairs
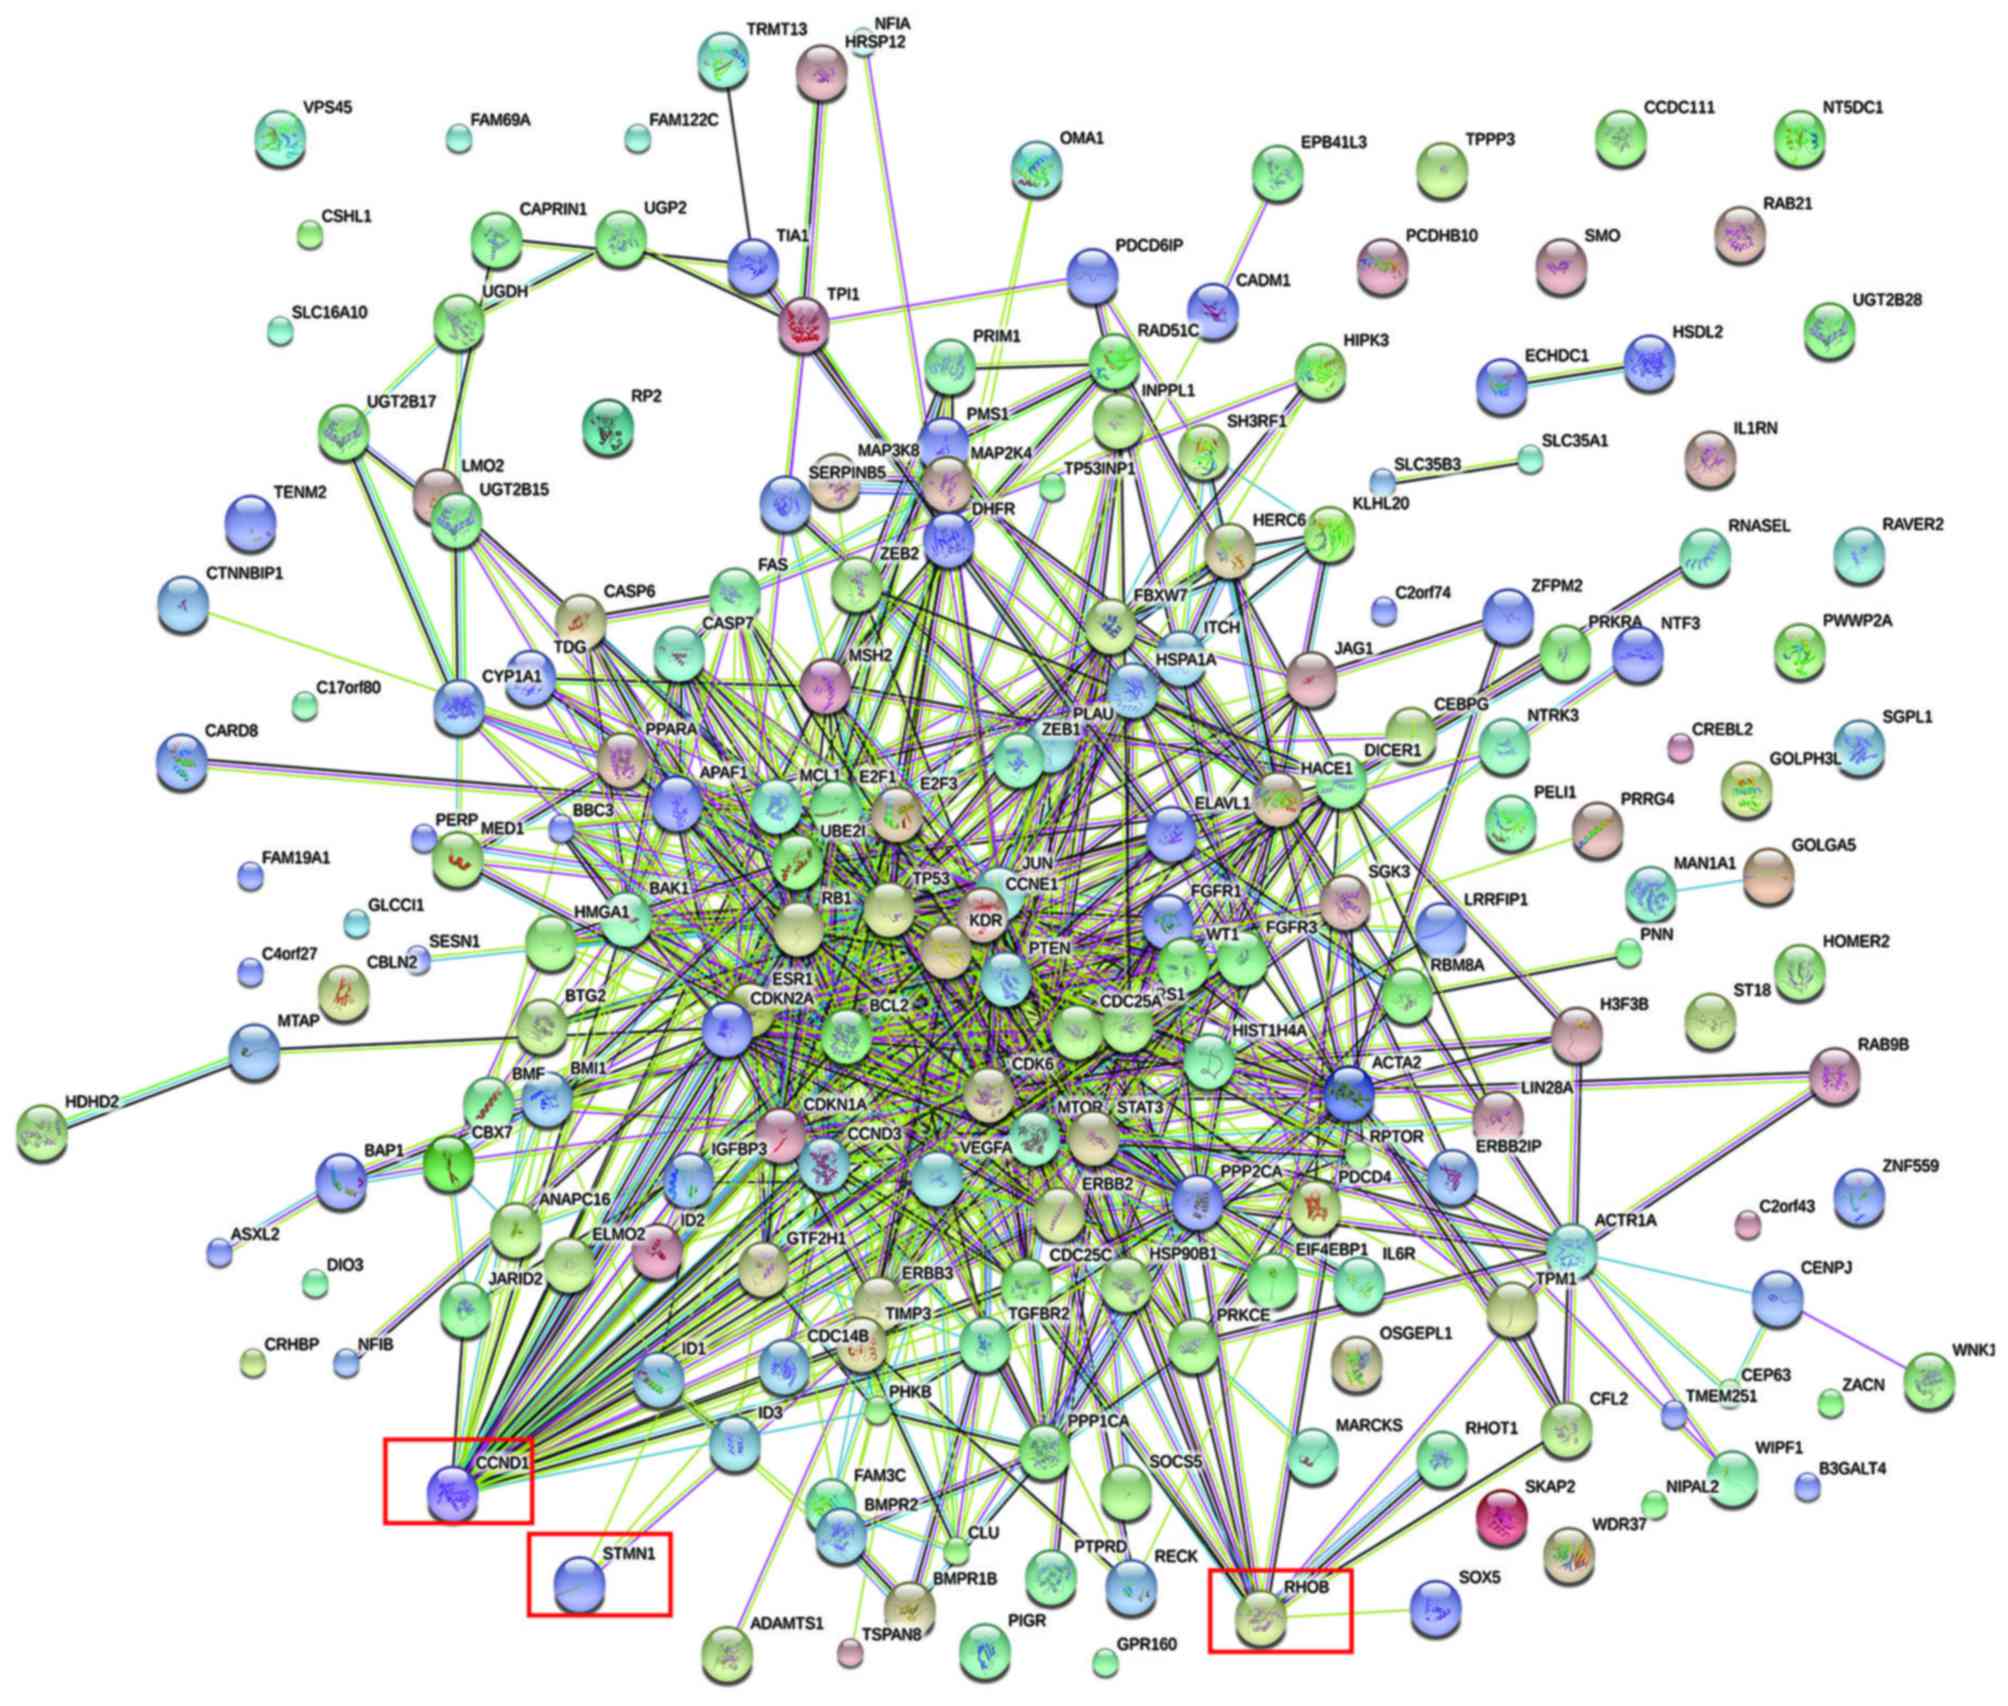
A total of 21 DEMs were identified in cervical
cancer tissue compared with normal tissue in the GSE30656 dataset.
Specifically, 19 miRNAs were upregulated and 2 were downregulated
(Table III). By reference to
miRecords, 246 validated gene targets for these miRNAs were
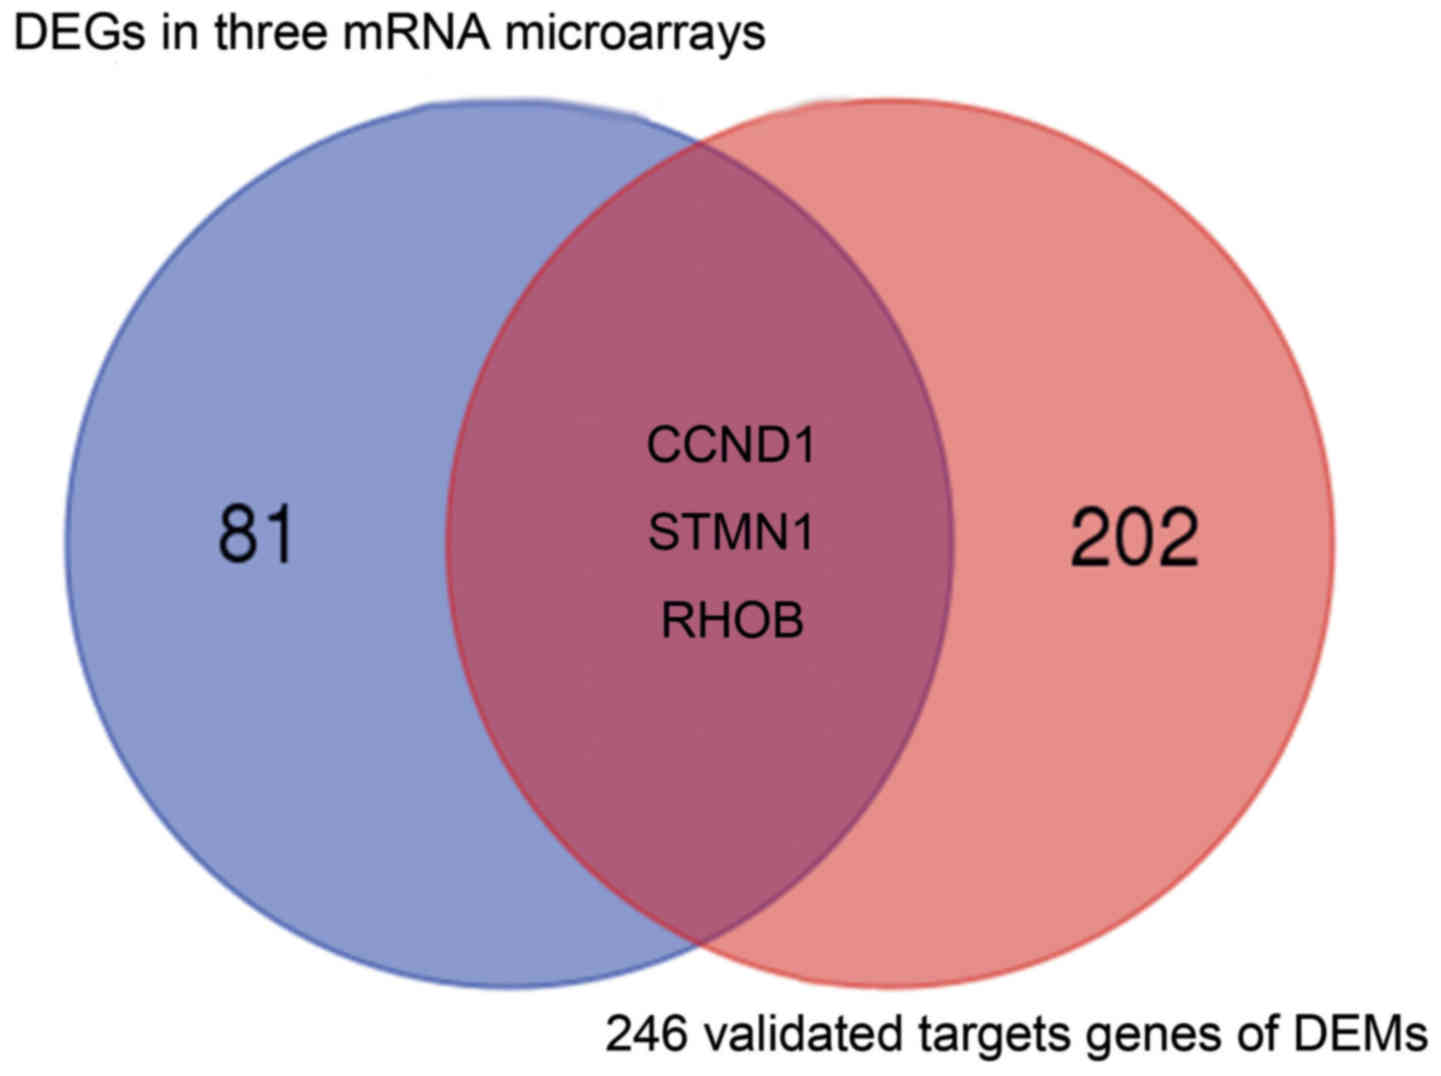
identified. A PPI network was constructed for the targets (Fig. 3). It was identified that three of the
validated DEM targets were DEGs (Fig.
4); cyclin D1 (CCND1) was among the validated gene targets of
miR-1, while RhoB and STMN1 were among the predicted gene targets
of miR-223.
| Table III.Differentially expressed miRNAs in
cervical cancer screened out from miRNA expression microarray
GSE30656 and their target genes which have been reported and
validated using miRecords. |
Table III.
Differentially expressed miRNAs in
cervical cancer screened out from miRNA expression microarray
GSE30656 and their target genes which have been reported and
validated using miRecords.
| miRNA | Adjusted
P-value | Log fold
change | Validated target
genes |
|---|
| miR-106b |
2.05×10⁻⁷ | 1.02 | E2F1, CDKN1A,
VEGFA, E2F1, CDKN1A, ITCH |
| miR-125b |
4.82×10⁻⁴ | −1.44 | ERBB2, ERBB3,
LIN28, BAK1, NTRK3, C10orf104, H3F3B, ADAMTS1, PERP |
| miR-149 |
1.04×10⁻⁴ | −1.14 | N/A |
| miR-15b |
1.42×10⁻³ | 1.01 | BCL2, CCNE1, RECK,
MKK4, RECK, BMI1 |
| miR-16 |
5.47×10⁻⁴ | 1.06 | TPPP3, BCL2, VEGFA,
CCND1, PDCD4, RAB21, CADM1, SKAP2, WT1, BCL2 |
| miR-192 |
3.98×10⁻² | 1.18 | DHFR, WNK1,
RB1 |
| miR-193b |
2.69×10⁻⁴ | −1.29 | PLAU, ESR1 |
| miR-194 |
2.24×10⁻² | 1.07 | N/A |
| miR-200a |
9.84×10⁻³ | 1.07 | ZEB2, ZEB1 FOG2,
ERBB2IP, BAP1, KLHL20 |
| miR-203 |
1.57×10⁻⁵ | −3.00 | N/A |
| miR-205 |
2.16×10⁻² | −2.26 | ZEB2, ZEB1, VEGFA,
INPPL1, ERBB3, PRKCE, MED1 |
| miR-21 |
1.69×10⁻⁵ | 2.10 | TPM1, NFIB, PDCD4,
SERPINB5, CDKN1A, FAS, FAM3C, HIPK3, PRRG4, ACTA2 |
| miR-223 |
1.38×10⁻² | 1.04 | NFIA, LMO2, LMO2,
STMN1, RHOB, IRS1, FBXW7, EPB41L3 |
| miR-370 |
1.04×10⁻³ | −2.37 | MAP3K8 |
| miR-494 |
2.18×10⁻² | −1.22 | PTEN |
| miR-565 |
1.61×10⁻² | −1.04 | N/A |
| miR-572 |
1.23×10⁻² | −1.04 | N/A |
| miR-575 |
1.02×10⁻³ | −1.46 | N/A |
| miR-630 |
1.34×10⁻² | −1.20 | N/A |
| miR-638 |
1.21×10⁻² | −1.37 | N/A |
| miR-99a |
6.46×10⁻⁴ | −1.25 | RAVER2, mTOR,
IGF-IR, RPTOR, FGFR3 |
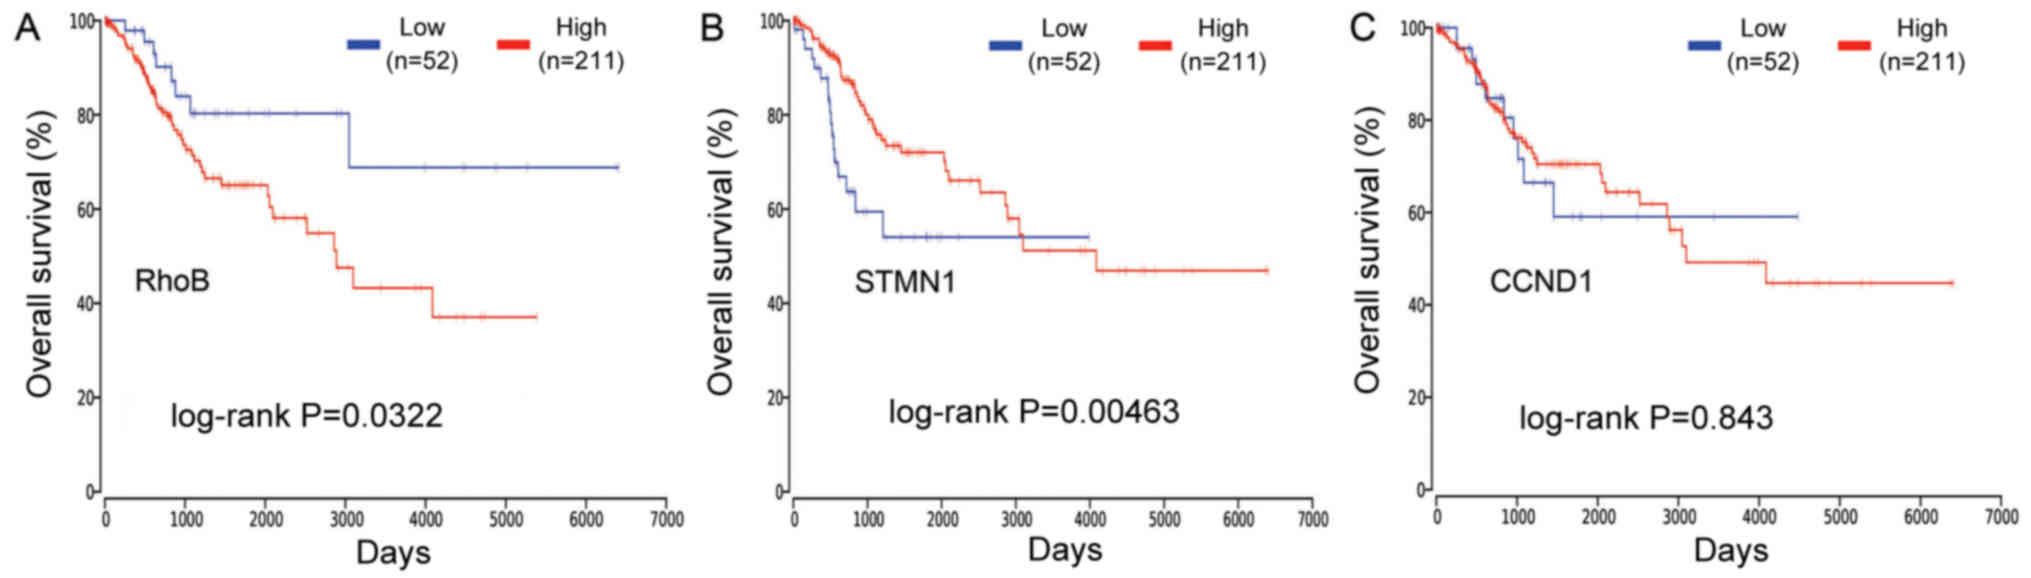
Overall survival analysis
OncoLnc was used to analyze of the effect of CCND1,
RhoB and STMN1 on the survival of patients with cervical cancer. It
was identified that the high mRNA expression of RhoB was associated
with a poor survival rate (log-rank P=0.0322; Fig. 5A) whereas the low mRNA expression of
STMN1 was associated with a poor survival rate (log-rank P=0.0046;
Fig. 5B). However, there was no
significant association between CCND1 and overall survival time
(Fig. 5C). An overall survival
analysis was also conducted for the expression of these genes in
other types of cancer, including breast, lung, colorectal and
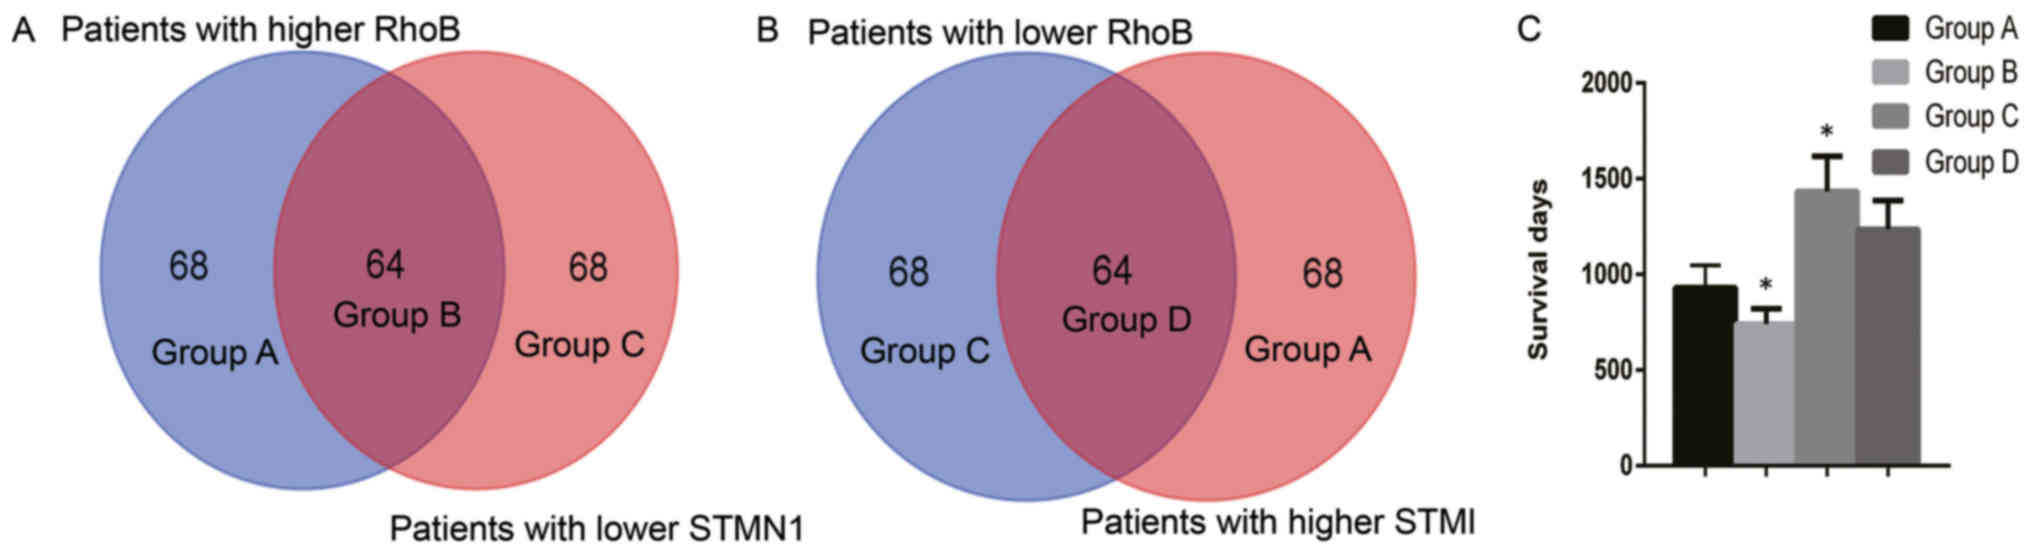
prostate cancer (Table IV). TCGA
data from 263 patients with cervical cancer was divided into high
(>50% expression level) and low (<50% expression level)
groups based on the expression of RhoB and STMN1. There were 64
patients in the RhoB high and STMN1 low group, which was referred
to as group B. There were also 64 patients in the RhoB low and
STMN1 high group, which was referred to as group D. The remaining
patients were placed into either group A (RhoB high and STMN1 high)
or group C (RhoB low and STMN1 low) (Fig.
6A and B). The patient survival time for group B was
significantly decreased compared with group D (P<0.05; Fig. 6C). Additionally, the patient survival
time for group B was the least out of the four groups, and it was
significantly decreased compared with groups A, C and D (P<0.05;
Fig. 6C). Furthermore, the patient
survival time for group C was the greatest out of the four groups,
and it was significantly increased compared with groups A and B
(P<0.05; Fig. 6C). There was no
significant difference between groups C and D.
| Table IV.The prognostic value of two
differentially expressed genes identified in patients with other
types of cancer. |
Table IV.
The prognostic value of two
differentially expressed genes identified in patients with other
types of cancer.
| Cancer type | Ras homolog family
member B | Stathmin 1 |
|---|
| Breast | 0.158 | 0.569 |
| Gastric | 0.046 | 0.431 |
| Lung | 0.339 | 0.127 |
| Ovarian | 0.062 | 0.293 |
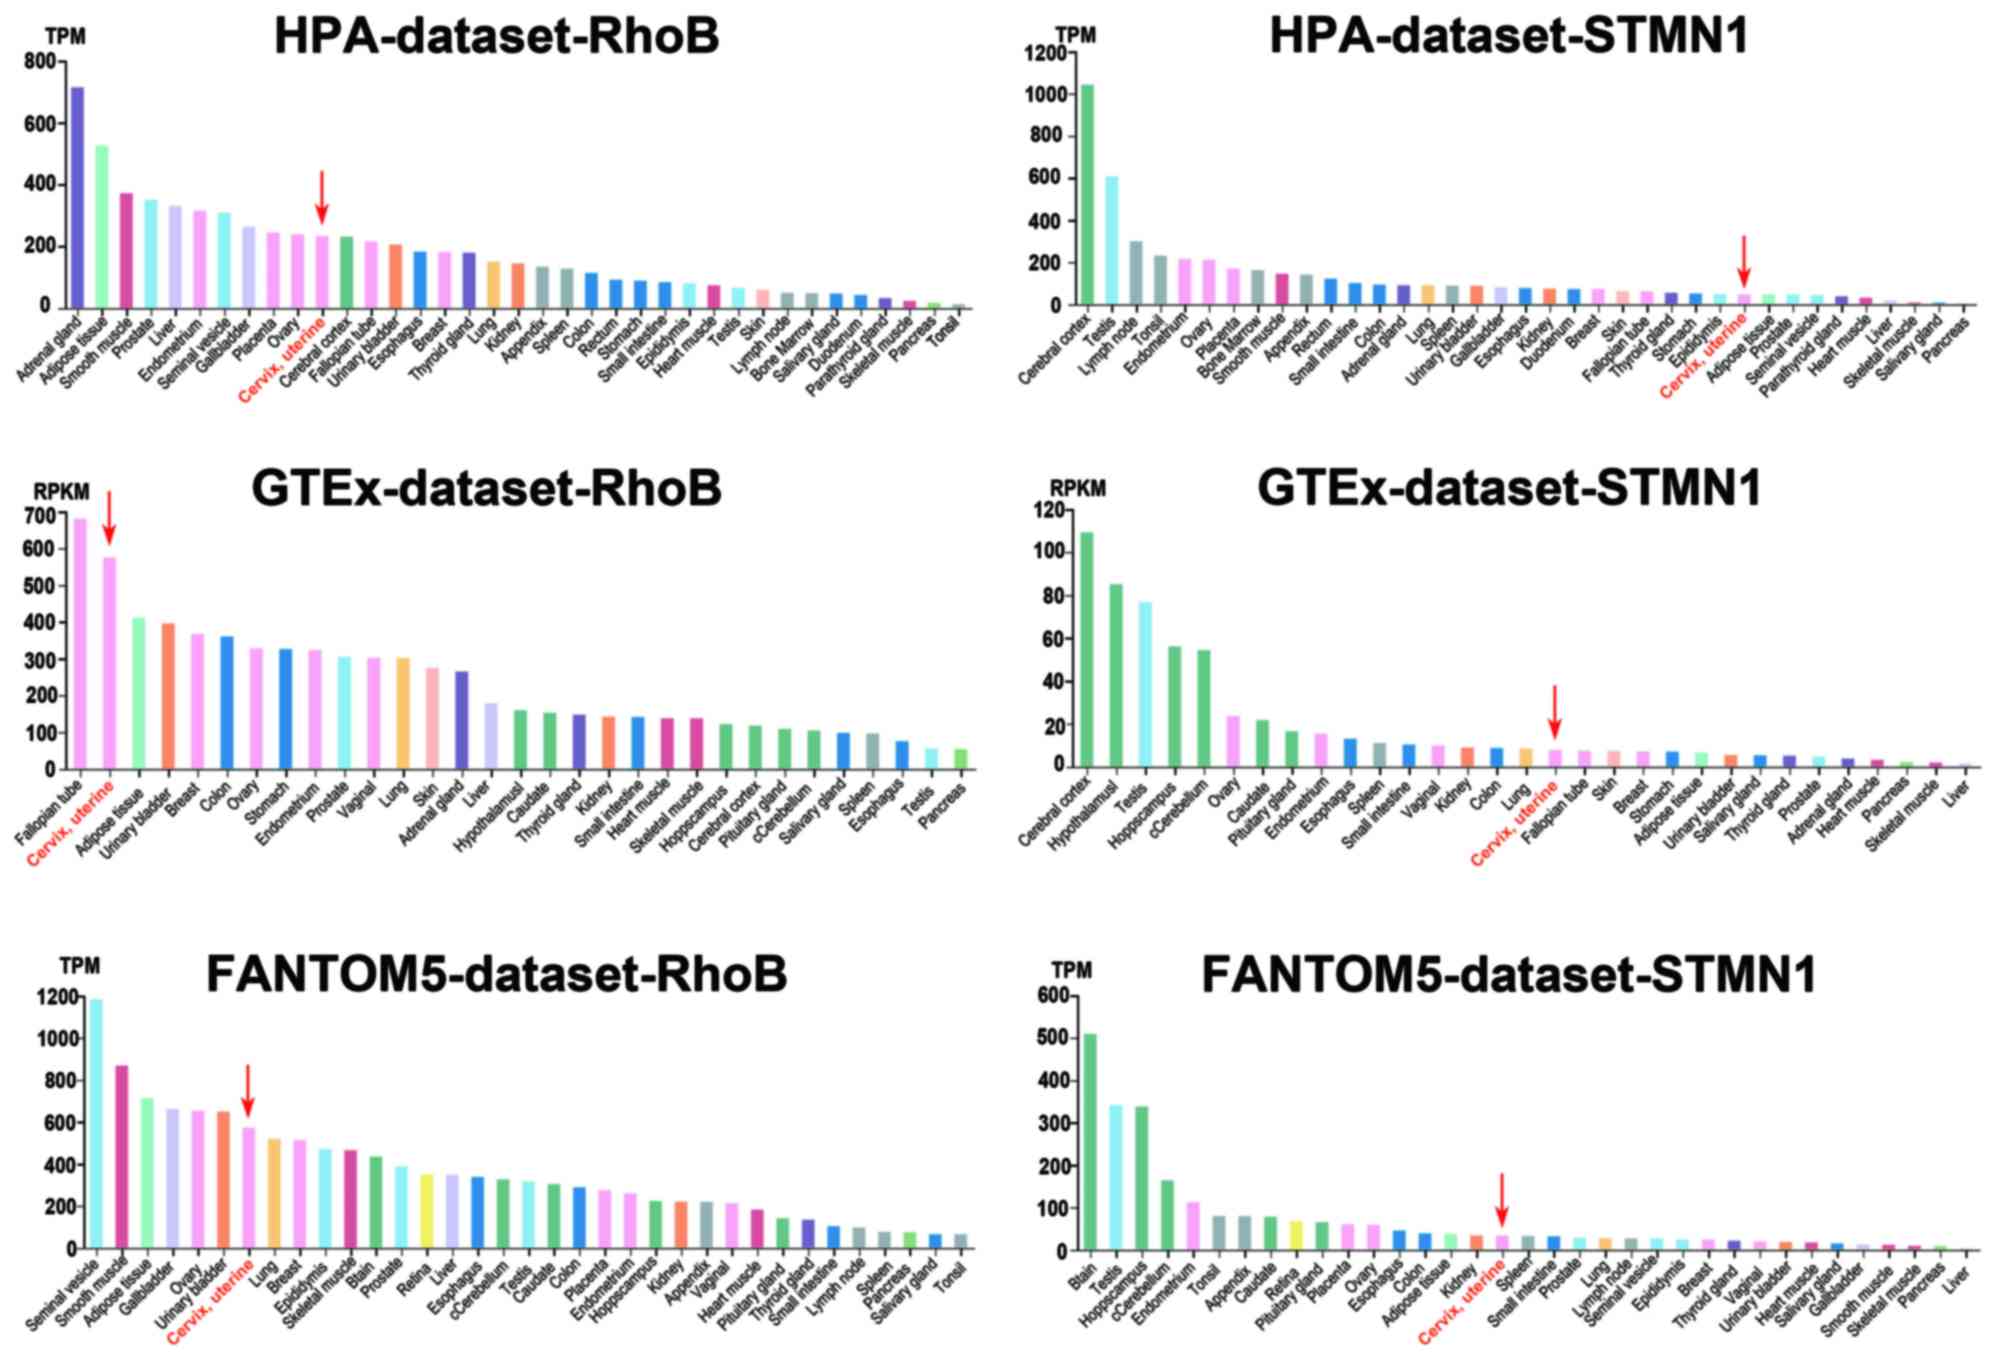
Basic expression state of DEGs in
different organs
The Human Protein Atlas was used to assess the basic
expression level of RhoB and STMN1 in different organs. The results
revealed that the expression level of RhoB in the cervix was
relatively high compared with >30 human organ sample types. The
expression of STMN1 in the cervix was low relative to the other
sample types. However, the expression of RhoB and STMN1 in the
cervix was not particularly high or low in comparison with normal
organ samples (Fig. 7).
Discussion
The majority of cervical cancer patients live in
economically underdeveloped areas, where the mortality rate is
higher (22). Although cervical
screening programs based on cervical cytology and human papilloma
virus testing effectively reduce the incidence of cervical cancer,
it is common for women in these areas not to accept standardized
screening. This is largely due to social, religious and
psychological factors (23).
Therefore, novel circulating biomarkers to monitor critical
molecular events common in cervical cancer may improve the
detection of malignant lesions in primary screening and triage
settings.
In the present study, three mRNA and one miRNA
expression profile datasets were used to identify potential
biomarkers in cervical cancer. These four datasets were based on
microarrays produced by the same company, with four different
platforms. Firstly, a comprehensive analysis of the DEGs and DEMs
was performed, including GO and KEGG pathway enrichment analysis
and PPI network analysis. Secondly, the DEGs were screened from the
previously validated targets of the DEMs. A total of 73 DEGs were
common to all three mRNA datasets, and 18 DEMs were identified from
the microRNA dataset. Compared with existing studies, this
screening was larger, and more comprehensive and random, due to it
be conducted with a greater number of samples from different areas
and a greater number of expression profiles.
The verified target genes of the DEMs were then
obtained by reference to existing studies using miRecords. By
comparing the verified target genes of the DEMs and the DEGs
identified from the mRNA microarray, three potential genes were
identified that may serve a key function in cervical cancer.
Finally, it was identified through survival analysis that the high
mRNA expression of RhoB was associated with poor overall survival
(log-rank P=0.0322; Fig. 5A), while
the low mRNA expression of STMN1 was associated with poor overall
survival (log-rank P=0.0046; Fig.
5B). CCND1 expression was not significantly associated with
overall survival (Fig. 5C).
Further analysis was performed using the survival
data from TCGA. Data from 263 patients was divided into high or low
groups based on the expression of RhoB and STMN1. It was identified
that patients with higher RhoB and lower STMN1 expression
experienced a significantly shorter overall survival time than
patients with lower RhoB and higher STMN1 expression (P<0.05;
Fig. 6C).
RhoB is a member of the Rho GTP-binding protein
family located at 2p24.1 (24). RhoB
may be a tumor suppressor as its expression level is decreased in a
number of tumor cell types (25). Its
expression is more downregulated in increasingly aggressive tumors,
and the loss of RhoB is associated with a decreased overall
survival time in certain types of cancer (26–28). RhoB
is not mutated in all types of cancer; however, its altered
expression and activity may be critical in cancer progression and
the response to therapy. For example, RhoB expression is predictive
of an epidermal growth factor receptor-tyrosine kinase inhibitor
(EGFR-TKI) response; a EGFR-TKI/Akt inhibitor combination provides
a clinical advantage in preventing resistance to EGFR-TKI for
RhoB-positive tumor patients (26). A
number of studies have identified a loss of RhoB expression in
head, neck, gastric, renal and lung cancer (29–31).
Studies of RhoB gene knockout in mice demonstrated that the
frequency of chemically induced neoplastic transformation
increased, and that the overexpression of RhoB in human cell lines
results in the inhibition of signal transduction pathways
associated with oncogenesis and tumor survival. The function of
RhoB in cervical cancer has yet to be reported.
STMN1 is located at 1p36.11 and is also known as
oncoprotein 18. It is a 19-kDa cytosolic protein that destabilizes
microtubules in a phosphorylation-dependent manner and has been
reported to be abundantly expressed in various types of cancer cell
(32–34). STMN1 is also a biomarker in certain
types of neoplasm. It serves important functions in cell cycle
progression, mitosis, signal transduction and cell migration
(35–37). There is no study reporting directly on
the effect of STMN1 in cervical cancer.
In the present study, it was identified that
upregulated RhoB was significantly associated with poor overall
survival time in patients with cervical cancer, and that
downregulated STMN1 was also significantly associated with poor
overall survival. By comparing survival time with TCGA data, it was
revealed that patients with higher levels of RhoB and lower levels
of STMN1 have significantly shorter survival times. This supports
that high RhoB and low STMN1 are associated with a worse prognosis,
and that RhoB and STMN1 may be suitable for use in diagnosis and
prognosis as biomarkers of cervical cancer. Furthermore, the basic
expression levels of RhoB and STMN1 were assessed in different
tissue types using data mining methods. The results revealed that
in normal cervical tissue samples, RhoB and STMN1 were not
overexpressed or underexpressed in comparison with other sample
types (Fig. 7). This indicates that
it may be possible to perform a gain/loss of function analysis with
normal cervix and cervical cancer cell lines in future studies.
This would provide a more in-depth understanding of RhoB and STMN1
gene functions in cervical cancer.
In summary, mRNA and miRNA microarray expression
datasets were screened for the identification of biomarkers in
cervical cancer. In the present study, RhoB, STMN1 and the
associated miR-223 may be critical in cervical cancer. We
hypothesize that these genes and miRNA may serve as a key biomarker
for predicting cervical cancer progression, and that the described
method is used in clinical practice to improve the chance for an
early diagnosis. For increased reliability and reproducibility, the
method outlined in the present study will be repeated and further
improved. Furthermore, we will study the functions and mechanism of
the DEGs and DEMs identified in the present study. This will allow
the greater understanding of broader clinical application
prospects.
Acknowledgements
Not applicable.
Funding
No funding was received.
Availability of data and materials
The datasets generated and/or analyzed during the
current study are available in the GEO repository, (https://www.ncbi.nlm.nih.gov/geo).
Authors' contributions
SW designed this research and collected the
datasets. XC and SW analyzed the data and were involved in writing
and revising the manuscript.
Ethics approval and consent to
participate
Not applicable.
Patient consent for publication
Not applicable.
Competing interests
The authors declare that they have no competing
interests.
References
|
1
|
Siegel RL, Miller KD and Jemal A: Cancer
statistics, 2016. CA Cancer J Clin. 66:7–30. 2016. View Article : Google Scholar : PubMed/NCBI
|
|
2
|
De Angelis R, Sant M, Coleman MP,
Francisci S, Baili P, Pierannunzio D, Trama A, Visser O, Brenner H,
Ardanaz E, et al: Cancer survival in Europe 1999–2007 by country
and age: Results of EUROCARE-5-a population-based study. Lancet
Oncol. 15:23–34. 2014. View Article : Google Scholar : PubMed/NCBI
|
|
3
|
Chen W, Zheng R, Baade PD, Zhang S, Zeng
H, Bray F, Jemal A, Yu XQ and He J: Cancer statistics in China,
2015. CA Cancer J Clin. 66:115–132. 2016. View Article : Google Scholar : PubMed/NCBI
|
|
4
|
Vaccarella S, Laversanne M, Ferlay J and
Bray F: Cervical cancer in Africa, Latin America and the Caribbean,
and Asia: Regional inequalities and changing trends. Int J Cancer.
141:1997–2001. 2017. View Article : Google Scholar : PubMed/NCBI
|
|
5
|
Williams SP and McDermott U: The pursuit
of therapeutic biomarkers with high-throughput cancer cell drug
screens. Cell Chem Biol. 24:1066–1074. 2017. View Article : Google Scholar : PubMed/NCBI
|
|
6
|
Sun HH, Vaynblat A and Pass HI: Diagnosis
and prognosis-review of biomarkers for mesothelioma. Ann Transl
Med. 5:2442017. View Article : Google Scholar : PubMed/NCBI
|
|
7
|
Abdollah F, Dalela D, Haffner MC, Culig Z
and Schalken J: The role of biomarkers and genetics in the
diagnosis of prostate cancer. Eur Urol Focus. 1:99–108. 2015.
View Article : Google Scholar : PubMed/NCBI
|
|
8
|
Patel SA and DeMichele A: Adding adjuvant
systemic treatment after neoadjuvant therapy in breast cancer:
Review of the data. Curr Oncol Rep. 19:562017. View Article : Google Scholar : PubMed/NCBI
|
|
9
|
Verdaguer H, Saurí T and Macarulla T:
Predictive and prognostic biomarkers in personalized
gastrointestinal cancer treatment. J Gastrointest Oncol. 8:405–417.
2017. View Article : Google Scholar : PubMed/NCBI
|
|
10
|
Herrera-Marcos LV, Lou-Bonafonte JM, Arnal
C, Navarro MA and Osada J: Transcriptomics and the mediterranean
diet: A systematic review. Nutrients. 9:E4722017. View Article : Google Scholar : PubMed/NCBI
|
|
11
|
Hong HJ, Koom WS and Koh WG: Cell
microarray technologies for high-throughput cell-based biosensors.
Sensors (Basel). 17:E12932017. View Article : Google Scholar : PubMed/NCBI
|
|
12
|
Shimizu D, Kanda M and Kodera Y: Review of
recent molecular landscape knowledge of gastric cancer. Histol
Histopathol. 33:11–26. 2018.PubMed/NCBI
|
|
13
|
Syed P, Gidwani K, Kekki H, Leivo J,
Pettersson K and Lamminmäki U: Role of lectin microarrays in cancer
diagnosis. Proteomics. 16:1257–1265. 2016. View Article : Google Scholar : PubMed/NCBI
|
|
14
|
Scotto L, Narayan G, Nandula SV,
Arias-Pulido H, Subramaniyam S, Schneider A, Kaufmann AM, Wright
JD, Pothuri B, Mansukhani M and Murty VV: Identification of copy
number gain and overexpressed genes on chromosome arm 20q by an
integrative genomic approach in cervical cancer: Potential role in
progression. Genes Chromosomes Cancer. 47:755–765. 2008. View Article : Google Scholar : PubMed/NCBI
|
|
15
|
Thomas A, Mahantshetty U, Kannan S,
Deodhar K, Shrivastava SK, Kumar-Sinha C and Mulherkar R:
Expression profiling of cervical cancers in Indian women at
different stages to identify gene signatures during progression of
the disease. Cancer Med. 2:836–848. 2013. View Article : Google Scholar : PubMed/NCBI
|
|
16
|
Sharma S, Mandal P, Sadhukhan T, Roy
Chowdhury R, Ranjan Mondal N, Chakravarty B, Chatterjee T, Roy S
and Sengupta S: Bridging links between long noncoding RNA HOTAIR
and HPV oncoprotein E7 in cervical cancer pathogenesis. Sci Rep.
5:117242015. View Article : Google Scholar : PubMed/NCBI
|
|
17
|
Wilting SM, Snijders PJ, Verlaat W,
Jaspers A, van de Wiel MA, van Wieringen WN, Meijer GA, Kenter GG,
Yi Y, le Sage C, et al: Altered microRNA expression associated with
chromosomal changes contributes to cervical carcinogenesis.
Oncogene. 32:106–116. 2013. View Article : Google Scholar : PubMed/NCBI
|
|
18
|
Szklarczyk D, Franceschini A, Wyder S,
Forslund K, Heller D, Huerta-Cepas J, Simonovic M, Roth A, Santos
A, Tsafou KP, et al: STRING v10: Protein-protein interaction
networks, integrated over the tree of life. Nucleic Acids Res.
43(Database Issue): D447–D452. 2015. View Article : Google Scholar : PubMed/NCBI
|
|
19
|
Huang da W, Sherman BT and Lempicki RA:
Systematic and integrative analysis of large gene lists using DAVID
bioinformatics resources. Nat Protoc. 4:44–57. 2009. View Article : Google Scholar : PubMed/NCBI
|
|
20
|
Xiao F, Zuo Z, Cai G, Kang S, Gao X and Li
T: miRecords: An integrated resource for microRNA-target
interactions. Nucleic Acids Res. 37(Database Issue): D105–D110.
2009. View Article : Google Scholar : PubMed/NCBI
|
|
21
|
Uhlen M, Zhang C, Lee S, Sjöstedt E,
Fagerberg L, Bidkhori G, Benfeitas R, Arif M, Liu Z, Edfors F, et
al: A pathology atlas of the human cancer transcriptome. Science.
357:eaan25072017. View Article : Google Scholar : PubMed/NCBI
|
|
22
|
Aranda S, Berkley S, Cowal S, Dybul M,
Evans T, Iversen K, Moeti M, Osotimehin B, Peterson S, Piot P, et
al: Ending cervical cancer: A call to action. Int J Gynaecol
Obstet. 138 Suppl 1:S4–S6. 2017. View Article : Google Scholar
|
|
23
|
Huchko MJ, Maloba M, Nakalembe M and Cohen
CR: The time has come to make cervical cancer prevention an
essential part of comprehensive sexual and reproductive health
services for HIV-positive women in low-income countries. J Int AIDS
Soc. 18 Suppl 5:202822015. View Article : Google Scholar : PubMed/NCBI
|
|
24
|
Thumkeo D, Watanabe S and Narumiya S:
Physiological roles of Rho and Rho effectors in mammals. Eur J Cell
Biol. 92:303–315. 2013. View Article : Google Scholar : PubMed/NCBI
|
|
25
|
Schaefer A, Reinhard NR and Hordijk PL:
Toward understanding RhoGTPase specificity: Structure, function and
local activation. Small GTPases. 5:62014. View Article : Google Scholar : PubMed/NCBI
|
|
26
|
Calvayrac O, Mazières J, Figarol S,
Marty-Detraves C, Raymond-Letron I, Bousquet E, Farella M,
Clermont-Taranchon E, Milia J, Rouquette I, et al: The RAS-related
GTPase RHOB confers resistance to EGFR-tyrosine kinase inhibitors
in non-small-cell lung cancer via an AKT-dependent mechanism. EMBO
Mol Med. 9:238–250. 2017. View Article : Google Scholar : PubMed/NCBI
|
|
27
|
Merkus D and Schermuly RT: Farnesylation
of RhoB: The cancer hypothesis of pulmonary hypertension revisited.
Cardiovasc Res. 113:249–250. 2017. View Article : Google Scholar : PubMed/NCBI
|
|
28
|
Vega FM and Ridley AJ: The RhoB small
GTPase in physiology and disease. Small GTPases. 1–10. 2016.
|
|
29
|
Chen W, Niu S, Ma X, Zhang P, Gao Y, Fan
Y, Pang H, Gong H, Shen D, Gu L, et al: RhoB acts as a tumor
suppressor that inhibits malignancy of clear cell renal cell
carcinoma. PloS One. 11:e01575992016. View Article : Google Scholar : PubMed/NCBI
|
|
30
|
Delmas A, Cherier J, Pohorecka M,
Medale-Giamarchi C, Meyer N, Casanova A, Sordet O, Lamant L, Savina
A, Pradines A and Favre G: The c-Jun/RHOB/AKT pathway confers
resistance of BRAF-mutant melanoma cells to MAPK inhibitors.
Oncotarget. 6:15250–15264. 2015. View Article : Google Scholar : PubMed/NCBI
|
|
31
|
Marlow LA, Bok I, Smallridge RC and
Copland JA: RhoB upregulation leads to either apoptosis or
cytostasis through differential target selection. Endocr Relat
Cancer. 22:777–792. 2015. View Article : Google Scholar : PubMed/NCBI
|
|
32
|
Bai T, Yokobori T, Altan B, Ide M, Mochiki
E, Yanai M, Kimura A, Kogure N, Yanoma T, Suzuki M, et al: High
STMN1 level is associated with chemo-resistance and poor prognosis
in gastric cancer patients. Br J Cancer. 116:1177–1185. 2017.
View Article : Google Scholar : PubMed/NCBI
|
|
33
|
Dou YD, Zhao H, Huang T, Zhao SG, Liu XM,
Yu XC, Ma ZX, Zhang YC, Liu T, Gao X, et al: STMN1 promotes
progesterone production via StAR up-regulation in mouse granulosa
cells. Sci Rep. 6:266912016. View Article : Google Scholar : PubMed/NCBI
|
|
34
|
Zhang HQ, Guo X, Guo SQ, Wang Q, Chen XQ,
Li XN and Guo LS: STMN1 in colon cancer: Expression and prognosis
in Chinese patients. Eur Rev Med Pharmacol Sci. 20:2038–2044.
2016.PubMed/NCBI
|
|
35
|
Chen Y, Zhang Q, Ding C, Zhang X, Qiu X
and Zhang Z: Stathmin1 overexpression in hypopharyngeal squamous
cell carcinoma: A new promoter in FaDu cell proliferation and
migration. Int J Oncol. 50:31–40. 2017. View Article : Google Scholar : PubMed/NCBI
|
|
36
|
Li J, Hu GH, Kong FJ, Wu KM, He B, Song K
and Sun WJ: Reduced STMN1 expression induced by RNA interference
inhibits the bioactivity of pancreatic cancer cell line Panc-1.
Neoplasma. 61:144–152. 2014. View Article : Google Scholar : PubMed/NCBI
|
|
37
|
Li X, Wang L, Li T, You B, Shan Y, Shi S,
Qian L and Cao X: STMN1 overexpression correlates with biological
behavior in human cutaneous squamous cell carcinoma. Pathol Res
Pract. 211:816–823. 2015. View Article : Google Scholar : PubMed/NCBI
|