Introduction
Thyroid cancer is the most common type of endocrine
malignancy in the United States in 2015 (1). In China, thyroid carcinoma resulted in
6,800 mortalities and 90,000 new cases in 2015 (2). Although clinical practice guidelines for
this disease have been updated in recent years, the morbidity of
this disease has not changed (3). For
females in particular, the disease burden for thyroid cancer with
uncertain etiology is increased due to the increased disease
incidence in females, which is 3 times higher than that of males
(21 vs. 7 per 100,000 population), albeit with a comparable
mortality (0.5 per 100,000 population) (4). Although numerous studies have used
next-generation sequencing and other novel technologies to
investigate the potential key genes and pathways in thyroid cancer,
its key molecular mechanisms remain unclear (5–9).
Elucidating the underlying mechanisms in thyroid cancer is crucial
for the diagnosis and prevention of this deadly disease.
Gene chip and gene expression profiles can be used
to analyze the total genetic information within a sample, thus
making them appropriate for differentially expressed gene
screening. In parallel with extended gene detection applications,
numerous microarray data have been generated and deposited into
public databases (5–7). Re-analysis of these data can offer novel
insights regarding specific gene expression in disease (10). Unlike conventional experimental
research, these re-analysis articles focus on bioinformatics
analysis to screen differentially-expressed genes (DEGs), construct
gene functional networks, and identify novel targets for disease
diagnosis and treatment (11). At
present a plethora of bioinformatics articles have been published,
especially pertaining to cancer research (12,13). With
regard to thyroid cancer, multiple studies have described hundreds
of DEGs and signaling pathways (8,10,11,14–21).
However, these results are always circumscribed or inconsistent
with each other due to heterogeneity between study samples, or the
fact that they were generated from single cohort studies (11,16,21).
Consequently, a comprehensive analysis of the integrated gene
expression data with bioinformatic methods is a superior method to
overcome these previous shortcomings.
Thyroid cancer may be categorized into multiple
subtypes. Among them, the most common subclass is papillary thyroid
carcinoma (PTC), comprising 80% of total thyroid carcinomas
(20). In the present study, three
original datasets GSE6004 (22),
GSE29265 and GSE60542 (23) from the
NCBI-Gene Expression Omnibus database (NCBI-GEO) (https://www.ncbi.nlm.nih.gov/geo) (24) were processed to identify the DEGs
between PTC tissue and healthy tissue controls. The present study
further filtered DEGs and completed gene ontology (GO) and pathway
enrichment via limma (25) package
and clusterProfiler in R 3.4.0 (2017-04-21, R Foundation, Vienna,
Austria) (26) and Panther
(http://www.pantherdb.org) (27). A protein-protein interaction (PPI)
network (http://string-db.org) (28) of DEGs was constructed along with
modular analysis to identify key genes in PTC. The results of the
present study may provide more practically precise and credible
biomarkers for use in the diagnosis, prevention and individualized
therapy of PTC.
Materials and methods
Data preparation and DEG
identification
From NCBI-GEO (https://www.ncbi.nlm.nih.gov/gds/), three gene
expression datasets of GSE6004 (22),
GSE29265 and GSE60542 (23) were
selected if they met four criteria: i) The deposited raw data were
in CEL format; ii) the datasets contained PTC and paired healthy
thyroid tissue samples. iii) GSE datasets involved in published
papers were excluded; iv) Chernobyl-related specimens were removed
from the remaining eligible samples based on the conclusion that
these PTCs are different from those sporadic PTCs, as the present
study wanted to analyze the latter (8). These three datasets were all analyzed on
the GPL570 platform (Affymetrix human genome U133 plus 2.0 array,
Affymetrix; Thermo Fisher Scientific, Inc., Waltham, MA, USA)
(http://www.affymetrix.com/support/technical/byproduct.affx?product=hg-u133-plus).
Detailed sample information on these microarrays are listed in
Table I. The raw data of these
datasets were processed by R 3.4.0 (2017-04-21, R Foundation,
Vienna, Austria) using the ‘affy’ package (29) and ‘limma’ package (25) for variance stabilization, background
correction, normalization and log transformation. DEGs were defined
based on the criteria p P<0.01 and |logFC|>1.5. For
validation, PTC data, including 58 normal and 356 thyroid cancers,
were obtained from The Cancer Genome Atlas (TCGA) (https://cancergenome.nih.gov/) and analyzed (20).
 | Table I.Data descriptions of the three
datasets from GEO. |
Table I.
Data descriptions of the three
datasets from GEO.
| GSE number | Tumor tissue | Normal control | Submission
date |
|---|
| GSE6004 | 7 | 4 | Oct 10, 2006 |
| GSE29265 | 7 | 7 | May 31, 2011 |
| GSE60542 | 33 | 30 | Aug 20, 2014 |
| Total | 47 | 41 |
|
Hierarchical analysis of GO and
pathways of DEGs
The GO and Kyoto Encyclopedia of Genes and Genomes
(KEGG) pathways of DEGs were hierarchically investigated using
‘clusterProfiler’ in R 3.4.0 (2017-04-21, R Foundation, Vienna,
Austria) (26) and Panther
(http://www.pantherdb.org) (27), a website that can visualize integrated
gene information.
Constructing PPI network and modular
analysis
The PPI network of PTC-associated DEGs-encoded
proteins was constructed using STRING (http://string-db.org) (30). Decisive candidate proteins in
prominent modules (confidence score of >0.9) with pivotal
physiologic regulation of PTC were retrieved by Cytoscape software
(version 3.5.1, The Cytoscape Consortium, San Diego, CA, USA)
(http://www.cytoscape.org/) (31).
Reverse transcription-quantitative
polymerase chain reaction (RT-qPCR) assay
In the present study, 8 DEGs (5 upregulated and 3
downregulated) were selected for validation in peripheral blood
samples of PTC patients using RT-qPCR. The present study was
approved by the Ethics Committee of Guang'anmen Hospital (Beijing,
China). Patients provided written informed consent prior to blood
collection. From March 1st, 2018 to March 31st, 2018, peripheral
blood samples of 21 PTC patients (2 ml/sample) were collected from
the department of internal medicine at the Southern branch of
Guang'anmen Hospital. PTC patients were selected based on two
criteria: First hospitalized and no other autoimmune disease or
other malignancies at the time of the investigation (age range, 26
to 65 years; median age, 46.5 years; 4 males, 17 females). Then 21
blood samples from healthy people (2 ml/sample) served as the
control (age range, 20 to 63 years; median age, 47.5 years; 4
males, 17 females). The PCR primers were as follows: Forward primer
AGTR1, 5′-TTGTTGAAAGGTTTGAGTGGG-3′ and reverse primer AGTR1,
5′-TTGCAGATATTGTGGACACGG-3′; CFD forward primer,
5′-CGATGGTGTCGGGCTGGCTGT-3′ and reverse primer,
5′-GCCCTACATGGCGTCGGTGCA-3′; COL1A1 forward primer,
5′-CGATGGATTCCAGTTCGAGTATG-3′ and reverse primer,
5′-TGTTCTTGCAGTGGTAGGTGATG-3′; COL8A1 forward primer,
5′-CTTTCTGTCCAATTTCTCCTT-3′ and reverse primer,
5′-ATACCATTAGCCAGTTTACGA-3′; COL10A1 forward primer,
5′-GATGATGGCACTCCCTGAAGC-3′ and reverse primer,
5′-ATAAGAATGGCACCCCTGTAA-3′; LPAR5 forward primer,
5′-ACGGCGGACCTTTCGGATTGC-3′ and reverse primer,
5′-GCGGGGTGCTGATGGTGATGG-3′; MMRN1 forward primer,
5′-ATGGGCAGGAAGTCTGGTTACGA-3′ and reverse primer,
5′-ACAGAGCAGATGTGCAAGCAAAGAT-3′; NMU forward primer,
5′-CATTCCCATAATCATAAAGCAA-3′, reverse primer,
5′-AAGGATTACAGCCTGAACAAC-3′; β-actin forward primer,
5′-CTACCTCATGAAGATCCTCACCGA-3′, reverse primer,
5′-TTCTCCTTAATGTCACGCACGATT-3′.
Total RNA was isolated from blood samples using
TRIzol reagent (Invitrogen; Thermo Fisher Scientific, Inc.).
Reverse transcription and real-time quantification were performed
using PrimeScript™ RT reagent kit with gDNA Eraser (Perfect Real
Time) (Takara Biotechnology Co., Ltd., Dalian, China) and TB Green™
Premix Ex Taq™ (Tli RNaseH Plus) (Takara Biotechnology Co., Ltd.,
Dalian, China) according to manufacturer's protocol (32). Each measurement was made in triplicate
and normalized with β-actin control. The thermal cycling conditions
included an initial denaturing step at 95°C for 30 sec, 40 cycles
at 95°C for 5 sec, 60°C for 30 sec. The relative gene expression
data were analyzed using 2−ΔΔCq algorithm (33) according to the literature (34) and the RDML (Real-Time PCR Data Markup
Language) data standard (http://www.rdml.org) (35).
Statistical analysis
Statistical analyses were performed with GraphPad
Prism 5 (GraphPad Software, Inc., La Jolla, CA, USA). Data from the
qPCR experiments are presented as mean ± standard deviation. The
significance of differential expression between PTCs and controls
was assessed by an unpaired Student's t-test. P<0.05 was
considered to indicate a statistically significant difference.
Results
Screening of DEGs from PTC and paired
thyroid tissues based on NCBI-GEO datasets
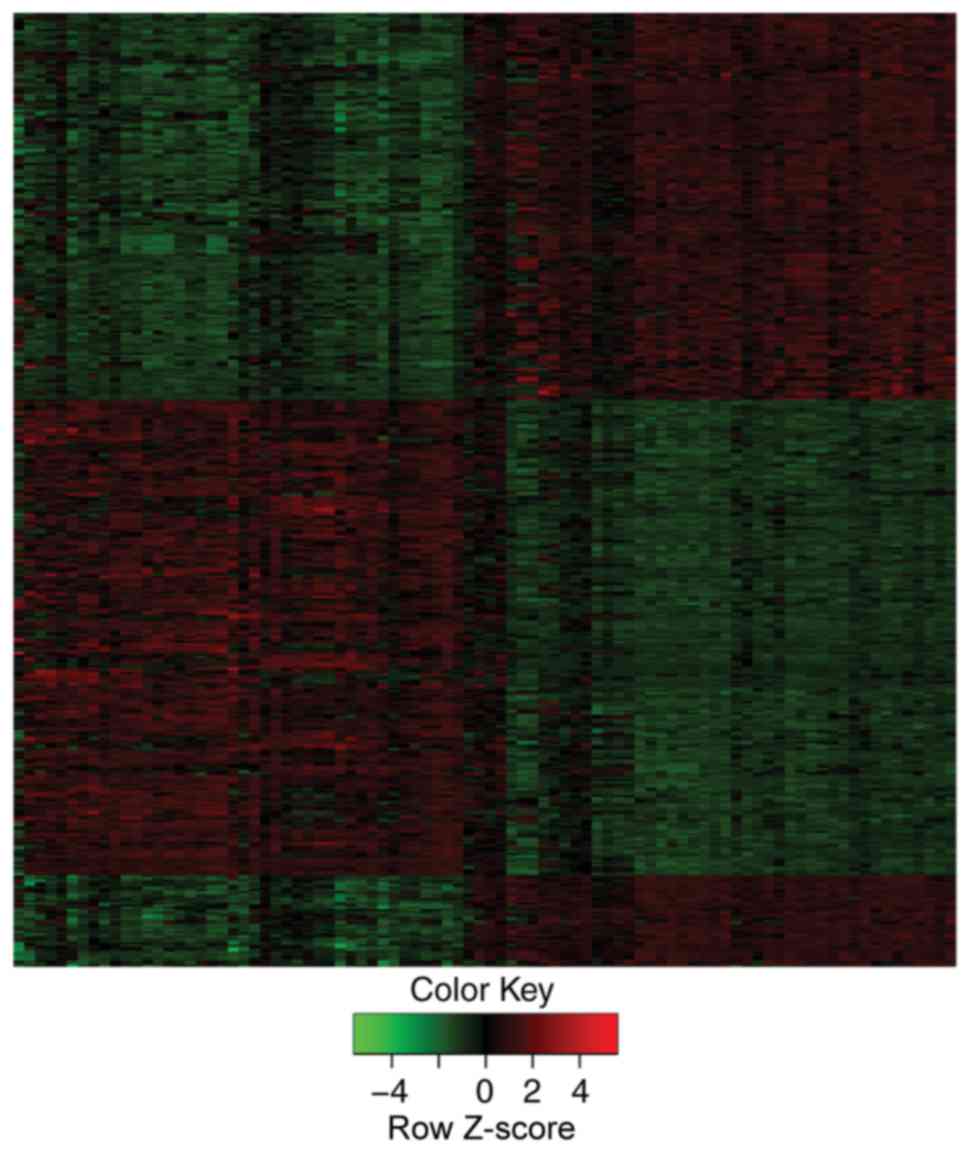
Employing the cut-off criteria P<0.01 and
|logFC|>1.5, 423 DEGs were identified from PTC and paired
healthy thyroid tissues based on three datasets GSE6004, GSE29265
and GSE60542 (data not shown) using R 3.4.0 (2017-04-21; R
Foundation, Vienna, Austria) program. Among these genes, up- and
downregulated genes accounted for 211 and 212 genes, respectively.
These DEGs could be clearly discriminated between PTC and normal
controls with heat map visualization (Fig. 1).
Gene Ontology analysis of DEGs in
PTC
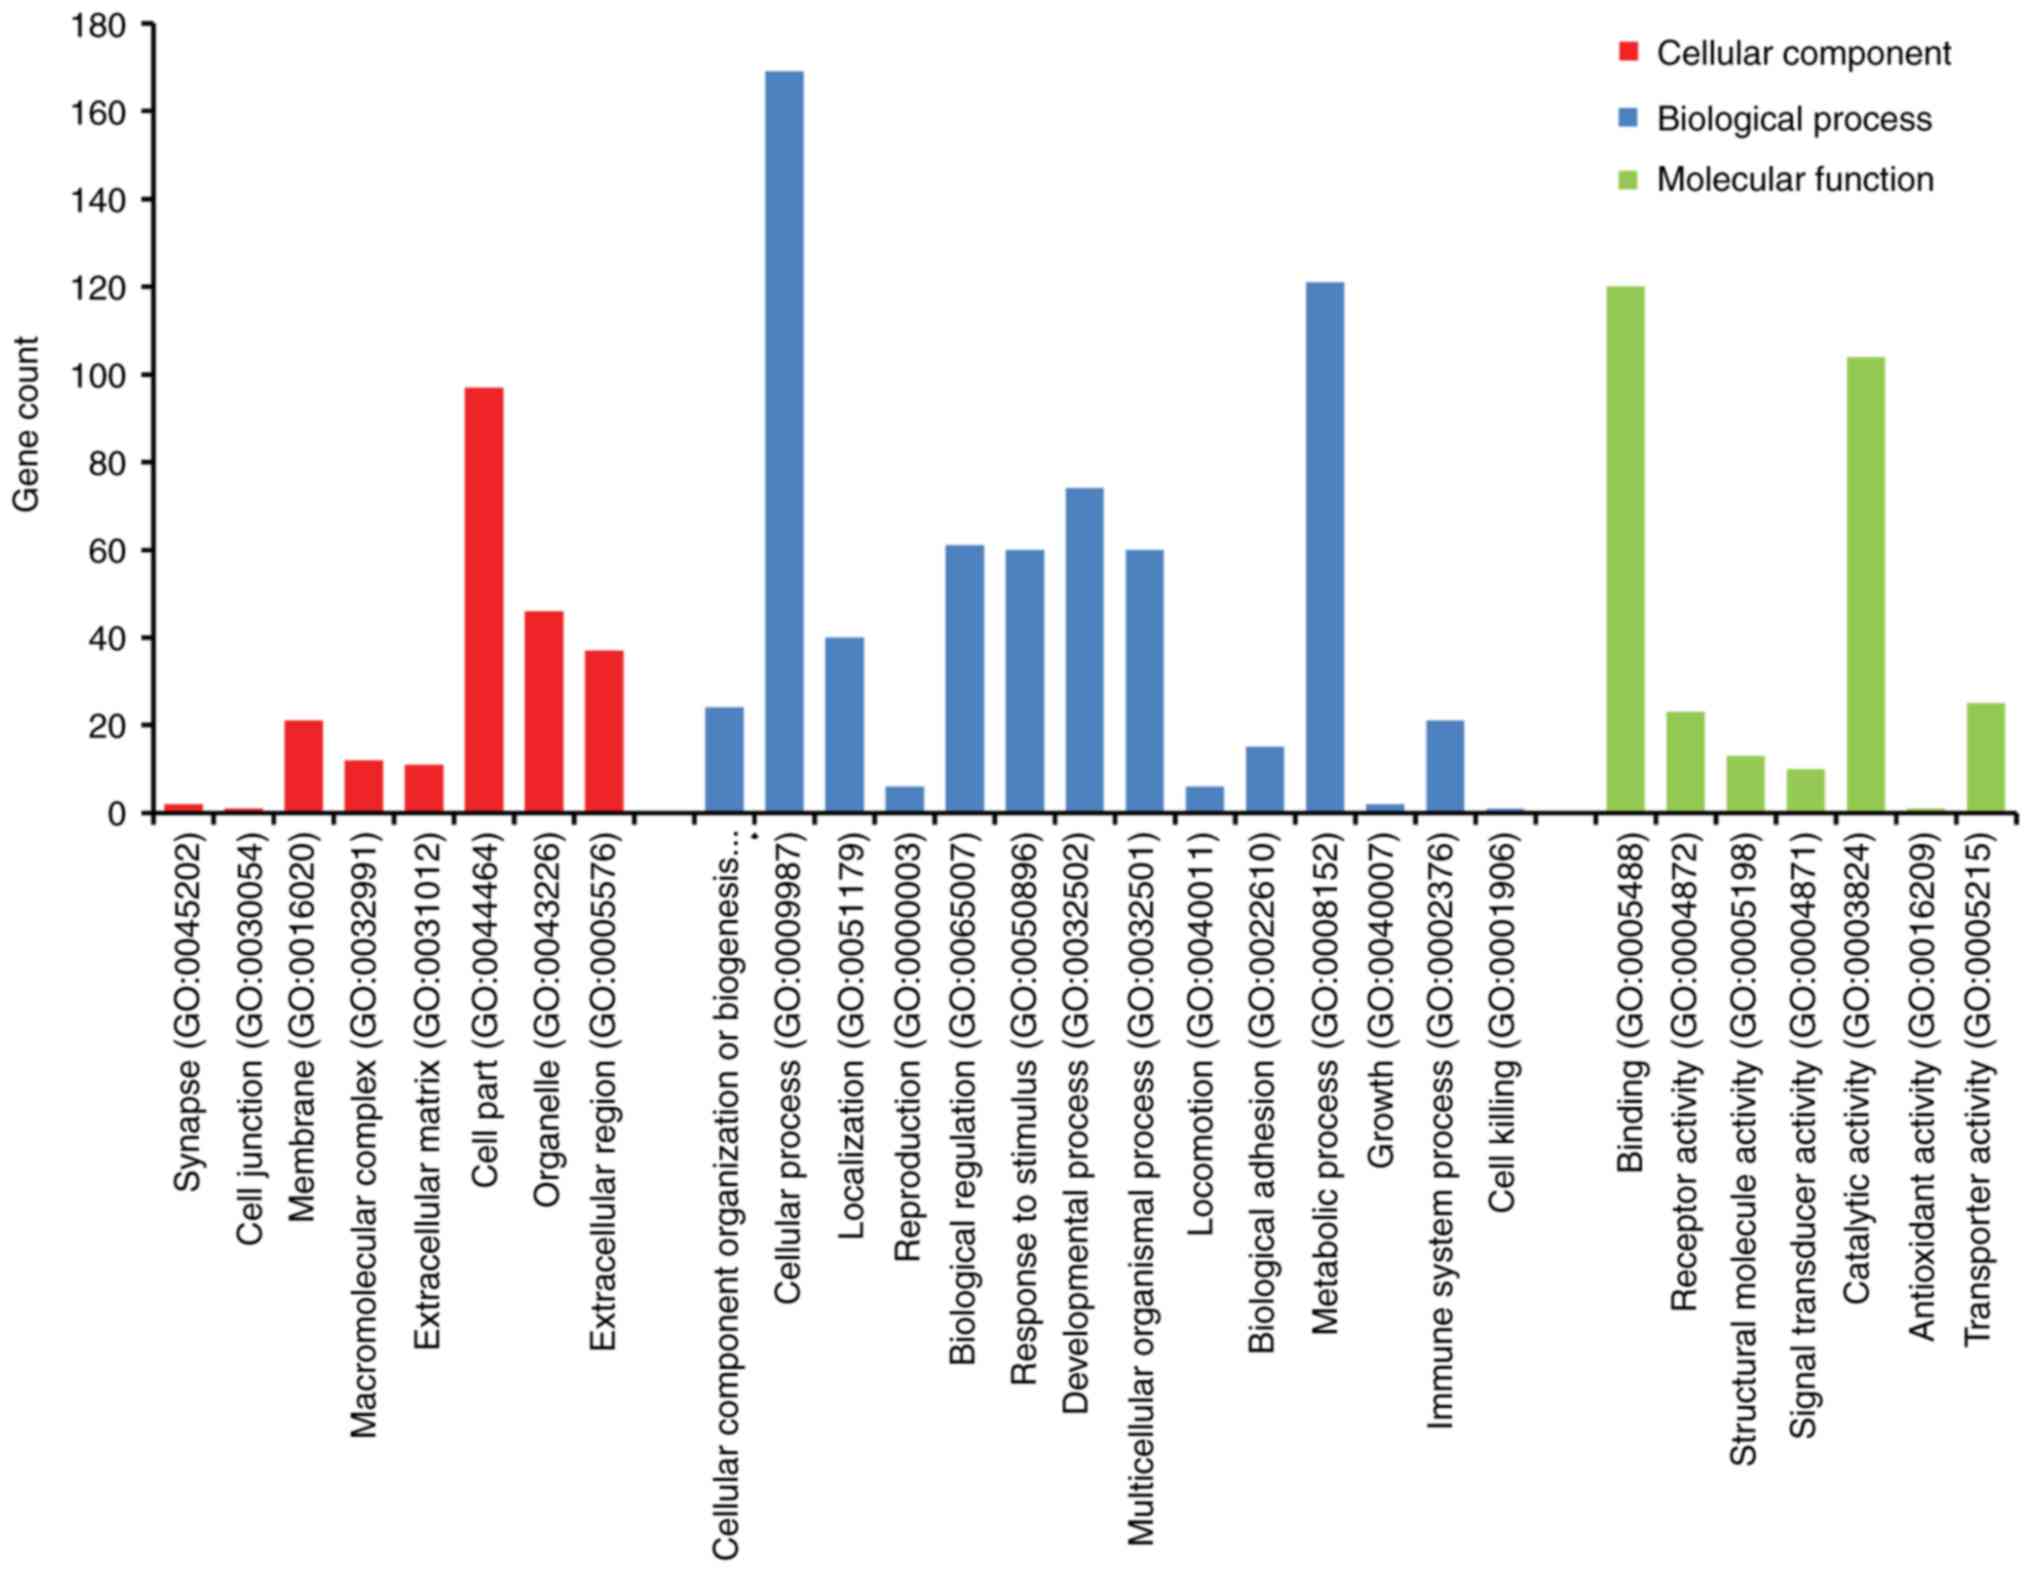
Candidate DEGs gene ontology (GO) analysis was
performed using the online database Panther (http://www.pantherdb.org) and R 3.4.0 (2017-04-21, R
Foundation, Vienna, Austria) program (26). The DEGs were classified into molecular
function (MF), biological process (BP) and cellular component (CC)
groups (Fig. 2). In the BP grouping,
DEGs were mainly enriched in cellular component organization or
biogenesis, localization, reproduction, and regulation. In the MF
grouping, DEGs were mainly enriched in binding, receptor activity,
structural molecule activity, signal transducer activity. In the CC
grouping, DEGs were mainly enriched in synapse, cell junction,
membrane, macromolecular complex, extracellular matrix.
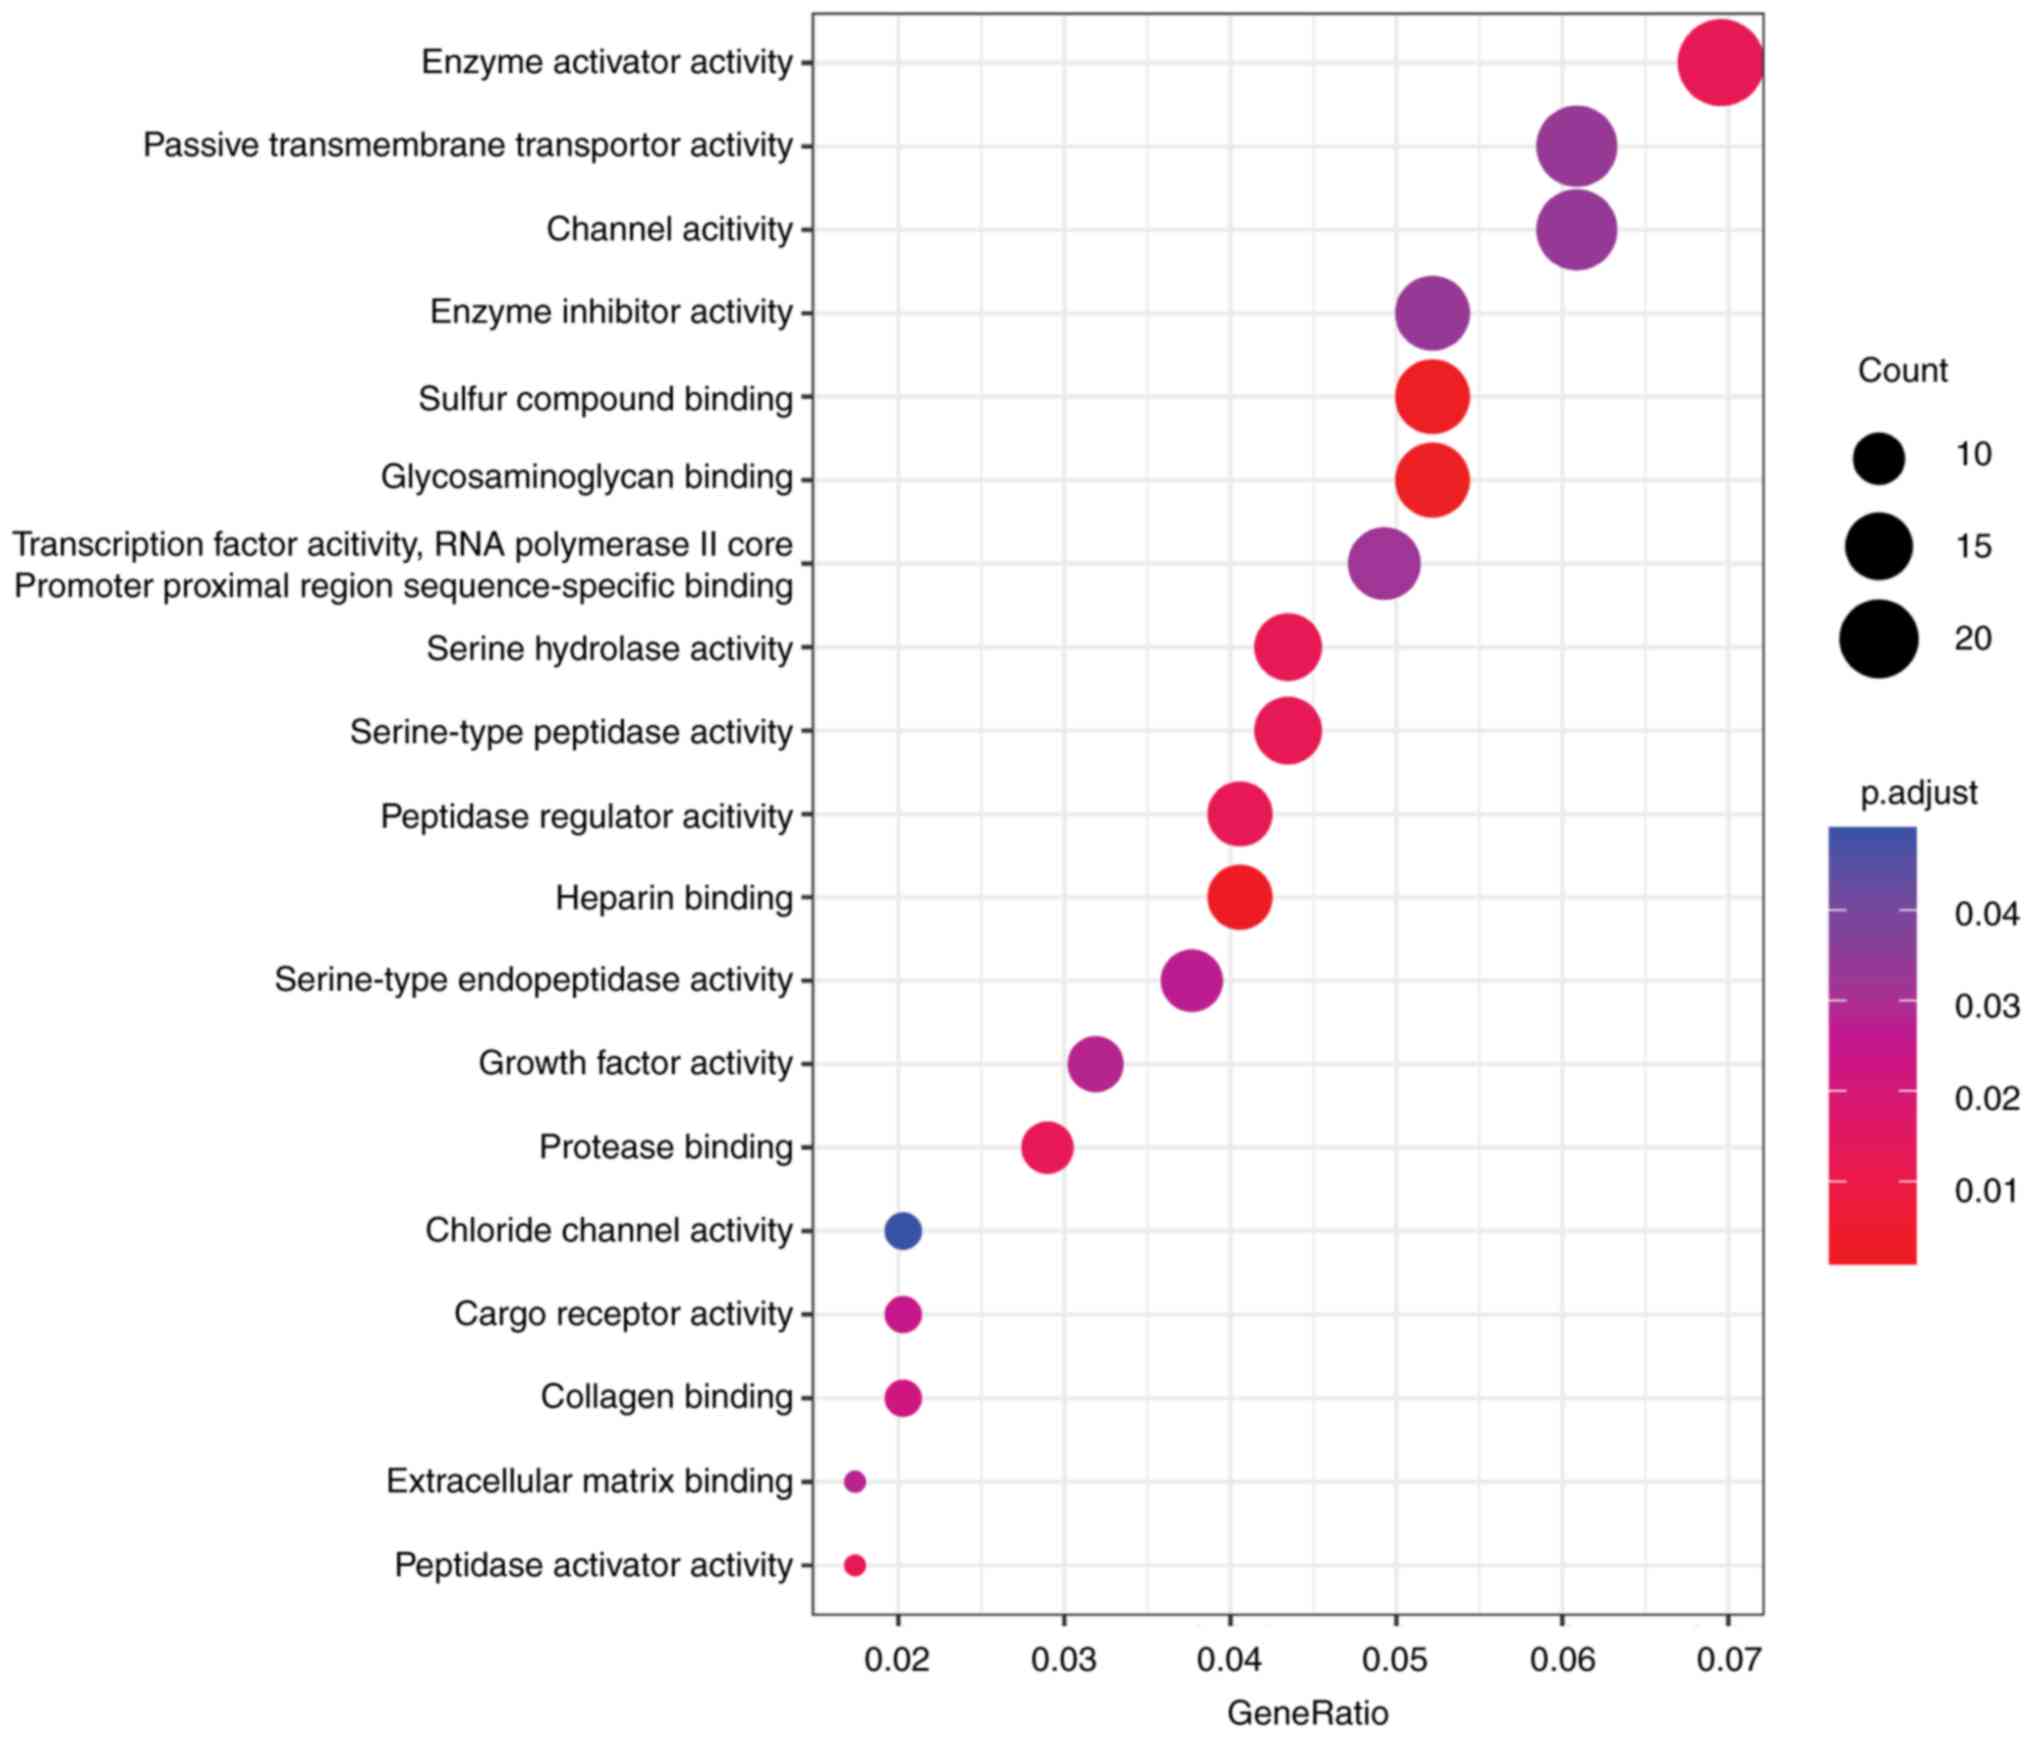
Additionally, the present study used
‘clusterProfiler’ in R 3.4.0 (2017-04-21, R Foundation, Vienna,
Austria) (26) to perform DEGs GO
analysis. The results indicated that the majority of DEGs were
clustered in glycosaminoglycan binding, sulfur compound binding,
heparin binding, enzyme activator activity and peptidase activator
activity (Fig. 3 and Table II). Upregulated DEGs were
significantly enriched serine-type endopeptidase activity,
serine-type peptidase activity, serine hydrolase activity,
endopeptidase activity, protease binding. Unexpectedly, there were
no downregulated DEGs involved in typical GO biological processes
and pathways.
| Table II.The significant enrichment analysis
of DEGs in PTC. |
Table II.
The significant enrichment analysis
of DEGs in PTC.
| Term | Description | Count | P-value |
|---|
| GO:0005539 | Glycosaminoglycan
binding | 18 | 0.0000004 |
| GO:1901681 | Sulfur compound
binding | 18 | 0.0000018 |
| GO:0008201 | Heparin
binding | 14 | 0.0000068 |
| GO:0008047 | Enzyme activator
activity | 24 | 0.0000983 |
| GO:0016504 | Peptidase activator
activity | 6 | 0.0001337 |
| GO:0002020 | Protease
binding | 10 | 0.0001528 |
| GO:0008236 | Serine-type
peptidase activity | 15 | 0.0001572 |
| GO:0017171 | Serine hydrolase
activity | 15 | 0.0001805 |
| GO:0061134 | Peptidase regulator
activity | 14 | 0.0002016 |
| GO:0005518 | Collagen
binding | 7 | 0.0003936 |
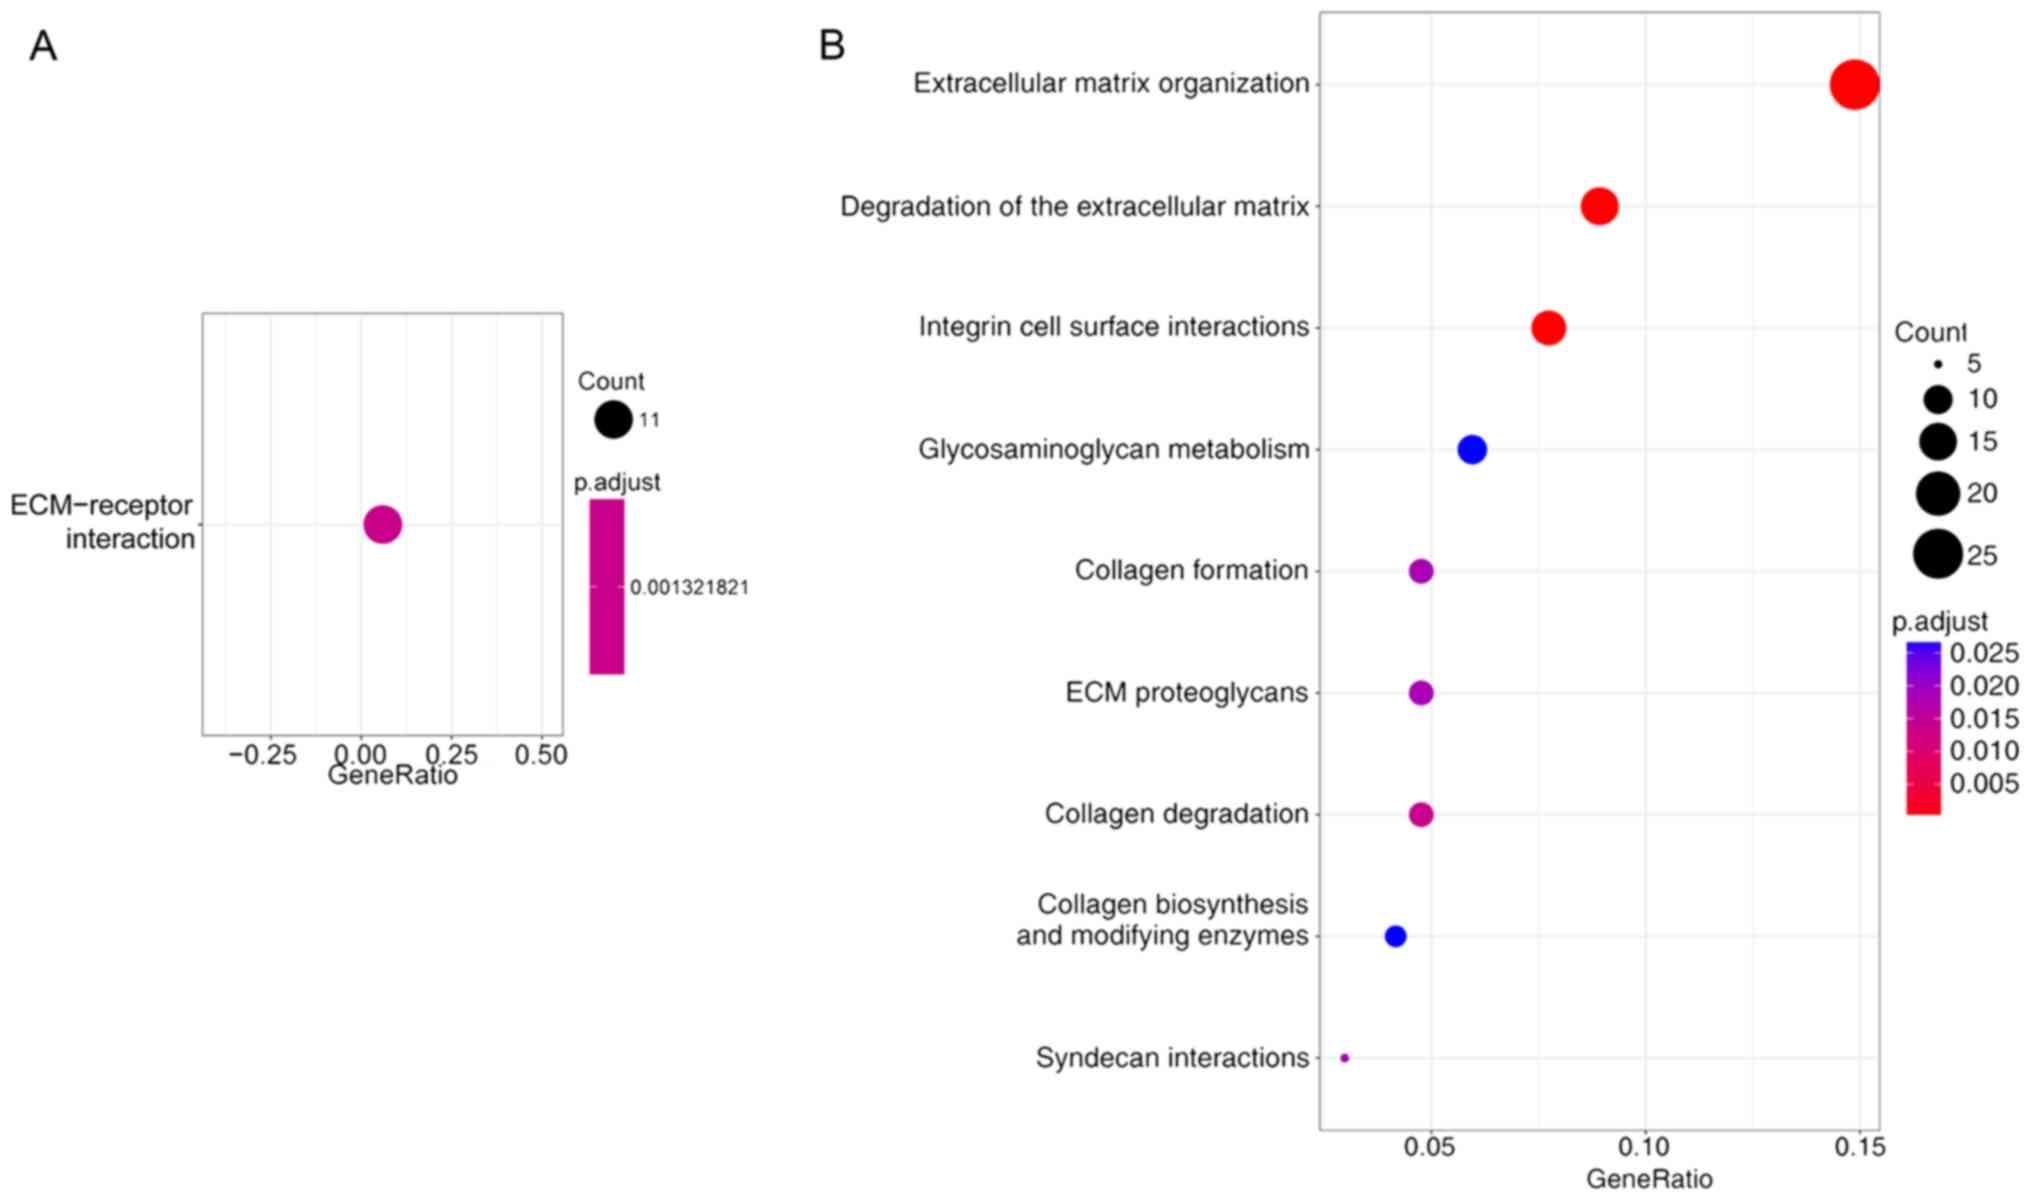
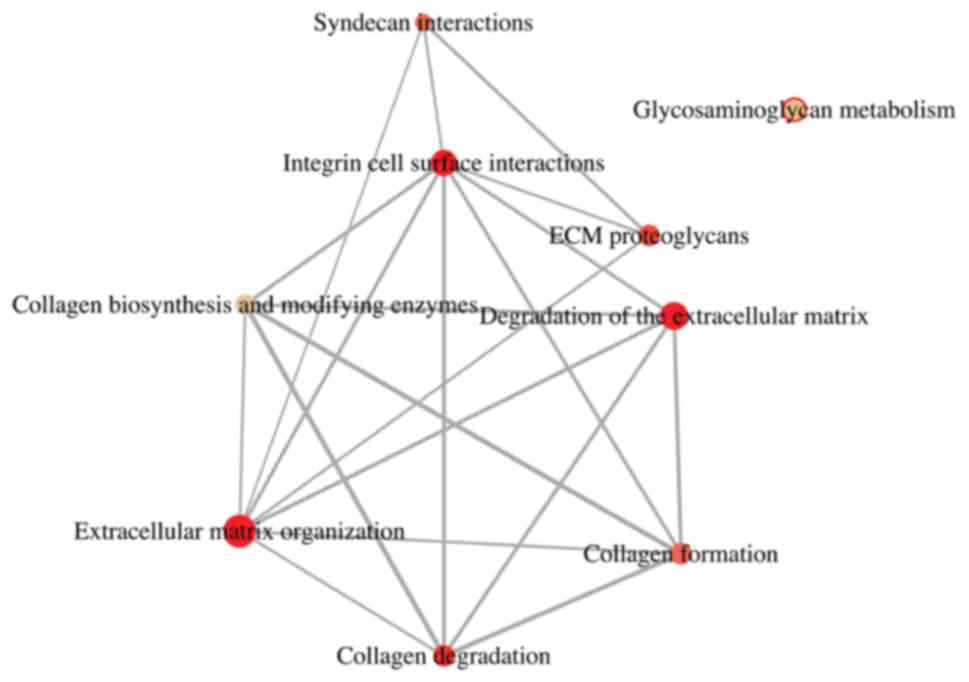
Screening of typical signaling
pathways associated with DEGs
The typical signaling pathways associated with our
DEGs were identified using ‘clusterProfiler’ in R 3.4.0
(2017-04-21, R Foundation, Vienna, Austria) (26). The DEGs had commonalities in hsa04512:
ECM-receptor interaction pathway (Fig.
4A). The outcome of a reactome enquiry suggested that the
majority of the DEGs were involved in extracellular matrix
organization, degradation of the extracellular matrix, integrin
cell surface interactions, collagen degradation, ECM proteoglycans
(Fig. 4B and Table III). The reactome network is
illustrated in Fig. 5.
| Table III.Signaling pathway enrichment analysis
of DEGs in PTC. |
Table III.
Signaling pathway enrichment analysis
of DEGs in PTC.
| Pathway | Name | Gene Count | P-value | Genes |
|---|
| 1474244 | Extracellular
matrix organization | 25 | 0.000000002 |
BMP2/COL10A1/COL13A1/COL1A1/COL23A1/COL8A1/COL8A2/COL9A3/COMP/DCN/EFEMP1/FBLN1/FN1/ICAM1/ITGA2/KLK7/LAMB3/LRP4/MMP16/NCAM1/PRSS2/SDC4/SPP1/TIMP1/TNC |
| 1474228 | Degradation of the
extracellular matrix | 15 | 0.000000062 |
COL10A1/COL13A1/COL1A1/COL23A1/COL8A1/COL8A2/COL9A3/DCN/FN1/KLK7/LAMB3/MMP16/PRSS2/SPP1/TIMP1 |
| 216083 | Integrin cell
surface interactions | 13 | 0.000000103 |
COL10A1/COL13A1/COL1A1/COL23A1/COL8A1/COL8A2/COL9A3/COMP/FN1/ICAM1/ITGA2/SPP1/TNC |
| 1442490 | Collagen
degradation | 8 | 0.000134395 |
COL10A1/COL13A1/COL1A1/COL23A1/COL8A1/COL8A2/COL9A3/PRSS2 |
| 3000178 | ECM
proteoglycans | 8 | 0.000233271 |
COL1A1/COMP/DCN/FN1/ITGA2/LRP4/NCAM1/TNC |
| 1474290 | Collagen
formation | 8 | 0.000316917 |
COL10A1/COL13A1/COL1A1/COL23A1/COL8A1/COL8A2/COL9A3/LAMB3 |
| 3000170 | Syndecan
interactions | 5 | 0.000319611 |
COL1A1/FN1/ITGA2/SDC4/TNC |
| 1630316 | Glycosaminoglycan
metabolism | 10 | 0.000587452 |
B4GALT6/CHST2/CSGALNACT1/DCN/GPC3/HS6ST2/LYVE1/OGN/PAPSS2/SDC4 |
| 1650814 | Collagen
biosynthesis and modifying enzymes | 7 | 0.000599989 |
COL10A1/COL13A1/COL1A1/COL23A1/COL8A1/COL8A2/COL9A3 |
PPI network, key nodes analyses and
pathway identification
The PPI network was constructed based on 423
selected DEGs using STRING database. Furthermore, we filtered three
prominent modules from it by Cytotype MCODE of Cytoscape depending
on the importance of each gene (Fig.
6). These modules consisted of 21 genes: Complement factor D
(CFD), collagen type X α 1 chain (COL10A1), collagen type XIII α 1
chain (COL13A1), collagen type I α 1 chain (COL1A1), collagen type
XXIII α 1 chain (COL23A1), collagen type VIII α 1 chain (COL8A1),
collagen type VIII α 2 chain (COL8A2), collagen type IX α 3 chain
(COL9A3), Extracellular Matrix Protein 1 (ECM1), Fibronectin 1
(FN1), Multimerin 1 (MMRN1), Protein S (PROS1), Serpin Family A
Member 1 (SERPINA1), TIMP Metallopeptidase Inhibitor 1 (TIMP1),
Angiotensin II Receptor Type 1 (AGTR1), Arginine Vasopressin
Receptor 1A (AVPR1A), Endothelin 3 (EDN3), G Protein Subunit α 14
(GNA14), KISS1 Receptor (KISS1R), Lysophosphatidic Acid Receptor 5
(LPAR5) and Neuromedin U (NMU). Enrichment analysis (Table IV) demonstrated that these three
modules were principally associated with protease and G-protein
coupled receptor binding, extracellular matrix components and
peptidase regulator activity.
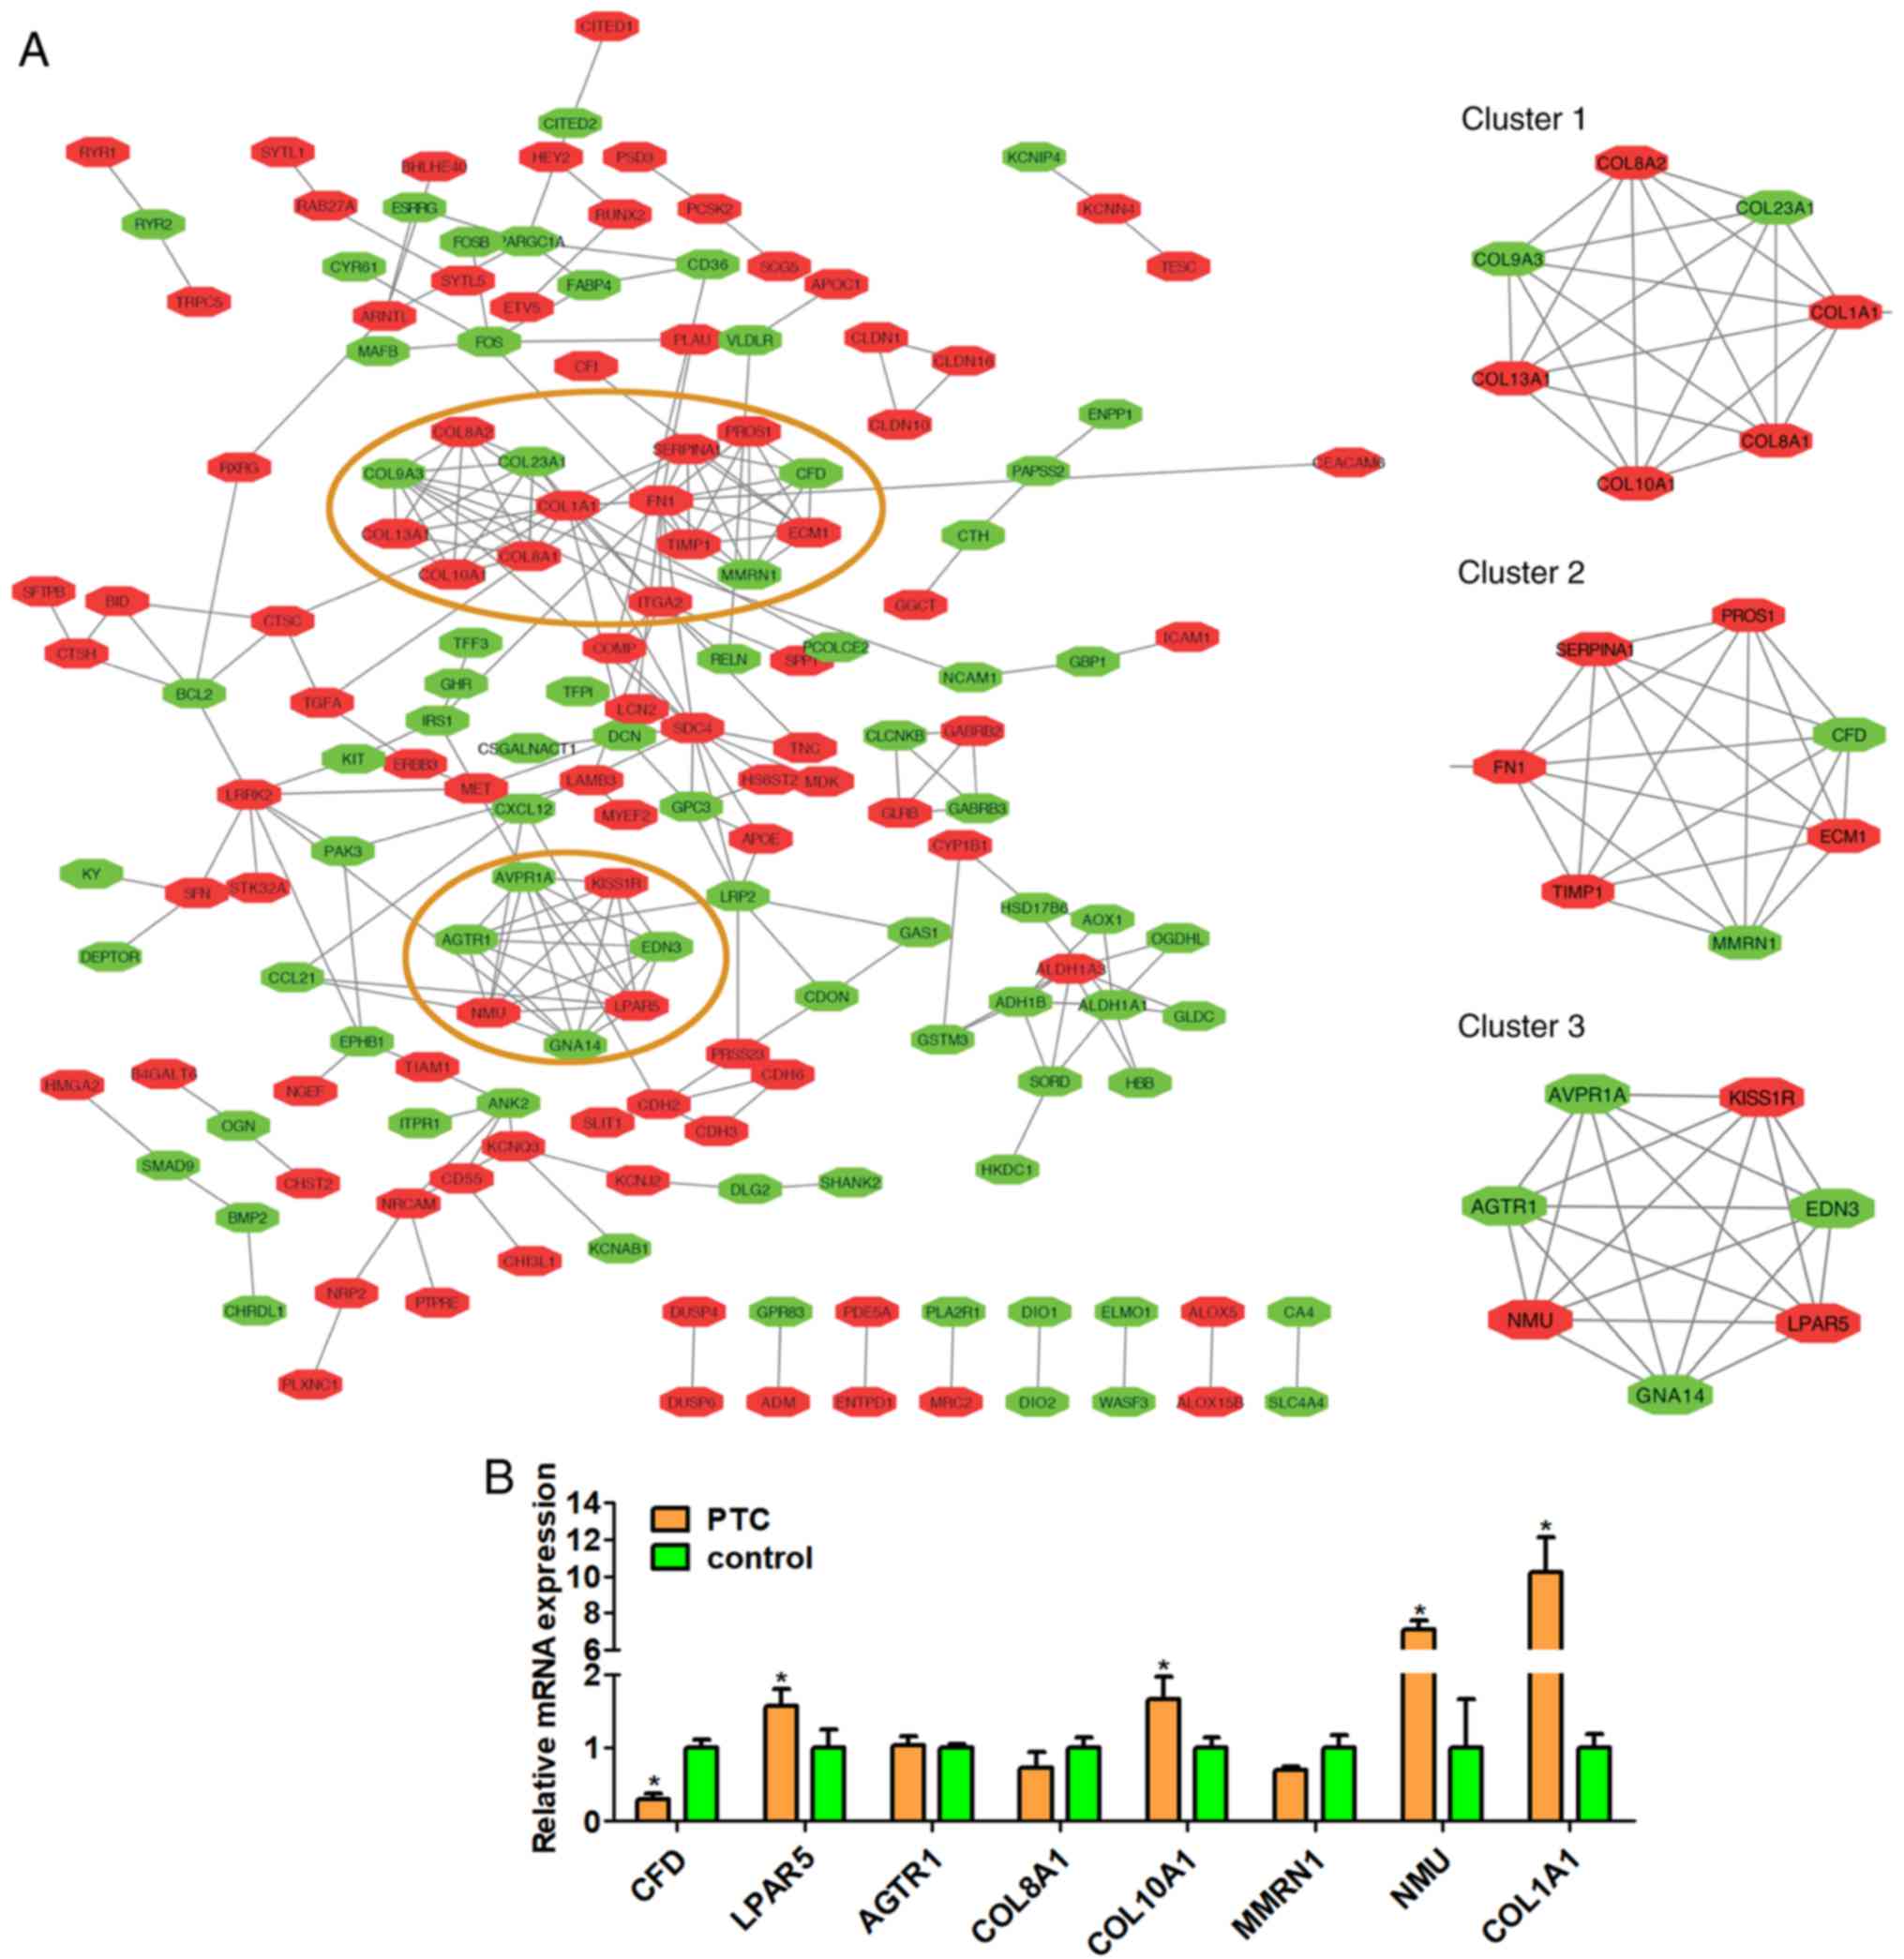 | Figure 6.(A) Diagram of the protein-protein
interaction network and three prominent modules (91 in red denote
upregulated genes and 74 in green denote downregulated genes). The
red circles represent the prominent clusters 1 to 3, and the right
side are enlarged views of them. (B) Relative mRNA expressions of 8
differentially expressed genes isolated from peripheral blood
samples of papillary thyroid carcinoma and control samples by
reverse transcription-quantitative polymerase chain reaction
analysis. CFD, complement factor D; LPAR5, Lysophosphatidic Acid
Receptor 5; AGTR1, Angiotensin II Receptor Type 1; COL8A1, collagen
type VIII α 1 chain; COL10A1, collagen type X α 1 chain; MMRN1,
Multimerin 1; NMU, Neuromedin U; COL1A1, collagen type I α 1 chain.
*P<0.05, PTC group vs. control group. |
| Table IV.Enrichment analysis of genes'
function in modules 1–3. |
Table IV.
Enrichment analysis of genes'
function in modules 1–3.
| Term | Description | Count | P-value |
|---|
| GO:0002020 | Protease
binding | 4 | 0.0000004 |
| GO:0001664 | G-protein coupled
receptor binding | 5 | 0.0000018 |
| GO:0005201 | Extracellular
matrix structural constituent | 3 | 0.0000068 |
| GO:0061134 | Peptidase regulator
activity | 4 | 0.0000983 |
| GO:0008528 | G-protein coupled
peptide receptor activity | 3 | 0.0001337 |
| GO:0001653 | Peptide receptor
activity | 3 | 0.0001528 |
| GO:0071855 | Neuropeptide
receptor binding | 2 | 0.0001572 |
| GO:0004866 | Endopeptidase
inhibitor activity | 3 | 0.0001805 |
| GO:0061135 | Endopeptidase
regulator activity | 3 | 0.0002016 |
| GO:0030414 | Peptidase inhibitor
activity | 3 | 0.0003936 |
TCGA datasets used to verify selection
of 423 DEGs
To confirm the 423 DEGs screened in the current
study, PTC datasets containing 356 PTC and 58 normal controls were
downloaded from TCGA website and were analyzed using the same
investigative approach (20). The
results demonstrated that 186 upregulated and 184 downregulated
genes were overlapping at two different sources (data not shown).
Notably, 25 upregulated as well as 28 downregulated genes did not
appear in the list, suggesting our results were credible.
RT-qPCR verification of selected
DEGs
The expressions of 5 upregulated (COL10A1, COL1A1,
COL8A1, LPAR5, NMU) and 3 downregulated (CFD, MMRN1, AGTR1) genes
were validated using RT-qPCR assay of genetic material extracted
from the peripheral blood samples of patients with PTC. The results
demonstrated that gene expression of COL10A1, COL1A1, LPAR5, NMU,
and CFD (P=0.0364, P=0.0135, P=0.0478, P=0.0002, P=0.0009, PTC
group vs. control group) were consistent with data from the
bioinformatics analysis. There was no difference in the expression
of COL8A1, MMRN1, and AGTR13 between the PTC and control groups
(Fig. 6B).
Discussion
The present study identified 423 obvious DEGs
between PTC tissues and normal controls, of which 211 were
upregulated and 212 were downregulated. These 423 DEGs were then
categorized into three groups (MF, BP and CC) based on GO analysis.
Results of GO and signaling pathway enquiry indicated that the DEGs
were remarkably clustered in glycosaminoglycan binding, sulfur
compound binding, heparin binding, enzyme activator activity,
peptidase activator activity and hsa04512: ECM-receptor
interaction. The reactome network of DEGs demonstrated that
extracellular matrix organization and degradation as well as
integrin cell surface interactions were key nodes of this
network.
A PPI network was established using the selected
DEGs and the most correlated 3 modules were selected for further
analysis. Among these modules, 21 central node genes were present
which were most associated with protease and G-protein coupled
receptor binding and peptidase regulator activity.
Consistent with the results obtained by the present
study, other research groups also published the results of DEGs
certification in PTC (11,18–21). For
example, based on four datasets (GSE3467, GSE33630, GSE3678,
GSE5315), Espinal-Enríquezet al (10) analyzed 64 healthy controls, 12
follicular thyroid carcinoma, 72 PTC and 11 anaplastic thyroid
carcinoma samples, and reported there were an overall 503
upregulated and 457 downregulated genes in PTC. The topmost 10
dysregulated genes were GABRB2, HMGA2, PRR15, CHI3L1, ZCCHC12, TPO,
DIO1, ADH1B, PKHD1L1, and TFF3. These DEGs were also identified in
the present study and were primarily clustered in extracellular
region and space and developmental process.
Yu et al (21)
analyzed GSE3467 raw data including 9 PTC subjects and 9 paired
normal tissues. They identified 1343 DEGs, of which, 651 were
upregulated and 692 were downregulated, which were mainly enriched
in complement and coagulation cascades as well as thyroid cancer
pathways. The most significant differentially expressed genes were
MMP9, C3, PPARG, PAX8 and JUN. However, it is important to note
that this study employed only one dataset. Similarly, Zhao et
al (11) enrolled one dataset,
GSE53157, containing 7 PTC specimens and 3 paired normal tissues,
and ascertained 668 DEGs containing 262 upregulated genes and 406
downregulated genes, which were mainly enriched in the signaling
pathways related to programmed cell death, the p53 signaling
cascades, the activities of protein kinase and transferase. They
suggested that S100A6, MET and CDKN1C might have potential roles in
the development of PTC.
Degradation of the extracellular matrix of adjacent
tissues facilitates tumor invasion and metastasis (36). A recent study has identified that a
regulatory loop exists between thyroid tumor cells, cancer
associated fibroblasts (CAFs), collagen, and lysyl oxidase (Lox),
which potentiates thyroid cancer progression (37). Qu et al (15) analyzed two microarray datasets
(GSE3467 and GSE3678) and identified a total of 167 DEGs, which
were associated with the regulation of plasma membrane and
extracellular matrix.
The difference between our manuscript and the
published papers on data mining for PTC is that the present study
used R language and ‘clusterProfile’ in R for data processing,
which can overcome some deficiencies such as data insufficiency
caused by the update delay of some databases (10,11,14,15,21).
In addition, the datasets selected were all based on GPL570
platform (Affymetrix human genome U133 plus 2.0 array, Affymetrix;
Thermo Fisher Scientific, Inc.) which is regarded as classic
high-throughput expression microarray. This is helpful for the
follow-up research, because by re-annotating and reassigning probe
groups for functional regions of interest based on
Affymetrix® GeneChip® technology, researchers
can take advantage of the high volume of publicly available data to
detect subtle changes in the region of interest likely to have
phenotypical consequences in gene, transcript (isoform),
untranslated region (UTR) and exon level with only minimal
computational cost (38).
In the present study, reactome analysis indicated
that the majority of the DEGs were primarily involved in
extracellular matrix organization and degradation, integrin cell
surface interactions, collagen degradation and collagen formation.
The present study identified that COL10A1, COL13A1, COL1A1, COL8A1
and COL8A2 were upregulated in PTC, while COL9A3 and COL23A1 were
downregulated. These DEGs work together to establish a network
permissive of tumorigenesis (39),
which requires further study, and hypothesize that this result will
lead to the verification of additional therapeutic targets and
biomarkers in PTC.
In the PPI network constructed in the present study,
the second cluster consisted of CFD, ECM1, FN1, MMRN1, PROS1,
SERPINA1 and TIMP1. Excluding CFD and MMRN1, all the genes were
upregulated in PTC. ECM1 encodes a soluble protein that
participates in angiogenesis and oncobiology (40). Kebebew et al (41) reported that ECM1 and TMPRSS4 were
effective diagnostic markers of malignant thyroid nodules and
differentiated thyroid cancers (DTC). FN1 regulates cell adhesion
and migration processes (42). Its
overexpression is an important determining factor in thyroid cancer
aggression (43,44). In a meta-analysis, SERPINA1 was
identified as a single marker for PTC with 99% accuracy (45). As a member of the TIMP gene family,
TIMP1 encoded proteins that naturally inhibit MMP pathway resulting
in the extracellular matrix degradation; a process closely
associated with thyroid cancer invasiveness, migration and
metastasis (10). In addition, TIMP1
encoded proteins promoted proliferation in various cell types and
impeded cell apoptosis (46). TIMP1
mRNA had high inducibility to numerous cytokines and hormone
stimulation (47).
In the third cluster of the PPI network, EDN3
encodes a protein belong to the endothelin family (48). Altered expression of this protein has
been implicated in tumorigenesis (49). KISS1 is a metastasis suppressor gene
(50). Its receptor, KISS1R, is a
galanin-like G protein-coupled receptor that was demonstrated to be
overexpressed in PTC and associated with MAP kinase activity
(51). In DTC, KISS1 expression was
conspicuously higher in aggressive and advanced tumors, which was
moderately negatively correlated with tumor size (52). Lysophosphatidic acid receptor 5
(LPAR5) belongs to the rhodopsin class of G protein-coupled
receptors (GPCR) superfamily that regulates various cellular
processes engaged with tumor development (53). NMU encodes a member of the neuromedin
family of neuropeptides that have effect in immune-mediated
inflammatory diseases development; its overexpression was detected
in tumors of renal, pancreatic and lung origins (54–57). The
aforementioned analysis reminds us that these selected genes have
not been the subjects of in-depth scientific investigation.
Consequently, their relationship with PTC should be studied
further.
The present study first verified the screened 423
DEGs with TCGA database and identified that 186 upregulated and 184
downregulated genes were overlapping in the two different sources
(data not shown). The expressions of five upregulated (COL10A1,
COL1A1, COL8A1, LPAR5, NMU) and three downregulated (CFD, MMRN1,
AGTR1) genes were further validated using RT-qPCR of the peripheral
blood samples of patients with PTC. These genes were selected as
the majority of them were not previously reported in the
literature. The results were consistent (5/8 genes were confirmed)
with data from the bioinformatics analysis, suggesting our screened
data were credible.
The present study was unable to validate all 21 key
genes and could not solve the problem regarding histological,
genetic, clinic biological characteristics and treatments of PTCs,
primarily due to fund shortage. However among these genetic
targets, LPAR5 was demonstrated to be involved in the pathogenesis
of several types of cancer including melanoma, sarcoma,
nasopharyngeal carcinoma (53,58,59).
LPAR5 is lysophosphatidic acid (LPA) receptor 5, encodes a member
of the rhodopsin class of G protein-coupled transmembrane receptors
(60). The activated LPA stimulates
cell proliferation, migration and survival (61). Differentially LPA production, receptor
expression and signals contribute to cancer initiation, progression
and metastasis (61). Database-based
analysis (https://www.proteinatlas.org/) results also indicated
that the prognosis of thyroid cancer patients with high expression
level of LPAR5 was poor (https://www.proteinatlas.org/ENSG00000184574-LPAR5/pathology/tissue/thyroid+cancer)
(62,63). Therefore, functional experiments of
this gene including cell proliferation, migration, gain- and
loss-of-function assays, should be conducted in the future.
In the present study, 423 DEGs were identified using
three datasets from GEO with R programming language, and then
filtered 392 gene nodes in DEGs PPI network, and 21 prominently
altered key genes, which were significantly associated with
extracellular matrix structural constituents and thyroid cancer
invasiveness, migration and metastasis were selected. These
candidate genes and pathways may have use as potential therapeutic
targets in the future. These findings will expand the presently
available knowledge regarding the etiology and essential molecular
mechanisms at work in PTC progression. However, further
experimentation on a larger clinical sample library should be used
to verify these results.
Acknowledgements
Not applicable.
Funding
No funding was received.
Availability of data and materials
The datasets used and/or analyzed during the current
study are available from the corresponding author on reasonable
request.
Authors' contributions
SL and HY designed the research, analyzed and
interpreted the data, and wrote the manuscript. HY performed the
RT-qPCR experiments. YY performed all the R language programming,
data mining and visualizing tasks. All authors read and approved
the final manuscript.
Ethics approval and consent to
participate
The Ethics Committee of Guang'anmen Hospital
approved the protocol of the present study and signed informed
consent was obtained from all participants.
Patient consent for publication
All patients provided written informed consent for
the publication of associated data.
Competing interests
The authors declare that they have no competing
interests.
References
|
1
|
Nguyen QT, Lee EJ, Huang MG, Park YI,
Khullar A and Plodkowski RA: Diagnosis and treatment of patients
with thyroid cancer. Am Health Drug Benefits. 8:30–40.
2015.PubMed/NCBI
|
|
2
|
Chen W, Zheng R, Baade PD, Zhang S, Zeng
H, Bray F, Jemal A, Yu XQ and He J: Cancer statistics in China,
2015. CA Cancer J Clin. 66:115–132. 2016. View Article : Google Scholar : PubMed/NCBI
|
|
3
|
Haugen BR, Alexander EK, Bible KC, Doherty
GM, Mandel SJ, Nikiforov YE, Pacini F, Randolph GW, Sawka AM,
Schlumberger M, et al: 2015 American thyroid association management
guidelines for adult patients with thyroid nodules and
differentiated thyroid cancer: The american thyroid association
guidelines task force on thyroid nodules and differentiated thyroid
cancer. Thyroid. 26:1–133. 2016. View Article : Google Scholar : PubMed/NCBI
|
|
4
|
Siegel RL, Miller KD and Jemal A: Cancer
Statistics, 2017. CA Cancer J Clin. 67:7–30. 2017. View Article : Google Scholar : PubMed/NCBI
|
|
5
|
Bisarro Dos, Reis M, Barros-Filho MC,
Marchi FA, Beltrami CM, Kuasne H, Pinto CAL, Ambatipudi S, Herceg
Z, Kowalski LP and Rogatto SR: Prognostic classifier based on
genome-wide DNA methylation profiling in well-differentiated
thyroid tumors. J Clin Endocrinol Metab. 102:4089–4099. 2017.
View Article : Google Scholar : PubMed/NCBI
|
|
6
|
Fontaine JF, Mirebeau-Prunier D, Franc B,
Triau S, Rodien P, Houlgatte R, Malthièry Y and Savagner F:
Microarray analysis refines classification of non-medullary thyroid
tumours of uncertain malignancy. Oncogene. 27:2228–2236. 2008.
View Article : Google Scholar : PubMed/NCBI
|
|
7
|
Luzón-Toro B, Bleda M, Navarro E,
Garcia-Alonso L, Ruiz-Ferrer M, Medina I, Martín-Sánchez M,
Gonzalez CY, Fernández RM, Torroglosa A, et al: Identification of
epistatic interactions through genome-wide association studies in
sporadic medullary and juvenile papillary thyroid carcinomas. BMC
Med Genomics. 8:832015. View Article : Google Scholar : PubMed/NCBI
|
|
8
|
Handkiewicz-Junak D, Swierniak M, Rusinek
D, Oczko-Wojciechowska M, Dom G, Maenhaut C, Unger K, Detours V,
Bogdanova T, Thomas G, et al: Gene signature of the post-Chernobyl
papillary thyroid cancer. Eur J Nucl Med Mol Imaging. 43:1267–1277.
2016. View Article : Google Scholar : PubMed/NCBI
|
|
9
|
Tomás G, Tarabichi M, Gacquer D, Hébrant
A, Dom G, Dumont JE, Keutgen X, Fahey TJ III, Maenhaut C and
Detours V: A general method to derive robust organ-specific gene
expression-based differentiation indices: Application to thyroid
cancer diagnostic. Oncogene. 31:4490–4498. 2012. View Article : Google Scholar : PubMed/NCBI
|
|
10
|
Espinal-Enríquez J, Muñoz-Montero S,
Imaz-Rosshandler I, Huerta-Verde A, Mejía C and Hernández-Lemus E:
Genome-wide expression analysis suggests a crucial role of
dysregulation of matrix metalloproteinases pathway in
undifferentiated thyroid carcinoma. BMC Genomics. 16:2072015.
View Article : Google Scholar : PubMed/NCBI
|
|
11
|
Zhao M, Wang KJ, Tan Z, Zheng CM, Liang Z
and Zhao JQ: Identification of potential therapeutic targets for
papillary thyroid carcinoma by bioinformatics analysis. Oncol Lett.
11:51–58. 2016. View Article : Google Scholar : PubMed/NCBI
|
|
12
|
Guo Y, Bao Y, Ma M and Yang W:
Identification of key candidate genes and pathways in colorectal
cancer by integrated bioinformatical analysis. Int J Mol Sci.
18:E7222017. View Article : Google Scholar : PubMed/NCBI
|
|
13
|
Zhang C, Peng L, Zhang Y, Liu Z, Li W,
Chen S and Li G: The identification of key genes and pathways in
hepatocellular carcinoma by bioinformatics analysis of
high-throughput data. Med Oncol. 34:1012017. View Article : Google Scholar : PubMed/NCBI
|
|
14
|
Qiu WH, Chen GY, Cui L, Zhang TM, Wei F
and Yang Y: Identification of differential pathways in papillary
thyroid carcinoma utilizing pathway co-expression analysis. J BUON.
21:1501–1509. 2016.PubMed/NCBI
|
|
15
|
Qu T, Li YP, Li XH and Chen Y:
Identification of potential biomarkers and drugs for papillary
thyroid cancer based on gene expression profile analysis. Mol Med
Rep. 14:5041–5048. 2016. View Article : Google Scholar : PubMed/NCBI
|
|
16
|
Huang Y, Tao Y, Li X, Chang S, Jiang B, Li
F and Wang ZM: Bioinformatics analysis of key genes and latent
pathway interactions based on the anaplastic thyroid carcinoma gene
expression profile. Oncol Lett. 13:167–176. 2017. View Article : Google Scholar : PubMed/NCBI
|
|
17
|
Qiu J, Zhang W, Xia Q, Liu F, Li L, Zhao
S, Gao X, Zang C, Ge R and Sun Y: RNA sequencing identifies crucial
genes in papillary thyroid carcinoma (PTC) progression. Exp Mol
Pathol. 100:151–159. 2016. View Article : Google Scholar : PubMed/NCBI
|
|
18
|
Min XS, Huang P, Liu X, Dong C, Jiang XL,
Yuan ZT, Mao LF and Chang S: Bioinformatics analyses of significant
prognostic risk markers for thyroid papillary carcinoma. Tumour
Biol. 36:7457–7463. 2015. View Article : Google Scholar : PubMed/NCBI
|
|
19
|
Chen W, Liu Q, Lv Y, Xu D, Chen W and Yu
J: Special role of JUN in papillary thyroid carcinoma based on
bioinformatics analysis. World J Surg Oncol. 15:1192017. View Article : Google Scholar : PubMed/NCBI
|
|
20
|
Cancer Genome Atlas Research Network, .
Integrated genomic characterization of papillary thyroid carcinoma.
Cell. 159:676–690. 2014. View Article : Google Scholar : PubMed/NCBI
|
|
21
|
Yu J, Mai W, Cui Y and Kong L: Key genes
and pathways predicted in papillary thyroid carcinoma based on
bioinformatics analysis. J Endocrinol Invest. 39:1285–1293. 2016.
View Article : Google Scholar : PubMed/NCBI
|
|
22
|
Vasko V, Espinosa AV, Scouten W, He H,
Auer H, Liyanarachchi S, Larin A, Savchenko V, Francis GL, de la
Chapelle A, et al: Gene expression and functional evidence of
epithelial-to-mesenchymal transition in papillary thyroid carcinoma
invasion. Proc Natl Acad Sci USA. 104:pp. 2803–2808. 2007;
View Article : Google Scholar : PubMed/NCBI
|
|
23
|
Hilmarsdóttir B, Briem E, Sigurdsson V,
Franzdóttir SR, Ringnér M, Arason AJ, Bergthorsson JT, Magnusson MK
and Gudjonsson T: MicroRNA-200c-141 and ΔNp63 are required for
breast epithelial differentiation and branching morphogenesis. Dev
Biol. 403:150–161. 2015. View Article : Google Scholar : PubMed/NCBI
|
|
24
|
Barrett T, Wilhite SE, Ledoux P,
Evangelista C, Kim IF, Tomashevsky M, Marshall KA, Phillippy KH,
Sherman PM, Holko M, et al: NCBI GEO: Archive for functional
genomics data sets-update. Nucleic Acids Res. 41:D991–D995. 2013.
View Article : Google Scholar : PubMed/NCBI
|
|
25
|
Ritchie ME, Phipson B, Wu D, Hu Y, Law CW,
Shi W and Smyth GK: Limma powers differential expression analyses
for RNA-sequencing and microarray studies. Nucleic Acids Res.
43:e472015. View Article : Google Scholar : PubMed/NCBI
|
|
26
|
Yu G, Wang LG, Han Y and He QY:
ClusterProfiler: An R package for comparing biological themes among
gene clusters. OMICS. 16:284–287. 2012. View Article : Google Scholar : PubMed/NCBI
|
|
27
|
Mi H, Huang X, Muruganujan A, Tang H,
Mills C, Kang D and Thomas PD: PANTHER version 11: Expanded
annotation data from Gene Ontology and Reactome pathways, and data
analysis tool enhancements. Nucleic Acids Res. 45:D183–D189. 2017.
View Article : Google Scholar : PubMed/NCBI
|
|
28
|
Szklarczyk D, Morris JH, Cook H, Kuhn M,
Wyder S, Simonovic M, Santos A, Doncheva NT, Roth A, Bork P, et al:
The STRING database in 2017: Quality-controlled protein-protein
association networks, made broadly accessible. Nucleic Acids Res.
45:D362–D368. 2017. View Article : Google Scholar : PubMed/NCBI
|
|
29
|
Gautier L, Cope L, Bolstad BM and Irizarry
RA: Affy-analysis of Affymetrix GeneChip data at the probe level.
Bioinformatics. 20:307–315. 2004. View Article : Google Scholar : PubMed/NCBI
|
|
30
|
Szklarczyk D, Franceschini A, Wyder S,
Forslund K, Heller D, Huerta-Cepas J, Simonovic M, Roth A, Santos
A, Tsafou KP, et al: STRING v10: Protein-protein interaction
networks, integrated over the tree of life. Nucleic Acids Res.
43:D447–D452. 2015. View Article : Google Scholar : PubMed/NCBI
|
|
31
|
Shannon P, Markiel A, Ozier O, Baliga NS,
Wang JT, Ramage D, Amin N, Schwikowski B and Ideker T: Cytoscape: A
software environment for integrated models of biomolecular
interaction networks. Genome Res. 13:2498–2504. 2003. View Article : Google Scholar : PubMed/NCBI
|
|
32
|
Deng Q, Li KY, Chen H, Dai JH, Zhai YY,
Wang Q, Li N, Wang YP and Han ZG: RNA interference against
cancer/testis genes identifies dual specificity phosphatase 21 as a
potential therapeutic target in human hepatocellular carcinoma.
Hepatology. 59:518–530. 2014. View Article : Google Scholar : PubMed/NCBI
|
|
33
|
Wang K, Niu Y, Wang Q, Liu H, Jin Y and
Zhang S: Cloning and evaluation of reference genes for quantitative
real-time PCR analysis in amorphophallus. Peer J. 5:e32602017.
View Article : Google Scholar : PubMed/NCBI
|
|
34
|
Livak KJ and Schmittgen TD: Analysis of
relative gene expression data using real-time quantitative PCR and
the 2(-Delta Delta C(T)) method. Methods. 25:402–408. 2001.
View Article : Google Scholar : PubMed/NCBI
|
|
35
|
Lefever S, Hellemans J, Pattyn F,
Przybylski DR, Taylor C, Geurts R, Untergasser A and Vandesompele
J; RDML RDML consortium, : Structured language and reporting
guidelines for real-time quantitative PCR data. Nucleic Acids Res.
37:2065–2069. 2009. View Article : Google Scholar : PubMed/NCBI
|
|
36
|
Lu P, Weaver VM and Werb Z: The
extracellular matrix: A dynamic niche in cancer progression. J Cell
Biol. 196:395–406. 2012. View Article : Google Scholar : PubMed/NCBI
|
|
37
|
Jolly LA, Novitskiy S, Owens P, Massoll N,
Cheng N, Fang W, Moses HL and Franco AT: Fibroblast-mediated
collagen remodeling within the tumor microenvironment facilitates
progression of thyroid cancers driven by brafv600e and pten loss.
Cancer Res. 76:1804–1813. 2016. View Article : Google Scholar : PubMed/NCBI
|
|
38
|
Saka E, Harrison BJ, West K, Petruska JC
and Rouchka EC: Framework for reanalysis of publicly available
affymetrix(R) genechip(R) data sets based on functional regions of
interest. BMC Genomics. 18 Suppl 10:S8752017. View Article : Google Scholar
|
|
39
|
Miyake M, Hori S, Morizawa Y, Tatsumi Y,
Toritsuka M, Ohnishi S, Shimada K, Furuya H, Khadka VS, Deng Y, et
al: Collagen type IV alpha 1 (COL4A1) and collagen type XIII alpha
1 (COL13A1) produced in cancer cells promote tumor budding at the
invasion front in human urothelial carcinoma of the bladder.
Oncotarget. 8:36099–36114. 2017. View Article : Google Scholar : PubMed/NCBI
|
|
40
|
Sercu S, Zhang L and Merregaert J: The
extracellular matrix protein 1: Its molecular interaction and
implication in tumor progression. Cancer Invest. 26:375–384. 2008.
View Article : Google Scholar : PubMed/NCBI
|
|
41
|
Kebebew E, Peng M, Reiff E, Duh QY, Clark
OH and McMillan A: ECM1 and TMPRSS4 are diagnostic markers of
malignant thyroid neoplasms and improve the accuracy of fine needle
aspiration biopsy. Ann Surg. 242:353–361; discussion 361–353.
2005.PubMed/NCBI
|
|
42
|
Waalkes S, Atschekzei F, Kramer MW,
Hennenlotter J, Vetter G, Becker JU, Stenzl A, Merseburger AS,
Schrader AJ, Kuczyk MA and Serth J: Fibronectin 1 mRNA expression
correlates with advanced disease in renal cancer. BMC Cancer.
10:5032010. View Article : Google Scholar : PubMed/NCBI
|
|
43
|
Sponziello M, Rosignolo F, Celano M,
Maggisano V, Pecce V, De Rose RF, Lombardo GE, Durante C, Filetti
S, Damante G, et al: Fibronectin-1 expression is increased in
aggressive thyroid cancer and favors the migration and invasion of
cancer cells. Mol Cell Endocrinol. 431:123–132. 2016. View Article : Google Scholar : PubMed/NCBI
|
|
44
|
Xia S, Wang C, Postma EL, Yang Y, Ni X and
Zhan W: Fibronectin 1 promotes migration and invasion of papillary
thyroid cancer and predicts papillary thyroid cancer lymph node
metastasis. OncoTargets Ther. 10:1743–1755. 2017. View Article : Google Scholar
|
|
45
|
Vierlinger K, Mansfeld MH, Koperek O,
Nohammer C, Kaserer K and Leisch F: Identification of SERPINA1 as
single marker for papillary thyroid carcinoma through microarray
meta analysis and quantification of its discriminatory power in
independent validation. BMC Med Genomics. 4:302011. View Article : Google Scholar : PubMed/NCBI
|
|
46
|
Porter JF, Shen S and Denhardt DT: Tissue
inhibitor of metalloproteinase-1 stimulates proliferation of human
cancer cells by inhibiting a metalloproteinase. Br J Cancer.
90:463–470. 2004. View Article : Google Scholar : PubMed/NCBI
|
|
47
|
Fagerberg L, Hallstrom BM, Oksvold P,
Kampf C, Djureinovic D, Odeberg J, Habuka M, Tahmasebpoor S,
Danielsson A, Edlund K, et al: Analysis of the human
tissue-specific expression by genome-wide integration of
transcriptomics and antibody-based proteomics. Mol Cell Proteomics.
13:397–406. 2014. View Article : Google Scholar : PubMed/NCBI
|
|
48
|
Stanchina L, Baral V, Robert F, Pingault
V, Lemort N, Pachnis V, Goossens M and Bondurand N: Interactions
between Sox10, Edn3 and Ednrb during enteric nervous system and
melanocyte development. Dev Biol. 295:232–249. 2006. View Article : Google Scholar : PubMed/NCBI
|
|
49
|
Wiesmann F, Veeck J, Galm O, Hartmann A,
Esteller M, Knuchel R and Dahl E: Frequent loss of endothelin-3
(EDN3) expression due to epigenetic inactivation in human breast
cancer. Breast Cancer Res. 11:R342009. View Article : Google Scholar : PubMed/NCBI
|
|
50
|
Nash KT and Welch DR: The KISS1 metastasis
suppressor: Mechanistic insights and clinical utility. Front
Biosci. 11:647–659. 2006. View
Article : Google Scholar : PubMed/NCBI
|
|
51
|
Ringel MD, Hardy E, Bernet VJ, Burch HB,
Schuppert F, Burman KD and Saji M: Metastin receptor is
overexpressed in papillary thyroid cancer and activates MAP kinase
in thyroid cancer cells. J Clin Endocrinol Metab. 87:23992002.
View Article : Google Scholar : PubMed/NCBI
|
|
52
|
Savvidis C, Papaoiconomou E, Petraki C,
Msaouel P and Koutsilieris M: The role of KISS1/KISS1R system in
tumor growth and invasion of differentiated thyroid cancer.
Anticancer Res. 35:819–826. 2015.PubMed/NCBI
|
|
53
|
Dong Y, Hirane M, Araki M, Fukushima N,
Honoki K and Tsujiuchi T: Lysophosphatidic acid receptor-5
negatively regulates cell motile and invasive activities of human
sarcoma cell lines. Mol Cell Biochem. 393:17–22. 2014. View Article : Google Scholar : PubMed/NCBI
|
|
54
|
Takahashi K, Furukawa C, Takano A,
Ishikawa N, Kato T, Hayama S, Suzuki C, Yasui W, Inai K, Sone S, et
al: The neuromedin U-growth hormone secretagogue receptor
1b/neurotensin receptor 1 oncogenic signaling pathway as a
therapeutic target for lung cancer. Cancer Res. 66:9408–9419. 2006.
View Article : Google Scholar : PubMed/NCBI
|
|
55
|
Ketterer K, Kong B, Frank D, Giese NA,
Bauer A, Hoheisel J, Korc M, Kleeff J, Michalski CW and Friess H:
Neuromedin U is overexpressed in pancreatic cancer and increases
invasiveness via the hepatocyte growth factor c-Met pathway. Cancer
Lett. 277:72–81. 2009. View Article : Google Scholar : PubMed/NCBI
|
|
56
|
Harten SK, Esteban MA, Shukla D, Ashcroft
M and Maxwell PH: Inactivation of the von hippel-lindau tumour
suppressor gene induces neuromedin U expression in renal cancer
cells. Mol Cancer. 10:892011. View Article : Google Scholar : PubMed/NCBI
|
|
57
|
Wang L, Chen C, Li F, Hua QQ, Chen S, Xiao
B, Dai M, Li M, Zheng A, Yu D, et al: Overexpression of neuromedin
U is correlated with regional metastasis of head and neck squamous
cell carcinoma. Mol Med Rep. 14:1075–1082. 2016. View Article : Google Scholar : PubMed/NCBI
|
|
58
|
Lee SC, Fujiwara Y, Liu J, Yue J, Shimizu
Y, Norman DD, Wang Y, Tsukahara R, Szabo E, Patil R, et al:
Autotaxin and LPA1 and LPA5 receptors exert disparate functions in
tumor cells versus the host tissue microenvironment in melanoma
invasion and metastasis. Mol Cancer Res. 13:174–185. 2015.
View Article : Google Scholar : PubMed/NCBI
|
|
59
|
Yap LF, Velapasamy S, Lee HM, Thavaraj S,
Rajadurai P, Wei W, Vrzalikova K, Ibrahim MH, Khoo AS, Tsao SW, et
al: Down-regulation of LPA receptor 5 contributes to aberrant LPA
signalling in EBV-associated nasopharyngeal carcinoma. J Pathol.
235:456–465. 2015. View Article : Google Scholar : PubMed/NCBI
|
|
60
|
Tsujiuchi T, Araki M, Hirane M, Dong Y and
Fukushima N: Lysophosphatidic acid receptors in cancer
pathobiology. Histol Histopathol. 29:313–321. 2014.PubMed/NCBI
|
|
61
|
Mills GB and Moolenaar WH: The emerging
role of lysophosphatidic acid in cancer. Nat Rev Cancer. 3:582–591.
2003. View Article : Google Scholar : PubMed/NCBI
|
|
62
|
Uhlen M, Zhang C, Lee S, Sjöstedt E,
Fagerberg L, Bidkhori G, Benfeitas R, Arif M, Liu Z, Edfors F, et
al: A pathology atlas of the human cancer transcriptome. Science.
357:eaan25072017. View Article : Google Scholar : PubMed/NCBI
|
|
63
|
Uhlen M, Oksvold P, Fagerberg L, Lundberg
E, Jonasson K, Forsberg M, Zwahlen M, Kampf C, Wester K, Hober S,
et al: Towards a knowledge-based human protein atlas. Nat
Biotechnol. 28:1248–1250. 2010. View Article : Google Scholar : PubMed/NCBI
|