Introduction
T-cell lymphoma (TCL) originates from T-cells or
natural killer (NK) cells at various developmental stages,
accounting for 10–15% of cases of non-Hodgkin's lymphoma (1). In China, mature T/NK-cell neoplasms
account for 23.3% of lymphoid neoplasms (2), a relatively higher proportion than in
Western countries (3). TCL consists
of a group of diseases with high heterogeneity, with more than
twenty subtypes of T-cell neoplasms with a particularly aggressive
course, based on the World Health Organization (WHO) classification
(4). Compared with malignancies
derived from B cells, TCL is more resistant to conventional
treatments, which are based on the mechanism of interfering with
the cell cycle and proliferation, including CHOP and ESHAP
(5), leading to the unfavorable
prognoses of patients. Therefore, it is necessary to investigate
the biochemical metabolism characteristics and mechanisms of
malignant T cells, in order to identify novel therapeutic targets
for patients with aggressive disease.
Glucose is the major energy source used to maintain
cell proliferation and homeostasis. In cancer, glucose metabolism
serves an even more important role than in normal tissue, due to
the faster cell proliferation and greater calorific demand of
malignant cells (6). Glucose
metabolism is not only involved in the proliferation and apoptosis
of tumor cells, but also affects tumor response to chemotherapy.
Genetic deletion of glucose transporters (Gluts) in B-cell acute
lymphoblastic leukemia cells leads to reduced glucose uptake,
decreased cell proliferation and increased apoptosis (7). In T-cell acute lymphoblastic leukemia,
2-deoxyglucose, an inhibitor of glycolysis accelerates
glucocorticoid-induced tumor cell death, while a high concentration
of glucose suppresses the etoposide chemotherapy effect on B-cell
lymphoma through BCL-6 (8).
A number of cytokines and adipokines participate in
the glucose metabolism of tumor malignant cells. Leptin, the
product of the obese (ob) gene, is the most widely studied
adipokine (9). This secreted protein,
composed of 146 amino acids, exerts actions through its specific
receptor (leptin receptor, ObR), which is localized to the cell
membrane and is present in a variety of hematopoietic cells,
including hematopoietic progenitor cells, erythropoietic, myeloid
and lymphoblastic cells (10). Leptin
affects glucose metabolism at the central and peripheral levels in
healthy bodies. In the central nervous system, leptin regulates
glucose metabolism primarily through hypothalamic neurons,
including glucose-excited neurons and glucose-inhibited neurons
(11). At the peripheral level,
leptin directly affects β cells of pancreas and affects insulin
secretion (12).
A recent study has investigated the effects of
leptin on glucose metabolism in normal T cells and have achieved
inconsistent results; however, the role of leptin in malignant T
cells remains unreported (13,14). As
glucose metabolism is involved in the proliferation and apoptosis
of malignant cells and may affect the prognosis of the
malignancies, we hypothesized that leptin may promote the glucose
uptake of TCL cells. Therefore, the present study was performed in
order to verify this hypothesis, with the expectation of
identifying novel treatment strategies to improve the prognosis of
aggressive TCL. In order to investigate the effect of leptin on the
glucose metabolism of TCL cells, the present study analyzed the
expression of ObR and Gluts in TCL cells lines and tissues, and
observed the changes in the proliferation and glucose consumption
of TCL MOLT-3 cells following recombination human leptin (rhleptin)
intervention. The decreased expression of ObR was further detected
by small interfering RNA (siRNA) and the subsequent effect on
glucose consumption in vitro.
Materials and methods
Patient samples
Tissues from 36 patients with de novo diagnosed TCL
(mean age 58.5 years, range 21–82 years; male/female ratio was
23/13) and 18 with RLH were obtained between January 2008 and
January 2013 from the Department of Pathology at Tai'an City
Central Hospital (Tai'an, China). All cases were reclassified
according to WHO criteria (4). The
present study was conducted with the approval of the the ethical
committee of Tai'an central hospital (Tai'an, China) and written
informed consent was obtained from all participants, including the
patient from whom peripheral blood mononuclear cells (PBMCs) were
obtained.
Immunohistochemistry
The 10% formalin-fixed (at room temperature for 6 h)
paraffin-embedded tissue samples were sliced into 3-µm sections
which were deparaffinized and subsequently rehydrated in a
descending alcohol series. Antigens were heat-retrieved at 98°C in
EDTA solution. Following cooling to room temperature, the tissue
sections were quenched with 3% hydrogen peroxidase and non-specific
binding sites were blocked with 5% goat serum at 37°C for 30 min.
Subsequently, the sections were incubated with the following
primary antibodies: ObR (dilution, 1:100 cat. no., ab2139; Abcam,
Cambridge, UK), Glut1 (dilution, 1:100; cat. no. ab115730, Abcam)
and Glut4 (dilution, 1:50 cat. no. BA1626; Boster Biological
Technology., Co., Ltd., Beijing, China) at 4°C overnight. Following
washing in phosphate- buffered saline, slides were incubated with a
secondary antibody (SPlink Detection kits SP 9001 and SP 9002;
ZSJQ-BIO, Co., Ltd, Beijing, China) at room temperature for 1 h,
prior to being incubated with ABC reagent (SPlink Detection kits SP
9001 and SP 9002), according to the manufacturer's protocol. The
peroxidase activity was visualized using a Histofine
3,3′-diaminobenzidine substrate kit (OriGene Technologies, Inc.,
Beijing, China). The sections were counterstained at room
temperature for 3 min with hematoxylin, prior to being dehydrated
and mounted on slides. Immunohistochemistry assessment based on the
staining intensity and the proportion of positive tumor cells, ObR,
Glut1 and Glut4 expression levels were assessed by two expert
pathologists who were blinded to the clinical data. The staining
degree is evaluated according to the extent and intensity of the
staining under a laser scanning confocal microscope (magnification,
×400). Cell staining was scored as follows: No cell staining, 0;
<25% stained cells, 1; 25–50% stained cells, 2; and >50%
stained cells, 3. Intensity of staining was scored as follows:
Uncolored, 0; light brown, 1; brown, 2; and dark brown, 3. The
results of the two aforementioned scoring systems were subsequently
combined: ≤1 was defined as negative staining, 2–3 was defined as
weak positive staining and ≥4 was defined as positive staining.
Cell culture
The human TCL Jurkat, HUT-78 and MOLT-3 cell lines
were cultured in RPMI-1640 medium (Gibco; Thermo Fisher Scientific,
Inc., Waltham, MA, USA), supplemented with 10% fetal bovine serum
(FBS; Hyclone; GE Healthcare Life Sciences, Logan, UT, USA). All
cell lines were provided by Central Laboratory of Shangdong
Provincial Hospital. Cells were maintained in a humidified
atmosphere in 5% CO2 at 37°C, and the culture medium was
changed every 2–3 days. For leptin and low/high concentration of
glucose, cells were serum-starved for 24 h and were then treated
with leptin at 0, 10, 100 and 200 ng/ml, in triplicate at 37°C for
24, 48, 72 and 96 h.
Extraction of PBMCs
The PBMCs of a 32-year old healthy male donor were
extracted in our laboratory in October 2013. Fresh blood was mixed
with sterilized normal saline and lymphocyte separation medium
(cat. no. P8610, Solarbio Science and Technology Co., Ltd.,
Beijing, China) (1:1:1). The mixture was centrifuged at 670 × g for
20 min at room temperature. The film layer was resuspended in
saline (1:3), and centrifuged at 377 × g for 10 min at room
temperature. The supernatant was discarded, another 10 ml saline
was added and the mixture was centrifuged again at 377 × g for 10
min at room temperature. PBMCs were found in the resulting
pellet.
Reagents and antibodies
Recombinant human leptin was purchased from
PeproTech EC Ltd. (London, UK) and dissolved in sterile water,
according to the manufacturer's protocols. NanoFectin™
was purchased from Shanghai ExCell Biology, Inc. (Shanghai, China).
Mouse anti-ObR and rabbit anti-Glut1 monoclonal antibodies were
purchased from Abcam (Cambridge, UK). Mouse anti-Glut4 polyclonal
antibodies were purchased from BIOSS (Beijing China). The mouse
anti-β-actin polyclonal antibody was purchased from OriGene
Technologies, Inc.
Cell proliferation assay
Cell proliferation was measured by the Cell Counting
kit-8 (CCK-8) assay (EnoGene Biotech Co., Ltd., Nanjing, China). To
determine the effect of glucose concentration on cell
proliferation, MOLT-3 cells were seeded onto a 96-well plate
(5×10⁴ cells/100 µl/well), using RPMI-1640 medium with a
low (1,000 mg/l) or high (4,500 mg/l) glucose concentration. Next,
cells at the same density were exposed to 0, 10, 100 and 200 ng/ml
rhleptin at 37°C for 24, 48 and 72 h in a humidified atmosphere in
a 5% CO2 incubator. Replicates of 6 wells for each
dosage were analyzed for each experiment. The cells were
subsequently incubated with 10 µl CCK-8 for 4 h at 37°C. The
optical density (OD) was subsequently measured at 450 nm on a
scanning multi-well spectrophotometer. The cell viability rate was
calculated according to the following equation: Cell viability rate
(%)=(OD experiment-OD blank)/(OD control-OD blank) ×100.
Glucose uptake assay
MOLT-3 cells (2×10⁵ cells/1,000 µl/well)
were cultured with, 10, 100 and 200 ng/ml rhleptin at 37°C in a
24-well plate. Following treatment, the cell suspension in each
well was collected and centrifuged (8,000 × g for 5 min at room
temperature). The supernatant was then detected using a Glucose
(HK) assay kit (Sigma-Aldrich; Merck KGaA, Darmstadt, Germany),
according to the manufacturer's protocols. The detection was
performed using a spectrophotometer at 340 nm. The values were
calculated according to the standard curve and were then subtracted
from the base line to obtain values of glucose consumption from the
total amount of glucose in the medium (without cells).
Assay for membrane protein level of
ObR, Glut1 and Glut4
MOLT-3 cells were cultured without serum in a
24-well plate overnight and were subsequently incubated for
increasing time periods (0, 15, 30, 45 or 60 min) with 100 ng/ml
leptin at 37°C. Next, cells were collected and cell membrane
proteins were extracted using a Membrane Protein Extraction kit
(Beyotime Institute of Biotechnology, Haimen, China). The membrane
protein expression levels of ObR, Glut1 and Glut4 were detected
though western blot analysis.
Reverse transcription-quantitative
polymerase chain reaction (RT-qPCR)
Total RNA was extracted from Molt-3 cells after
culture for 48 h using TRIzol reagent (Invitrogen; Thermo Fisher
Scientific, Inc., Waltham MA, USA). Next, cDNA was synthesized with
1 µg total RNA using the Takara RT reagents (Takara Biotechnology
Co., Ltd., Dalian, China). Reverse transcription reactions were
conducted at 37°C for 15 min, then 85°C for 5 sec. Primers were
obtained from Takara Biotechnology Co., Ltd., the sequences of
which were as follows: ObR forward, 3′-CATTTTATCCCCATTGAGAAGTA-5′
and reverse, 3′-CTGAAAATTAAGTCCTTGTGCCCAG-5′; Glut1 forward,
3′-CTTTGTGGCCTTCTTTGAAGT-5′ and reverse, 3′-CCACACAGTTGCTCCACAT-5′;
Glut4 forward, 3′-CTTCCAACAGATAGGCTCCG-5′ and reverse,
3′-CCCCAATGTTGTACCCAAAC-5′; and β-actin forward,
3′-TGACGTGGACATCCGCAAAG-5′ and reverse, 3′-CTGGAAGGTGGACAGCGAGG-5′.
Amplification reactions were performed using SYBR Premix Ex Taq
(Takara Biotechnology Co., Ltd.) using the Roche LightCycler 480
qPCR system. Expression data were normalized to the geometric mean
of the housekeeping gene β-actin to control the variability in
expression levels. For data analysis, the 2−∆∆Cq method
was used. qPCR for each gene of each cDNA sample was assayed in
triplicate. ∆Cq=Cq (target gene)-Cq (β-actin gene); ∆∆Cq=∆Cq
(As2S2-treated cells)-∆Cq (untreated control) (15).
Western blot analysis
Membrane proteins were extracted by Membrane Protein
Extraction kit (cat. no., BB-3116-2, Bestbio, Co., Ltd, Shanghai,
China). Total protein was extracted from TCL cells using
radioimmunoprecipitation assay buffer and 1% PMSF (both Shanghai
Shenergy Biocolor Science & Technology Company, Shanghai,
China). The protein concentration of the samples was determined
using a bicinchoninic acid assay kit (Shanghai Shenergy Biocolor
Science & Technology Company). Equal amounts of cell extracts
(40 µg) were resolved on 8–10% SDS-PAGE, and transferred into PVDF
membranes. The membranes were blocked by 10% non-fat milk at room
temperature for 60 min. The following primary antbodieds were used:
Anti-ObR, 1:1,000 (cat. no. ab2139; Abcam, Cambridge, UK),
Anti-Glut1, 1:1,000 (cat. no. ab115730; Abcam), Anti-Glut4, 1:100
(cat. no. ba1626; Boster, Co., Ltd., Beijing, China) and anti-beta
actin, 1:1,000 (cat. no. bs0061R; Bosis Co., Ltd, Beijing, China),
at 4°C overnight. Goat-anti-mouse IgG horseradish peroxidase
(HRP)-conjugated secondary antibody (dilution, 1:5,000; cat. no.
ZDR-5307, ZSJQ-BIO, Beijing, China) and IgG HRP-conjugated
goat-anti-rabbit secondary antibody, (dilution, 1:5,000; cat. no.
ZDR-5306, ZSJQ-BIO Beijing, China) were incubated with the
membranes at room temperature for 60 min. The proteins detected
using a chemiluminescence detection kit (EMD Millipore, Billerica,
MA, USA). Western blotting results were analyzed using FluorChem R
and AlphaView SA software (version 3.4.0.0) (both from
ProteinSimple, San Jose, CA, USA).
RNAi experiment
Leptin receptor specific siRNA and scrambled control
siRNA were purchased from GeneChem, Inc. (Daejeon, Korea). The
sequence of siRNA: ObR-RNAi-a: 5′-Ccgg, stem gcCTATGAGCAAAGTAAATAT,
loop CTCGAG, stem ATATTTACTTTGCTCATAGGC, 3′-TTTTTg; ObR-RNAi-b:
5′aattcaaaaa, stem gcCTATGAGCAAAGTAAATAT, loop CTCGAG, stem
ATATTTACTTTGCTCATAGGC. The sequence of control siRNA:
TTCTCCGAACGTGTCACGT. MOLT-3 cells were plated in 60 mm culture dish
for 24 h prior to transfection. Complete culture medium (Gibco;
Thermo Fisher Scientific, Inc., Waltham, MA, USA), supplemented
with FBS, and Penicillin-Streptomycin Solution (cat. no. 15140-122;
Gibco; Thermo Fisher Scientific, Inc., Waltham, MA, USA) was
freshly added to each well 2 h before transfection. Next, the cells
were treated using ObR siRNA or scrambled control siRNA (1 µl;
dilution, 1:100), the ratio of Nanofectin transfection reagent
(ExCell Biology, Inc., Shanghai, China): DNA was 1:1. After 24 h,
the transfection efficiency was checked by western blot analysis
with ObR expression.
Statistical analysis
Statistical analysis was performed using StataCorp
LP 12.0 (College Station, TX, USA). All results are presented as
the mean ± standard deviation. Statistical analysis was performed
by one-way analysis of variance and Student-Newman-Keuls test.
Fisher's exact probability test was used to examine associations
between nominal variables. Other statistical analyses of data were
performed using the Student's t-test. P<0.05 was considered to
indicate a statistically significant difference.
Results
Immunohistochemical detection and
association between ObR and Gluts in patients with TCL
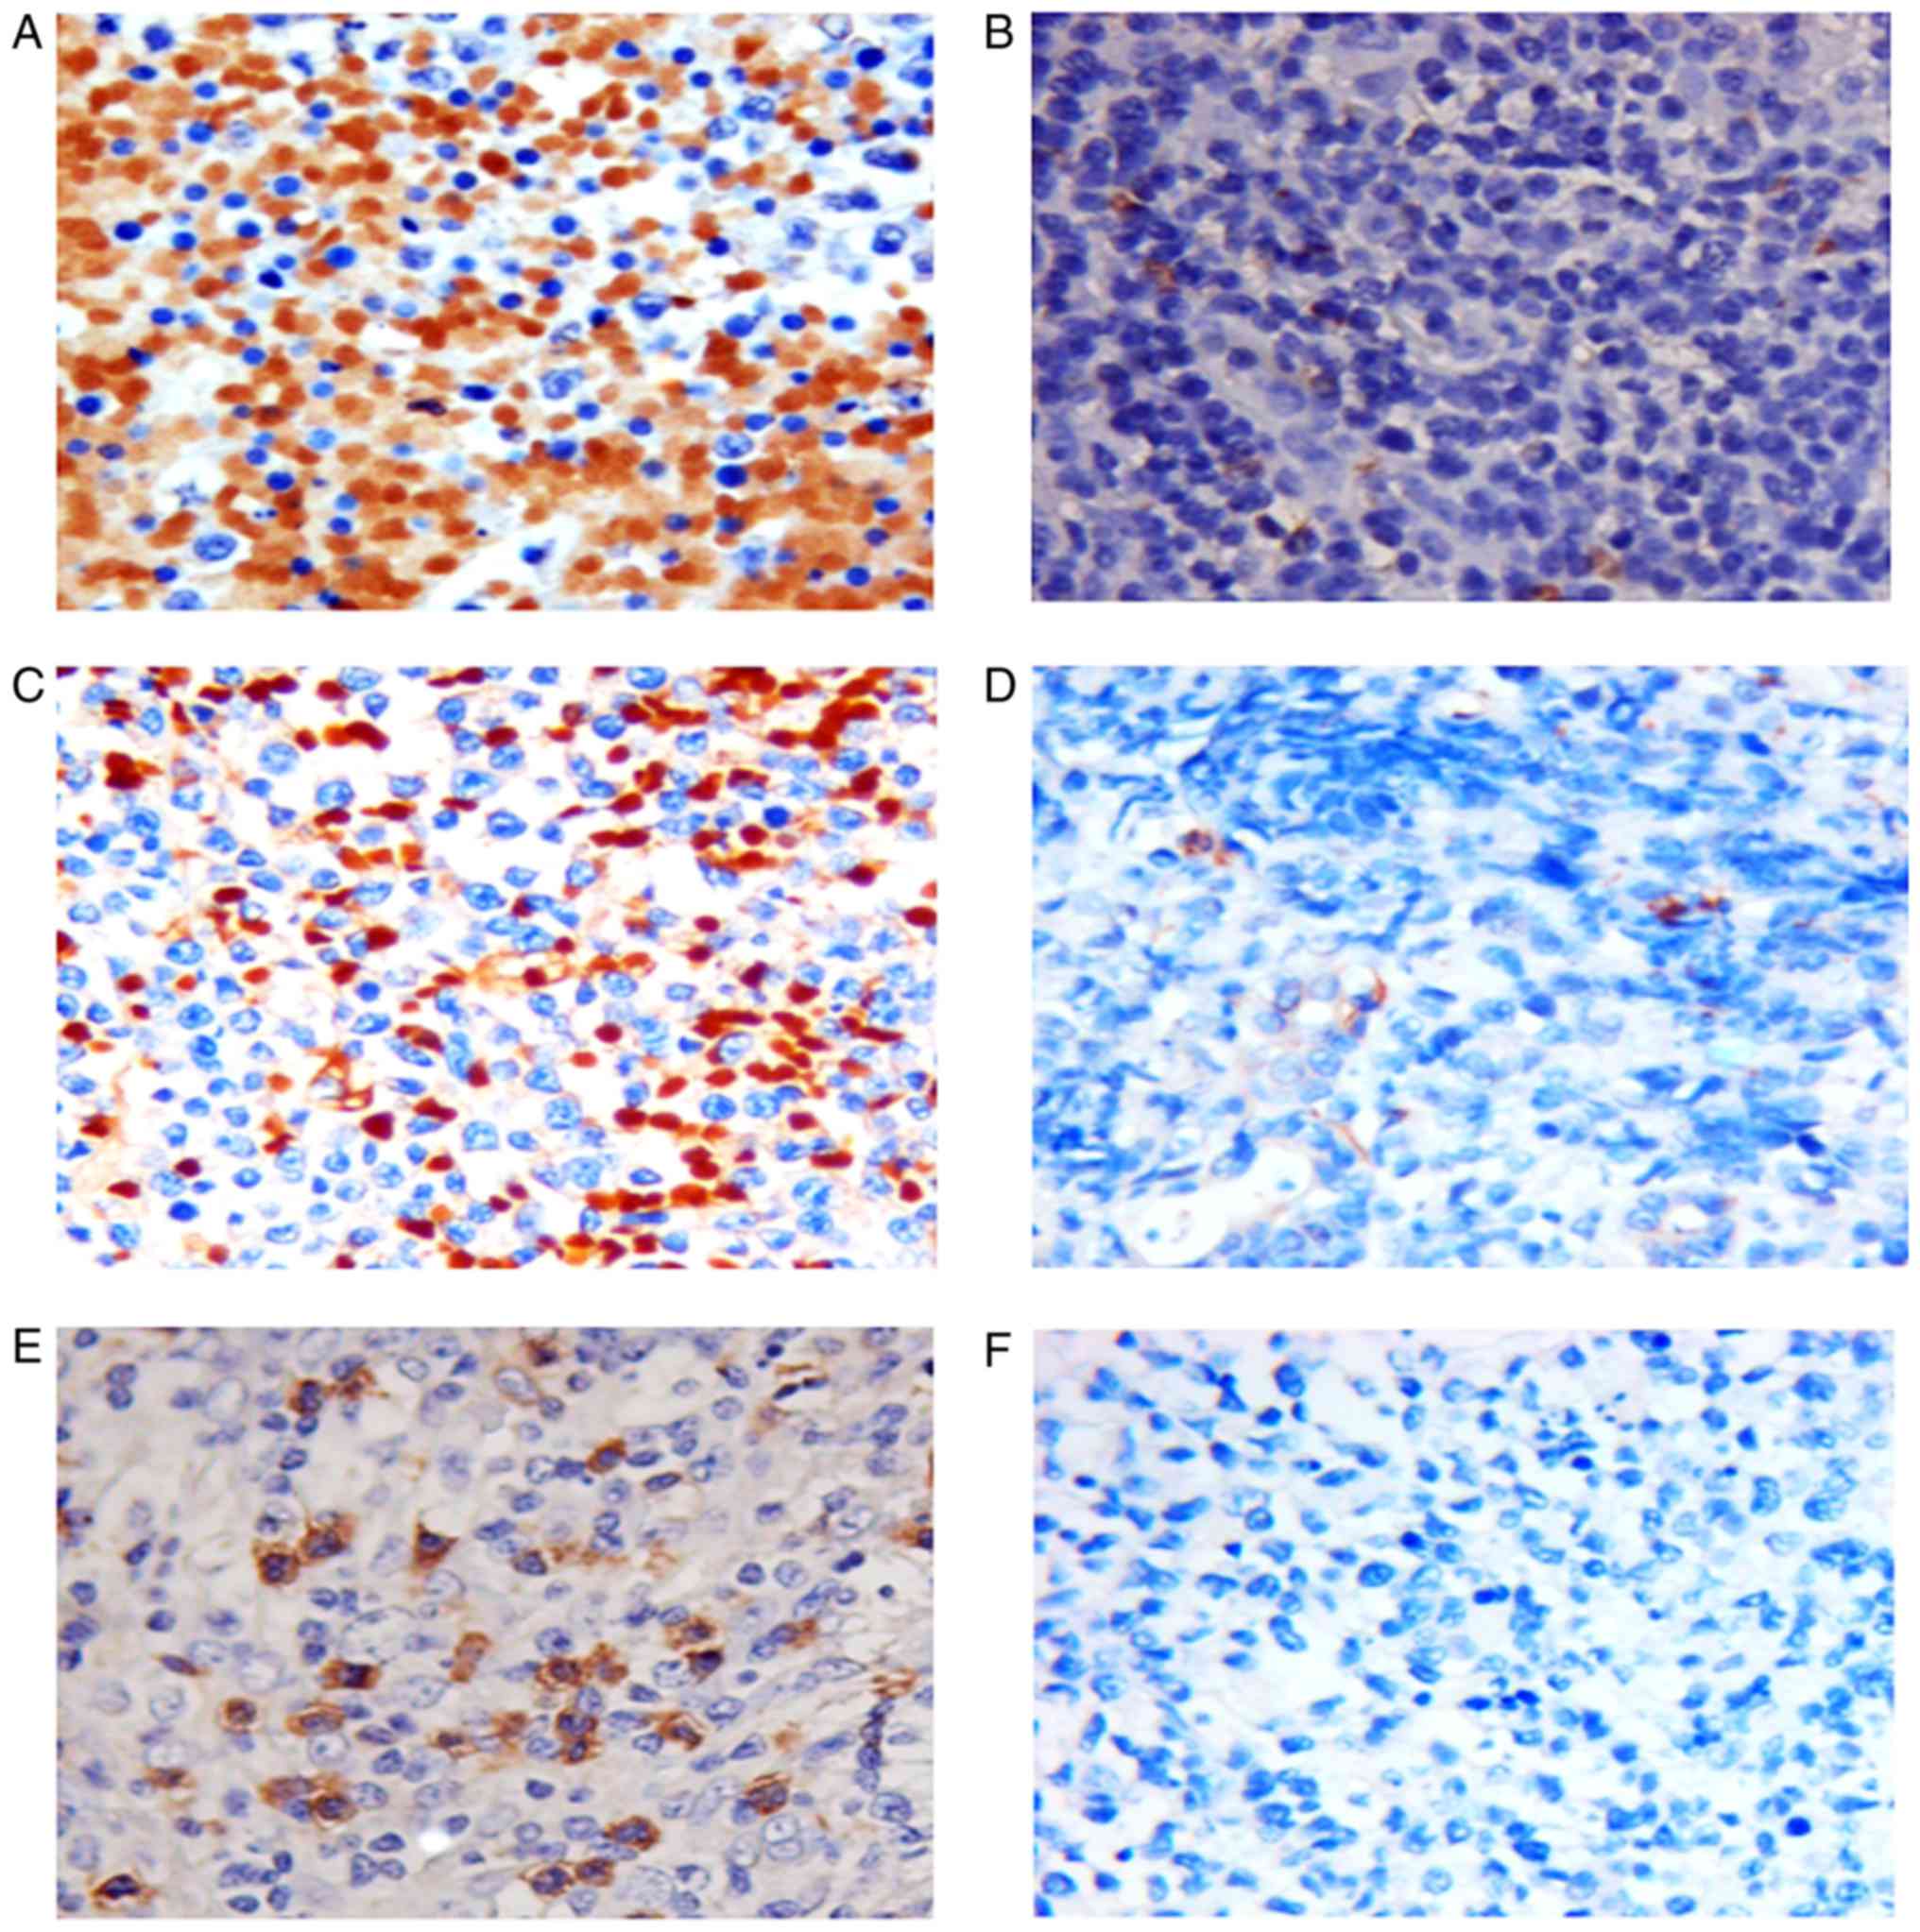
The incidence of ObR expression (Fig. 1) in TCL was 58.3% (21/36), and reduced
or absent expression was observed in 41.7% (15/36) of cases. ObR
expression was significantly associated with Glut1 (P=0.007), but
not with Glut4 (P=0.292). Furthermore, no significant associations
were observed between ObR overexpression and age, sex, performance
status, Ann Arbor stage (16),
lactate dehydrogenase (LDH) levels or B-symptoms (Table I). The expression of ObR was
significantly higher in the TCL tissues than in the RLH tissues
(P=0.012; Table II).
 | Table I.Association between clinical
characteristics or ObR expression and expression of Glut1 and Glut4
in patients with T-cell lymphoma. |
Table I.
Association between clinical
characteristics or ObR expression and expression of Glut1 and Glut4
in patients with T-cell lymphoma.
| No. patients | Total, n | Increased ObR
expression, n | Reduced ObR
expression, n | P-value |
|---|
| Age |
|
|
| 0.223 |
|
≤60 | 13 | 6 | 7 |
|
|
>60 | 23 | 15 | 8 |
|
| Sex |
|
|
| 0.087 |
|
Female | 13 | 10 | 3 |
|
|
Male | 23 | 11 | 12 |
|
| ECOG PS |
|
|
| 0.673 |
|
0–2 | 24 | 14 | 10 |
|
|
3–4 | 12 | 7 | 5 |
|
| Ann Arbor
Stage |
|
|
| 0.363 |
|
I–II | 24 | 13 | 11 |
|
|
III–IV | 12 | 8 | 4 |
|
| LDHa |
|
|
| 0.285 |
| Normal
(<250 U/l) | 16 | 8 | 8 |
|
| High
(>250 U/l) | 20 | 13 | 7 |
|
| B
symptomsb |
|
|
| 0.456 |
|
Yes | 20 | 11 | 9 |
|
| No | 16 | 10 | 6 |
|
| Glut1
expression |
|
|
| 0.007 |
|
High | 17 | 14 | 3 |
|
|
Low | 19 | 7 | 12 |
|
| Glut4 |
|
|
| 0.292 |
|
High | 5 | 4 | 1 |
|
|
Low | 31 | 17 | 14 |
|
| Table II.ObR expression in TCL and RLH
tissues. |
Table II.
ObR expression in TCL and RLH
tissues.
|
| Overexpression of
ObR | Reduced expression
of ObR | P-value |
|---|
| TCL | 21 | 15 | 0.012 |
| RLH | 4 | 14 |
|
Expression of ObR and Gluts in human
TCL cell lines
Expression of ObR, Glut1 and Glut4 was detected in
three TCL cell lines (Jurkat, MOLT-3 and HUT-78) and PBMCs from one
healthy donor using western blot analysis. As demonstrated in
Fig. 2, the protein expression levels
of the target proteins varied among the different cell lines.
Jurkat and MOLT-3 cells express ObR and Glut1 at higher levels than
normal mononuclear cells, while expression differences were not
significant between HUT-78 cells and normal control cells. In
addition, no significant differences in Glut4 expression between
the TCL cells and healthy control cells.
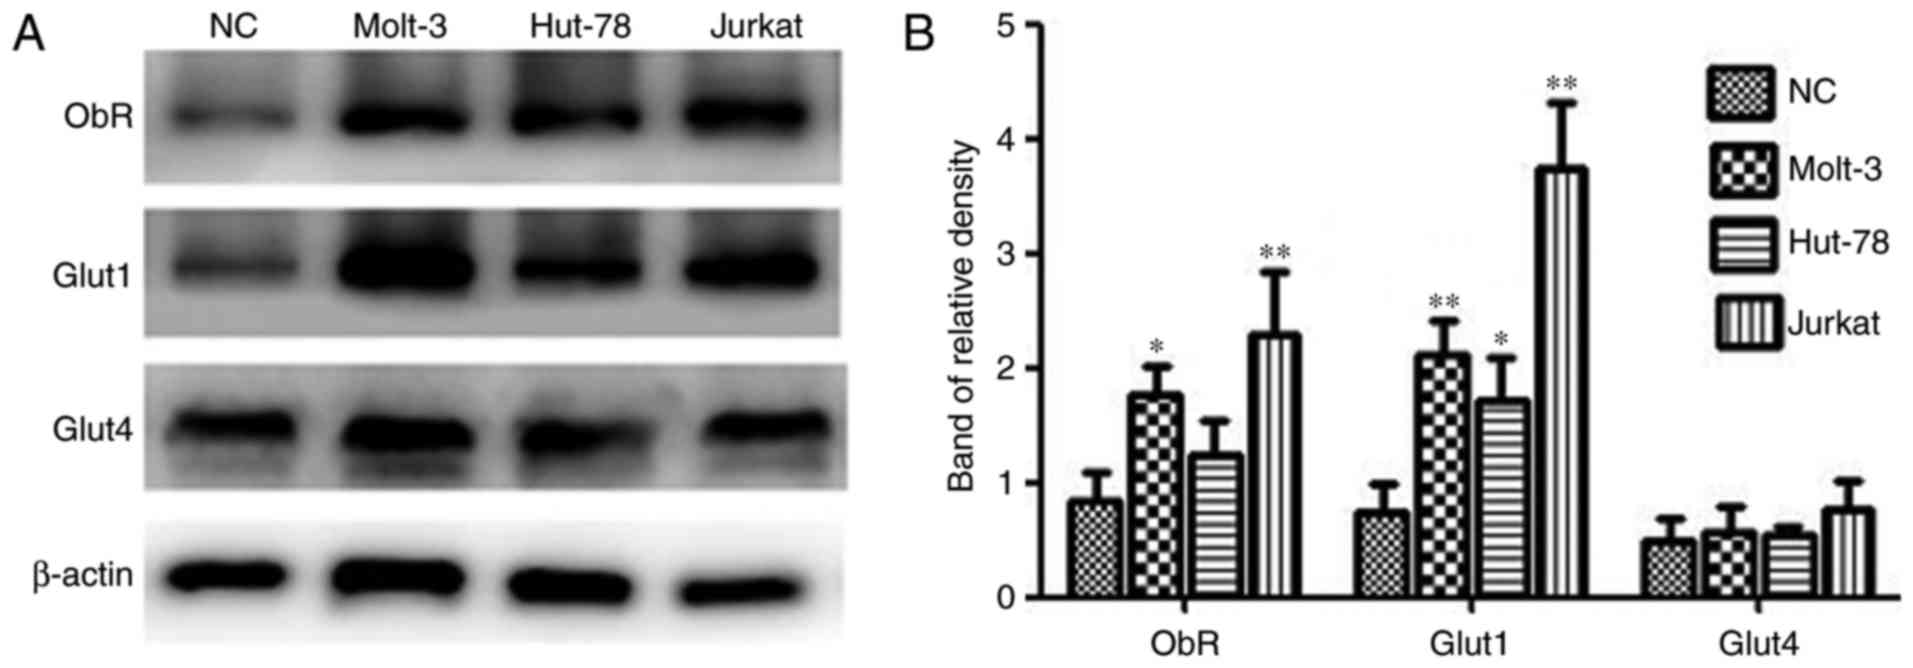 | Figure 2.ObR, Glut1 and Glut4 expression in TCL
cell lines and PBMCs. (A) Western blotting was used to analyze
total protein extracts for ObR, Glut1 and Glut4 expression in TCL
cell lines and PBMCs from a healthy donor. β-actin expression was
used as an internal control. (B) The relative densities of ObR,
Glut1 and Glut4 were calculated from 3 independent experiments.
*P<0.05, **P<0.01 compared with ObR, Glut1 and Glut4
expression in PBMCs. NC, normal cells; ObR, leptin receptor; Glut,
glucose transporter; TCL, T-cell lymphoma; PBMCs, peripheral blood
mononuclear cells. |
High glucose and leptin increases the
proliferation of MOLT-3 cells
The effects of glucose concentration and leptin on
the proliferation of MOLT-3 were determined using a CCK-8 assay.
MOLT-3 cells were initially serum-starved for 24 h and were then
stimulated with different doses of glucose (1,000 mg/l or 4,500
mg/l) and recombinant leptin (0, 10, 100 or 200 ng/ml) for 24, 48,
72 and 96 h. In the first and second 24 h intervals, no significant
difference in cell proliferation were identified between the two
glucose concentration groups. However, following co-culture for 72
h, the high concentration group exhibited a stronger capacity of
proliferation and the trend became even more apparent when cells
were treated with glucose for 96 h (Fig.
3A). During the process of co-culture with rhleptin, cell
proliferation was revealed to increase along with an increasing
concentration of rhleptin, particularly following continuous
stimulation for 72 h (Fig. 3B),
demonstrated that it was dose- and time-dependent.
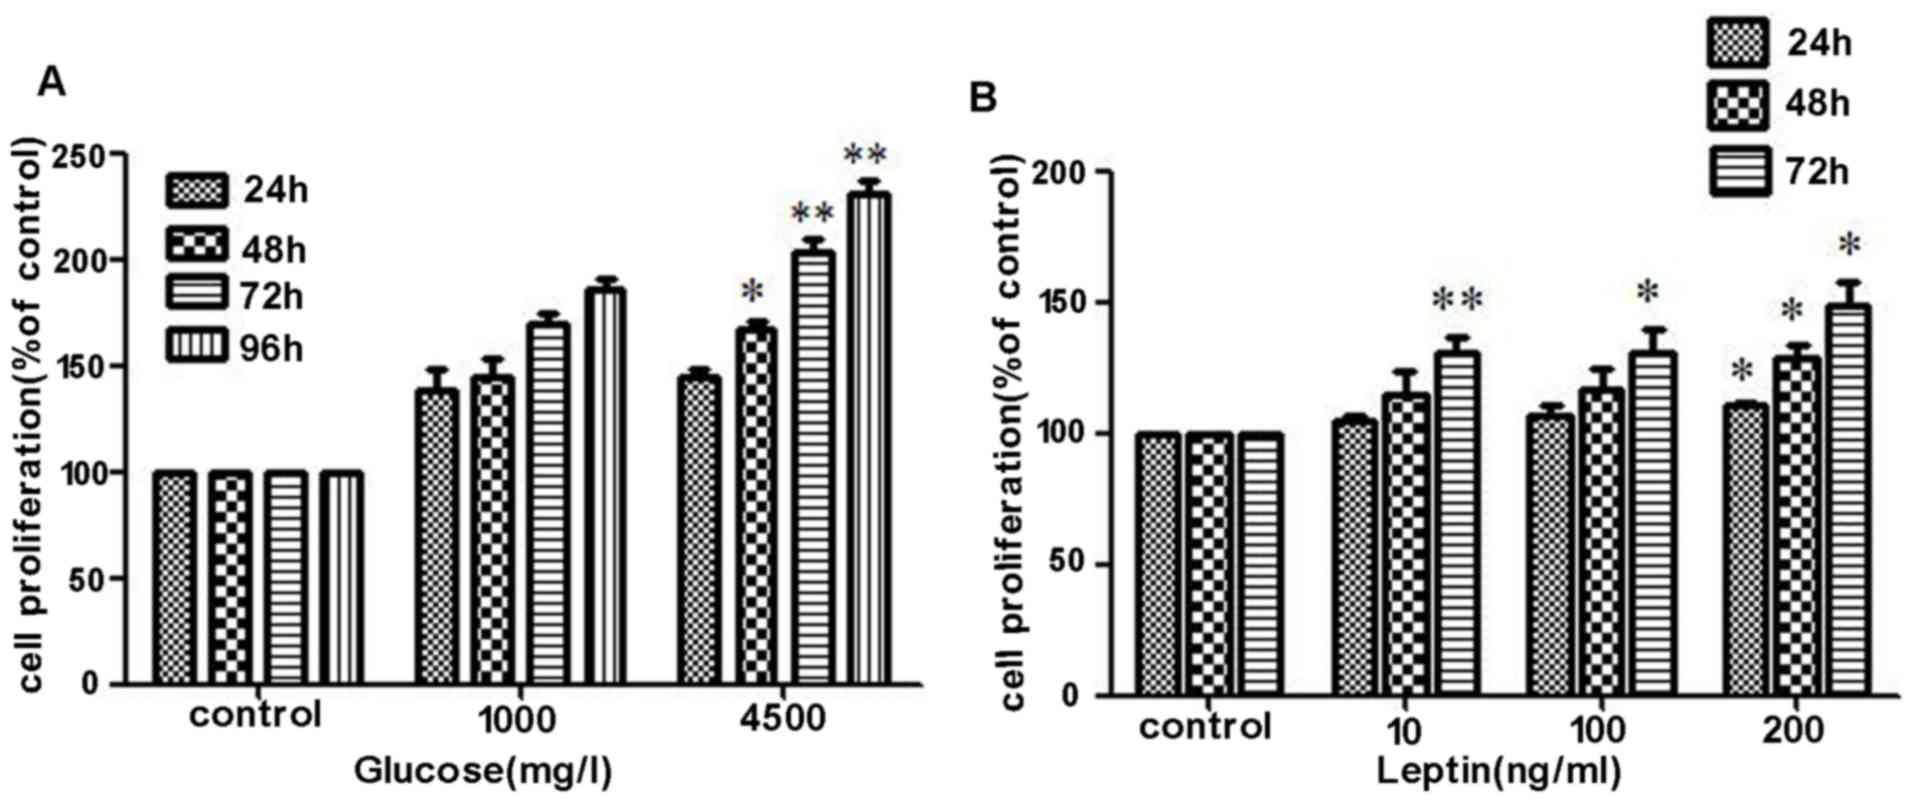 | Figure 3.Effects of high glucose and leptin on
the proliferation of MOLT-3 cells. (A) MOLT-3 cells were initially
serum-starved for 24 h and were then stimulated with different
doses of glucose (1,000 mg/l or 4,500 mg/l) and the cell
proliferation was determined using a Cell Counting kit-8 assay.
Compared with 1,000 mg/l glucose, 4,500 mg/l glucose promoted cell
proliferation more markedly. (B) Following treatment with
recombinant leptin (0, 10, 100 or 200 ng/ml) for different time
periods 24, 48 and 72 h, increased cell proliferation was revealed
to be time- and dose-dependent. *P<0.05, **P<0.01. OD,
optical density. |
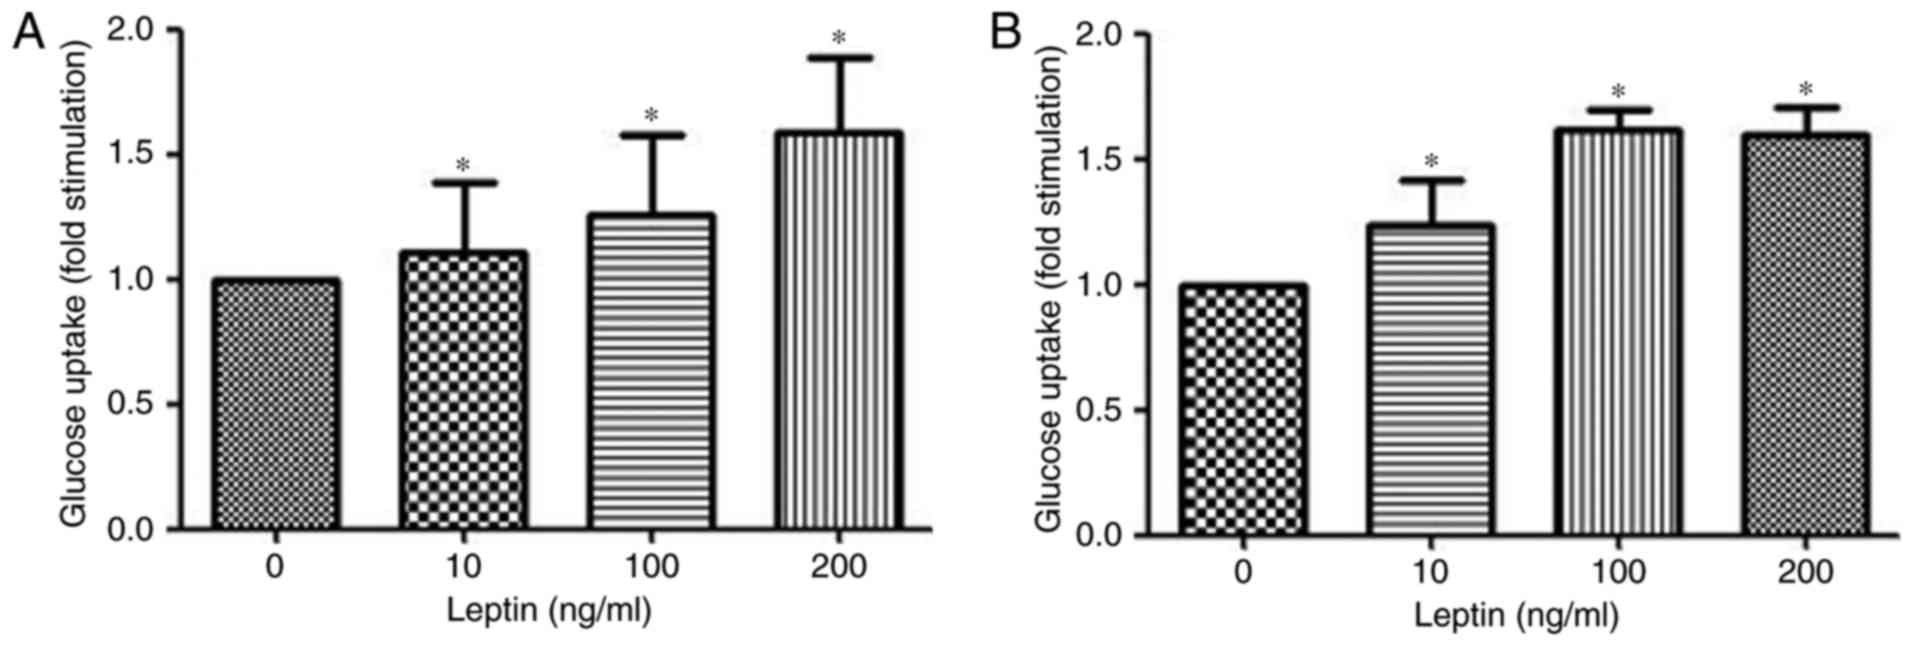
Leptin induces glucose uptake in
MOLT-3 cells
Glucose uptake from the cell culture medium was
measured using the Glucose (HK) assay kit. Stimulation of MOLT-3
cells treated with rhleptin induced a dose-dependent increase in
the uptake of glucose after 30 min of incubation (Fig. 4A). Additionally, after 48 h
stimulation with rhleptin, the maximal glucose uptake was observed
at a concentration of 100 ng/ml (Fig.
4B), which may be associated with the Glut expression and
transportation induced by leptin pathway.
Leptin induces recruitment of Glut1 to
the cell surface
Following short-term incubation with 100 ng/ml
rhleptin, the amount of Glut1 present changed over time. The effect
of leptin increased to its peak at 30 min and declined gradually
thereafter. While no significant changes in ObR or Glut4 were
detected under the same conditions (Fig.
5A and C).
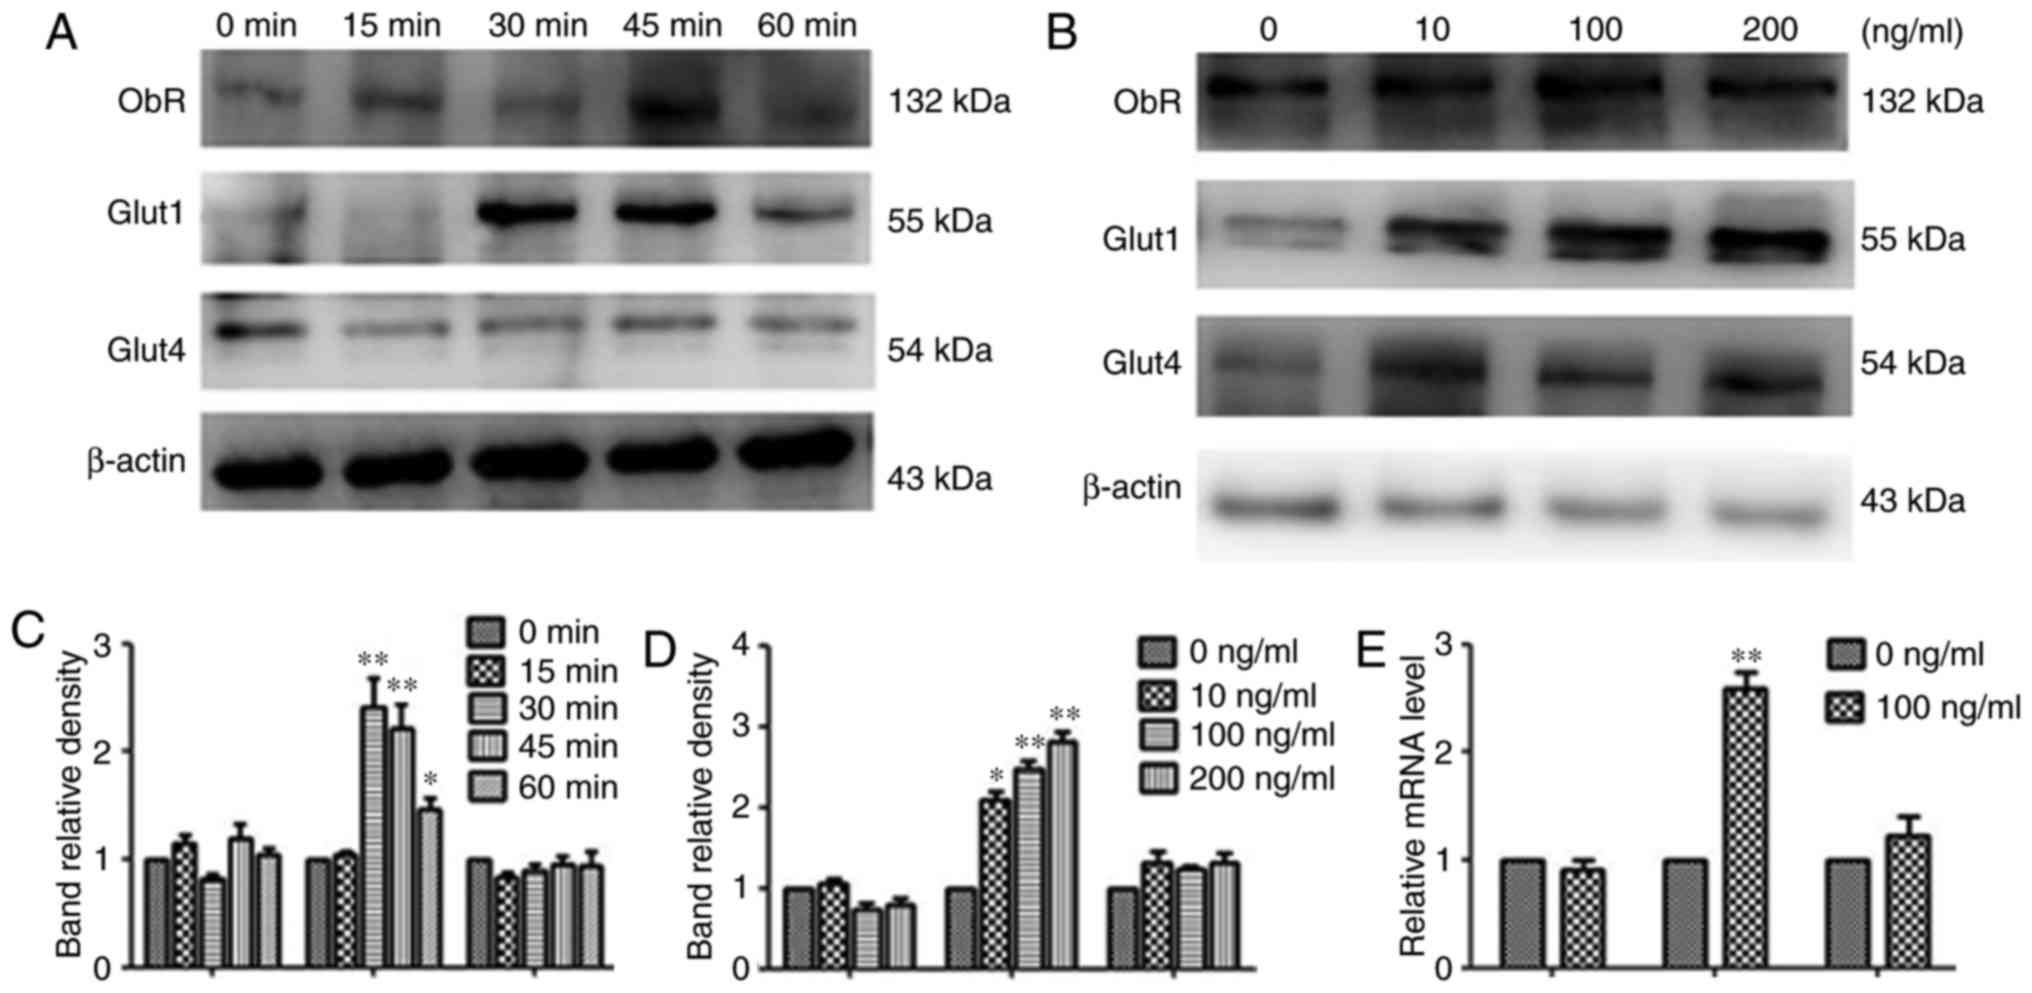 | Figure 5.Effects of leptin on the recruitment
of Glut1 to the cell surface and effects of leptin on Glut1 and
Glut4 in MOLT-3 cells. (A and B) MOLT-3 cells were treated with 100
ng/ml leptin for 0, 15, 30, 45 or 60 min. Next, the cells were
collected and the cell membrane proteins were extracted. Western
blotting was used to analyze the membrane protein level of ObR,
Glut1 and Glut4. β-actin expression was used as an internal
control. The relative densities of ObR, Glut1 and Glut4 were
calculated from 3 separate experiments. *P<0.05, **P<0.01. (C
and D) Following treatment with different doses of leptin (0, 10,
100 or 200 ng/ml) for 48 h, the protein expression of ObR, Glut1
and Glut4 was measured by western blot analysis and results
demonstrated that Glut1 expression was markedly upregulated.
*P<0.05, **P<0.01. (E) Following treatment with 100 ng/ml
rhleptin for 48 h, the expression of ObR, Glut1 and Glut4 mRNA in
MOLT-3 cells was detected by reverse transcription-quantitative
polymerase chain reaction. It was also revealed that Glut1 mRNA
expression was upregulated by over 2-fold **P<0.01. ObR, leptin
receptor; Glut, glucose transporter. |
Leptin increases the expression of
Glut1 mRNA
To further investigate whether the leptin-induced
glucose uptake is dependent on the overexpression of Gluts, the
effect of leptin on the mRNA levels of ObR, Glut1 and Glut4 genes
was measured by RT-qPCR. Following treatment with 100 ng/ml
rhleptin for 48 h, the expression of Glut1 mRNA in MOLT-3 cells was
upregulated over 2-fold, while no significant difference in Glut4
mRNA expression was observed between the rhleptin-treated and the
untreated cells. In addition, leptin did not appear to affect the
expression of ObR (Fig. 5E).
Leptin upregulates Glut1 protein
expression
Whether the protein expression levels of ObR, Glut1
and Glut4 were altered in MOLT-3 cells following rhleptin treatment
was also investigated. As demonstrated in Fig. 5B and D, following treatment with
different doses of leptin (0, 10, 100 or 200 ng/ml) for 48 h, the
Glut1 expression was markedly upregulated, while no considerable
changes in ObR and Glut4 expression were observed under the same
conditions.
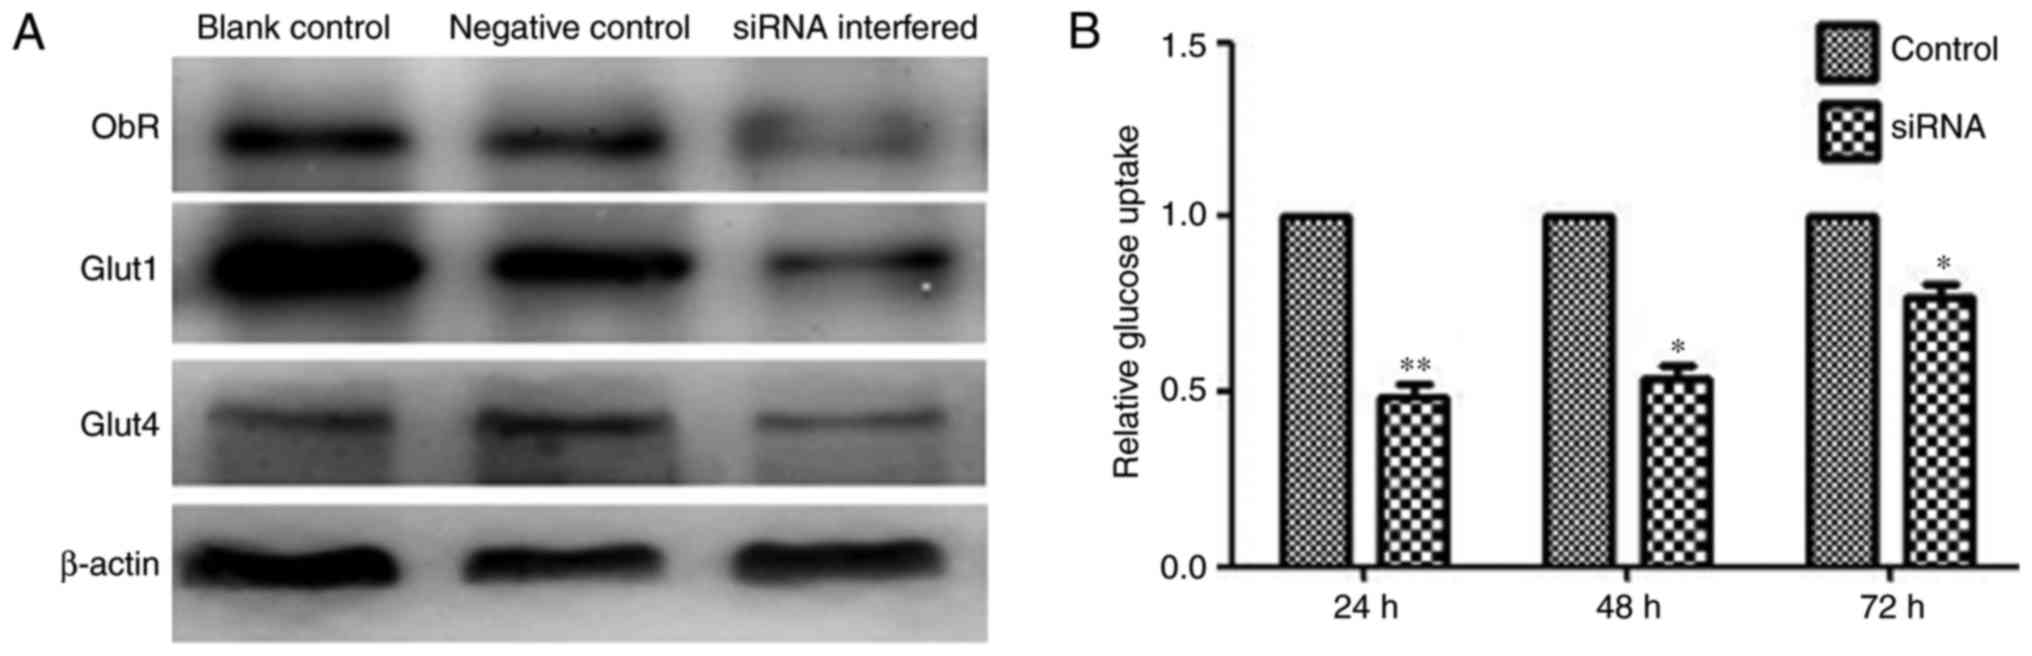
Effect of ObR inhibition with siRNA on
the glucose uptake of MOLT-3 cells
siRNA for ObR was transfected into MOLT-3 cells,
which notably decreased ObR expression and blocked leptin-induced
Glut1 expression, but did not change the expression of Glut4
(Fig. 6A). Transfection with specific
siRNAs did not affect the expression levels of unrelated genes,
including β-actin. As demonstrated in Fig. 6B, ObR-specific siRNA reduced the
glucose uptake of MOLT-3 cells.
Discussion
The present study demonstrated that leptin and its
receptor significantly increased glucose uptake in MOLT-3 cells. In
addition, it was revealed that the mechanism by which leptin
induced glucose uptake was through the increased Glut1 expression
and transportation to the cell surface. Therefore, to the best of
our knowledge, the present study is the first to discuss the
glucose consumption promoting effect of leptin on TCL cells in
vitro.
The lepin/leptin receptor signaling pathway is
well-known to take part in energy metabolism, cell proliferation
and immunomodulation (16). Previous
studies have proven the role of leptin and its receptor in the
occurrence and progression of cancer (17). These observations are further
supported by experimental evidence that leptin may stimulate
proliferation and inhibit apoptosis in different types of cancer
cell (18). However, the direct
effect of the leptin/leptin receptor signaling pathway on glucose
metabolism in malignant cells has been rarely studied. Therefore,
the present study investigated the effect of leptin on the glucose
uptake of malignant T cells and examined the mechanism involved in
the process.
It is widely believed that leptin exerts direct
effects on glucose levels independently of body weight and food
intake. In the central nervous system, leptin and insulin share a
similar phosphoinositide 3-kinase (PI3K) intracellular signaling
pathway to modulate glucose uptake and metabolism (19). At the peripheral level, this role for
leptin has been established in metabolic cells, including muscle
and adipose cells (20). With regards
to T cells, leptin upregulates glucose uptake and Glut1 expression
through mechanistic target of rapamycin signaling in activated T
cells compared with that in resting T cells (21). We hypothesized that malignant T
cells/TCL tissues may express a higher level of ObR than normal
mononuclear cells/RLH tissues, and that leptin/leptin receptor
signaling may promote glucose uptake in malignant T cells.
As expected, the present study observed a higher
level of ObR expression in TCL pathological sections than in RLH
tissues (58.3 vs. 22.2%; P=0.012). Additionally, the overexpression
of ObR was associated with Glut1 expression in TCL (P=0.007). In
vitro, TCL Jurkat and MOLT-3 cells exhibited upregulated ObR
expression, which was not the case for the cutaneous TCL Hut-78
cell line. Previous studies have suggested that this may be partly
due to the various sources and activity of TCL cells (22–24).
Compared with resting CD4+ T cells, activated
CD4+ T cells exhibited a higher expression level of ObR
(25). Following lymphocyte
activation, ObR expression shifted to a higher intensity and
density (26). ObR expression,
particularly that of the long isoform, in normal murine thymocytes
is exceedingly low or negative (27).
However, the present study revealed that Jurkat and MOLT-3 cells,
which are suspected to develop from thymocytes or thymic
progenitors, exhibit a high expression level of ObR. This may be
due to mutation of the upstream regulation sequence or the leptin
receptor (LEPR) gene. In the visceral fat of obese patients, a
negative correlation between microRNA-145 and LEPR gene expression
has been confirmed by Saucillo et al (28). Another study identified 26 single
nucleotide polymorphisms (SNPs) mapping to the LEPR region on
chromosome 1p31, and revealed that SNP rs12062820 was most strongly
associated with plasma soluble leptin receptor expression levels
(29). The correlation between
genetic characteristics and LEPR expression in malignancies is
rarely reported and therefore, requires elucidation in further
investigations.
In glucose metabolism regulation, leptin and its
receptor have different functions in various tissues and cells by
numerous mechanisms. In mouse muscle C2C12 cells, leptin increased
glucose uptake, and Glut4, but not Glut1, was recruited to the cell
surface by stimulating the signal transducer and activator of
transcription 3 (STAT3) and mitogen-activated protein kinase 1
signaling pathways (30). In HepG2
cells, leptin inhibited insulin-stimulated insulin receptor
substrate 1 tyrosine phosphorylation, thereby impairing insulin
action in the liver, leading to elevated hepatic glucose output
(31). In recent years, there has
been an increasing amount of interest regarding the metabolism of
immune cells. The ability of activated T cells to meet their
metabolic requirements depends on glucose import through Gluts, as
they do not store large quantities of glycogen (32). The majority of activated T cells take
up glucose via Glut1 instead of Glut4, due to the fact that mature
T cells primarily express undetectable Glut4 (33). The present study revealed that, in
MOLT-3 cells, leptin/leptin receptor signaling modulates glucose
uptake in a similar manner as in activated T cells. Stimulation
with leptin led to a dose-dependent increase in glucose uptake,
which may be associated with the translocation of Glut1 to the cell
surface. A 48 h coculture with leptin also promoted the uptake of
glucose, and upregulated Glut1 expression was dosage independent.
This indicated that the experimental dose of 100 ng/ml almost
reached the concentration for a maximal effect and thus, that
continuing to increase the concentration would not enhance the
effect any further. When the leptin/leptin receptor pathway was
interrupted by siRNA, Glut1 expression and glucose uptake were
interfered.
The ability of leptin to promote glucose uptake may
subsequently lead to increased cellular activities. In previous
studies, it has been proven leptin may promote the proliferation of
diffuse large B-cell lymphoma and acute myeloid leukemia cells
directly via the PI3K/Akt and STAT3 signaling pathways (34–36).
Similar to the proliferation of DLBCL and AML cells mentioned in
the above studies, promotion activity of leptin was also observed
in MOLT-3 cells by CCK8 analysis in the present study, and it was
revealed that leptin affected cell proliferation indirectly by the
glucose promoting effect, in addition to the direct effect.
In summary, TCL consists of a group of diseases
lacking effective treatments and associated with a poor prognosis.
The study of targeted therapy for TCL remains a challenge. The
results of the present study suggested that leptin and its receptor
participate in the glucose metabolism of TCL cells by upregulating
the expression and recruitment of Glut1. Therefore, blocking of the
leptin/leptin receptor pathway may be useful as a potential
therapeutic strategy against TCL and further study is required to
confirm this.
Acknowledgements
Not applicable.
Funding
The present study was partly supported by the
National Natural Science Foundation (grant nos. 81473486 and
81270598), the National Public Health Grand Research Foundation
(grant no. 201202017), the Natural Science Foundations of Shandong
Province (grant nos. ZR2012HZ003 and 2009ZRB14176), the Technology
Development Projects of Shandong Province (grant nos.
2014GSF118021, 2010GSF10250 and 2008GG2NS02018).
Availability of data and materials
The datasets used and/or analyzed during the current
study are available from the corresponding author on reasonable
request.
Authors' contributions
HZX and XW conceived and designed the study. TJH and
JSL performed the experiments. TJH and XYL wrote the paper. XYL and
XXZ analysed data. LYG was involved in data collection. All authors
read and approved the final manuscript.
Ethics statement and consent to
participate
The present study was conducted with the approval of
the Ethics Committee of Tai'an Central Hospital (Tai'an, China) and
written informed consent was obtained from all participants.
Patient consent for publication
Written informed consent was received from all
participants for the publication of this study.
Competing interests
The authors declare that they have no competing
interests.
References
|
1
|
Yabe M, Miranda RN and Medeiros LJ:
Hepatosplenic T-cell lymphoma: A review of clinicopathologic
features, pathogenesis and prognostic factors. Hum Pathol. 74:5–16.
2018. View Article : Google Scholar : PubMed/NCBI
|
|
2
|
A clinical evaluation of the International
Lymphoma Study Group classification of non-Hodgkin's lymphoma. The
Non-Hodgkin's Lymphoma Classification Project. Blood. 89:3909–3918.
1997.PubMed/NCBI
|
|
3
|
Sun J, Yang Q, Lu Z, He M, Gao L, Zhu M,
Sun L, Wei L, Li M, Liu C, et al: Distribution of lymphoid
neoplasms in China: Analysis of 4,638 cases according to the World
Health Organization classification. Am J Clin Pathol. 138:429–434.
2012. View Article : Google Scholar : PubMed/NCBI
|
|
4
|
Han Z, Niu T, Chang J, Lei X, Zhao M, Wang
Q, Cheng W, Wang J, Feng Y and Chai J: Crystal structure of the FTO
protein reveals basis for its substrate specificity. Nature.
464:1205–1209. 2010. View Article : Google Scholar : PubMed/NCBI
|
|
5
|
Sabattini E, Bacci F, Sagramoso C and
Pileri SA: WHO classification of tumours of haematopoietic and
lymphoid tissues in 2008: An overview. Pathologica. 102:83–87.
2010.PubMed/NCBI
|
|
6
|
Tohda S: Overview of lymphoid neoplasms in
the fourth edition of the WHO classification. Rinsho Byori.
60:560–564. 2012.(In Japanese). PubMed/NCBI
|
|
7
|
Lee Y, Uhm JE, Lee HY, Park MJ, Kim H, Oh
SJ, Jang JH, Kim K, Jung CW, Ahn YC, et al: Clinical features and
prognostic factors of patients with ‘peripheral T cell lymphoma,
unspecified’. Ann Hematol. 88:111–119. 2009. View Article : Google Scholar : PubMed/NCBI
|
|
8
|
Petrich AM and Rosen ST: Peripheral T-cell
lymphoma: New therapeutic strategies. Oncology (Williston Park,
NY). 27:878–884. 2013.
|
|
9
|
Bridgewater J, Galle PR, Khan SA, Llovet
JM, Park JW, Patel T, Pawlik TM and Gores GJ: Guidelines for the
diagnosis and management of intrahepatic cholangiocarcinoma. J
Hepatol. 60:1268–1289. 2014. View Article : Google Scholar : PubMed/NCBI
|
|
10
|
Cao X, Fang L, Gibbs S, Huang Y, Dai Z,
Wen P, Zheng X, Sadee W and Sun D: Glucose uptake inhibitor
sensitizes cancer cells to daunorubicin and overcomes drug
resistance in hypoxia. Cancer Chemother Pharmacol. 59:495–505.
2007. View Article : Google Scholar : PubMed/NCBI
|
|
11
|
Wu X, Pertovaara H, Korkola P, Vornanen M,
Eskola H and Kellokumpu-Lehtinen PL: Glucose metabolism correlated
with cellular proliferation in diffuse large B-cell lymphoma. Leuk
Lymphoma. 53:400–405. 2012. View Article : Google Scholar : PubMed/NCBI
|
|
12
|
Liu T, Kishton RJ, Macintyre AN, Gerriets
VA, Xiang H, Liu X, Abel ED, Rizzieri D, Locasale JW and Rathmell
JC: Glucose transporter 1-mediated glucose uptake is limiting for
B-cell acute lymphoblastic leukemia anabolic metabolism and
resistance to apoptosis. Cell Death Dis. 5:e14702014. View Article : Google Scholar : PubMed/NCBI
|
|
13
|
Zois CE and Harris AL: Glycogen metabolism
has a key role in the cancer microenvironment and provides new
targets for cancer therapy. J Mol Med (Berl). 94:137–154. 2016.
View Article : Google Scholar : PubMed/NCBI
|
|
14
|
Vose JM: Update on T-cell lymphoma. Ann
Oncol. 19 Suppl 4:iv74–iv76. 2008. View Article : Google Scholar : PubMed/NCBI
|
|
15
|
Wang R, Dong K, Lin F, Wang X, Gao P, Wei
SH, Cheng SY and Zhang HZ: Inhibiting proliferation and enhancing
chemosensitivity to taxanes in osteosarcoma cells by RNA
interference-mediated downregulation of stathmin expression. Mol
Med. 13:567–575. 2007. View Article : Google Scholar : PubMed/NCBI
|
|
16
|
Livak KJ and Schmittgen TD: Analysis of
relative gene expression data using real-time quantitative PCR and
the 2(-Delta Delta C(T)) method. Methods. 25:402–408. 2001.
View Article : Google Scholar : PubMed/NCBI
|
|
17
|
Shao Y, Ling CC and Liu XQ: High
concentrations of glucose suppress etoposide-induced cell death of
B-cell lymphoma through BCL-6. Biochem Biophys Res Commun.
450:227–233. 2014. View Article : Google Scholar : PubMed/NCBI
|
|
18
|
Ouchi N, Parker JL, Lugus JJ and Walsh K:
Adipokines in inflammation and metabolic disease. Nat Rev Immunol.
11:85–97. 2011. View
Article : Google Scholar : PubMed/NCBI
|
|
19
|
Zhang Y, Proenca R, Maffei M, Barone M,
Leopold L and Friedman JM: Positional cloning of the mouse obese
gene and its human homologue. Nature. 372:425–432. 1994. View Article : Google Scholar : PubMed/NCBI
|
|
20
|
Cioffi JA, Shafer AW, Zupancic TJ,
Smith-Gbur J, Mikhail A, Platika D and Snodgrass HR: Novel B219/OB
receptor isoforms: Possible role of leptin in hematopoiesis and
reproduction. Nat Med. 2:585–589. 1996. View Article : Google Scholar : PubMed/NCBI
|
|
21
|
Bennett BD, Solar GP, Yuan JQ, Mathias J,
Thomas GR and Matthews W: A role for leptin and its cognate
receptor in hematopoiesis. Curr Biol. 6:1170–1180. 1996. View Article : Google Scholar : PubMed/NCBI
|
|
22
|
Feller AC: Phenotypic analysis of human
T-cell lymphoma with reference to cell differentiation and
morphological classification. Veroff Pathol. 131:1–175. 1989.(In
German). PubMed/NCBI
|
|
23
|
Smith JL, Hodges E, Howell WM and Jones
DB: Genotypic heterogeneity of node based peripheral T-cell
lymphoma. Leuk Lymphoma. 10:273–279. 1993. View Article : Google Scholar : PubMed/NCBI
|
|
24
|
Shao W, Growney JD, Feng Y, O'Connor G, Pu
M, Zhu W, Yao YM, Kwon P, Fawell S and Atadja P: Activity of
deacetylase inhibitor panobinostat (LBH589) in cutaneous T-cell
lymphoma models: Defining molecular mechanisms of resistance. Int J
Cancer. 127:2199–2208. 2010. View Article : Google Scholar : PubMed/NCBI
|
|
25
|
Vaisse C, Halaas JL, Horvath CM, Darnell
JE Jr, Stoffel M and Friedman JM: Leptin activation of Stat3 in the
hypothalamus of wild-type and ob/ob mice but not db/db mice. Nat
Genet. 14:95–97. 1996. View Article : Google Scholar : PubMed/NCBI
|
|
26
|
Fernández-Formoso G, Pérez-Sieira S,
González-Touceda D, Dieguez C and Tovar S: Leptin, 20 years of
searching for glucose homeostasis. Life Sci. 140:4–9. 2015.
View Article : Google Scholar : PubMed/NCBI
|
|
27
|
Pliszka M, Oleszczak B and Szablewski L:
Leptin at gender-specific concentrations does not affect glucose
transport, expression of glucose transporters and leptin receptors
in human lymphocytes. Endocrine. 49:97–105. 2015. View Article : Google Scholar : PubMed/NCBI
|
|
28
|
Saucillo DC, Gerriets VA, Sheng J,
Rathmell JC and Maciver NJ: Leptin metabolically licenses T cells
for activation to link nutrition and immunity. J Immuno.
192:136–144. 2014. View Article : Google Scholar
|
|
29
|
Jacobs SR, Herman CE, Maciver NJ, Wofford
JA, Wieman HL, Hammen JJ and Rathmell JC: Glucose uptake is
limiting in T cell activation and requires CD28-mediated
Akt-dependent and independent pathways. J Immunol. 180:4476–4486.
2008. View Article : Google Scholar : PubMed/NCBI
|
|
30
|
Loffreda S, Yang SQ, Lin HZ, Karp CL,
Brengman ML, Wang DJ, Klein AS, Bulkley GB, Bao C, Noble PW, et al:
Leptin regulates proinflammatory immune responses. FASEB J.
12:57–65. 1998. View Article : Google Scholar : PubMed/NCBI
|
|
31
|
de Git KC and Adan RA: Leptin resistance
in diet-induced obesity: The role of hypothalamic inflammation.
Obesity Rev. 16:207–224. 2015. View Article : Google Scholar
|
|
32
|
van Dielen FM, van't Veer C, Schols AM,
Soeters PB, Buurman WA and Greve JW: Increased leptin
concentrations correlate with increased concentrations of
inflammatory markers in morbidly obese individuals. Int J Obes
Relat Metab Disord. 25:1759–1766. 2001. View Article : Google Scholar : PubMed/NCBI
|
|
33
|
Park HY, Kwon HM, Lim HJ, Hong BK, Lee JY,
Park BE, Jang Y, Cho SY and Kim HS: Potential role of leptin in
angiogenesis: Leptin induces endothelial cell proliferation and
expression of matrix metalloproteinases in vivo and in vitro. Exp
Mol Med. 33:95–102. 2001. View Article : Google Scholar : PubMed/NCBI
|
|
34
|
Uddin S, Bu R, Ahmed M, Hussain AR, Ajarim
D, Al-Dayel F, Bavi P and Al-kuraya KS: Leptin receptor expression
and its association with PI3K/AKT signaling pathway in diffuse
large B-cell lymphoma. Leuk Lymphoma. 51:1305–1314. 2010.
View Article : Google Scholar : PubMed/NCBI
|
|
35
|
Kim JY, Park HK, Yoon JS, Kim SJ, Kim ES,
Song SH, Choi JH, Kim BK, Park BB and Lee YY: Molecular mechanisms
of cellular proliferation in acute myelogenous leukemia by leptin.
Oncol Rep. 23:1369–1374. 2010.PubMed/NCBI
|
|
36
|
Procaccini C, De Rosa V, Galgani M,
Carbone F, Cassano S, Greco D, Qian K, Auvinen P, Calì G, Stallone
G, et al: Leptin-induced mTOR activation defines a specific
molecular and transcriptional signature controlling CD4+
effector T cell responses. J Immunol. 189:2941–2953. 2012.
View Article : Google Scholar : PubMed/NCBI
|