Introduction
Prostate cancer is the second leading cause of
cancer-associated mortality among males in the United States
(1). It is estimated that in 2018
there will be ~161,360 newly diagnosed cases of prostate cancer in
the United States and 26,730 of them will result in mortality
(2). In China, the morbidity and
mortality rates of prostate cancer are also continuously increasing
(3). Prostate cancer is a disease
presenting with a number of heterogeneous symptoms. Numerous
factors are recognized as risk factors of prostate cancer,
including race, age and genetic mutations. These risk factors are
associated with the tumorigenesis, progression and prognosis of
prostate cancer (4). The
tumorigenesis and progression of this disease are difficult to
assess, and it is particularly difficult to provide an accurate
prognosis. Radical prostatectomy and radiation therapy are basic
strategies used to treat localized prostate cancer (5); however, following radical prostatectomy
or radiation therapy, ~20% of patients experience biochemical
recurrence (BCR) and require additional treatment (6). Due to the heterogeneous nature of
prostate cancer, every patient requires personalized treatment
regimens. Therefore, it is important to identify the state of
progression and predict the prognosis of prostate cancer in each
individual. To predict the disease outcome, serum levels of
prostate-specific antigen (PSA), tumor invasion, Gleason Score, and
lymph node and distant metastasis have been used in a number of
combinations (7,8). However, this methodology is not
sufficient to confirm diagnosis and it remains difficult to
determine the disease outcome using the limited clinicopathological
data available. For example, PSA is universally used in screening,
detecting and predicting the prognosis of prostate cancer (9); however, numerous false positives have
been reported as a result of PSA screening (10). Therefore, a novel and accurate
biomarker for the diagnosis and prognosis of prostate cancer is
required.
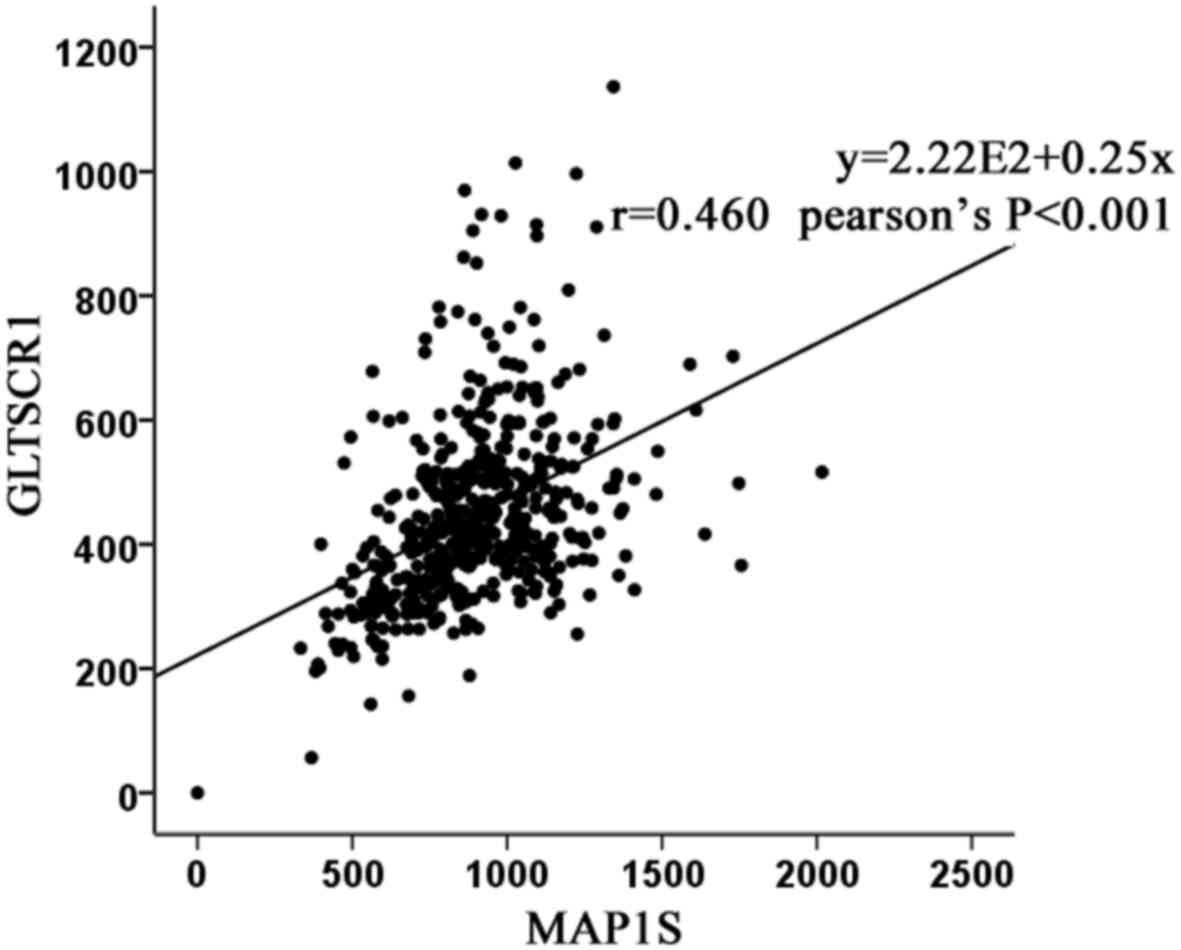
Microtubule-associated protein 1 small form (MAP1S)
is a marker of autophagy, and it serves a notable function in the
course of autophagosomal biogenesis and degradation (11). A previous study hypothesized that
patients with prostate cancer with a low expression level of MAP1S
experience a poor prognosis (12).
Using The Cancer Genome Atlas (ATLAS) database, it was identified
that glioma tumor suppressor candidate region gene 1 (GLTSCR1) was
moderately associated with MAP1S at the mRNA expression level
(Fig. 1).
GLTSCR1 is associated with the development and
progression of oligodendroglioma (13,14). It is
located on 19q13.33 and exhibits moderate expression levels in the
brain, heart, skeletal muscle, placenta and pancreas, and low
expression levels in the liver, lungs and kidney (13,15). The
current literature has only suggested that GLTSCR1 is involved in
oligodendroglioma (13,14). To the best of our knowledge, there are
no studies describing the role of GLTSCR1 in prostate cancer.
Previous studies have speculated that there are a number of
susceptibility loci for prostate cancer aggressiveness on
chromosome 19q13 (15,16). Notably, as aforementioned, GLTSCR1 is
located on 19q13. Therefore, according to the association between
GLTSCR1 and MAP1S identified via TCGA, the location of GLTSCR1 on
chromosome 19q13 and the function of GLTSCR1 in oligodendroglioma,
it was hypothesized that GLTSCR1 may be associated with prostate
cancer.
The present study investigated the expression level
of GLTSCR1 in prostate cancer, and determined the association
between GLTSCR1 expression and the clinicopathological features and
prognosis of patients with prostate cancer.
Materials and methods
Patients and tissue samples
In order to perform an immunohistochemical analysis,
a tissue microarray (TMA; n=80), including 4 prostate tissues, 3
adjacent normal prostate tissues and 73 prostate cancer tissues was
purchased (cat. no. PR803c; Alenabio Biotechnology Ltd., Xi'an,
China), along with the detailed clinicopathological information of
each sample including the Gleason score, TNM staging and the
clinical stage. The staging met the standards required by previous
studies (17,18). Samples from patients who had received
radiotherapy or chemotherapy prior to their surgery were excluded
from the present study. To study the expression of GLTSCR1 at the
mRNA level and complete a survival analysis, clinicopathological
features from TCGA database, a freely opened public platform, is a
source for abundant cancer-related data (19), including 499 prostate cancer tissues
and 52 normal prostate tissues, were also gathered. These features
are summarized in Table I.
 | Table I.Clinical characteristics of all
patients. |
Table I.
Clinical characteristics of all
patients.
|
| Experiment type |
|---|
|
|
|
|---|
| Clinical
characteristic | TMA | TCGA |
|---|
| Tissue type |
|
|
| Prostate
cancer | 73 | 499 |
|
Normal | 7 | 52 |
| Serum PSA levels,
ng/ml |
|
|
|
<4 | na | 413 |
| ≥4 | na | 27 |
| Gleason score |
|
|
|
<7 | na | 44 |
| =7 | na | 247 |
|
>7 | na | 206 |
| Lymph node
metastasis |
|
|
| N0 | 60 | 344 |
| N1 | 12 | 80 |
| Distant
metastasis |
|
|
| M0 | 58 | 455 |
| M1 | 14 | 3 |
Immunohistochemistry
The samples were fixed in 10% neutral buffered
formalin overnight at room temperature, and embedded in paraffin.
The paraffin-embedded tissues were sliced into 4-µm thick sections,
dewaxed in xylene and rehydrated in a descending alcohol series
(100, 100, 95, 95, 90, 80 and 70%, for 2 min each) at room
temperature. Sections were subjected to peroxidase
immunohistochemistry staining employing a DAKO EnVision system
(Dako; Agilent Technologies, Inc., Santa Clara, CA, USA). The
sections were subjected to antigen retrieval by peroxidase with
0.01 M citrates (cat. no. AR0024; Boster Biological Technology,
Wuhan, China) in a microwave oven on high for ~6 min, moderate for
~6 min and blocked with goat serum for 30 min. The
immunohistochemical staining of tissue microarray was conducted
using the UltraSensitive™ SP (Mouse/Rabbit) IHC kit (cat no.
KIT-0305; MX Biotechnologies, Fuzhou, China). Next, the sections
were incubated with the corresponding rabbit polyclonal antibody
against GLTSCR1 (1:600; cat. no. bs-14278R; Bioss Antibodie, Inc.,
Woburn, MA, USA), overnight at 4°C. Subsequently, the sections were
incubated with the HRP-labeled secondary antibody [dilution, 1:200;
UltraSensitive SP (Mouse/Rabbit) IHC kit; cat no. KIT-0305; MX
Biotechnologies] marked by avidin for 30 min at room temperature.
Then peroxidase-labeled polymer (incubated with the 50 µl for 15
min at room temperature) and substrate-chromogen (incubated with
the 100 µl for 2 min at room temperature) were used so as to
observe the staining of the target protein. Sections undergoing the
same procedure omitting the corresponding antibody served as the
negative controls.
Assessment of immunostaining
results
The stained slides were scanned by Aperio ImageScope
(Aperio CS; Leica Microsystems, Inc., Buffalo Grove, IL, USA). Then
these slides were scored by two independent experienced
pathologists in a blinded manner, (Department of Pathology
Diagnosis, Sun Yat-Sen Memorial Hospital, Guangdong, China), and
any disagreements were resolved by a re-examination of the section
by the pathologists in order to obtain an agreed conclusion. The
immunolabeling of tumor cells was assessed. The number of
positively stained cells in five representative microscopic fields
at a magnification of ×400 was counted and the percentage of
positive cells was calculated. Cytoplasmic staining was considered
indicative of a positive signal on the basis of the antibody
specification sheet. The staining intensity and percentage were
used for semi-quantitative scoring of the expression intensity in
each case, as described by a previous study (20). The staining intensity was scored as
follows: Negative, weak, moderate and strong staining were scored
as 0, 1, 2 and 3 points, respectively. The percentage scoring of
immunoreactive tumor cells was classified according to the
following criteria: >75%, 4 points; 51–75%, 3 points; 26–50%, 2
points; 6–25%, 1 point; <5%, 0 points. Multiplying
immunostaining intensity and immunostaining percentage scores of
each sample provided the final immunoreactivity score (IRS) for
each sample. In the immunohistochemistry score, 0–1 was considered
as negative, 2–4 as low expression (+), 5–8 as moderate expression
(++), and 9–12 as high expression (+++). Therefore, samples with
negative expression and low expression (≤4 points) were designated
as the low expression group, whilst the moderate expression and
high expression samples (>4 points) were designated as the high
expression group.
Statistical analysis
SPSS software (version 22.0; IBM Corp., Armonk, NY,
USA) was used to statistically analyze all results. An analysis of
variance (ANOVA) and least significance difference (LSD) post hoc
test were used for analysis of the association between Gleason
score and GLTSCR1 expression. Fisher's exact test, Student's t-test
and Pearson's χ2 test were used for analysis of the
association between other clinicopathological features and GLTSCR1
expression. The Kaplan-Meier method was used to analyze the overall
survival rate, and a log-rank test was used to evaluate the
differences in survival rate. Cox's proportional hazard regression
model was performed for univariate and multivariate survival
analysis. Adjusted hazard ratios (HRs) and corresponding 95%
confidence intervals (CIs) reflect the relative risks of mortality.
P<0.05 was considered to indicate a statistically significant
difference.
Results
GLTSCR1 protein is upregulated in
human prostate cancer and is associated with certain
clinicopathological parameters in patients with prostate
cancer
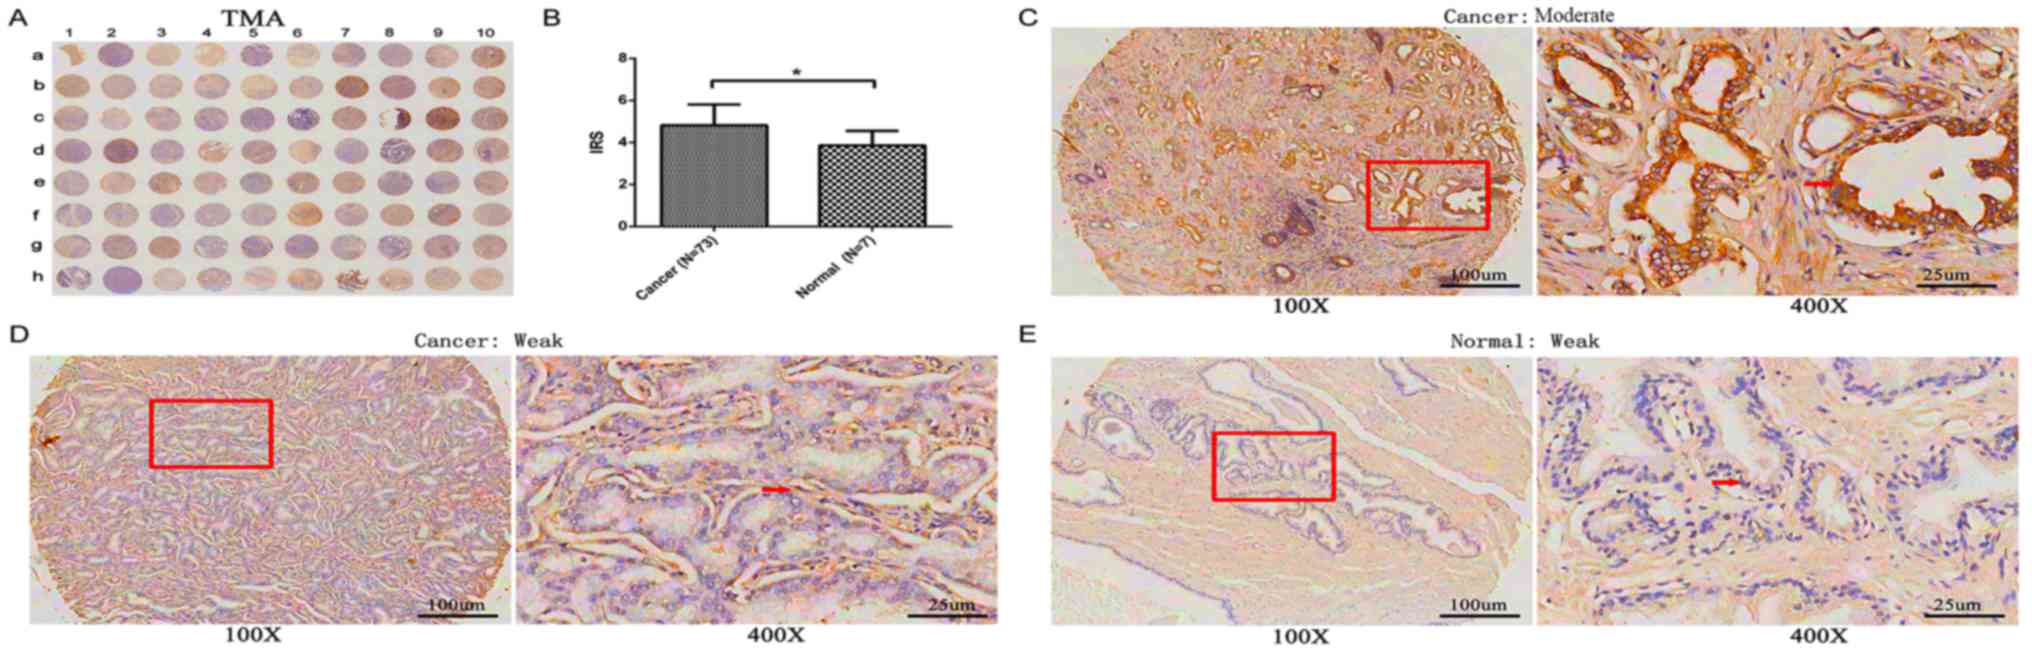
GLTSCR1 protein expression was detected using a TMA
(n=80) via immunohistochemistry (Table
II), including 3 adjacent normal prostate tissues, 4 normal
prostate tissues and 73 prostate cancer tissues. As presented in
Fig. 2A, GLTSCR1 immunostaining
occurred moderately and weakly in both the cytoplasm of prostate
cancer cells and normal prostate tissues, but the expression level
of GLTSCR1 in prostate cancer tissues was significantly increased
compared with that in normal prostate tissue (IRS, prostate cancer,
4.82±0.99 versus normal, 3.86±0.69; P=0.015; Fig. 2B). Of the 73 prostate cancer samples,
26 (35.6%) exhibited low GLTSCR1 expression, while 47 (64.4 %)
exhibited high GLTSCR1 expression.
| Table II.Association between GLTSCR1
expression and clinicopathological characteristics in patients with
prostate cancer. |
Table II.
Association between GLTSCR1
expression and clinicopathological characteristics in patients with
prostate cancer.
|
| TMA (Pearson's
χ2 tests) | TCGA (Student's
t-tests) |
|---|
|
|
|
|
|---|
| Clinical
features | Cases | Low, n (%) | High, n (%) | P-value | Cases | Mean ± SD | P-value |
|---|
| Tissue type |
|
|
|
|
|
|
|
|
Prostate cancer | 73 | 26 (35.6) | 47 (64.4) | 0.015a | 499 | 447.7±6.45 |
<0.001b |
|
Benign | 7 | 6 (85.7) | 1 (14.3) |
| 52 | 343.5±14.21 |
|
| Age |
|
|
|
|
|
|
|
|
<66 | 24 | 11 (45.8) | 13 (54.2) | 0.202 | 354 | 453.79±146.85 | 0.111 |
|
≥66 | 49 | 15 (30.6) | 34 (69.4) |
| 143 | 431.08±135.44 |
|
| PSA level
(ng/ml) |
|
|
|
|
|
|
|
| ≤4 | na | na | na | na | 413 | 446.73±143.75 | 0.723 |
|
>4 | na | na | na |
| 27 | 456.83±135.92 |
|
| Gleason score |
|
|
|
|
|
|
|
|
<7 | na | na | na | na | 44 | 427.34±114.67 |
<0.001b |
| =7 | na | na | na |
| 247 | 419.46±128.84 |
|
|
>7 | na | na | na |
| 206 | 484.84±158.06 |
|
| Pathological
grade |
|
|
|
|
|
|
|
| ≤2 | 23 | 6 (26.1) | 17 (73.9) | 0.304 | na | na | na |
|
>2 | 44 | 17 (38.6) | 27 (61.4) |
| na | na |
|
| Clinical stage |
|
|
|
|
|
|
|
|
I–II | 45 | 24 (53.3) | 21 (46.7) |
<0.001b | na | na | na |
|
III–IV | 27 | 2 (7.4) | 25 (92.6) |
| na | na |
|
| Tumor invasion |
|
|
|
|
|
|
|
|
T1-T2 | 48 | 23 (47.9) | 25 (52.1) | 0.003b | 177 (T1) | 437.32±131.93 | 0.011a |
|
T3-T4 | 24 | 3 (12.5) | 21 (87.5) |
| 229 (T2-T4) | 474.09±152.16 |
|
| Lymph node
metastasis |
|
|
|
|
|
|
|
| N0 | 60 | 26 (43.3) | 34 (56.7) | 0.003b | 344 | 440.49±139.44 | 0.001b |
| N1 | 12 | 0 (0.0) | 12 (100.0) |
| 80 | 503.48±174.50 |
|
| Distant
metastasis |
|
|
|
|
|
|
|
| M0 | 58 | 26 (44.8) | 32 (55.2) | 0.001b | 455 | 448.68±141.05 | 0.002b |
| M1 | 14 | 0 (0.0) | 14 (100.0) |
| 3 | 710.18±381.93 |
|
Subsequently, immunostaining results were
statistically analyzed using the clinicopathological information
obtained from the TMA. The results revealed that the high
expression of GLTSCR1 protein was significantly associated with
advanced clinical stage (P<0.001), enhanced tumor invasion
(P=0.003), lymph node metastasis (P=0.003) and distant metastasis
(P=0.001). However, no association was detected between GLTSCR1
expression level and age (P>0.05; Table II).
High expression of GLTSCR1 is
associated with the aggressive progression and poor prognosis of
prostate cancer
To validate the results of the immunohistochemistry
analysis, data from TCGA were used to assess the mRNA expression of
GLTSCR1 in 52 normal prostate tissues and 499 prostate cancer
tissues. As presented in Table II,
the cancer patients were divided into 3 groups (GS<7, GS=7 and
GS>7) and results were compared using ANOVA and LSD tests
(P<0.001 for ANOVA analysis of the 3 groups); the results
revealed that GLTSCR1 was upregulated in PCa tissues and was
positively associated with the Gleason score, and enhanced tumor
invasion (P=0.011), lymph node metastasis (P=0.001) and distant
metastasis (P=0.002). However, high GLTSCR1 expression levels were
not associated with age (P>0.05; Table II).
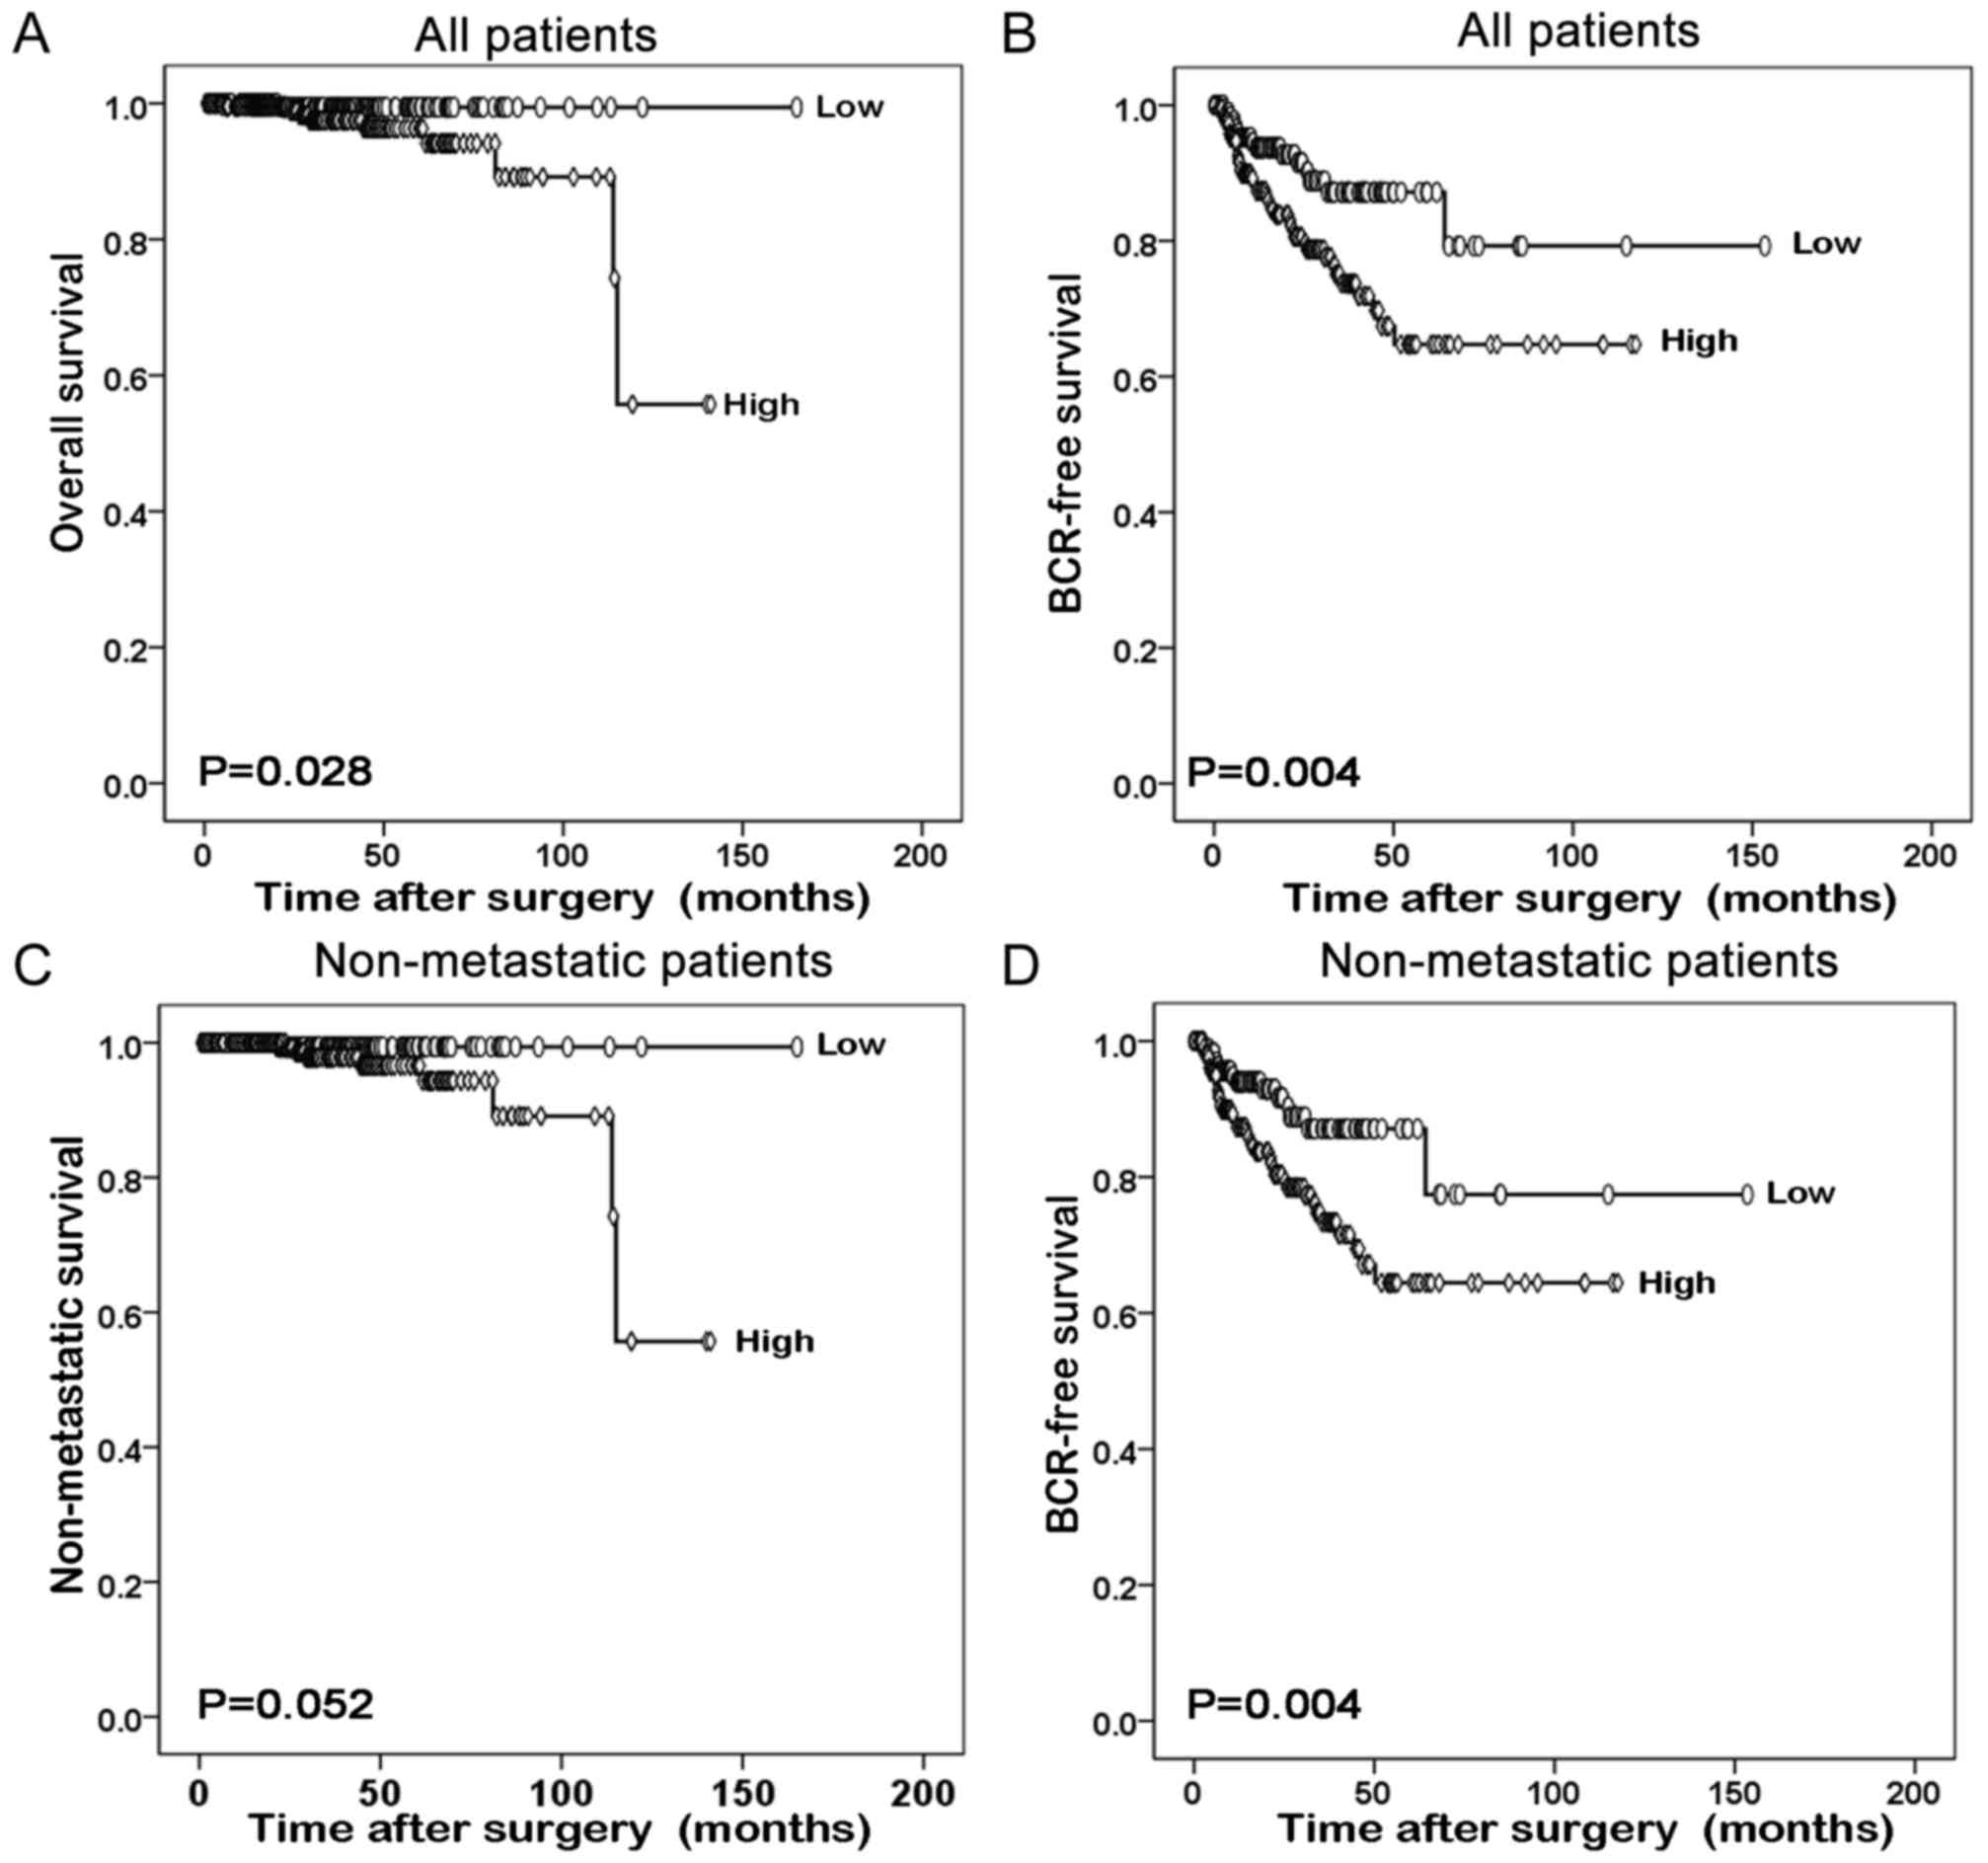
Furthermore, the prognostic value of GLTSCR1
relative to the survival time of patients with prostate cancer was
evaluated using Kaplan-Meier survival plots. As presented in
Fig. 3, the overall survival and
BCR-free survival times of all prostate cancer patients with high
GLTSCR1 expression were significantly shorter than those with low
GLTSCR1 expression (P=0.028 and P=0.004, respectively). The same
result was obtained in the BCR-free survival of patients with
non-metastatic prostate cancer (P=0.004). However, the different
GLTSCR1 expression was not significant in the non-metastatic
survival of patients with non-metastatic prostate cancer.
GLTSCR1 serves as an independent
prognostic factor for the survival of patients with prostate
cancer
Finally, using Cox's proportional hazards model on
data obtained from TCGA, the possibility that GLTSCR1 is an
independent prognostic factor for the survival of prostate cancer
was evaluated. The univariate analysis revealed that GLTSCR1
expression was a significant prognostic factor for BCR-free
survival in patients with prostate cancer (HR, 2.279; 95% CI,
1.284–4.047; P=0.005), alongside the Gleason score, PSA level,
tumor invasion and lymph node metastasis (all P<0.05; Table III). Multivariate analysis revealed
that high GLTSCR1 expression was a significant independent
prognostic factor in prostate cancer (HR, 1.829; 95% CI,
1.002–3.339; P=0.049), alongside the Gleason score and PSA level
(all P<0.05; Table III).
| Table III.Prognostic value of GLTSCR1
expression for the BCR-free survival proportional hazards
model. |
Table III.
Prognostic value of GLTSCR1
expression for the BCR-free survival proportional hazards
model.
|
| BCR-free
survival |
|---|
|
|
|
|---|
| Variable | HR (95% CI) | P-value |
|---|
| Univariate
analysis |
|
|
| Age,
≥60 vs. <60 | 1.319
(0.773–2.250) | 0.310 |
| PSA
level, >4 vs. ≤4 | 10.426
(5.309–20.474) |
<0.001b |
| Gleason
score, <7 vs. =7 vs. >7 | 3.175
(1.881–5.360) |
<0.001b |
| Tumor
invasion, T1 vs. T2-T4 | 3.416
(1.714–6.810) |
<0.001b |
| Distant
metastasis, M0 vs. M1 | 3.536
(0.488–25.641) | 0.212 |
| Lymph
node metastasis, N0 vs. N1 | 1.879
(1.049–3.365) | 0.034 |
| GLTSCR1
expression, low vs. high | 2.279
(1.284–4.047) |
0.005b |
| Multivariate
analysis |
|
|
| Age ≥60
vs. <60 | 1.026
(0.594–1.771) | 0.927 |
| PSA
level, >4 vs. ≤4 | 6.093
(3.015–12.316) |
<0.001b |
| Gleason
score, <7 vs. =7 vs. >7 | 2.326
(1.343–4.028) | 0.003b |
| GLTSCR1
expression, low vs. high | 1.829
(1.002–3.339) | 0.049a |
Discussion
Prostate cancer is a common disease with a high
morbidity rate in the USA (21). The
disease is characterized by numerous heterogeneous lesions, and the
use of presently known biomarkers to determine the state of disease
progression and predict the prognosis remains a challenge.
Therefore, further studies are required to identify a novel and
accurate biomarker to assess the disease stage and predict the
outcome for patients. In the present study, it was revealed that
the expression of GLTSCR1 in prostate cancer tissue was increased
compared with that in normal tissues. Additionally, the GLTSCR1
expression was markedly associated with the progression of prostate
cancer. Notably, GLTSCR1 may function as a significant independent
prognostic factor in prostate cancer, since high expression of
GLTSCR1 was associated with poorer BCR-free survival in patients
with prostate cancer.
GLTSCR1 is involved in the development and
progression of oligodendroglioma (13,14).
Previous investigations demonstrated that on chromosome 19q13, a
number of susceptibility loci are associated with the
aggressiveness of prostate cancer (15,16).
Notably, GLTSCR1 is located on 19q13.33 (14,15),
suggesting that GLTSCR1 may be associated with prostate cancer.
Using TCGA, the present study identified that GLTSCR1 was
moderately associated with MAP1S at the mRNA expression level.
MAP1S is a biomarker of autophagy, and a previous study
demonstrated that patients with prostate cancer exhibiting low
MAP1S expression levels exhibit a poor prognosis (11,12). In
light of the aforementioned studies, it was hypothesized that
GLTSCR1 may promote prostate cancer progression. Therefore, the
association between the expression of GLTSCR1 in prostate cancer
tissues, and the clinicopathological parameters and prognosis of
patients with prostate cancer was evaluated.
In present study, it was revealed that GLTSCR1
protein expression was markedly associated with advanced clinical
stage, enhanced tumor invasion, and lymph node and distant
metastasis in the prostate cancer tissues. Additionally, it was
also identified that the GLTSCR1 RNA expression level in prostate
cancer was associated with the Gleason score, enhanced tumor
invasion, and lymph node and distant metastasis, based on data from
TCGA. Those clinicopathological parameters directly indicated the
stage of prostate cancer. Furthermore, it was identified that the
patients with prostate cancer exhibiting high expression of GLTSCR1
experienced a significantly shorter overall survival time compared
with those with low expression of GLTSCR1 (P=0.028). Notably, the
results from multivariate analysis revealed that GLTSCR1 was a
novel independent prognostic factor in prostate cancer.
According to the present study, GLTSCR1 served a
marked function in promoting prostate cancer progression. However,
the underlying molecular mechanism by which GLTSCR1 promotes
prostate cancer remains unknown. A previous study demonstrated that
GLTSCR1 is able to upregulate Pim-2 oncogene (PIM2) in C33A cells
(22). PIM2 is a potential target of
cancer therapy since blocking the activity of PIM2 may prevent the
development of pancreatic cancer and multiple myeloma (23–25).
Additionally, the overexpression of PIM2 may promote the
tumorigenesis of prostate cancer, and high levels of PIM2 in
prostate cancer are associated with an increased risk of
biochemical recurrence (26).
Furthermore, PIM2 may regulate autophagy, and PIM-2 suppression
downregulates autophagy by preventing dissociation of B cell
lymphoma-2 from Beclin 1 (27).
According to the aforementioned studies, it was hypothesized that
GLTSCR1 promotes prostate cancer by upregulating PIM2. However,
this hypothesis requires further investigation. As stated earlier,
TCGA revealed that GLTSCR1 was correlated with MAP1S at the mRNA
expression level in prostate cancer. The present study suggested
that low expression of GLTSCR1 is indicative of a good prognosis in
patients with prostate cancer. However, a previous study suggested
that low expression of MAP1S is indicative of a poor prognosis in
patients with prostate cancer (12).
Therefore, the results of the two studies are contradictory. This
may arise from the character of autophagy, since PIM2 and MAP1S are
associated with autophagy (11,22).
Autophagy may serve contrary functions in different stages of
cancer (28). Therefore, the
conclusions drawn require further investigation.
In conclusion, the present study suggested a
sensitive and accurate biomarker that may aid in the diagnosis and
prognosis of prostate cancer. However, continued study is required
to clarify the underlying molecular mechanisms by which GLTSCR1
promotes prostate cancer.
Acknowledgements
The authors would like to thank Professor Jian Huang
for their cooperation in the preparation of this manuscript.
Funding
The present study was supported by the National
Natural Science Foundation of China (grant nos. 81472382 and
81672550), the Guangdong Province Natural Science Foundation (grant
no. 2014A030313079), the Guangdong Province Science and Technology
for Social Development Project (grant nos. 2017A020215018), the
Guangzhou City in 2015 Scientific Research Project (grant no.
201510010298), the International Science and Technology Cooperation
Project of Guangdong Province Science and Technology Plan (grant
no. 2016A050502020) and the Guangzhou International Science and
Technology Cooperation Program (grant no. 201807010087).
Availability of data and materials
All data generated or analyzed during this study are
included in this published article.
Authors' contributions
Guarantor of integrity of entire study: XM, TD, DZ,
XC, Y, WW, QW, CL, ZL, HH and LL. Study concepts: XM, TD and DZ.
Study design: XM, TD, DZ, HH and LL. Literature research: XM, TD
and DZ. Experimental studies: XC, YL, WW, QW, CL and ZL. Data
acquisition: XC, YL, WW, QW, CL and ZL. Data
analysis/interpretation: XC, YL, WW, QW, CLZL, HH and LL.
Statistical analysis: XC, YL, WW, QW, CL and ZL. Manuscript
preparation: XM, TD and DZ. Manuscript definition of intellectual
content: XM, TD, DZ and HH. Manuscript editing: XM, TD and DZ.
Manuscript revision/review: HH and LL. Manuscript final version
approval: HH and LL.
Ethics approval and consent to
participate
Ethical approval was obtained for this study from
Ethics Committee of Sun Yat-Sen Memorial Hospital, Sun Yat-Sen
University.
Patient consent for publication
Not applicable.
Competing interests
The authors declare that they have no competing
interests.
References
|
1
|
Siegel R, Naishadham D and Jemal A: Cancer
statistics, 2013. CA Cancer J Clin. 63:11–30. 2013. View Article : Google Scholar : PubMed/NCBI
|
|
2
|
Siegel RL, Miller KD and Jemal A: Cancer
statistics, 2017. CA Cancer J Clin. 67:7–30. 2017. View Article : Google Scholar : PubMed/NCBI
|
|
3
|
Center MM, Jemal A, Lortet-Tieulent J,
Ward E, Ferlay J, Brawley O and Bray F: International variation in
prostate cancer incidence and mortality rates. Eur Urol.
61:1079–1092. 2012. View Article : Google Scholar : PubMed/NCBI
|
|
4
|
Cuzick J, Thorat MA, Andriole G, Brawley
OW, Brown PH, Culig Z, Eeles RA, Ford LG, Hamdy FC, Holmberg L, et
al: Prevention and early detection of prostate cancer. Lancet
Oncol. 15:e484–e492. 2014. View Article : Google Scholar : PubMed/NCBI
|
|
5
|
Abdollah F, Sun M, Schmitges J, Thuret R,
Bianchi M, Shariat SF, Briganti A, Jeldres C, Perrotte P, Montorsi
F and Karakiewicz PI: Survival benefit of radical prostatectomy in
patients with localized prostate cancer: Estimations of the number
needed to treat according to tumor and patient characteristics. J
Urol. 188:73–83. 2012. View Article : Google Scholar : PubMed/NCBI
|
|
6
|
Molitierno J, Evans A, Mohler JL, Wallen
E, Moore D and Pruthi RS: Characterization of biochemical
recurrence after radical prostatectomy. Urol Int. 77:130–134. 2006.
View Article : Google Scholar : PubMed/NCBI
|
|
7
|
Shariat SF, Karakiewicz PI, Roehrborn CG
and Kattan MW: An updated catalog of prostate cancer predictive
tools. Cancer. 113:3075–3099. 2008. View Article : Google Scholar : PubMed/NCBI
|
|
8
|
Stephenson AJ, Scardino PT, Eastham JA,
Bianco FJ Jr, Dotan ZA, DiBlasio CJ, Reuther A, Klein EA and Kattan
MW: Postoperative nomogram predicting the 10-year probability of
prostate cancer recurrence after radical prostatectomy. J Clin
Oncol. 23:7005–7012. 2005. View Article : Google Scholar : PubMed/NCBI
|
|
9
|
Lilja H, Ulmert D and Vickers AJ:
Prostate-specific antigen and prostate cancer: Prediction,
detection and monitoring. Nat Rev Cancer. 8:268–278. 2008.
View Article : Google Scholar : PubMed/NCBI
|
|
10
|
Velonas VM, Woo HH, dos Remedios CG and
Assinder SJ: Current status of biomarkers for prostate cancer. Int
J Mol Sci. 14:11034–11060. 2013. View Article : Google Scholar : PubMed/NCBI
|
|
11
|
Liu L, McKeehan WL, Wang F and Xie R:
MAP1S enhances autophagy to suppress tumorigenesis. Autophagy.
8:278–280. 2012. View Article : Google Scholar : PubMed/NCBI
|
|
12
|
Jiang X, Zhong W, Huang H, He H, Jiang F,
Chen Y, Yue F, Zou J, Li X, He Y, et al: Autophagy defects
suggested by low levels of autophagy activator MAP1S and high
levels of autophagy inhibitor LRPPRC predict poor prognosis of
prostate cancer patients. Mol Carcinog. 54:1194–1204. 2015.
View Article : Google Scholar : PubMed/NCBI
|
|
13
|
Smith JS, Tachibana I, Pohl U, Lee HK,
Thanarajasingam U, Portier BP, Ueki K, Ramaswamy S, Billings SJ,
Mohrenweiser HW, et al: A transcript map of the chromosome 19q-arm
glioma tumor suppressor region. Genomics. 64:44–50. 2000.
View Article : Google Scholar : PubMed/NCBI
|
|
14
|
Yang P, Kollmeyer TM, Buckner K, Bamlet W,
Ballman KV and Jenkins RB: Polymorphisms in GLTSCR1 and ERCC2 are
associated with the development of oligodendrogliomas. Cancer.
103:2363–2372. 2005. View Article : Google Scholar : PubMed/NCBI
|
|
15
|
Neville PJ, Conti DV, Krumroy LM, Catalona
WJ, Suarez BK, Witte JS and Casey G: Prostate cancer aggressiveness
locus on chromosome segment 19q12-q13.1 identified by linkage and
allelic imbalance studies. Genes Chromosomes Cancer. 36:332–339.
2003. View Article : Google Scholar : PubMed/NCBI
|
|
16
|
Slager SL, Schaid DJ, Cunningham JM,
McDonnell SK, Marks AF, Peterson BJ, Hebbring SJ, Anderson S,
French AJ and Thibodeau SN: Confirmation of linkage of prostate
cancer aggressiveness with chromosome 19q. Am J Hum Genet.
72:759–762. 2003. View
Article : Google Scholar : PubMed/NCBI
|
|
17
|
Epstein JI, Feng Z, Trock BJ and
Pierorazio PM: Upgrading and downgrading of prostate cancer from
biopsy to radical prostatectomy: Incidence and predictive factors
using the modified Gleason grading system and factoring in tertiary
grades. Eur Urol. 61:1019–1024. 2012. View Article : Google Scholar : PubMed/NCBI
|
|
18
|
Partin AW, Kattan MW, Subong EN, Walsh PC,
Wojno KJ, Oesterling JE, Scardino PT and Pearson JD: Combination of
prostate-specific antigen, clinical stage, and gleason score to
predict pathological stage of localized prostate cancer. A
multi-institutional update. JAMA. 277:1445–1451. 1997. View Article : Google Scholar : PubMed/NCBI
|
|
19
|
Xie ZC, Li TT, Gan BL, Gao X, Gao L, Chen
G and Hu XH: Investigation of miR-136-5p key target genes and
pathways in lung squamous cell cancer based on TCGA database and
bioinformatics analysis. Pathol Res Pract. 214:644–654. 2018.
View Article : Google Scholar : PubMed/NCBI
|
|
20
|
Guo Z, Chen X, Du T, Zhu D, Lai Y, Dong W,
Wu W, Lin C, Liu L and Huang H: Elevated levels of epithelial cell
transforming sequence 2 predicts poor prognosis for prostate
cancer. Med Oncol. 34:132017. View Article : Google Scholar : PubMed/NCBI
|
|
21
|
Zhang KX, Firus J, Prieur B, Jia W and
Rennie PS: To die or to survive, a fatal question for the destiny
of prostate cancer cells after androgen deprivation therapy.
Cancers (Basel). 3:1498–1512. 2011. View Article : Google Scholar : PubMed/NCBI
|
|
22
|
Rahman S, Sowa ME, Ottinger M, Smith JA,
Shi Y, Harper JW and Howley PM: The Brd4 extraterminal domain
confers transcription activation independent of pTEFb by recruiting
multiple proteins, including NSD3. Mol Cell Biol. 31:2641–2652.
2011. View Article : Google Scholar : PubMed/NCBI
|
|
23
|
Adam K, Lambert M, Lestang E, Champenois
G, Dusanter-Fourt I, Tamburini J, Bouscary D, Lacombe C, Zermati Y
and Mayeux P: Control of Pim2 kinase stability and expression in
transformed human haematopoietic cells. Biosci Rep. 35:e002742015.
View Article : Google Scholar : PubMed/NCBI
|
|
24
|
Xu J, Zhang T, Wang T, You L and Zhao Y:
PIM kinases: An overview in tumors and recent advances in
pancreatic cancer. Future Oncol. 10:865–876. 2014. View Article : Google Scholar : PubMed/NCBI
|
|
25
|
Yu Z, Zhao X, Huang L, Zhang T, Yang F,
Xie L, Song S, Miao P, Zhao L, Sun X, et al: Proviral insertion in
murine lymphomas 2 (PIM2) oncogene phosphorylates pyruvate kinase
M2 (PKM2) and promotes glycolysis in cancer cells. J Biol Chem.
288:35406–35416. 2013. View Article : Google Scholar : PubMed/NCBI
|
|
26
|
Ren K, Gou X, Xiao M, Wang M, Liu C, Tang
Z and He W: The over-expression of Pim-2 promote the tumorigenesis
of prostatic carcinoma through phosphorylating eIF4B. Prostate.
73:1462–1469. 2013. View Article : Google Scholar : PubMed/NCBI
|
|
27
|
Bohensky J, Shapiro IM, Leshinsky S,
Watanabe H and Srinivas V: PIM-2 is an independent regulator of
chondrocyte survival and autophagy in the epiphyseal growth plate.
J Cell Physiol. 213:246–251. 2007. View Article : Google Scholar : PubMed/NCBI
|
|
28
|
Amaravadi R, Kimmelman AC and White E:
Recent insights into the function of autophagy in cancer. Genes
Dev. 30:1913–1930. 2016. View Article : Google Scholar : PubMed/NCBI
|