Introduction
Cancer cells use exceptionally high rates of glucose
catabolism to produce ATP, NADPH, and anabolic building blocks
needed for the production of daughter cells, a metabolic phenotype
termed ‘the Warburg effect’ (1–3). Although
the Warburg effect was originally attributed to mitochondrial
defects compromising oxidative phosphorylation, it is now
appreciated to occur in cells with competent oxidative
phosphorylation (4). Strategies
targeting the Warburg effect by inhibiting glucose fermentation and
shifting cellular metabolism toward oxidative phosphorylation can
slow the growth of cancer cells (5,6). Since
hypoxia inducible factor-1 plays a key role in establishing the
Warburg phenotype, this protein in particular is an important
target for inhibiting cancer growth (7,8).
The plant polyphenol resveratrol (RES) inhibits cell
cycle progression (9) and thus
proliferative growth in many cancer cell lines (10). Coincident with these growth inhibitory
effects, RES promotes mitochondria network fusion (11), mitochondrial biogenesis, and oxidative
phosphorylation (12) in a variety of
cancer cell lines. Thus, RES appears to reverse the Warburg effect
in many cancer cells. RES has also been reported to reduce HIF-1α
expression in vitro (13) and
in vivo (14), suggesting that
this could underlie the metabolic phenotype.
Here we used PC3 prostate cancer cells, in which RES
inhibits growth and reduces HIF-1α levels to investigate the
interactions between RES's effects on the metabolic phenotype and
growth. We show that the inhibition of PC3 cell growth by treatment
with 10 µM RES is coincident with increased mitochondrial network
fusion, biogenesis, and respiration. We then prevented RES-induced
metabolic switching from the glycolytic to oxidative metabolism by
growing cells in galactose medium, which does not support glucose
fermentation (15) or stabilizing
HIF-1α using pharmacological or genetic approaches. Under these
conditions, the effects of RES on growth and metabolism were either
attenuated or abolished. These observations suggest that the
metabolic and growth effects of RES on PC3 cells are
inter-dependent. The ability of RES to reduce HIF-1α levels
suggests that it could be particularly effective in hypoxic
conditions, as are common in growing tumours. Indeed, RES inhibited
PC3 cell growth more strongly and at lower concentrations under
hypoxic conditions. These observations have important implications
for understanding how RES may inhibit cancer growth under
conditions prevailing in vivo.
Materials and methods
Materials
Dulbecco's modified Eagle's medium (DMEM) high
glucose (4,500 mg/l) containing L-glutamine, sodium pyruvate and
sodium bicarbonate (cat. no. D6429), supplement-free DMEM powdered
media (cat. no. D5030), fetal bovine serum (cat. no. F1051),
non-essential amino acids, penicillin/streptomycin solution, 0.25%
trypsin/EDTA solution, bovine serum albumin (BSA), Glucose Oxidase
from Aspergillus niger (cat. no. G2133), Horseradish
Peroxidase (2KU; cat. no. P6140), Bradford reagent (cat. no.
B6916), IOX2 (cat. no. SML0652), MG132 (cat. no. C2211) and
deferoxamine mesylate salt (DFO; cat. no. D9533) were obtained from
Sigma-Aldrich (Merck KGaA, Darmstadt, Germany).
trans-Resveratrol (Product no. 70675) and Amplex Red reagent
were purchased from Cayman Chemical (Ann Arbor, MI, USA).
Dimethylsufoxide (DMSO), DL-dithiothreitol (DTT), Bradford reagent,
D-galactose, L-glutamine, HEPES
[(4-(2-hydroxyethyl)-1-piperazineethanesulfonic acid] and Trypan
blue were obtained from BioShop (Burlington, ON, Canada). Tissue
culture dishes (100×20 mm and 60×15 mm) and cell scrapers were
obtained from Sarstedt, Inc (Newton, SC, USA). MitoTracker Red
CMXRos and Lipofectamine 2000 transfection reagent was purchased
from Life Technologies Incorporated (Burlington, ON, Canada). Mouse
anti-human HIF-1α (Product no. 610958; Lot no. 5174837 and Product
no. 610959; Lot no. 4073775) was obtained from BD Biosciences
(Franklin Lakes, NJ, USA). Rabbit polyclonal Lamin B1 antibody
(Product no. ab16048; Lot no. GR-263244-1) was obtained from Abcam
(Cambridge, UK). Ham's F12 Nutrient Mix powdered media (cat. no.
21700-075) and Alexa Fluor® 647-conjugated secondary
(IgG) antibody against mouse (cat. no. A-31571; Lot no. 1069838)
were purchased from Thermo Fisher Scientific, Inc. (Waltham, MA,
USA). HA-HIF1α-pcDNA3 (plasmid no. 18949), and HA-HIF1α
P402A/P564A-pcDNA3 (plasmid no. 18955) were purchased from Addgene
(Cambridge, MA, USA). Human HIF-1α recombinant protein (cat. no.
GWB-184E1F) was purchased from GenWay Biotech, Inc. (San Diego, CA,
USA).
Cell lines and culture conditions
PC3, LNCaP, C2C12, and SHSY5Y cell lines were
acquired from ATCC and cultured in high glucose DMEM unless
otherwise indicated. For experiments performed in galactose medium,
cells grown in glucose were harvested and then seeded in
glucose-free DMEM supplemented with 10 mM galactose, 6 mM
L-glutamine, 10 mM HEPES, 1 mM sodium pyruvate for at least 3 days
before starting experiments. Cells were cultured at 37°C in
humidified 5% CO2 atmosphere, 18% O2
atmosphere, unless otherwise indicated. Cell density and population
doubling time were determined by hemocytometer counting using
trypan blue exclusion to identify live cells. Treatments were added
directly to the culture media for 48 h. Media and treatments were
refreshed every day.
Hypoxia conditions
For atmospheric hypoxia experiments, cells were
grown within a humidified hypoxia modulator incubator chamber
(MIC-101; Billups-Rothenberg, Del Mar, CA, USA) maintained at ≤0.4
O2%, 5% CO2 with the aid of a Roxy-1
Universal O2 Controller (Sable Systems, North Las Vegas,
NV, USA). Culture media was refreshed daily with pre-conditioned
hypoxic media kept in the same chamber. Alternatively, in some
experiments (where indicated) ‘pseudo-hypoxia’ was induced through
chemical means via treatment with the PHD inhibitor IOX2 (25 µM).
Cells were incubated overnight with IOX2 prior to commencing
experiments of interest.
Preparation of whole cell lysates
Cells were harvested and washed in PBS then lysed in
ice cold lysis buffer (10 mM Tris pH 8.0, 150 mM NaCl, 2 mM EDTA, 2
mM DTT, 40% glycerol (v/v), 0.5% (v/v) NP40) with
either periodic vortexing or sonication (Sonicator W-375; setting
3; Heat Systems Ultrasonics Inc., Wehnrath, Germany) for 30 min on
ice. Subsequently, lysates were centrifuged at 10,000 × g at 4°C
for 10 min (IEC, Micromax/Micromax RF; Thermo Fisher Scientific,
Inc.) and the pellet discarded. The protein concentration of the
resulting supernatant was determined by the Bradford method. BSA
was used as the protein standard. Cell lysates were stored at
−80°C.
Preparation of nuclear lysates
Cells were lysed on the plate with cold
homogenization buffer (10 mM HEPES pH 7.9, 1.5 mM MgCl2,
10 mM KCl, 2 mM DTT, 2 mM MG132, 200 µM DFO), with subsequent
centrifugation at 450 g for 5 min. After centrifugation, the cell
pellet was resuspended in 200 µl homogenization buffer and
disrupted with the aid of a pre-chilled glass pestle and tube. The
homogenate was then centrifuged for 10 min at 10,000 × g at 4°C and
the pellet was gently re-suspended in 150 µl of extraction buffer
(20 mM HEPES pH 7.9, 1.5 mM MgCl2, 1.4 M KCl, 0.2 mM
EDTA, 25% glycerol, 2 mM dithiothreithol, 2 mM MG132, 200 µM DFO),
followed by a 30 min incubation on ice in an orbital shaker (Madell
Corporation, USA). After incubation, cell lysates were centrifuged
at 15,000 × g (4°C) for 30 min (IEC Micromax/Micromax RF; Thermo
Fisher Scientific, Inc.). The supernatant was then transferred to a
fresh centrifuge tube and stored at −80°C.
Lactate Dehydrogenase (LDH)
activity
LDH activity was measured in a solution containing
20 mM HEPES buffer (pH 7.3), 0.2 mM NADH, 10 mM pyruvate and 5 µg
of sample protein. The conversion of NADH to NAD+ after
pyruvate addition was followed spectrophotometrically (340 nm)
using a Varian Cary 100 UV-visible spectrophotometer (Agilent
Technologies, Inc., Santa Clara, CA, USA). Assays were performed at
30°C.
Western blots
Nuclear lysates were electrophoresed in a 6%
SDS-PAGE gel and electroblotted onto a polyvinylidene fluoride
membrane using a Bio-Rad Trans-Blot semi-dry transfer apparatus.
Membranes were blocked for an hour at room temperature and
incubated overnight at 4°C independently with primary antibodies to
HIF-1α (1:100; w/v) or the nuclear loading control Lamin B1
(1:500; w/v). Incubations with either an Alexa Fluor
647-conjugated anti-mouse antibody (1:500; w/v) or an
infrared fluorophore-conjugated anti-rabbit antibody (1:1,000;
w/v) were performed at room temperature (2 h). Membranes
were visualized using a VersaDoc MP 4000 Imaging System (Bio-Rad
Laboratories, Inc., Hercules, CA, USA).
Glucose oxidase activity
Cellular glucose uptake was assessed by observing
the generation of Amplex Red reagent red-fluorescent oxidation
product, resorufin, in a Varian Cary Eclipse fluorescence
spectrophotometer equipped with a microplate reader (Agilent
Technologies, Inc.). Briefly, 5×10⁵ cells were seeded in
high glucose DMEM and then treated with either RES or DMSO for 48 h
at 0.4% O2 (hypoxia). After 48 h the cells were
incubated under the same conditions for 5 h in a 5 mM glucose
media. A sample of the media was then mixed with a solution
containing HEPES buffer (20 mM, pH 7.3), Glucose oxidase from
Aspergillus niger (0.1 U/ml), Horseradish peroxidase (0.2
U/ml) and Amplex Red (50 µM). The formation rate of resorufin was
continuously measured for a period of 3 min by using excitation and
emission wavelengths of 535 nm and 595 nm, respectively. Maximal
reaction rates [Arbitrary Fluorescence Units (AFU) per minute] were
calculated during the reaction linear range by using the Cary
Eclipse Kinetics software (Walnut Creek, CA, USA). For each
experiment a standard curve was used to quantify glucose
concentration in media. At the end of each experiment, cells were
counted in order to assess cell density and glucose uptake was
converted into nmol glucose·106
cells−1·min−1.
Plasmid DNA transfections
HA-HIF1α P402A/P564A-pcDNA3 (Addgene plasmid no.
18955) and HA-HIF1α-pcDNA3 (Addgene plasmid no. 18949) were gifts
from William Kaelin. pC1-Hyper-3 (Addgene plasmid no. 42131) was a
gift from Vsevolov Belousov. Plasmid DNA was initially isolated and
purified from bacterial cultures via a plasmid DNA Miniprep kit
(Norgen Biotek Corp., Thorold, ON, Canada). Plasmid DNA purity (260
nm/280 nm absorbance ratio) and concentration were assessed by
using a NanoPhotometer (Montreal Biotech Inc., Dorval, QC, Canada)
Transfections were performed with Lipofectamine 2000 reagent in
accordance with manufacturer's instructions. PC3 cells stably
expressing HA-HIF1α P402A/P564A-pcDNA3 or HA-HIF1α-pcDNA3 were
selected and maintained with G418.
Fluorescence microscopy and image
analysis
Fluorescence images using structured illumination of
live PC3 cells were obtained using a Zeiss Axio Observer. Z1
inverted light/epifluorescence microscope equipped with ApoTome.2
optical sectioning and a Hamamatsu ORCA-Flash4.0 V2 digital camera.
Cells were cultured on MatTek 35 mm poly-D-lysine-coated glass
bottom culture dishes with phenol red-free culture media and were
viewed with a Plan-Apochromat 63×/1.40 oil objective. The
microscope stage was maintained at 37°C and 5% CO2
(O2 levels were not regulated). MitoTracker Red CMXRos
signal was imaged using excitation and emission wavelengths of 587
nm and 610 nm, respectively. Mitochondrial network morphology in
MitoTracker Red-labelled PC3 cells were quantitatively analyzed
using the ImageJ tool ‘MiNA’ (16).
Cell cycle analysis
Approximately 5×10⁵ cells were harvested
via trypsinization and centrifugation (5 min at 240 × g). The
resulting pellets were washed once with PBS and then fixed via
drop-wise addition of ice-cold ethanol (75% v/v) with
routine vortexing. After an overnight incubation at −20°C, the
suspension was centrifuged (5 min at 240 × g) and washed twice with
ice-cold PBS. The fixed cells were then incubated with 0.5 ml
Propidium Iodide (PI)/RNase Staining Buffer (BD Pharmingen, San
Diego, CA, USA) in darkness at room temperature for 15 min. The DNA
content was immediately measured using a BD Accuri C6 flow
cytometer (BD Biosciences, San Jose, CA, USA). The PI signal was
detected using a 562–588 nm band pass filter. For each sample,
100,000 events were recorded using a medium data acquisition rate,
as per the manufacturer guidelines. The percentages of cells in
G0-G1, S, and G2-M phases were determined using the CFlow Plus
software (BD Biosciences).
Cellular respiration measurements
Oxygen consumption rates of intact cultured cells
were measured using a Clark-type oxygen electrode (Rank Brothers
Dual Digital Model 20 Respirometer; Bottisham, UK) within a chamber
maintained at 37°C. Cells were harvested via trypsinization and
centrifugation before being re-suspended in 1 ml of complete
culture media. The chamber was capped and the rate of oxygen
consumption was recorded via an attached polygraph unit. All
respiration rates were converted to nanomoles O2
consumed·minute−1·106 cells−1.
Statistics
Where T-tests were performed, they were done using
Microsoft Excel (Redmond, USA). t-tests (unpaired, two-tailed) were
used for data sets containing two experimental groups. P<0.05
was considered to indicate a statistically significant difference.
For data sets including more than two experimental groups, ANOVA
followed by Bonferroni comparisons of means were performed using
GraphPad Prism 5 software (GraphPad Software, Inc., La Jolla, CA,
USA).
Results
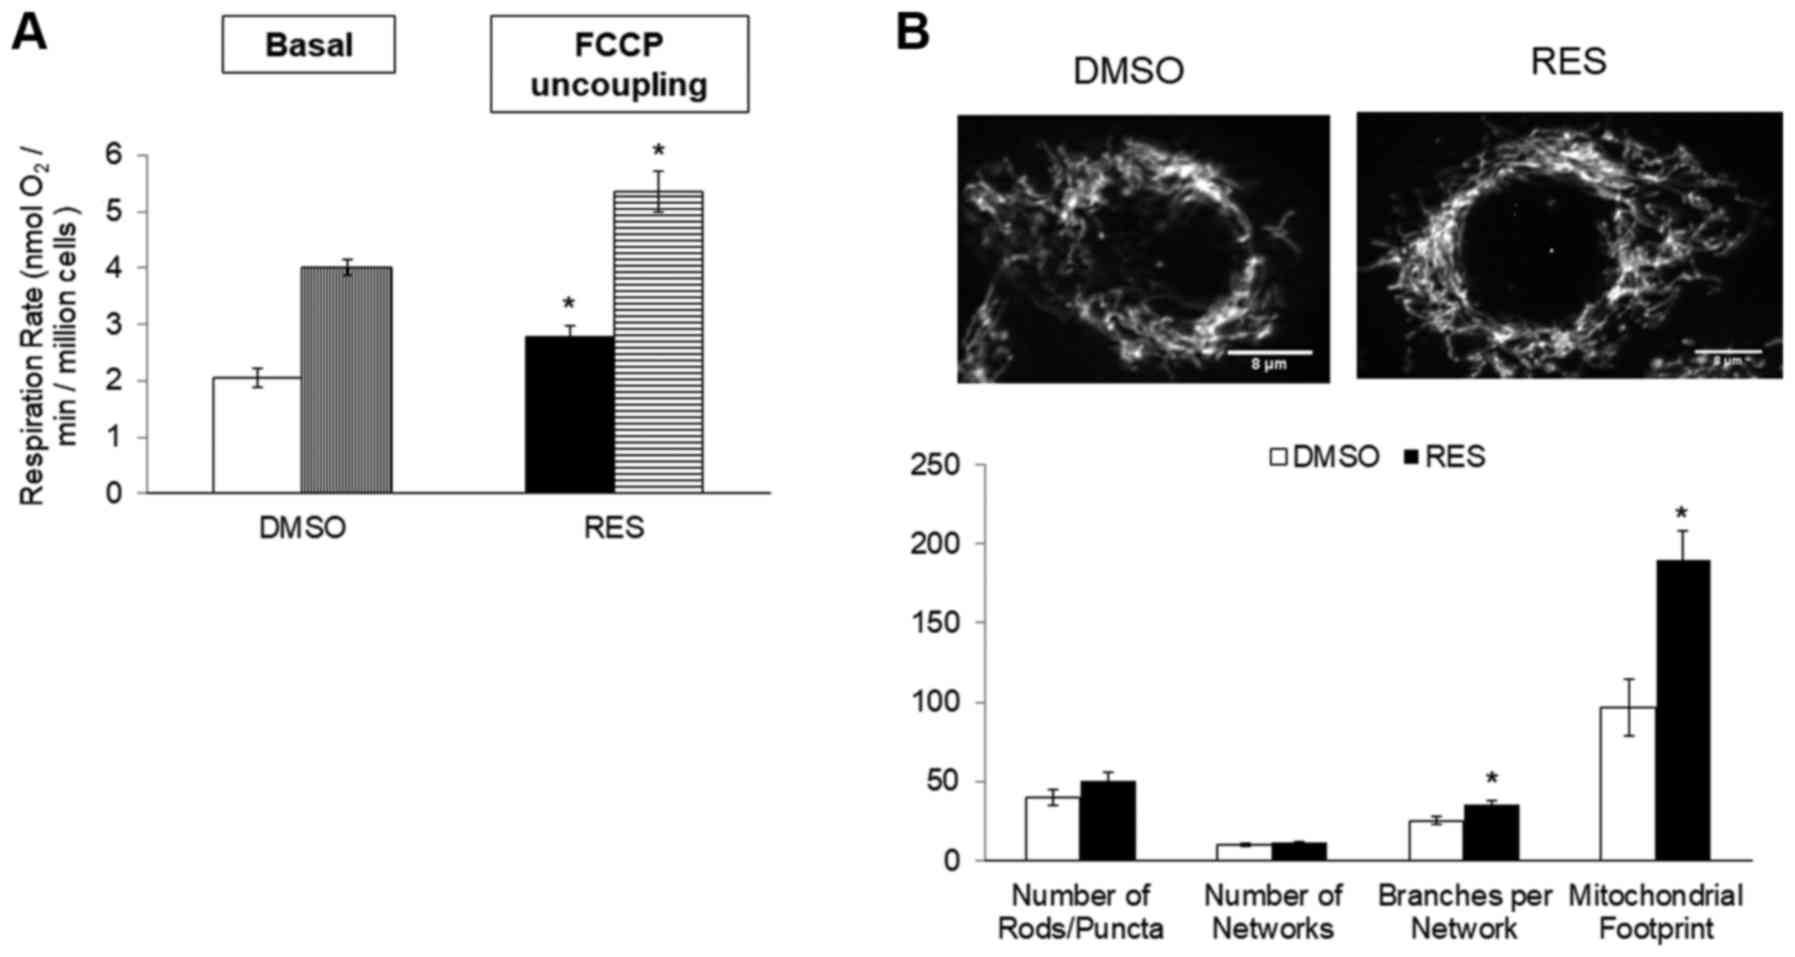
In PC3 cells growing in high glucose media, 48 h
treatment with 10 µM RES stimulated cellular respiration rates
(Fig. 1A), mitochondrial biogenesis
(measured here as ‘mitochondrial footprint’, i.e., area of cell
image occupied by mitochondria, Fig.
1B) and increased the mean mitochondrial network size (number
of branches per network, Fig. 1B).
Coincidentally, growth rates were reduced (Fig. 1C) and cells accumulated in G0/G1 phase
(Fig. 1D).
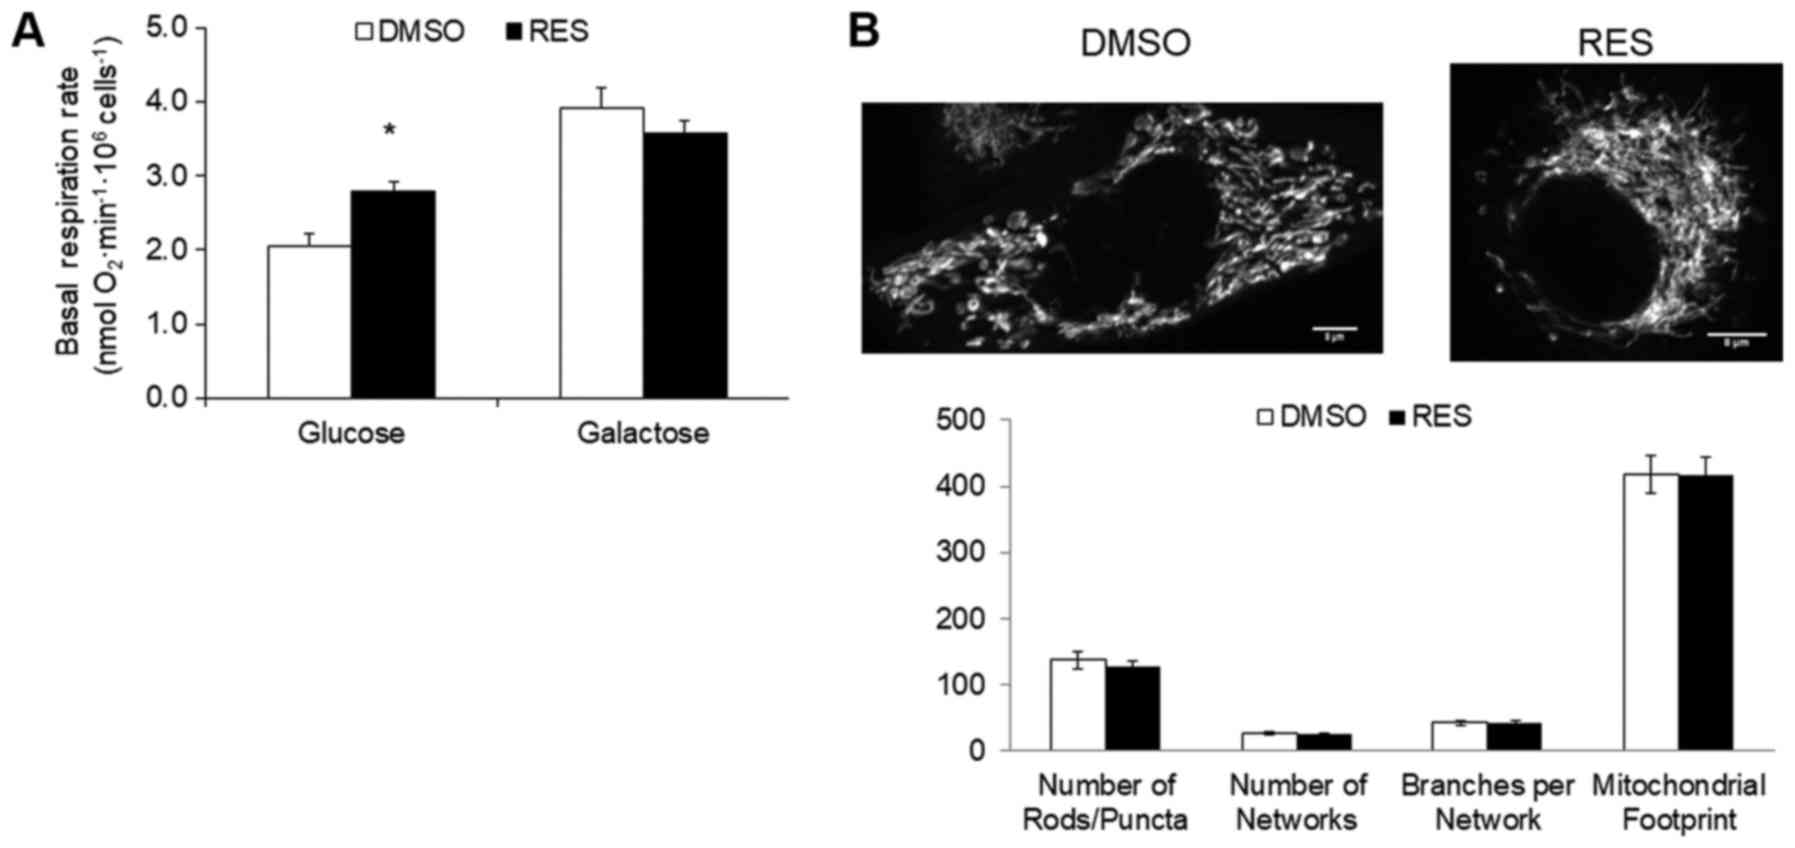
To investigate the potential role of the metabolic
shift toward oxidative phosphorylation in RES's growth effects, the
experiment was repeated using PC3 cells cultured in the same medium
but with galactose replacing glucose as carbon fuel. Cells growing
in galactose medium cannot meet ATP demand by glucose fermentation
and become reliant on oxidative phosphorylation (15). Growth in galactose medium increased
respiration rates relative to high glucose medium (Fig. 2A), but abolished the RES effect on
these rates. Similarly, while the mitochondrial footprint (Fig. 2B) was greater in galactose medium
compared to glucose medium, the effect of RES on this parameter was
absent. Other mitochondrial network features were also not affected
by RES treatment in cells growing in galactose (Fig. 2B). Coincidentally with the absence of
metabolic effects, RES did not inhibit PC3 cell growth (Fig. 2C) or cell cycle distribution (Fig. 2D) in galactose medium. Thus, in the
absence of a switch between glycolytic and oxidative metabolism RES
had no metabolic or growth effects.
Given the role of HIF-1 as a metabolic regulator,
and previous reports of RES effects on HIF-1 activity (17,18), we
hypothesized that the metabolic switch observed with RES involves
HIF-1 regulation. HIF-1 heterodimer activity is regulated by HIF-1α
levels, which are in turn regulated by the hydroxylation by prolyl
hydroxylases (PHDs) of key prolines 402 and 564. We used two
strategies to prevent this proline hydroxylation and thus stabilize
HIF-1α in PC3 cells growing in high glucose medium: PC3 cells were
either stably transfected with a mutant HIF-1α lacking prolines 402
and 564 (19), or were treated
throughout the experiment with IOX2. IOX2 is a selective PHD
inhibitor that stabilizes HIF-1α in normoxia (20).
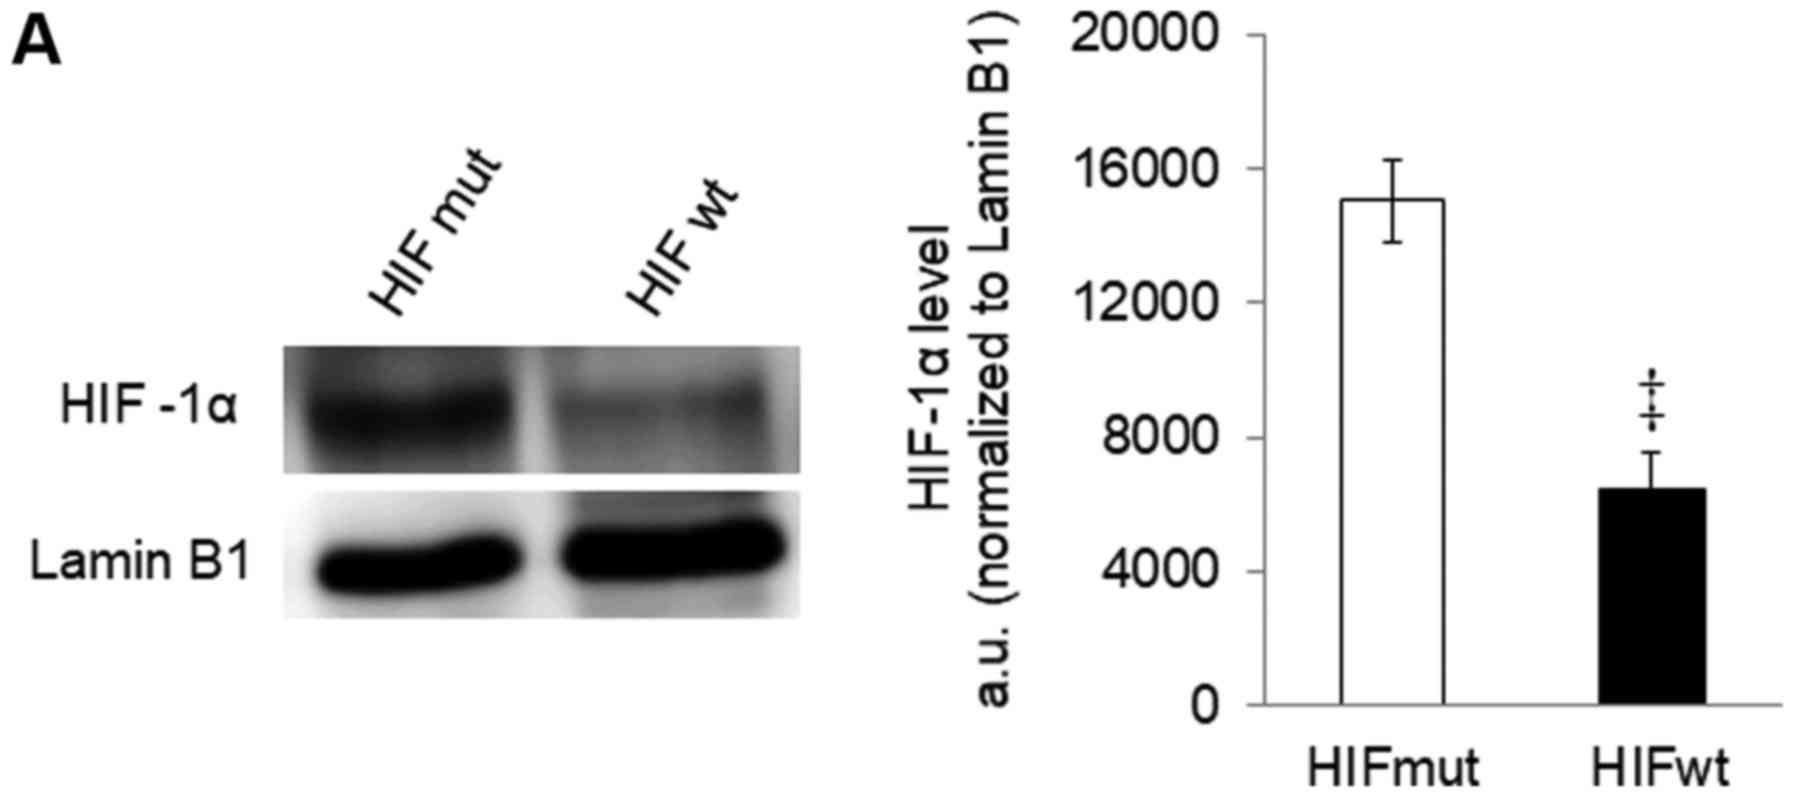
HIF-1α was detectable in cells stably expressing the
mutant protein (Fig. 3A). In these
cells, the effects of RES on respiration (Fig. 3B) and mitochondrial network
characteristics (Fig. 3C) were
absent. The effects of RES on cell growth (Fig. 3D) and cell cycle distribution
(Fig. 3E) were reduced in PC3 cells
expressing mutant HIF-1α, though they were not absent entirely.
Interestingly, rather than accumulating in G0/G1 phase cells
expressing the RES treated HIF-1α mutants showed a slight
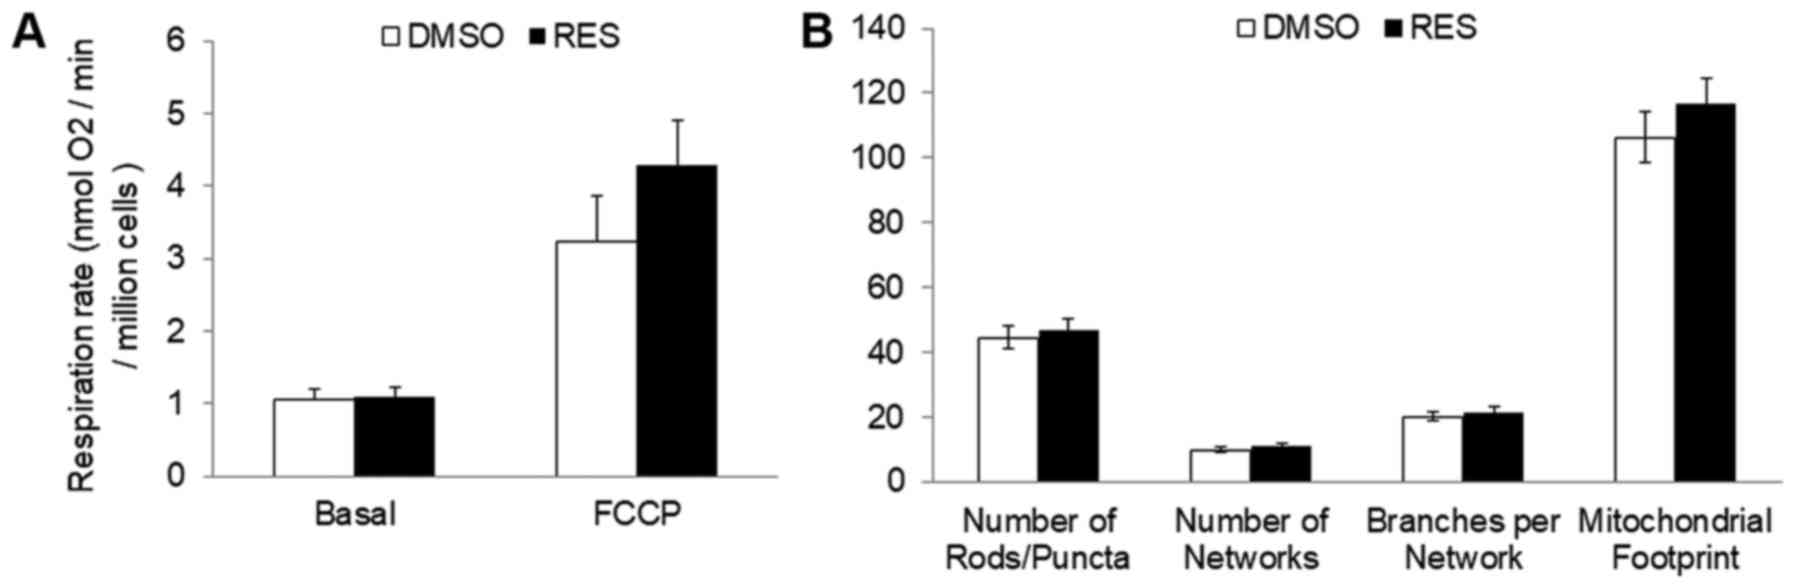
accumulation in S-phase. Similar results were observed using IOX2,
with the exception that this treatment more fully abolished RES's
effects on respiration (Fig. 4A) and
mitochondrial network characteristics (Fig. 4B). The effects of RES on cell growth
(Fig. 4C) were reduced in PC3 cells
treated with IOX2, while RES effects on cell cycle distribution
appear to be absent (Fig. 4D). To
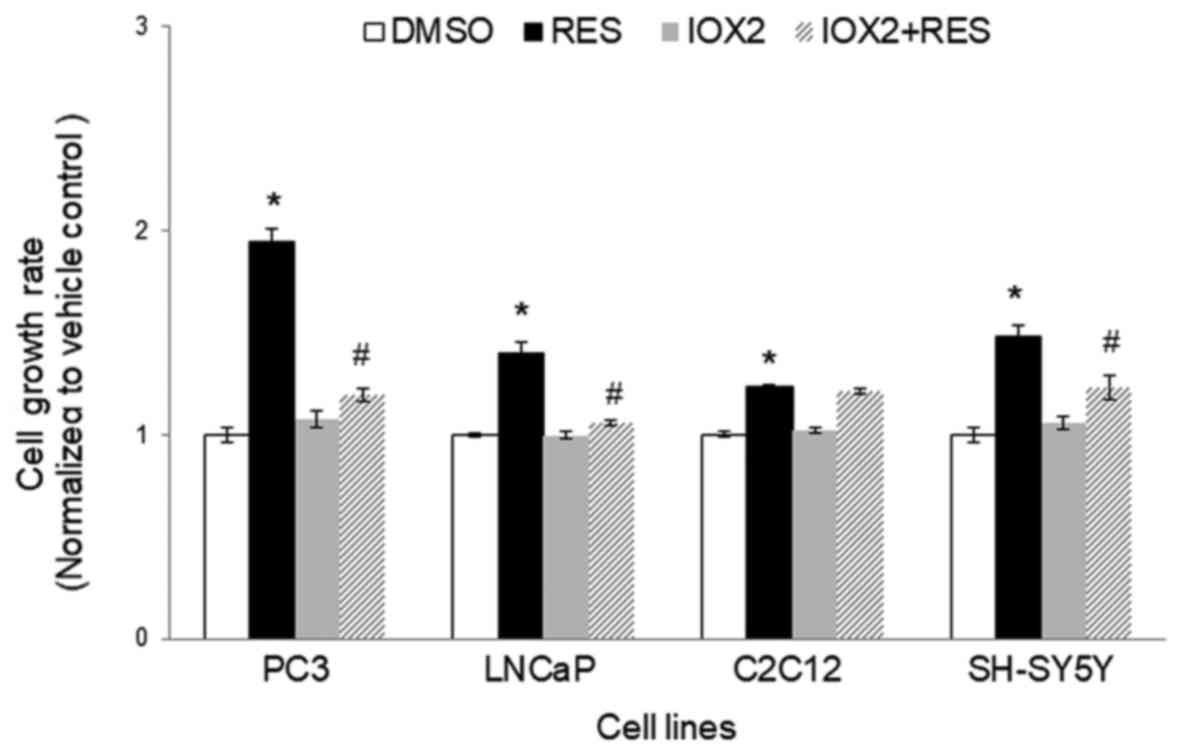
determine whether the ability of IOX2 to modulate RES's growth
effects were specific to PC3 cells, this experiment was repeated
with another prostate cancer cell line (LNCaP), and two
non-prostate cancer cell lines: C2C12 mouse myoblasts and SHSY5Y
human neuroblastoma. Interestingly, although IOX2 similarly
abolished RES's effect on growth in LNCaP cells, it was either
partially effective or ineffective in the two non-prostate cancer
cell lines (Fig. 5).
Given the implication of HIF-1 in mediating RES's
effects on PC3 cells, we hypothesized that RES might be a
particularly effective inhibitor of PC3 cell growth under hypoxic
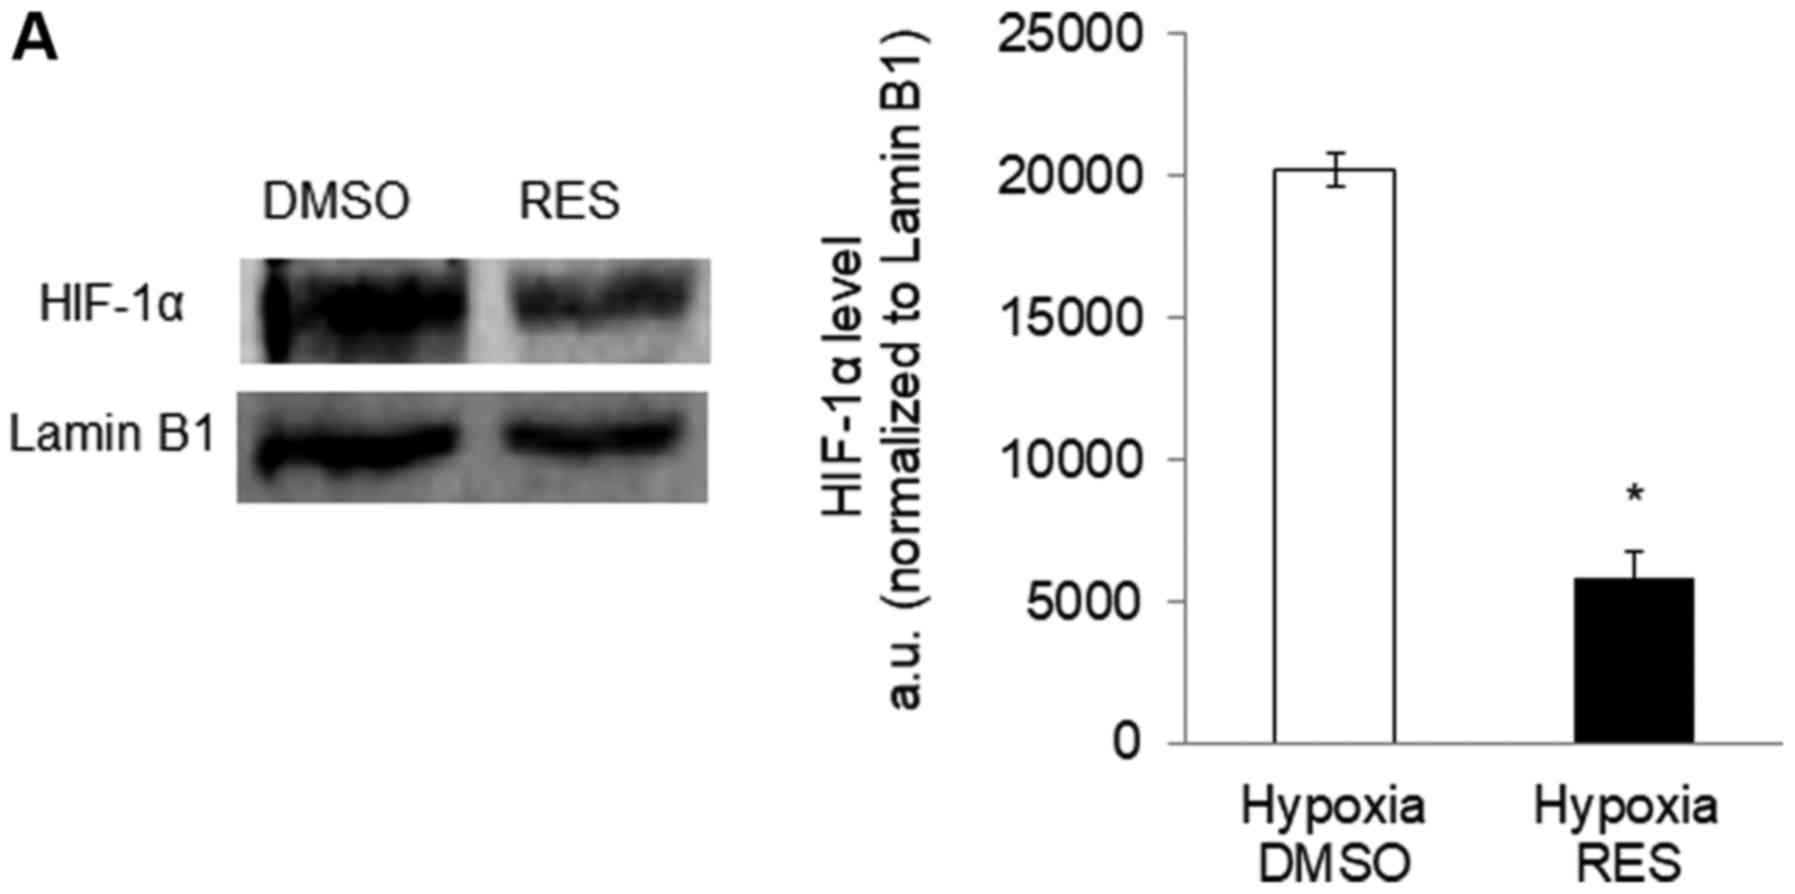
conditions, as would be prevalent in vivo (21). Indeed, RES treatment prevented the
stabilization of HIF-1α under hypoxia (Fig. 6A and B), prevented the increase in LDH
activity (Fig. 6C), associated with
hypoxia and reduced the rate of glucose import (Fig. 6D). RES strongly inhibited PC3 cell
growth under hypoxic conditions (Fig.
6E). Importantly, PC3 cell growth under hypoxic conditions was
inhibited at lower concentrations of RES (Fig. 6F).
Discussion
Cancer cells are generally typified by a high flux
of glucose through glycolysis and the pentose phosphate pathway and
this metabolic predisposition has emerged as a pharmacological
target (22,23). Strategies aimed at inhibiting these
pathways and/or shifting glucose catabolism toward complete
mitochondrial oxidation have been effective in slowing cancer cell
and tumour growth (5,6,24).
In our experiments, RES treatment stimulated a shift
toward oxidative metabolism in PC3 cells concomitantly with the
inhibition of growth, and when this metabolic shift was absent
growth effects were also absent. The RES effects on PC3 cell
mitochondrial and growth characteristics were completely abolished
when the cells were grown in galactose medium containing no
glucose. Growth of mammalian cells in galactose medium increases
the contribution of oxidative phosphorylation to glucose oxidation
(15), apparently related to the
relatively slow multi-step Leloir pathway converting galactose to
glucose-1-phosphate (25) that limits
rates of ATP synthesis from glycolysis. PC3 cells grown in
galactose had higher rates of respiration and more mitochondria
(mitochondrial footprint, Fig. 2),
suggesting the metabolic shift toward oxidative metabolism observed
in glucose-grown PC3 cells treated with RES was already present.
The inability of RES to affect cell growth under these conditions
suggests that the metabolic shift from glucose fermentation to
oxidation is an essential component of RES's growth inhibition
effect. Interestingly, we have observed similar results previously
(26); rho° PC3 cells that are unable
to respire also show no growth inhibition by RES. Similarly, mouse
embryonic fibroblast cells lacking the mitofusin-2 have compromised
respiration and growth that is insensitive to RES (11). Taken together, these observations
suggest that RES's growth inhibitory effect in PC3 cells (and
perhaps also other cell types) is related to its ability to shift
metabolism toward oxidative phosphorylation.
HIF-1 is a key mediator of the Warburg effect in
cancer cells (22,27), and thus a target of strategies to
promote oxidative metabolism and slow growth. Our results strongly
suggest that HIF-1 is involved in the metabolic switch stimulated
by RES treatment, since changes in HIF-1α stabilization were
required for RES's effects on cellular respiration, mitochondrial
network characteristics, and cell growth to manifest. The most
complete abolishment of RES's effects was observed when PHD was
inhibited by IOX2. PHD post-translationally modifies multiple
proteins to exert broad effects on cellular metabolism (28–30).
Though we focused here on HIF-1α, other PHD targets including
HIF-2α may also be involved. This could explain why HIF-1α
stabilization only partly abrogated RES's effects.
Given the evidence above for a role of PHD and
HIF-1, it follows that RES might be a particularly strong inhibitor
of growth in hypoxic PC3 cells where the importance of the HIF-1
pathway is enhanced. We found this to be the case, as PC3 cell
population doubling time (PDT) was increased by more than two-fold
in hypoxia, compared to an approximately 50% increase in PDT under
atmospheric oxygen levels. Perhaps even more importantly, much
lower concentrations of RES could elicit increases in PDT in
hypoxia (1 µM in hypoxia vs. 10 µM in atmospheric oxygen). This
observation has practical significance. One of the contradictions
apparent in the literature on RES and cancer is that, while 10–100
µM RES is typically required to slow cell growth in vitro,
the RES concentrations reached in mammalian blood plasma and
tissues in vivo are much lower (10). And yet, RES treatment by various means
has nonetheless been shown to slow tumour growth in many instances,
including prostate cancer (31). The
observation that RES interferes with HIF-1 activity may explain
this apparent disjunction, given HIF-1's role in the growth of some
cancers. In this respect, it is interesting that LNCaP cells
responded similarly to the PHD inhibitor IOX2 in terms of the RES
effect on growth, while this was largely absent in C2C12 or SHSY5Y
cells. It will be interesting to investigate the connections
between RES, HIF-1, mitochondrial respiration, and growth in other
cancer cell types in which HIF-1 is known to play a particularly
critical role (32).
Acknowledgements
Not applicable.
Funding
This study was supported by a Natural Sciences and
Engineering Research Council (NSERC) Discovery Grant to JAS
(RGPIN-2015-05645), an NSERC Undergraduate Summer Research Award to
SMS, and an Ontario Graduate Scholarship to LAM.
Availability of data and materials
The datasets used and/or analyzed during the current
study are available from the corresponding author on reasonable
request.
Authors' contributions
JS and JF conceived and supervised experiments. JF,
FM, LAM, BFT, and SMS performed experiments. JF performed all data
analyses. JS and JF wrote the manuscript.
Ethics approval and consent to
participate
Not applicable.
Patient consent for publication
Not applicable.
Conflict of interest statement
The authors declare that they have no competing
interests.
References
|
1
|
Diaz-Ruiz R, Rigoulet M and Devin A: The
warburg and crabtree effects: On the origin of cancer cell energy
metabolism and of yeast glucose repression. Biochim Biophys Acta.
1807:568–576. 2011. View Article : Google Scholar : PubMed/NCBI
|
|
2
|
Pavlova NN and Thompson CB: The emerging
hallmarks of cancer metabolism. Cell Metab. 23:27–47. 2016.
View Article : Google Scholar : PubMed/NCBI
|
|
3
|
Vander Heiden MG, Cantley LC and Thompson
CB: Understanding the warburg effect: The metabolic requirements of
cell proliferation. Science. 324:1029–1033. 2009. View Article : Google Scholar : PubMed/NCBI
|
|
4
|
Koppenol WH, Bounds PL and Dang CV: Otto
Warburg's contributions to current concepts of cancer metabolism.
Nat Rev Cancer. 11:325–337. 2011. View
Article : Google Scholar : PubMed/NCBI
|
|
5
|
Fantin VR, St-Pierre J and Leder P:
Attenuation of LDH-A expression uncovers a link between glycolysis,
mitochondrial physiology, and tumor maintenance. Cancer Cell.
9:425–434. 2006. View Article : Google Scholar : PubMed/NCBI
|
|
6
|
Le A, Cooper CR, Gouw AM, Dinavahi R,
Maitra A, Deck LM, Royer RE, Vander Jagt DL, Semenza GL and Dang
CV: Inhibition of lactate dehydrogenase A induces oxidative stress
and inhibits tumor progression. Proc Natl Acad Sci USA.
107:2037–2042. 2010. View Article : Google Scholar : PubMed/NCBI
|
|
7
|
Greer SN, Metcalf JL, Wang Y and Ohh M:
The updated biology of hypoxia-inducible factor. EMBO J.
31:2448–2460. 2012. View Article : Google Scholar : PubMed/NCBI
|
|
8
|
Masoud GN and Li W: HIF-1α pathway: Role,
regulation and intervention for cancer therapy. Acta Pharm Sin B.
5:378–389. 2015. View Article : Google Scholar : PubMed/NCBI
|
|
9
|
Han G, Xia J, Gao J, Inagaki Y, Tang W and
Kokudo N: Anti-tumor effects and cellular mechanisms of
resveratrol. Drug Discov Ther. 9:1–12. 2015. View Article : Google Scholar : PubMed/NCBI
|
|
10
|
Stuart JA and Robb EL: Bioactive
polyphenols from wine grapes. Springer Press; New York, NY: pp.
772013
|
|
11
|
Robb EL, Moradi F, Maddalena LA, Valente
AJF, Fonseca J and Stuart JA: Resveratrol stimulates mitochondrial
fusion by a mechanism requiring mitofusin-2. Biochem Biophys Res
Commun. 485:249–254. 2017. View Article : Google Scholar : PubMed/NCBI
|
|
12
|
de Oliveira MR, Nabavi SF, Manaya A,
Daglia M, Hajheydari Z and Nabavi SM: Resveratrol and the
mitochondria: From triggering the intrinsic apoptotic pathway to
inducing biogenesis, a mechanistic view. Biochim Biophys Acta.
1860:727–745. 2016. View Article : Google Scholar : PubMed/NCBI
|
|
13
|
Zhang Q, Tang X, Lu QY, Zhang ZF, Brown J
and Le AD: Resveratrol inhibits hypoxia-induced accumulation of
hypoxia-inducible factor-1alpha and VEGF expression in human tongue
squamous cell carcinoma and hepatoma cells. Mol Cancer Ther.
4:1465–1474. 2005. View Article : Google Scholar : PubMed/NCBI
|
|
14
|
Zhang M, Li W, Yu L and Wu S: The
suppressive effect of resveratrol on HIF-1α and VEGF expression
after warm ischemia and reperfusion in rat liver. PLoS One.
9:e1095892014. View Article : Google Scholar : PubMed/NCBI
|
|
15
|
Rossignol R, Gilerson R, Aggeler R,
Yamagata K, Remington SJ and Capaldi RA: Energy substrate modulates
mitochondrial structure and oxidative capacity in cancer cells.
Cancer Res. 64:985–993. 2004. View Article : Google Scholar : PubMed/NCBI
|
|
16
|
Valente AJ, Maddalena LA, Robb EL, Moradi
F and Stuart JA: A simple ImageJ macro tool for analyzing
mitochondrial network morphology in mammalian cell culture. Acta
Histochem. 119:315–326. 2017. View Article : Google Scholar : PubMed/NCBI
|
|
17
|
Huang X, Zhou J, Liu J, Tang B, Zhao F and
Qu Y: Biological characteristics of prostate cancer cells are
regulated by hypoxia-inducible factor 1α. Oncol Lett. 8:1217–1221.
2014. View Article : Google Scholar : PubMed/NCBI
|
|
18
|
Huang H, Benzonana LL, Zhao H, Watts HR,
Perry NJ, Bevan C, Brown R and Ma D: Prostate cancer cell
malignancy via modulation of HIF-1α pathway with isoflurane and
propofol alone and in combination. Br J Cancer. 111:1338–1349.
2014. View Article : Google Scholar : PubMed/NCBI
|
|
19
|
Yan Q, Bartz S, Mao M, Li L and Kaelin WG
Jr: The hypoxia-inducible factor 2alpha N-terminal and C-terminal
transactivation domains cooperate to promote renal tumorigenesis in
vivo. Mol Cell Biol. 27:2092–2102. 2007. View Article : Google Scholar : PubMed/NCBI
|
|
20
|
Sen A, Ren S, Lerchenmüller C, Sun J,
Weiss N, Most P and Peppel K: MicroRNA-138 regulates
hypoxia-induced endothelial cell dysfunction by targeting S100A1.
PLoS One. 8:e786842013. View Article : Google Scholar : PubMed/NCBI
|
|
21
|
Muz B, de la Puente P, Azab F and Azab AK:
The role of hypoxia in cancer progression, angiogenesis,
metastasis, and resistance to therapy. Hypoxia (Auckl). 3:83–92.
2015. View Article : Google Scholar : PubMed/NCBI
|
|
22
|
Hirschey MD, DeBerardinis RJ, Diehl AME,
Drew JE, Frezza C, Green MF, Jones LW, Ko YH, Le A, Lea MA, et al:
Dysregulated metabolism contributes to oncogenesis. Semin Cancer
Biol. 35 Suppl:S129–S150. 2015. View Article : Google Scholar : PubMed/NCBI
|
|
23
|
Amoedo ND, Obre E and Rossignol R: Drug
discovery strategies in the field of tumor energy metabolism:
Limitations by metabolic flexibility and metabolic resistance to
chemotherapy. Biochim Biophys Acta Bioenerg. 1858:674–685. 2017.
View Article : Google Scholar : PubMed/NCBI
|
|
24
|
Kankotia S and Stacpoole PW:
Dichloroacetate and cancer: New home for an orphan drug? Biochim
Biophys Acta. 1846:617–629. 2014.PubMed/NCBI
|
|
25
|
Holden HM, Rayment I and Thoden JB:
Structure and function of enzymes of the Leloir pathway for
galactose metabolism. J Biol Chem. 278:43885–43888. 2003.
View Article : Google Scholar : PubMed/NCBI
|
|
26
|
Robb EL and Stuart JA: The stilbenes
resveratrol, pterostilbene and piceid affect growth and stress
resistance in mammalian cells via a mechanism requiring estrogen
receptor beta and the induction of Mn-superoxide dismutase.
Phytochemistry. 98:164–173. 2014. View Article : Google Scholar : PubMed/NCBI
|
|
27
|
Courtnay R, Ngo DC, Malik N, Ververis K,
Tortorell SM and Kargiannis TC: Cancer metabolism and the Warburg
effect: The role of HIF-1 and PI3K. Mol Biol Rep. 42:841–851. 2015.
View Article : Google Scholar : PubMed/NCBI
|
|
28
|
Boulahbel H, Durán RV and Gottlieb E:
Prolyl hydroxylases as regulators of cell metabolism. Biochem Soc
Trans. 37:291–294. 2009. View Article : Google Scholar : PubMed/NCBI
|
|
29
|
Jokilehto T and Jaakola PM: The role of
HIF prolyl hydroxylases in tumour growth. J Cell Mol Med.
14:758–770. 2010. View Article : Google Scholar : PubMed/NCBI
|
|
30
|
Nguyen TL and Durán RV: Prolyl hydroxylase
domain enzymes and their role in cell signaling and cancer
metabolism. Int J Biochem Cell Biol. 80:71–80. 2016. View Article : Google Scholar : PubMed/NCBI
|
|
31
|
Li G, Rivas P, Bedolla R, Thapa D, Reddick
RL, Ghosh R and Kumar AP: Dietary resveratrol prevents development
of high-grade prostatic intraepithelial neoplastic lesions:
Involvement of SIRT1-S6K axis. Cancer Prev Res (Phila). 6:27–39.
2013. View Article : Google Scholar : PubMed/NCBI
|
|
32
|
Chen L, Shi Y, Yuan J, Han Y, Qin R, Wu Q,
Jia B, Wei B, Wei L, Dai G and Jiao S: HIF-1 alpha overexpression
correlates with poor overall survival and disease-free survival in
gastric cancer patients post-gastrectomy. PLoS One. 9:e906782014.
View Article : Google Scholar : PubMed/NCBI
|