Introduction
As the second leading cause of cancer-associated
mortality, hepatocellular carcinoma (HCC) is one of the most
prevalent types of cancer worldwide (1). The incidence rates of HCC have increased
over the past two decades, with >40,000 cases occurring in 2017
in the United States alone (2). The
majority of patients with HCC do not receive early treatment and
have a poor long-term overall survival (OS) rate, due to malignant
features, such as late-stage presentation, metastasis, migration
and the lack of HCC symptoms and specific biomarkers (3). Therefore, the diagnosis of HCC prior to
reaching the advanced stage of the disease is imperative, in order
to achieve improved treatment outcomes for patients. Currently,
α-fetoprotein (AFP) is most widely used diagnostic serological
marker for HCC (4). However, the
expression of AFP is not specific to HCC, since it is also
expressed in patients with chronic hepatitis B infection without
HCC (5). Nevertheless, AFP-positivity
is prevalently manifested in HCC tumors of large size, in the
middle to advanced Tumor-Node-Metastasis stage and of high
pathological grade compared with AFP-negative status. Therefore,
the accuracy of serum AFP for the detection of early-stage HCC is
limited (6,7). Molecular targeted drugs have become
clinically available, however, only a limited group of patients
benefit from this treatment, due to their high price, unclear
efficacy and variation in patient response (8,9).
Therefore, a more precise marker is urgently required for the early
detection of HCC and the development of novel therapeutic
approaches.
Intracellular communication, gene dysregulation and
environmental factors have been indicated to be involved in the
extremely complex underlying mechanisms of occurrence, advancement
and metastasis of HCC (10,11). From a molecular perspective, it has
been indicated that multiple genes and cellular pathways take part
in the origin and development of HCC (12,13).
MicroRNAs (miRNAs) are small non-coding endogenous RNAs, ~22
nucleotides in length, serving important roles in proliferation,
differentiation, apoptosis, invasion and metastasis, as well as
numerous other cellular biological processes (14,15). It
has been reported that numerous miRNAs exhibit different expression
levels in various types of cancer, indicating their future clinical
diagnostic value (16). Among them,
miRNA-21 (miR-21) has been indicated to be overexpressed in
mammalian cells and has been extensively examined in numerous types
of cancer, including esophageal cancer, lung adenocarcinoma,
pancreatic adenocarcinoma and tongue squamous cell carcinoma
(17–21). A number of studies have reported the
diagnostic value of elevated expression of miR-21 in HCC compared
with healthy controls or patients with chronic hepatitis B
infection (22–25).
High-throughput technologies, including microarrays
and RNA sequencing, have served a crucial role in global gene
expression research. The application of gene chip-based gene
expression profiles has generated extensive information and
provided a theoretical insight into the carcinogenesis of HCC. The
Gene Expression Omnibus (GEO), as well as The Cancer Genome Atlas
(TCGA), are public data portals regarding numerous cancer and
non-cancerous samples, providing an unprecedented source of
tumor-associated information for the identification of novel
biomarkers. The development of natural language processing (NLP)
has also been significant, focusing on the interactions between
natural languages and computers and containing a large amount of
laboratory and clinical data. The underlying biological mechanism
of hub genes can be analyzed through Gene Ontology (GO) functional
annotation, Kyoto Encyclopedia of Genes and Genomes (KEGG) pathway
enrichment and protein-protein interaction (PPI) network analysis.
To the best of our knowledge, the limitation of previous studies
regarding miRNA in HCC is their sole focus on serum, plasma, blood
or tissue samples (26,27).
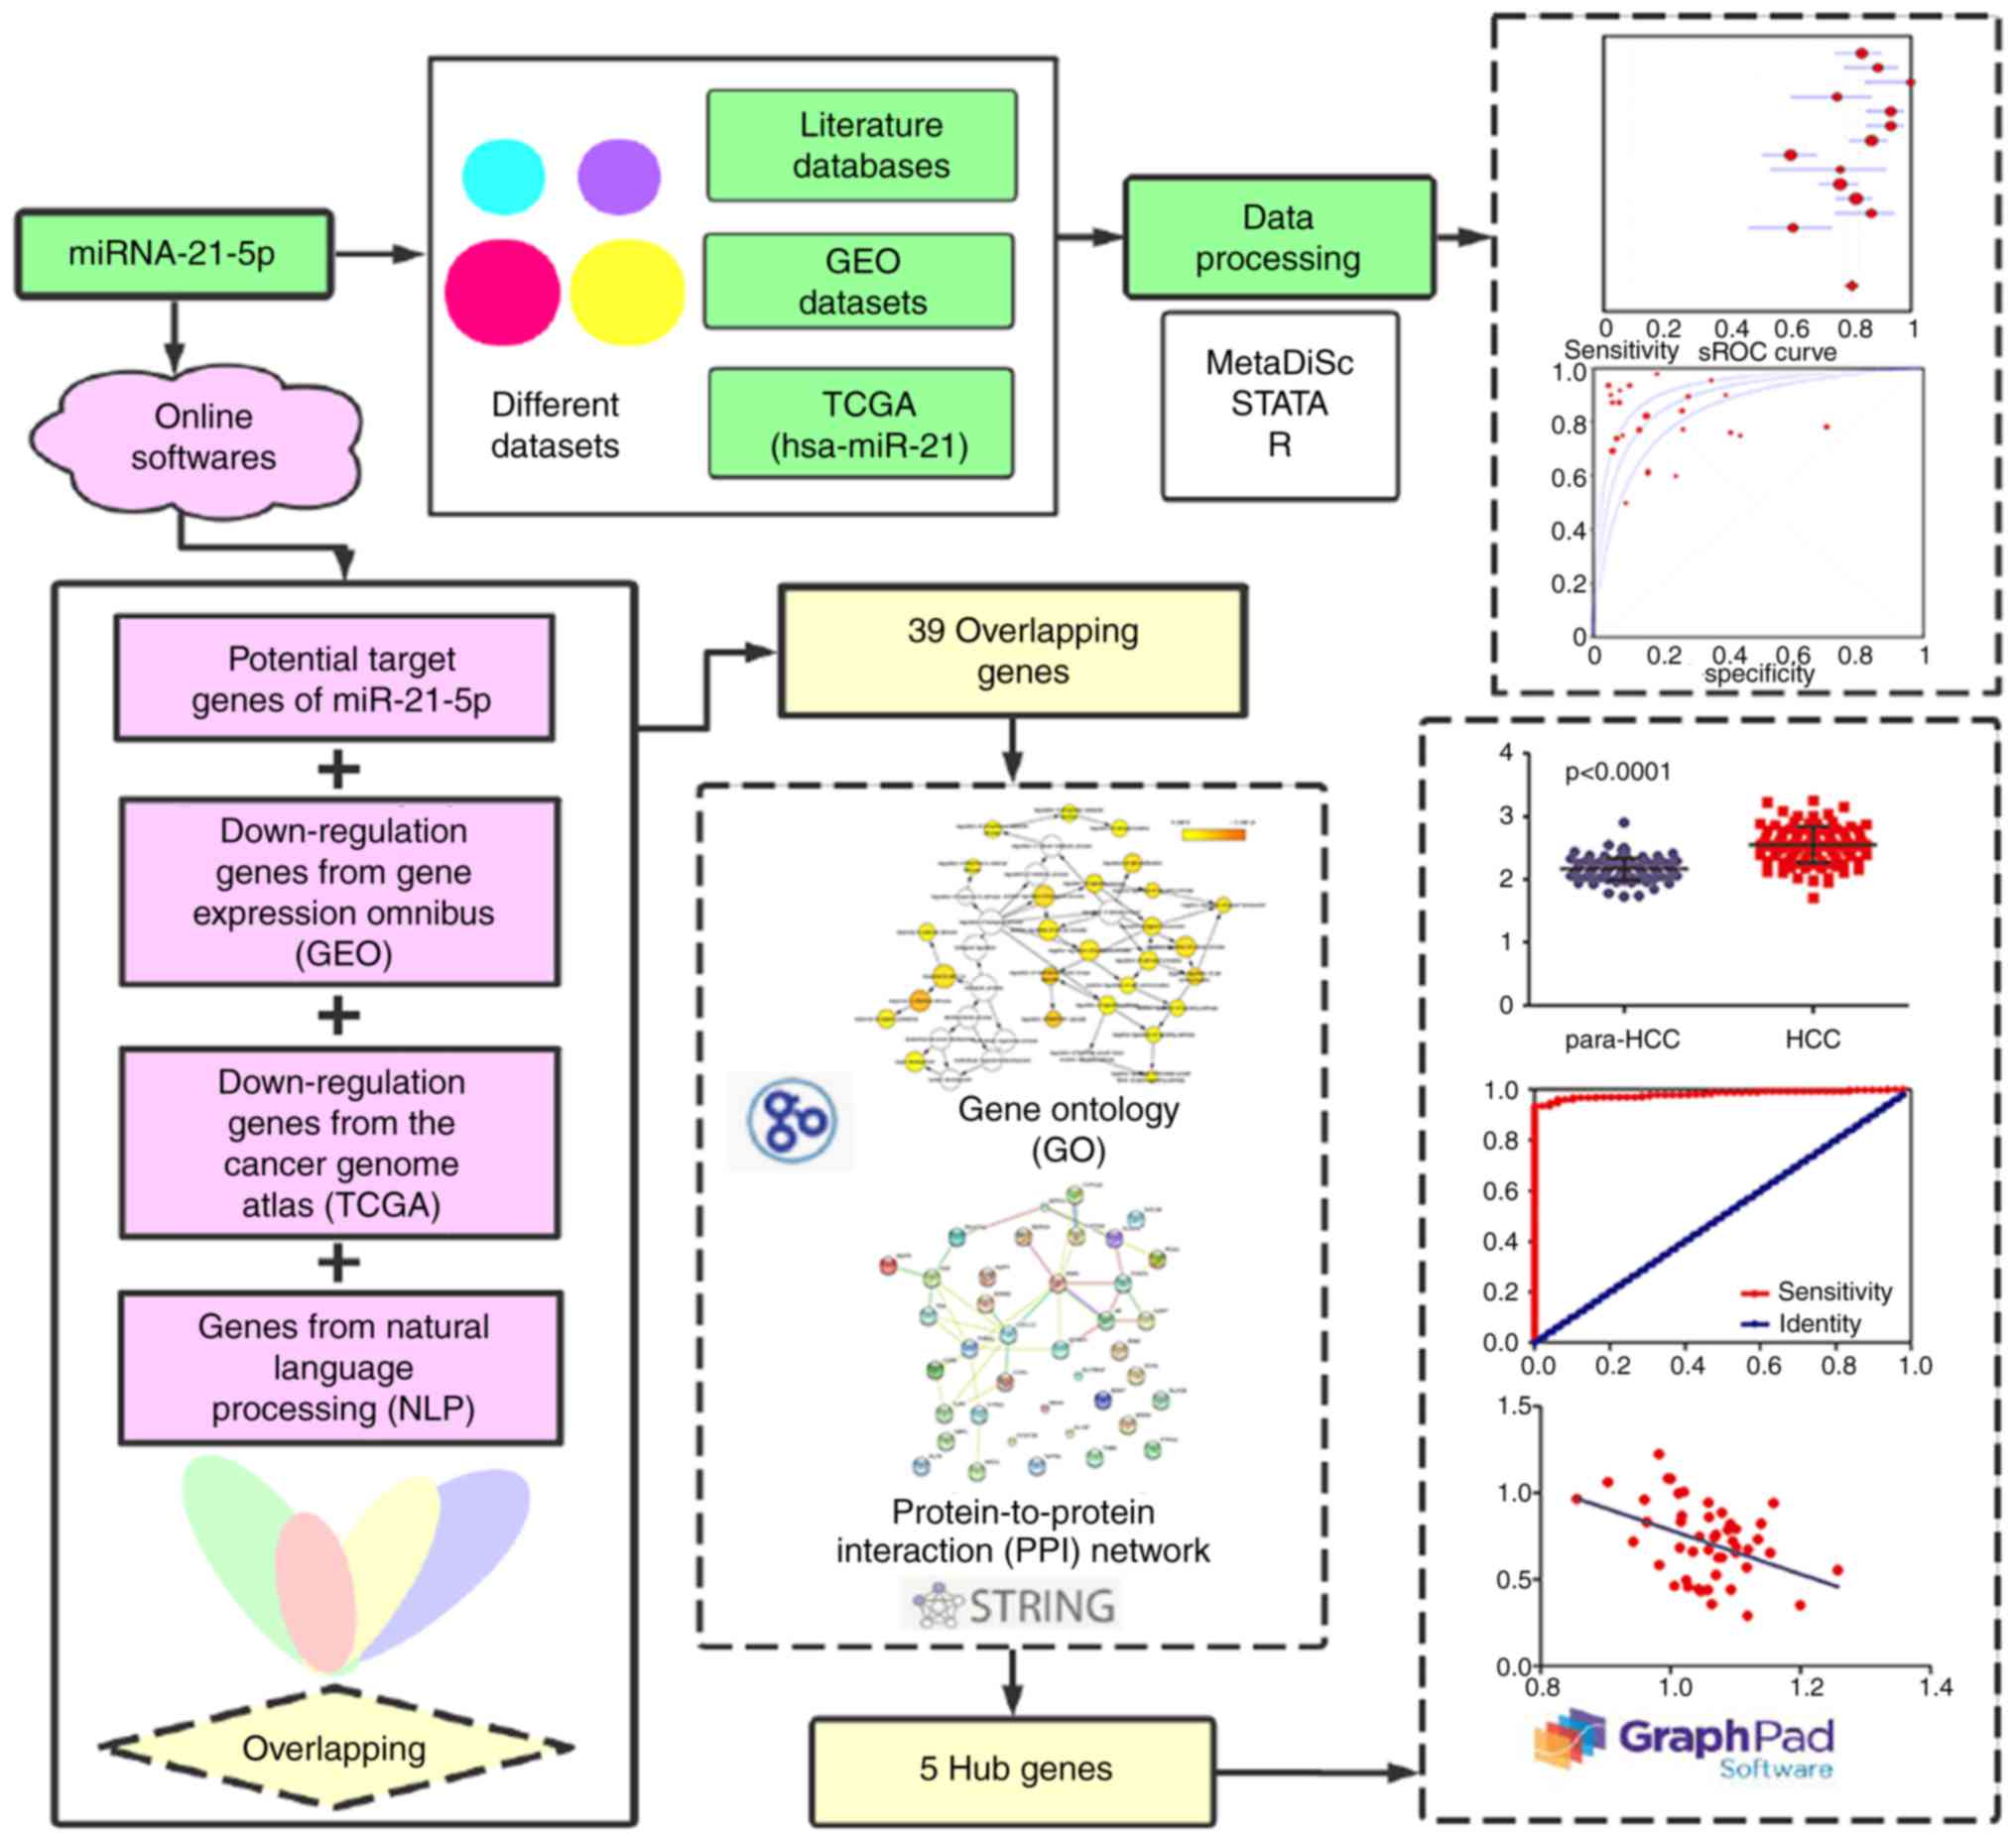
In the present study, a comprehensive analysis was
performed by combining literature studies, KEGG analysis, the GEO
database, online software platforms and NLP. In addition,
functional annotation and signaling pathway analyses of possible
genes were performed with GO enrichment analysis, KEGG analysis and
PPI networks. Subsequently, genes with the highest PPI scores were
further investigated (Fig. 1). The
aim of the present study was to further understand the underlying
pathogenic mechanism and potential clinical value of miR-21-5p in
HCC, in order to provide precise diagnostic insights for HCC.
Materials and methods
Meta-analysis of the literature regarding
the clinical role of miR-21-5p
Data acquisition
HCC-associated miR-21-5p data were collected from 14
databases: PubMed (http://www.ncbi.nlm.nih.gov/pubmed), Embase
(www.elsevier.com/solutions/embase-biomedical-research),
EBSCO (http://search.ebscohost.com), Wiley
Online Library (http://onlinelibrary.wiley.com), Science Direct
(https://www.sciencedirect.com/), Web of
Science (http://webofknowledge.com/WOS), Cochrane Central
Register of Controlled Trials (http://cochranelibrary-wiley.com/cochranelibrary/search?searchRow.searchOptions.searchProducts=clinicalTrialsDoi),
Ovid (http://gateway.ovid.com/), LILACS
(http://lilacs.bvsalud.org/en/), Google
Scholar (scholar.google.com.cn/), Chinese Chong Qing VIP
(http://qikan.cqvip.com/), China National
Knowledge Infrastructure (CNKI) (http://www.cnki.com.cn), Chinese Wan Fang database
(http://med.wanfangdata.com.cn/) and
China Biology Medicine disc (http://www.sinomed.ac.cn/). The literature searches of
the present study were restricted to human studies. In order to
acquire all relevant studies, the references of review papers and
other relevant studies were also manually searched. Literature
sources were retrieved from July 9 to September 8 2017 without
restrictions on language. As miR-21-5p has been also referred to as
miR-21, the key words and medical subject headings (MeSH) included
the following: (miR-21 OR miRNA-21 OR microRNA-21 OR miR21 OR
miRNA21 OR microRNA21 OR ‘miR 21’ OR ‘miRNA-21’ OR ‘microRNA 21’ OR
miR-21-5p OR miR-21-5p OR microRNA-21-5p) AND (malignan* OR cancer
OR tumor OR tumour OR neoplas* OR carcinoma) AND (hepatocellular OR
liver OR hepatic OR HCC).
Inclusion and exclusion criteria
A study was incorporated when it matched the filter
criteria: i) An interpretation of the expression level of miR-21-5p
in patients with HCC; ii) number of cases was reported in the
study; iii) histopathological examination was used for diagnosis,
iv) values of expression available directly or indirectly.
Additionally, the following conditions caused the exclusion of a
study: i) Duplicate publications; ii) failure to specify the
control groups; iii) non-human subjects or, iv) lack of original
data, such as review, case report or conference note.
Collection and analysis of GEO
data
GEO series (GSE) studies were gathered from the GEO
database (https://www.ncbi.nlm.nih.gov/geo/). The information
obtained included the expression profile of miR-21-5p, the
fold-change value in HCC and the type of control sample. There was
no restriction on the specific type of control group. Cell line
assays or assays not considering expression were excluded. The
following information was recorded for GSE chips: Main contributor
(first author), publishing year, country, sample type, experiment
type, the platform of the GSE chips and the number of patients with
HCC and control patients. True positive (TP), false positive (FP),
false negative (FN), true negative (TN) rates and area under the
curve (AUC) were also recorded. All the expression values of
miR-21-5p from GEO data were log2 scaled. The level of expression
of miR-21-5p between patients with HCC and controls was compared
using GraphPad Prism 5.0 (GraphPad Software, Inc., La Jolla, CA,
USA).
Collection and clinical parameter
analysis of TCGA data
TCGA miR-seq data was downloaded from Firebrowse
(http://firebrowse.org/), for the entry of liver
HCC (‘LIHC’) on April 17th, 2017. Subsequently, the data was
manipulated by SPSS 21.0 (IBM Corp., Armonk, NY, USA). Clinical
parameters, including age, sex, grade, stage, vascular invasion,
history of primary risk factors, hepatitis B virus infection and
histological type, were visualized using GraphPad Prism 5.0.
Comprehensive meta-analysis based on
studies from literature, GEO and TCGA
Consistent data elements for the integrated
meta-analysis were extracted. Following the input of accuracy data,
including TP, FP, FN and TN, of each study into MetaDiSc 1.4, the
integrated value of sensitivity (SEN), specificity (SPE), positive
likelihood ratio (PLR), negative likelihood ratio (NLR), diagnostic
odds ratio (DOR) and AUC was calculated (28). Receiver operator characteristic (ROC)
curve was applied to evaluate the overall diagnostic accuracy. AUC
was calculated for the combined pool of comprehensive data.
Depending on the use of a healthy control group or chronic
hepatitis B infection control group from the extracted studies, two
additional analyses were performed in addition to the meta-analysis
of the literature.
Subgroup analyses
In order to evaluate the diagnostic capacity of
miR-21-5p from different experimental methods and sample types and
figure out the heterogeneity, four subgroup analyses were
performed. Diagnostic efficiency of each subgroup was performed
with MetaDiSc 1.4.
Potential target gene collection and
bioinformatics investigation
Collection of potential target
genes
Genes were selected when identified by >3 of the
14 online software packages (miRanda, mirbridge, miRWalk, Microt4,
mirTarbase, PITA, miRDB, RNA22, miRNAMap, miRMap, RNAhybrid,
PicTar, Targetscan and PolymiRTS). Overlapping genes were
identified by the combination of the predicted genes from 14 online
software packages, TCGA, GEO and NLP. Overlapping genes were
considered to be possible target genes of miR-21-5p.
Functional annotation
GO functional annotation were performed and
visualized by Bingo plug-in units from Cytoscape 3.5.0 (Cytoscape,
Seattle, WA, USA) (29). GO pathway
enrichment analysis consists of three components: i) Biological
process (BP); ii) molecular function (MF), and iii) cellular
component (CC). A BP term with P<0.005 was considered to be
statistically significant. P<0.05 was denoted as the cut-off
criteria for CC and MF terms. The functional annotation data were
extracted from the downloaded files on August 31th, 2018.
PPI network construction and signal
pathway analyses
A bioinformatics database called Search Tool for the
Retrieval of Interacting Genes/Proteins (STRING 10.5; http://www.string-db.org) was applied to establish a
gene interaction network and excavate notable pathways associated
with the potential target genes of miR-21-5p (30). KEGG pathways were determined from the
Analysis module and the complete PPI network was drawn on August
31th, 2018. Each internal node in the PPI map represents one
potential gene, while the edges between genes indicate a regulatory
connection between the genes. These connections can be vividly
synthesized and scored. The higher the score, the closer the
association between the genes. Genes with high scores may occupy a
critical position in the network or act as hub genes. A false
discovery rate (FDR) <0.05 value was regarded as the cut-off
criteria for pathways by KEGG pathway analysis.
Diagnostic values of hub genes
In order to investigate the association between the
five hub genes and the progression of HCC, expression level in
para-HCC non-cancerous tissues and HCC tissues (data from TCGA) was
compared by single-sample t-test and ROC analysis. The degree of
diagnostic value was assessed by the AUC of each gene. Correlation
analysis of the hub genes and miR-21-5p expression was further
established using Pearson correlation coefficient. GraphPad Prism
software was utilized to generate scatter diagrams and visualize
associations.
Statistical analysis
Cochran Q-test and the inconsistency index
(I2) was calculated to evaluate the
heterogeneity. I2 >50% and/or P<0.05
was considered to indicate that heterogeneity existed in the study
and the random-effects model was accepted. Otherwise, a
fixed-effects model was used for statistical purposes (31,32). The
area under the sROC curve was used to evaluate the diagnostic value
of miR-21-5p in HCC. The diagnosis information from the literature
data and comprehensive data were recorded separately. The
diagnostic efficiency of each meta-analysis was performed with
MetaDiSc 1.4. P<0.05 was considered to indicate a statistically
significant difference. The potential publication bias was
investigated with Deeks funnel plot asymmetry test.
Results
Meta-analysis of the literature
regarding the clinical role of miR-21-5p
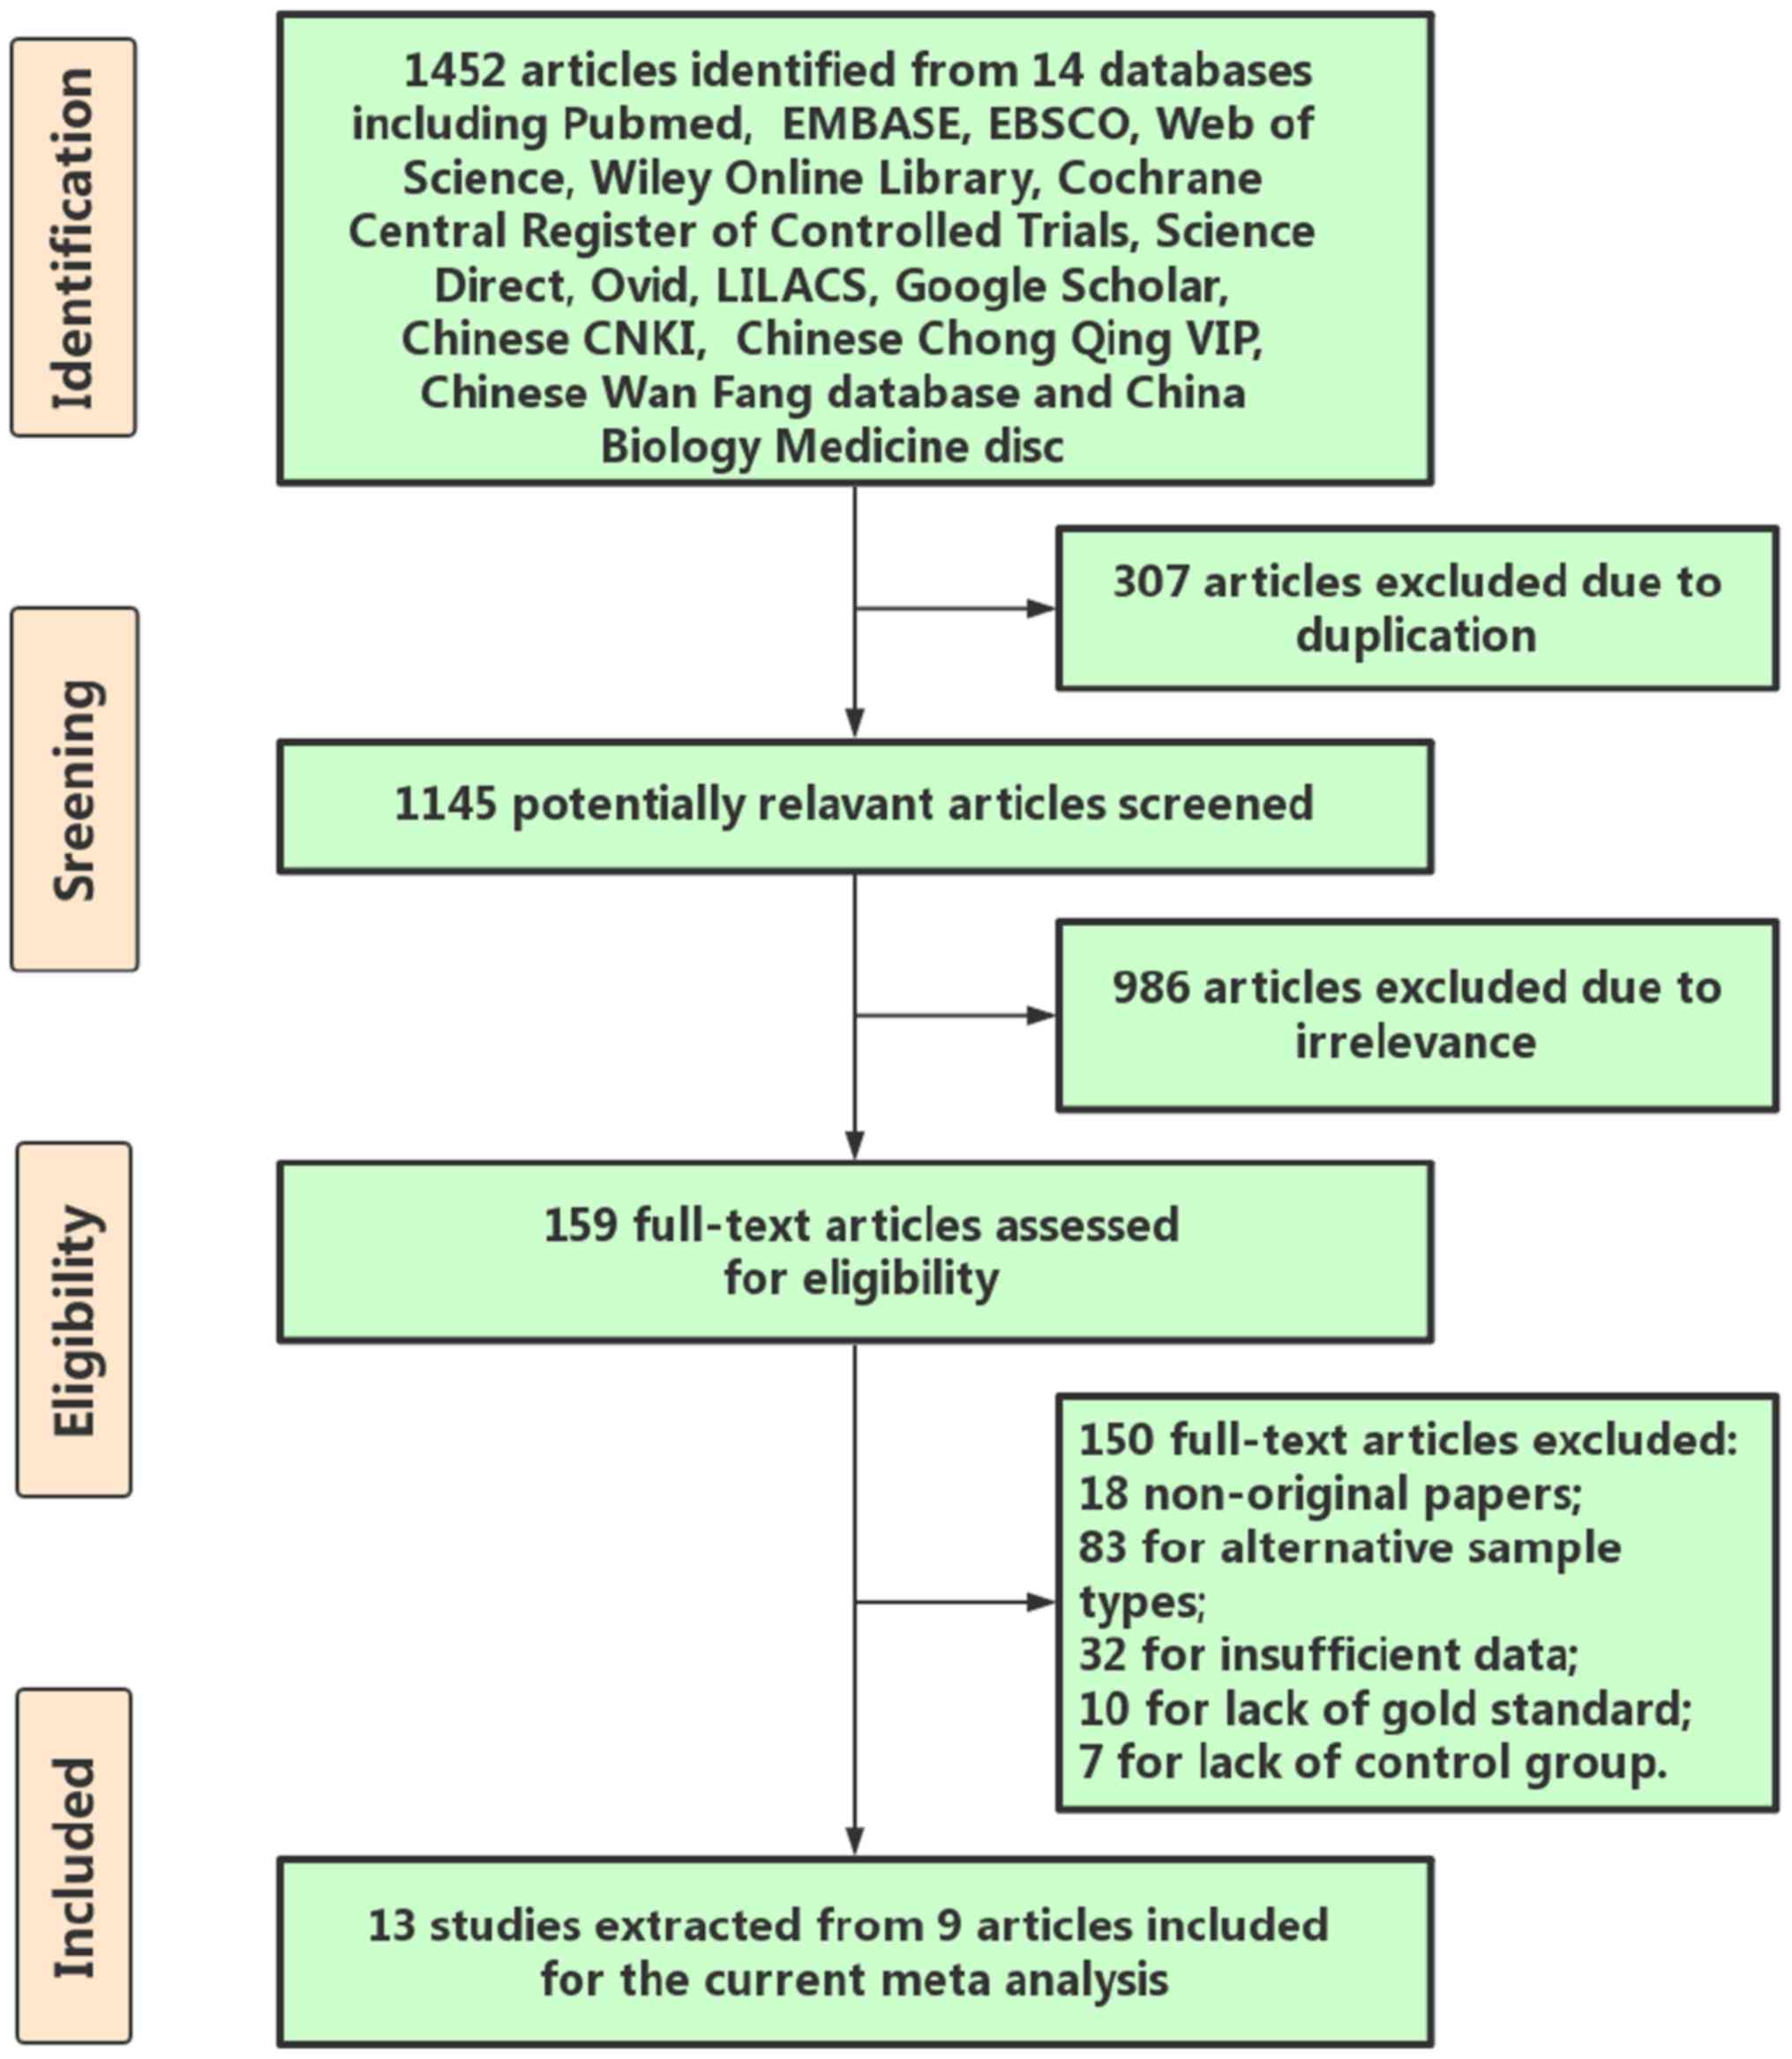
By retrieving and complying with the inclusion and
exclusion criteria, 13 eligible studies were incorporated into the
meta-analysis of the literature (33–39)
(Table I). The flowchart indicated in
Fig. 2 illustrates the selection and
retrieval process. A total of 7 studies were performed in China, 3
in Egypt and 3 in Japan. The literature data were entered into
MetaDiSc 1.4 and it was indicated that there was significant
heterogeneity in the pooled estimates of SEN, SPE, PLR, NLR, and
DOR, P<0.05. Therefore, the random-effects model was used. The
pooled sensitivity and specificity were 0.81 (95% confidence
interval; (CI), 0.79–0.83) and 0.82 (95% CI, 0.80–0.85). The forest
plots also revealed that the pooled PLR, NLR and DOR were 4.56 (95%
CI, 3.29–6.31), 0.21 (95% CI, 0.15–0.30) and 24.56 (95% CI,
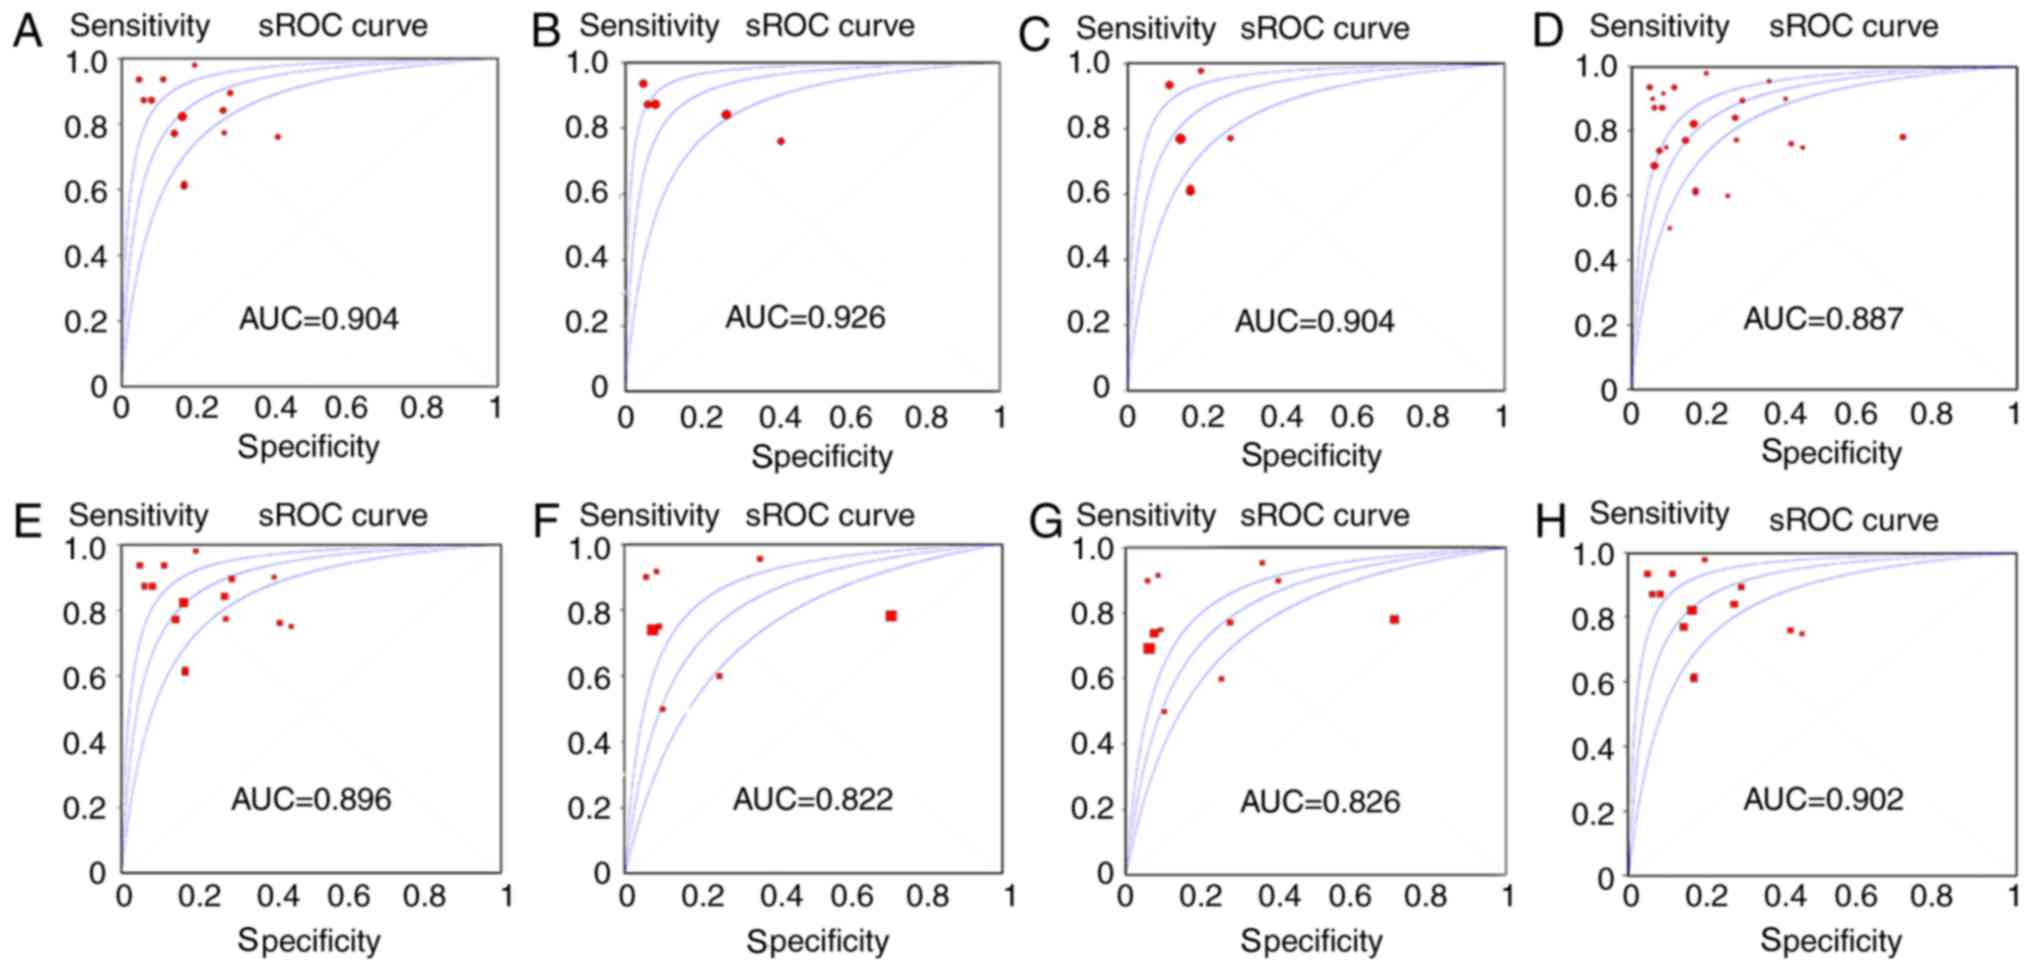
13.85–43.54), respectively. The sROC demonstrated an AUC of 0.904
from the 13 studies for the literature meta-analysis (Table II; Fig.
3A). Consequently, the SEN, SPE, PLR, NLR and DOR of the
healthy control group were 0.87 (95% CI, 0.83–0.90), 0.82 (95% CI,
0.77–0.86), 6.62 (95% CI, 2.48–15.63), 0.17 (95% CI, 0.10–0.29) and
39.09 (95% CI, 9.98–154.03), respectively (Table II). Correspondingly, the SEN, SPE,
PLR, NLR and DOR of the chronic hepatitis B patient group were 0.75
(95% CI, 0.71–0.79), 0.84 (95% CI, 0.78–0.88), 4.36 (95% CI,
3.23–5.88), 0.27 (95% CI, 0.16–0.45) and 18.66 (95% CI,
7.89–44.15), respectively (Table
II). The sROC demonstrated an AUC of 0.926 and 0.904 from the
healthy control group and chronic hepatitis B patient group
(Table II; Fig. 3B and C).
 | Table I.Information and clinical data on the
24 included studies. |
Table I.
Information and clinical data on the
24 included studies.
| Accession | First author | Publication
year | Country | Experiment
type | Platform | Sample type | Number of patients
with HCC | Control
patients | TP | FP | FN | TN | AUC | (Refs.) |
|---|
| PMID:21229610 | Xu et al
(a) | 2011 | China | RT-qPCR |
| Serum | 101 | 89 | 85 | 24 | 16 | 65 | 0.870 | (33) |
| PMID:22403344 | Liu et al
(c) | 2012 | China | RT-qPCR |
| Serum | 57 | 59 | 51 | 17 | 6 | 42 | 0.865 | (34) |
| PMID:26302751 | Amr et al
(b) | 2015 | Egypt | RT-qPCR |
| Serum | 23 | 17 | 23 | 3 | 0 | 14 | 0.943 | (35) |
| PMID:26669589 | Zhuang et al
(a) | 2015 | China | RT-qPCR |
| Serum | 52 | 43 | 35 | 17 | 11 | 24 | 0.621 | (36) |
| PMID:27113935 | El-Tawdi et
al (a) | 2016 | Egypt | RT-qPCR |
| Serum | 78 | 42 | 73 | 2 | 5 | 40 | 0.957 | (14) |
| PMID:27113935 | El-Tawdi et
al (b) | 2016 | Egypt | RT-qPCR |
| Serum | 78 | 36 | 73 | 4 | 5 | 32 | 0.938 | (14) |
| PMID:21749846 | Tomimaru et
al (a) | 2012 | Japan | RT-qPCR |
| Plasma | 126 | 50 | 110 | 4 | 16 | 46 | 0.953 | (37) |
| PMID:21749846 | Tomimaru et
al (b) | 2012 | Japan | RT-qPCR |
| Plasma | 126 | 30 | 77 | 5 | 49 | 25 | 0.773 | (37) |
| PMID:21283620 | Mizuguchi et
al (b) | 2011 | Japan | RT-qPCR |
| Tissue | 22 | 22 | 17 | 6 | 5 | 16 | 0.780 | (38) |
| PMID:28477010 | Guo et al
(b) | 2017 | China | RT-qPCR |
| Serum | 175 | 64 | 135 | 9 | 40 | 55 | 0.789 | (24) |
| PMID:28477010 | Guo et al
(c) | 2017 | China | RT-qPCR |
| Serum | 175 | 278 | 144 | 45 | 31 | 233 | 0.849 | (24) |
| CNKI | Qin et al
(a) | 2013 | China | RT-qPCR |
| Plasma | 55 | 50 | 48 | 3 | 7 | 47 | 0.956 | (39) |
| CNKI | Qin et al
(b) | 2014 | China | RT-qPCR |
| Plasma | 55 | 60 | 34 | 10 | 21 | 50 | 0.771 | (39) |
| GSE22058 | Burchard et
al | 2010 | USA | Non-coding RNA
profiling by array | GPL10457 | Tissue | 96 | 96 | 71 | 7 | 25 | 89 | 0.877 | (40) |
| GSE10694 | Li et
al | 2008 | China | Non-coding RNA
profiling by array | GPL6542 | Tissue | 78 | 88 | 61 | 62 | 17 | 26 | 0.506 | (41) |
| GSE41874 | Morita et
al | 2013 | Japan | Non-coding RNA
profiling by array | GPL7722 | Tissue | 6 | 4 | 3 | 0 | 3 | 4 | 0.625 | – |
| GSE21279 | Hou et
al | 2010 | China | Non-coding RNA
profiling by array | GPL9052 | Tissue | 4 | 11 | 3 | 1 | 1 | 10 | 0.841 | (42) |
| GSE57555 | Murakami et
al | 2015 | Japan | Non-coding RNA
profiling by array | GPL16699 | Tissue | 5 | 16 | 3 | 4 | 2 | 12 | 0.625 | (43) |
| GSE67882 | Ghosh et
al | 2015 | India | Non-coding RNA
profiling by array | GPL10850 | Tissue | 4 | 8 | 4 | 0 | 0 | 8 | 1.000 | – |
| GSE69580 | Hung et
al | 2015 | China | Non-coding RNA
profiling by array | GPL10850 | Tissue | 5 | 5 | 5 | 0 | 0 | 5 | 1.000 | – |
| GSE12717 | Su et al | 2008 | China | Non-coding RNA
profiling by array | GPL7274 | Tissue | 10 | 6 | 10 | 2 | 0 | 4 | 0.800 | (44) |
| GSE54751 | Zhao et al | 2014 | USA | Expression
profiling by RT-qPCR | GPL18262 | Tissue | 10 | 10 | 9 | 4 | 1 | 6 | 0.710 | (45) |
| GSE50013 | Shen et al | 2013 | USA | Expression
profiling by RT-qPCR | GPL15497 | Plasma | 12 | 8 | 9 | 4 | 3 | 5 | 0.615 | (46) |
| TCGA |
|
|
|
|
| Tissue | 375 | 50 | 260 | 3 | 115 | 47 | 0.840 |
|
| Table II.Summary estimates of diagnostic
criteria and the 95% confidence intervals. |
Table II.
Summary estimates of diagnostic
criteria and the 95% confidence intervals.
| Analysis | Literature
studies | Control group:
Healthy | Control group:
CHB | Integrated
studies |
|---|
| Sensitivity (95%
CI) | 0.81
(0.79–0.83) | 0.87
(0.83–0.90) | 0.75
(0.71–0.79) | 0.78
(0.76–0.80) |
| Specificity (95%
CI) | 0.82
(0.80–0.85) | 0.82
(0.77–0.86) | 0.84
(0.78–0.88) | 0.79
(0.77–0.82) |
| Positive LR (95%
CI) | 4.56
(3.29–6.31) | 6.22
(2.48–15.63) | 4.36
(3.23–5.88) | 4.46
(2.91–6.84) |
| Negative LR (95%
CI) | 0.21
(0.15–0.30) | 0.17
(0.10–0.29) | 0.27
(0.16–0.45) | 0.26
(0.20–0.33) |
| DOR (95% CI) | 24.56
(13.85–43.54) | 39.09
(9.92–154.03) | 18.66
(7.89–44.15) | 20.17
(11.65–34.92) |
| AUC | 0.904 | 0.926 | 0.904 | 0.887 |
Collection and analysis of GEO
data
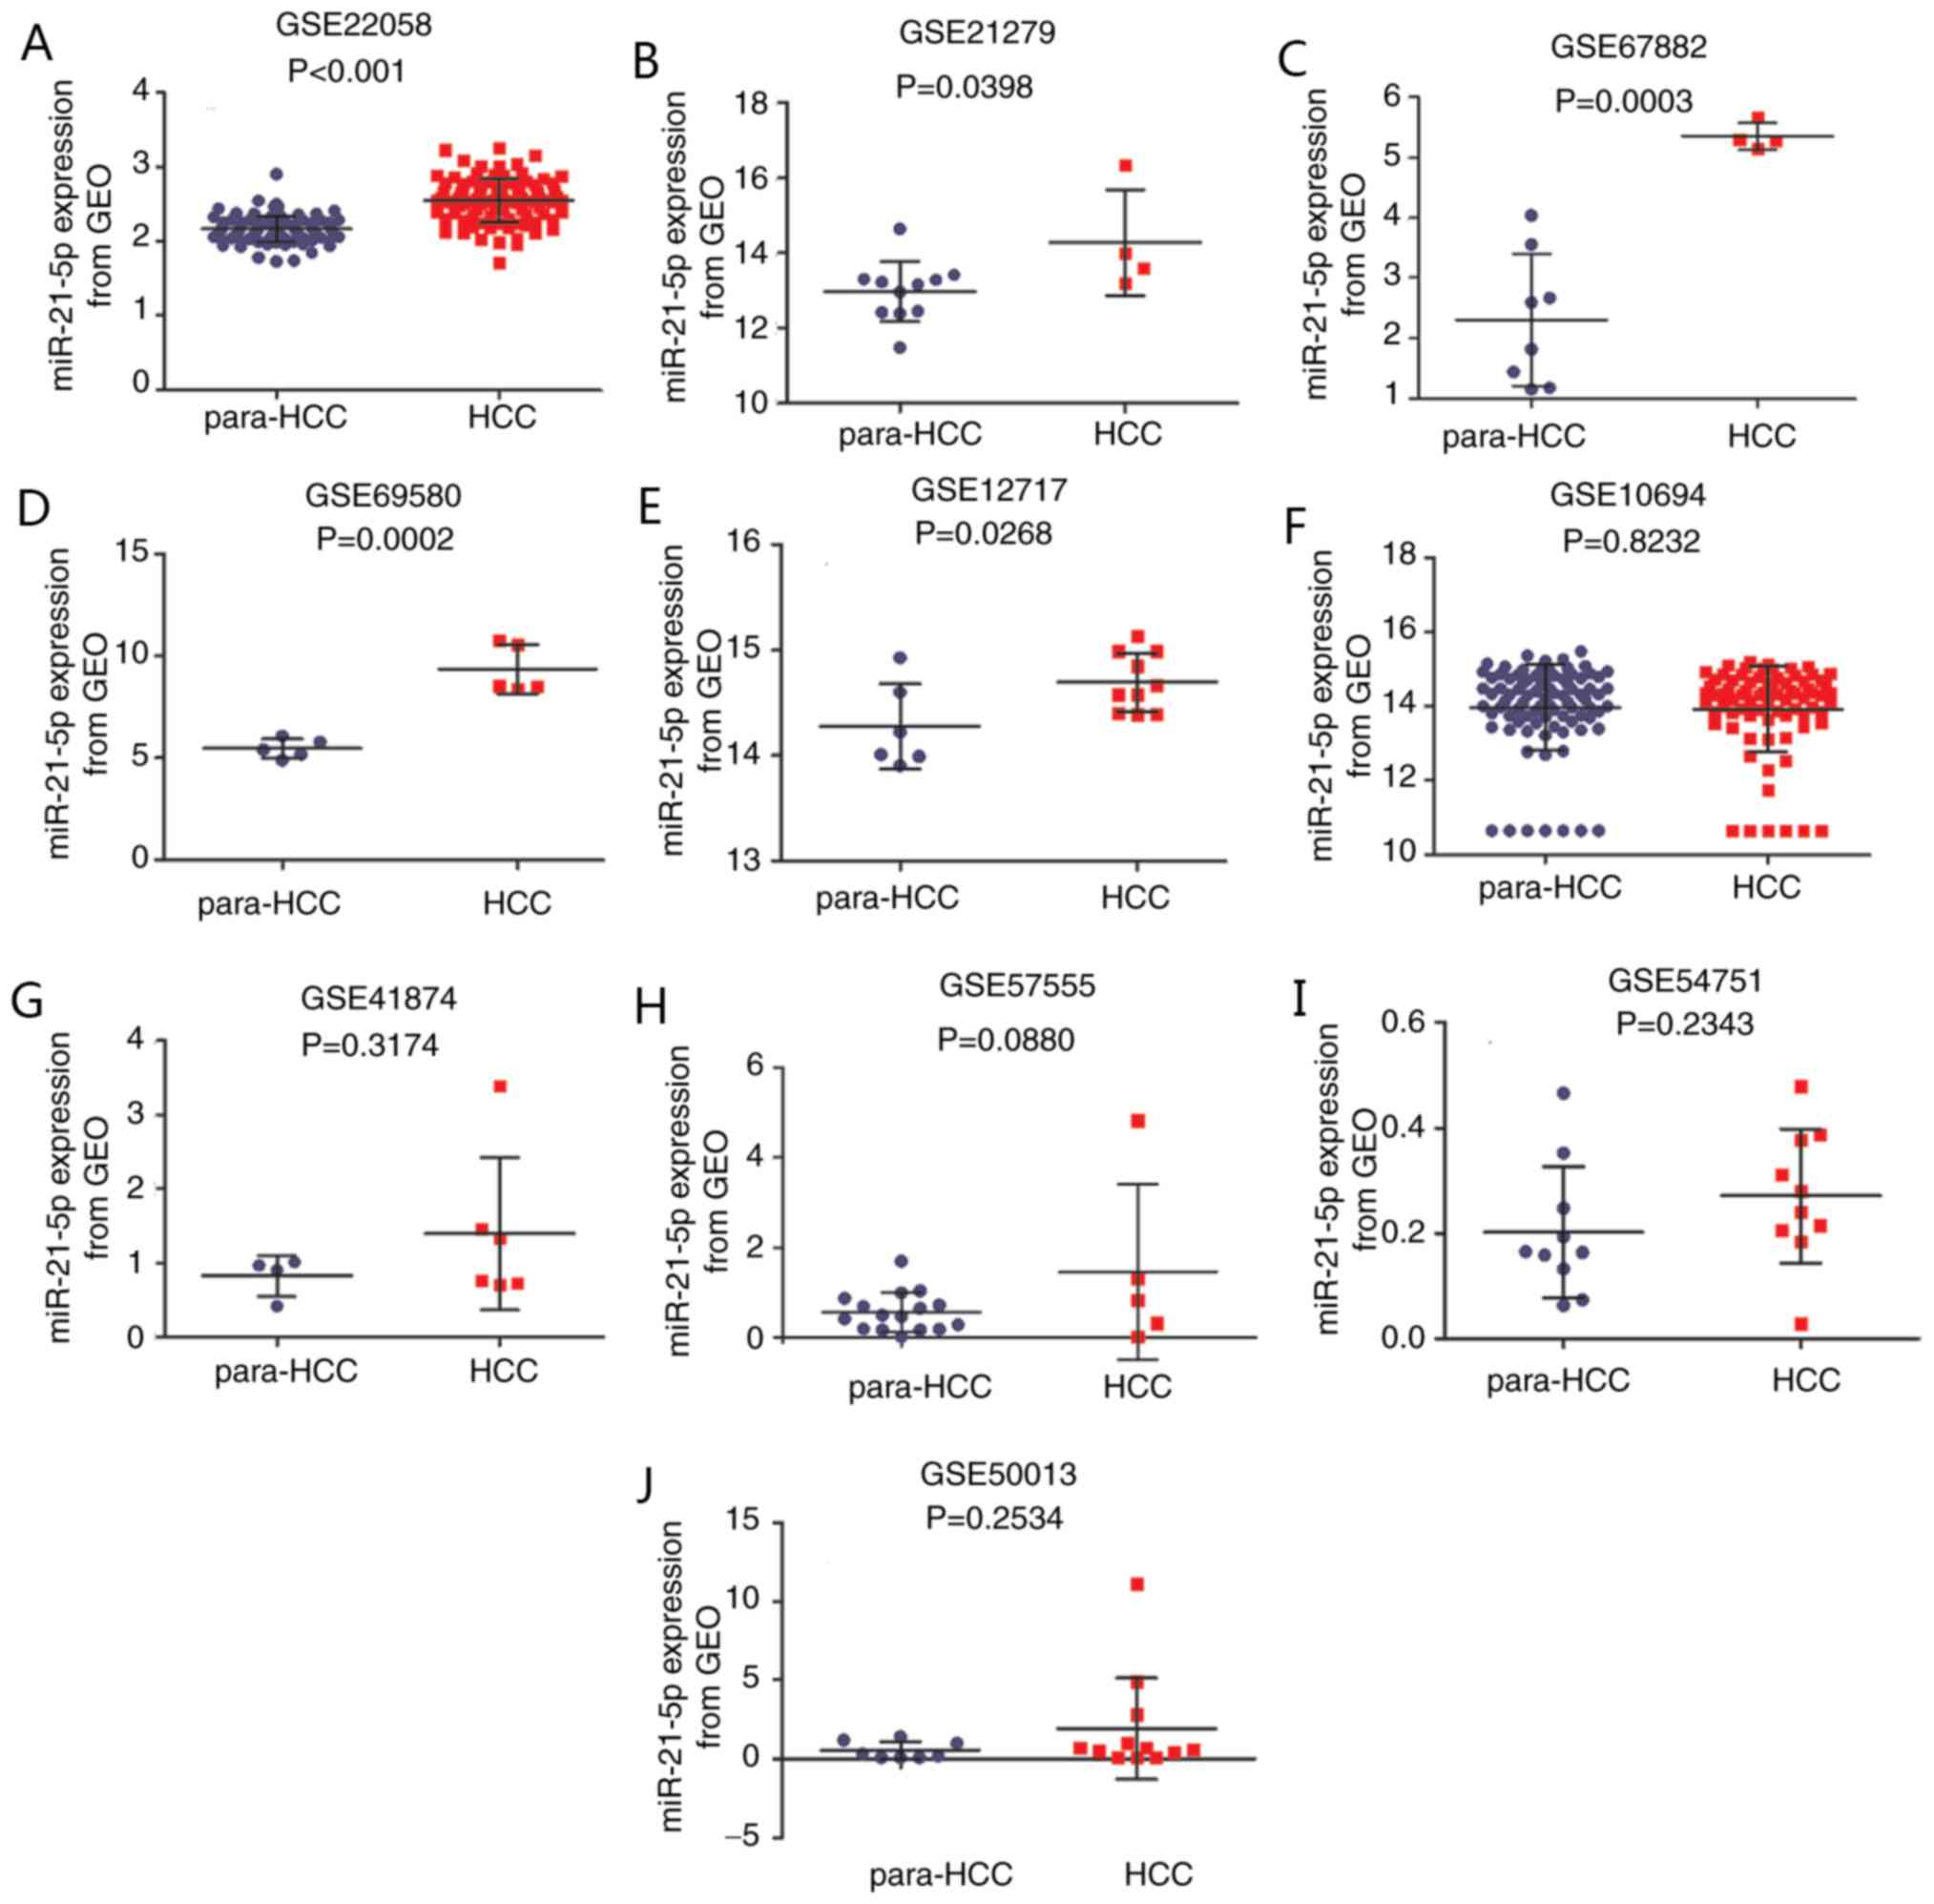
Gene expression in HCC samples and corresponding
adjacent para-tumorous liver tissues were compared. A total of 10
GSE chips from GEO datasets were available for the comprehensive
meta-analysis (40–46) (Table I).
A total of 8 chips were sequenced by array, while 2 chips were
analyzed by reverse transcription-quantitative polymerase chain
reaction (RT-qPCR). With the exception of one chip that used serum,
the samples for the other 9 chips were tissue samples. Expression
differed among the chips. Significant differences were observed in
5 GSE chips, which indicated increased expression of miR-21-5p in
HCC tissues compared with the corresponding adjacent non-cancerous
tissues (P<0.05). The results were as follows: 2.55±0.0299 vs.
2.16±0.0176 (GSE22058; P<0.0001; Fig.
4A), 14.28±0.7054 vs. 12.97±0.2419 (GSE21279; P=0.0398;
Fig. 4B), 5.34±0.1105 vs. 2.30±0.3856
(GSE67882; P=0.0003; Fig. 4C),
9.35±0.5412 vs. 5.46±0.2113 (GSE69580, P=0.0002, Fig. 4D) and 14.70±0.0877 vs. 14.28±0.1655
(GSE12717; P=0.0268; Fig. 4E). No
statistically significant difference between HCC tissues and the
adjacent non-cancerous tissues was indicated in the other 5 GSE
chips. The results for these chips were as follows: 13.93±0.1315
vs. 13.97±0.1231 (GSE10694; P=0.8232; Fig. 4F), 1.40±0.4191 vs. 0.83±0.1376
(GSE41874; P=0.3174; Fig. 4G),
1.46±0.8684 vs. 0.57±0.1082 (GSE57555; P=0.0880; Fig. 4H), 0.27±0.0401 vs. 0.20±0.0394
(GSE54751; P=0.2343; Fig. 4I) and
1.917±0.9283 vs. 0.55±0.1955 (GSE50013; P=0.2534; Fig. 4J).
Collection of clinicopathological
characteristics from TCGA
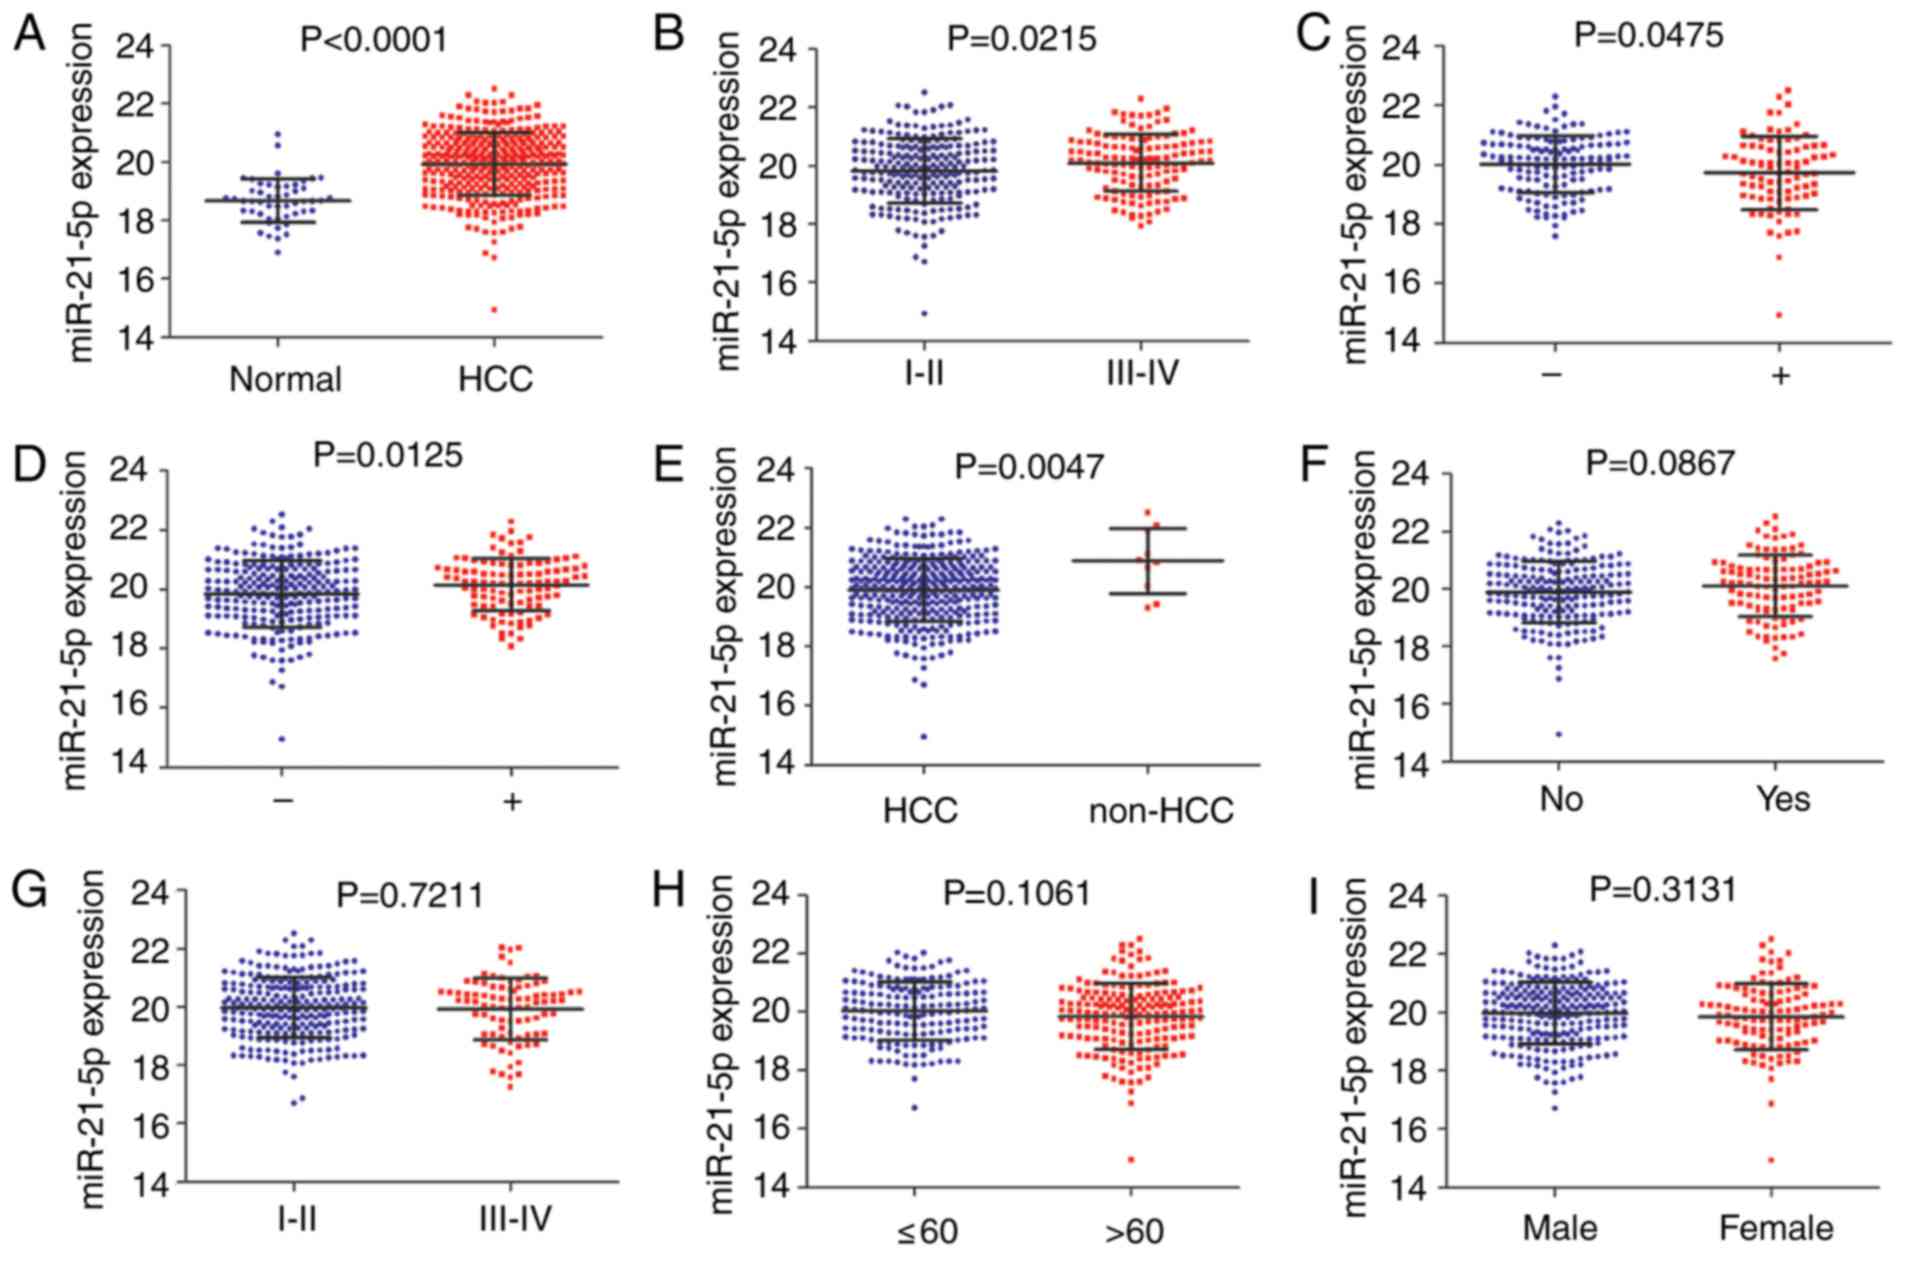
A total of 9 clinicopathological characteristics
were associated with miR-21-5p expression level. Significant
overexpression of miR-21-5p was observed in HCC tissues
(19.95±1.0672), compared with the non-cancerous tissues
(18.67±0.7504; P<0.0001; Fig. 5A).
Increased expression of miR-21-5p was identified for advanced tumor
grade stage III–IV (20.10±0.0840) compared with early tumor grade
stage I–II (19.84±0.0735) (P=0.0215; Fig.
5B). miR-21-5p differential expression was associated with
history of primary risk factors. Factors, hepatitis B virus
(HBV)-infected, alcohol consumption and nonalcoholic fatty liver
disease, defined ‘positive’, and ‘negative’ was defined as no
history of risk factors. Significant differences were observed
between positive (19.73±0.1328) and negative (20.02±0.0811)
(P=0.0475; Fig. 5C). HBV-infected
patients exhibited a significantly increased expression level
(20.15±0.0865) compared with HBV-negative patients (19.84±0.0723)
(P=0.0125; Fig. 5D). Increased
expression level of miR-21-5p was identified in HCC tumors
(20.88±0.3447) compared with other histological types of liver such
as hepatocholangiocarcinoma and fibrolamellar carcinoma
(19.91±0.0565) (P=0.0047; Fig. 5E).
No significant differences in miR-21-5p expression level were
associated with vascular invasion, stage, age or sex (Fig. 5F-I).
Integrated diagnostic value
A total of 24 studies, including 10 microarrays from
GEO datasets, 13 literature studies and TCGA-based RNA sequencing
data were included for the comprehensive meta-analysis. Significant
heterogeneity was identified in all five pooled effects (SEN, SPE,
PLR, NLR and DOR) by the Q and I2 tests
(all I2 >50% and P<0.05).
Accordingly, a random-effects model was employed. As presented in
Table II, the overall SEN, SPE, PLR,
NLR and DOR of the studies were 0.78 (95% CI, 0.76–0.80), 0.79 (95%
CI, 0.77–0.82), 4.46 (95% CI, 2.91–6.84), 0.26 (95% CI, 0.20–0.33)
and 20.17 (95% CI, 11.65–34.92), respectively. The AUC value of
integrated meta-analysis was 0.887 (Fig.
3D).
Subgroup analyses
Subgroup analyses based on experiment type (RT-qPCR
or array) and sample type (tissue or serum/plasma) were conducted.
For the experiment type subgroups, the SEN, SPE, PLR, NLR and DOR
of the RT-qPCR subgroup were 0.81 (95% CI, 0.79–0.83), 0.82 (95%
CI, 0.79–0.84), 4.12 (95% CI, 3.02–5.61), 0.22 (95% CI, 0.15–0.30)
and 22.00 (95% CI, 12.73–38.01), respectively. The corresponding 5
values in the array subgroup were 0.77 (95% CI, 0.71–0.83), 0.68
(95% CI, 0.61–0.74), 4.57 (95% CI, 1.30–16.06), 0.39 (95% CI,
0.24–0.64) and 15.70 (95% CI, 3.32–74.29) (Table III). The values of SEN, SPE and DOR
were markedly increased in the RT-qPCR subgroup compared with the
array subgroup. For the subgroup analysis of different sample
types, the SEN, SPE, PLR, NLR and DOR of the tissue subgroup were
0.73 (95% CI, 0.69–0.76), 0.72 (95% CI, 0.67–0.77), 4.35 (95% CI,
1.66–11.39), 0.36 (95% CI, 0.28–0.47) and 15.24 (95% CI,
5.00–45.45). The SEN, SPE, PLR, NLR and DOR in the serum/plasma
subgroup were 0.81 (95% CI, 0.79–0.83), 0.82 (95% CI, 0.79–0.85),
4.44 (95% CI, 3.16–6.25), 0.21 (95% CI, 0.15–0.30) and 23.99 (95%
CI, 13.27–43.37) (Table III). The
value of SEN, SPE, PLR and DOR were increased in the serum/plasma
subgroup compared with the tissue subgroup. AUC values from the
sROC of the RT-qPCR subgroup, array subgroup, tissue subgroup and
serum/plasma subgroup were 0.896, 0.822, 0.826 and 0.902,
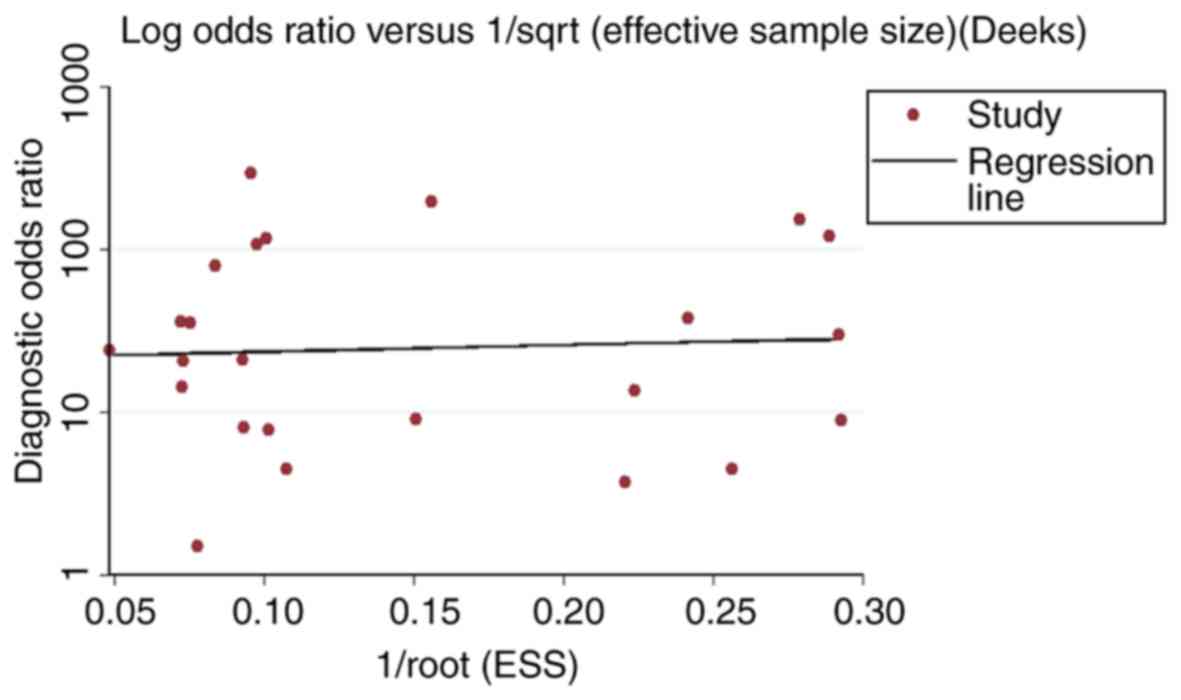
respectively (Table III; Fig. 3). Nevertheless, no publication bias
existed in the meta-analysis according to Deeks test. (P=0.877;
Fig. 6).
| Table III.Summary estimates of diagnostic
criteria and the 95% confidence intervals of four subgroups. |
Table III.
Summary estimates of diagnostic
criteria and the 95% confidence intervals of four subgroups.
| Analysis | RT-qPCR
subgroup | Non-coding RNA
profiling by array subgroup | Tissue
subgroup | Serum/plasma
subgroup |
|---|
| Sensitivity (95%
CI) | 0.81
(0.79–0.83) | 0.77
(0.71–0.83) | 0.73
(0.69–0.76) | 0.81
(0.7869–0.83) |
| Specificity (95%
CI) | 0.82
(0.79–0.84) | 0.68
(0.61–0.74) | 0.72
(0.67–0.77) | 0.82
(0.79–0.85) |
| Positive LR (95%
CI) | 4.12
(3.02–5.61) | 4.57
(1.30–16.06) | 4.35
(1.66–11.39) | 4.44
(3.16–6.25) |
| Negative LR (95%
CI) | 0.22
(0.15–0.30) | 0.39
(0.24–0.64) | 0.36
(0.28–0.47) | 0.21
(0.15–0.30) |
| DOR (95% CI) | 22.00
(12.73–38.01) | 15.70
(3.32–74.29) | 15.24
(5.00–46.45) | 23.99
(13.27–43.37) |
| AUC | 0.896 | 0.822 | 0.826 | 0.902 |
Potential target gene collection and
bioinformatics analysis
Collection of prospective target
genes
A total of 48,446 target genes were identified from
14 prediction software packages and genes had to be identified ≥3
times to be regarded as potential target genes of miR-21-5p.
Reduced-expression genes assembled from TCGA and GEO and genes
selected from NLP were integrated to identify overlapping genes.
Out of the 10,911 potential target genes, 1,123 reduced-expression
genes from TCGA, 2,956 reduced-expression genes from GEO and 1,800
genes were analyzed for intersection. This resulted in 39 target
genes attained for the following bioinformatics analyses.
Functional annotation and signal
pathway analyses
The GO annotation system in DAVID identified the 39
target genes significantly involved in the following biological
processes: ‘response to chemical stimulus’ (GO:0042221;
P=2.08×10⁻¹¹), ‘regulation of MAPKKK cascade’
(GO:0043408; P=1.68×10⁻¹⁰) and ‘regulation of
intracellular protein kinase cascade’ (GO:0010627;
P=2.39×10⁻¹⁰) (Table IV;
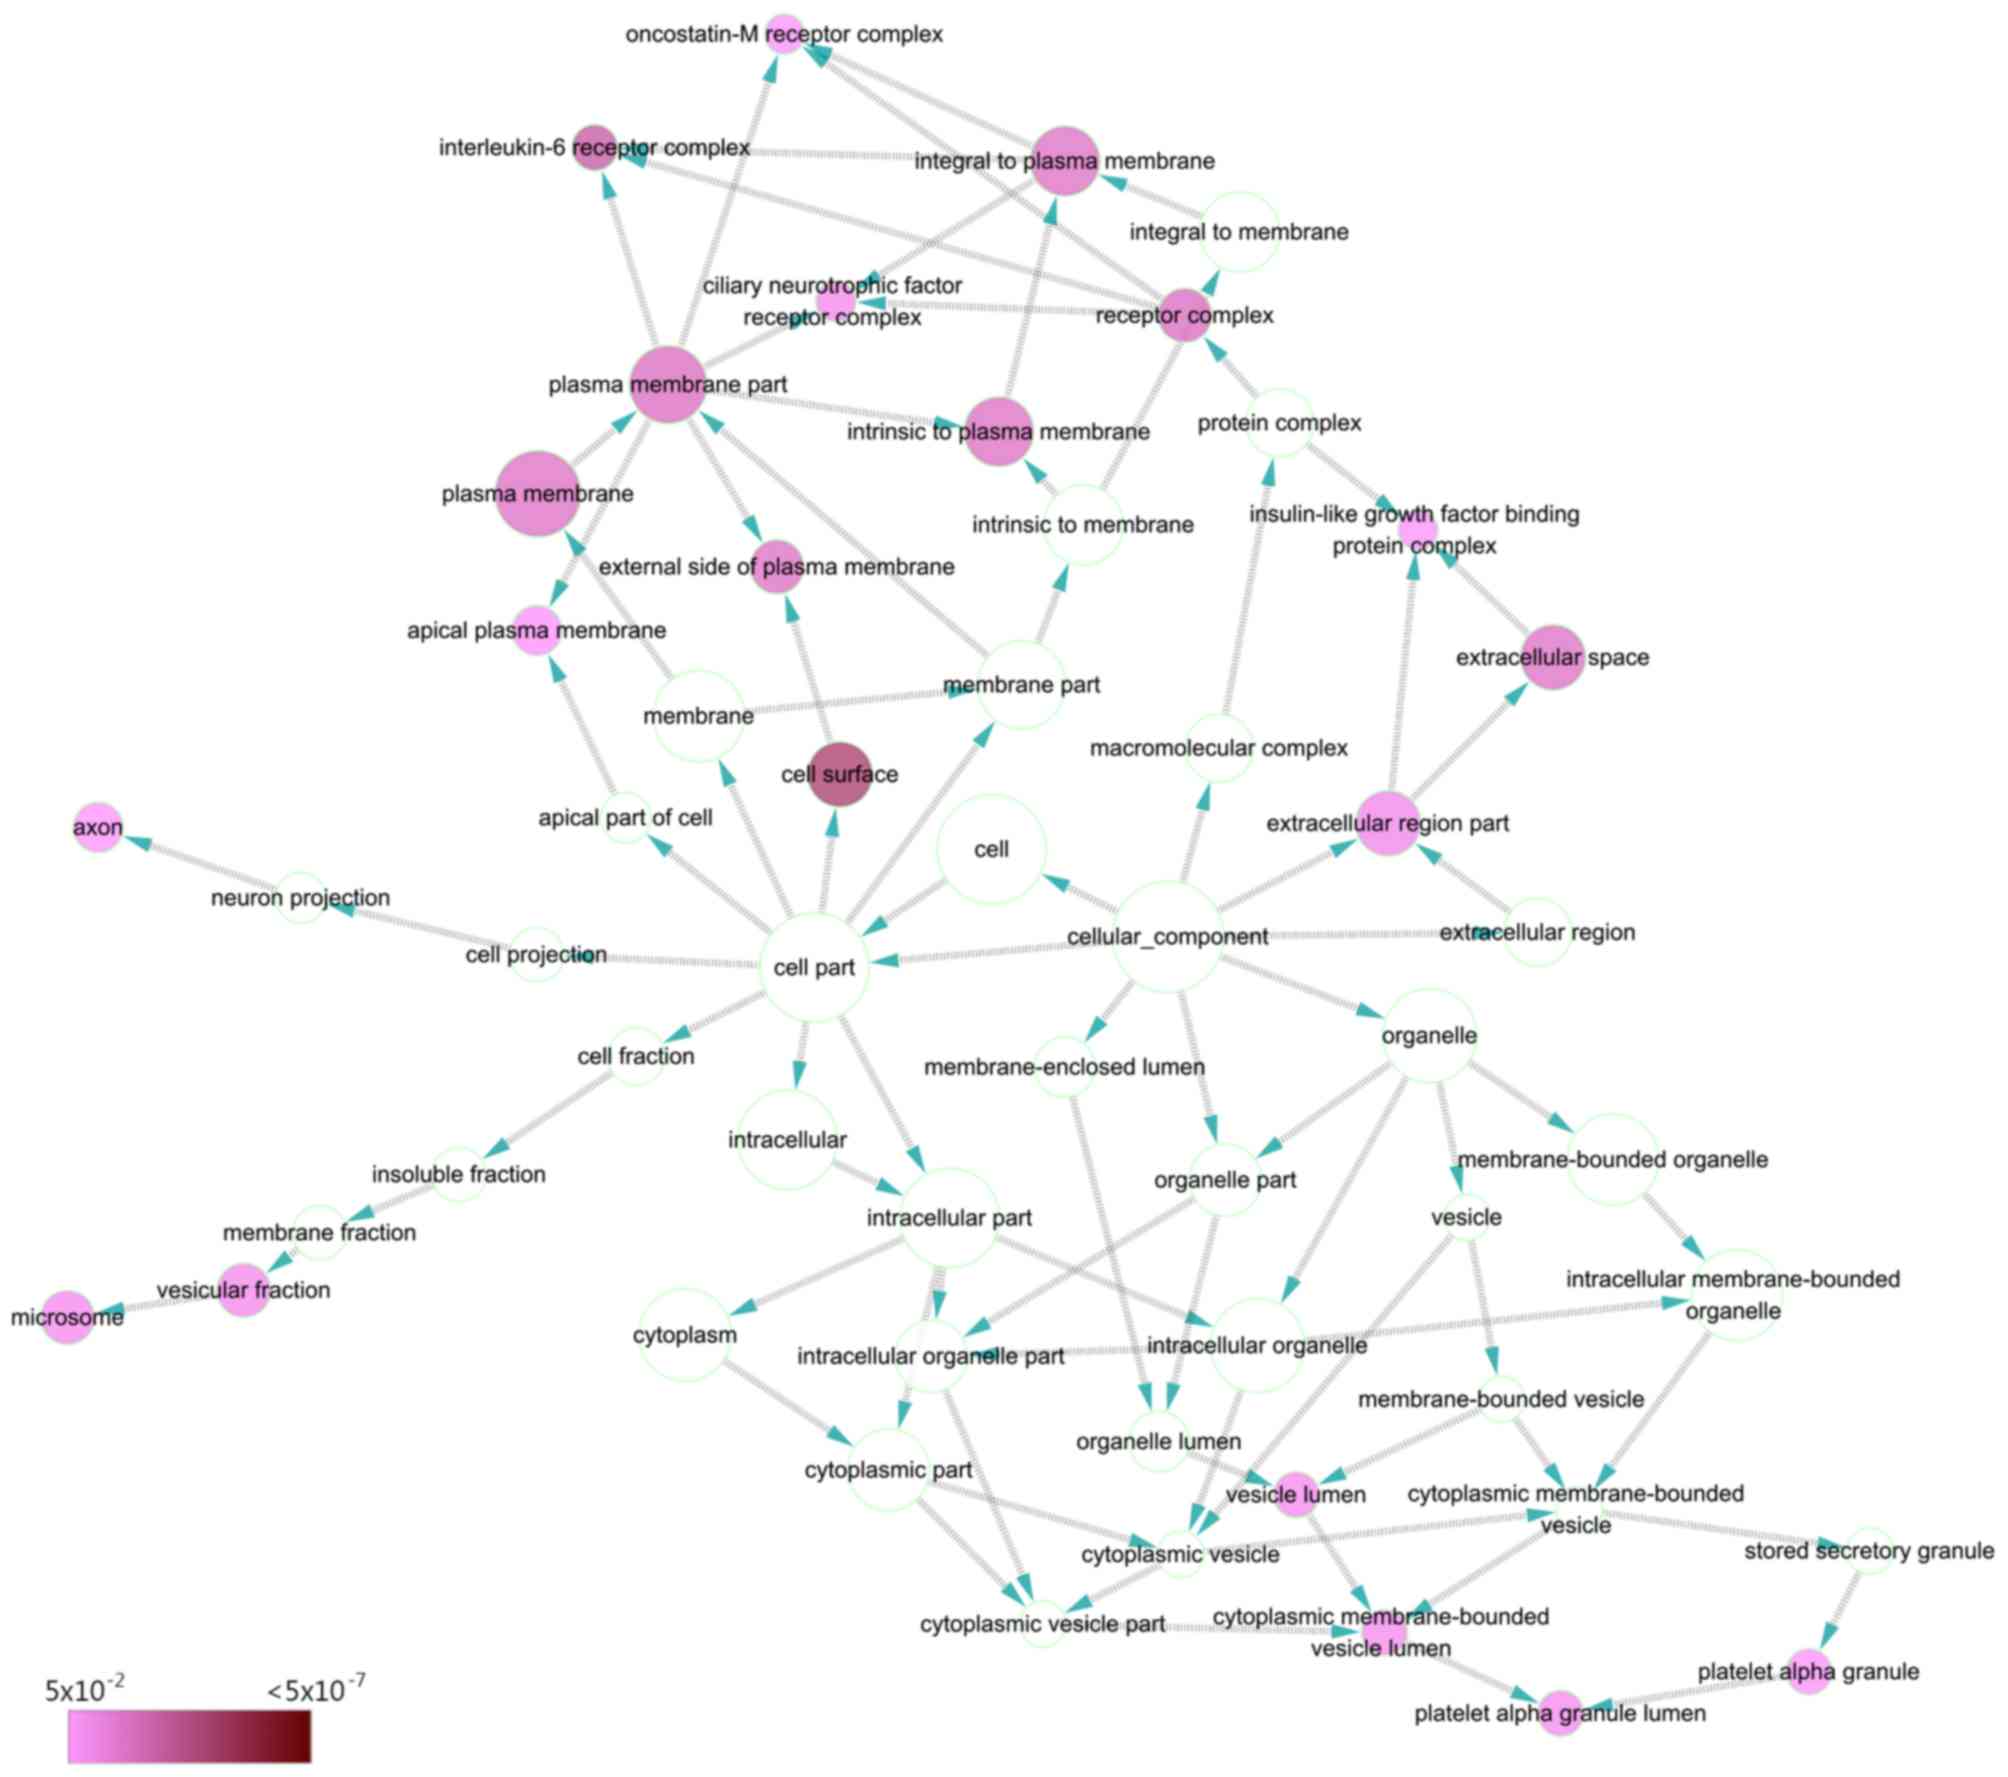
Fig. 7). As for cellular components,
target genes were concentrated in terms of the ‘cell surface’
(GO:0009986; P=9.04×10⁻⁷), ‘interleukin-6 receptor
complex’ (GO:0005896; P=1.57×10⁻⁵) and ‘plasma membrane
part’ (GO:0044459; P=8.66×10⁻⁵) (Table IV; Fig.
8). The ten significant GO terms were exhibited for BP, CC and
MF.
| Table IV.GO functional annotation of the
target genes of miR-21-5p. |
Table IV.
GO functional annotation of the
target genes of miR-21-5p.
| GO ID | GO term | Category | Count | P-value | Correlation
P-value |
|---|
| GO:0042221 | Response to
chemical stimulus | BP | 20 | 2.08E-11 | 3.0689E-08 |
| GO:0043408 | Regulation of
MAPKKK cascade | BP | 9 | 1.68E-10 | 1.173E-07 |
| GO:0010627 | Regulation of
intracellular protein kinase cascade | BP | 11 | 2.39E-10 | 1.173E-07 |
| GO:0048518 | Positive regulation
of biological process | BP | 21 | 4.33E-09 | 1.2905E-06 |
| GO:0050896 | Response to
stimulus | BP | 26 | 4.92E-09 | 1.2905E-06 |
| GO:0010648 | Negative regulation
of cell communication | BP | 10 | 5.26E-09 | 1.2905E-06 |
| GO:0042127 | Regulation of cell
proliferation | BP | 14 | 6.66E-09 | 1.4006E-06 |
| GO:0048523 | Negative regulation
of cellular process | BP | 19 | 1.09E-08 | 0.000002015 |
| GO:0009968 | Negative regulation
of signal transduction | BP | 7 | 1.77E-08 | 0.000002835 |
| GO:0023057 | Negative regulation
of signaling process | BP | 7 | 1.99E-08 | 0.000002835 |
| GO:0009986 | Cell surface | CC | 8 | 9.04E-07 | 0.00010939 |
| GO:0005896 | Interleukin-6
receptor complex | CC | 2 | 1.57E-05 | 0.00095048 |
| GO:0044459 | Plasma membrane
part | CC | 14 | 8.66E-05 | 0.0034849 |
| GO:0043235 | Receptor
complex | CC | 4 | 1.15E-04 | 0.0034849 |
| GO:0005886 | Plasma
membrane | CC | 19 | 2.19E-04 | 0.0040511 |
| GO:0005615 | Extracellular
space | CC | 8 | 2.57E-04 | 0.0040511 |
| GO:0005887 | Integral to plasma
membrane | CC | 10 | 2.61E-04 | 0.0040511 |
| GO:0009897 | External side of
plasma membrane | CC | 4 | 2.78E-04 | 0.0040511 |
| GO:0031226 | Intrinsic to plasma
membrane | CC | 10 | 3.01E-04 | 0.0040511 |
| GO:0044421 | Extracellular
region part | CC | 8 | 1.60E-03 | 0.019331 |
| GO:0019838 | Growth factor
binding | MF | 6 | 2.10E-07 | 0.000056609 |
| GO:0034875 | Caffeine oxidase
activity | MF | 2 | 3.53E-05 | 0.0031751 |
| GO:0033695 | Oxidoreductase
activity, acting on CH or CH2 groups, quinone or similar compound
as acceptor | MF | 2 | 3.53E-05 | 0.0031751 |
| GO:0016725 | Oxidoreductase
activity, acting on CH or CH2 groups | MF | 2 | 2.62E-04 | 0.017694 |
| GO:0005496 | Steroid
binding | MF | 3 | 5.66E-04 | 0.023457 |
| GO:0051117 | ATPase binding | MF | 2 | 6.07E-04 | 0.023457 |
| GO:0008083 | Growth factor
activity | MF | 4 | 6.09E-04 | 0.023457 |
| GO:0060089 | Molecular
transducer activity | MF | 13 | 1.17E-03 | 0.023457 |
| GO:0004871 | Signal transducer
activity | MF | 13 | 1.17E-03 | 0.023457 |
| GO:0005125 | Cytokine
activity | MF | 4 | 1.35E-03 | 0.023457 |
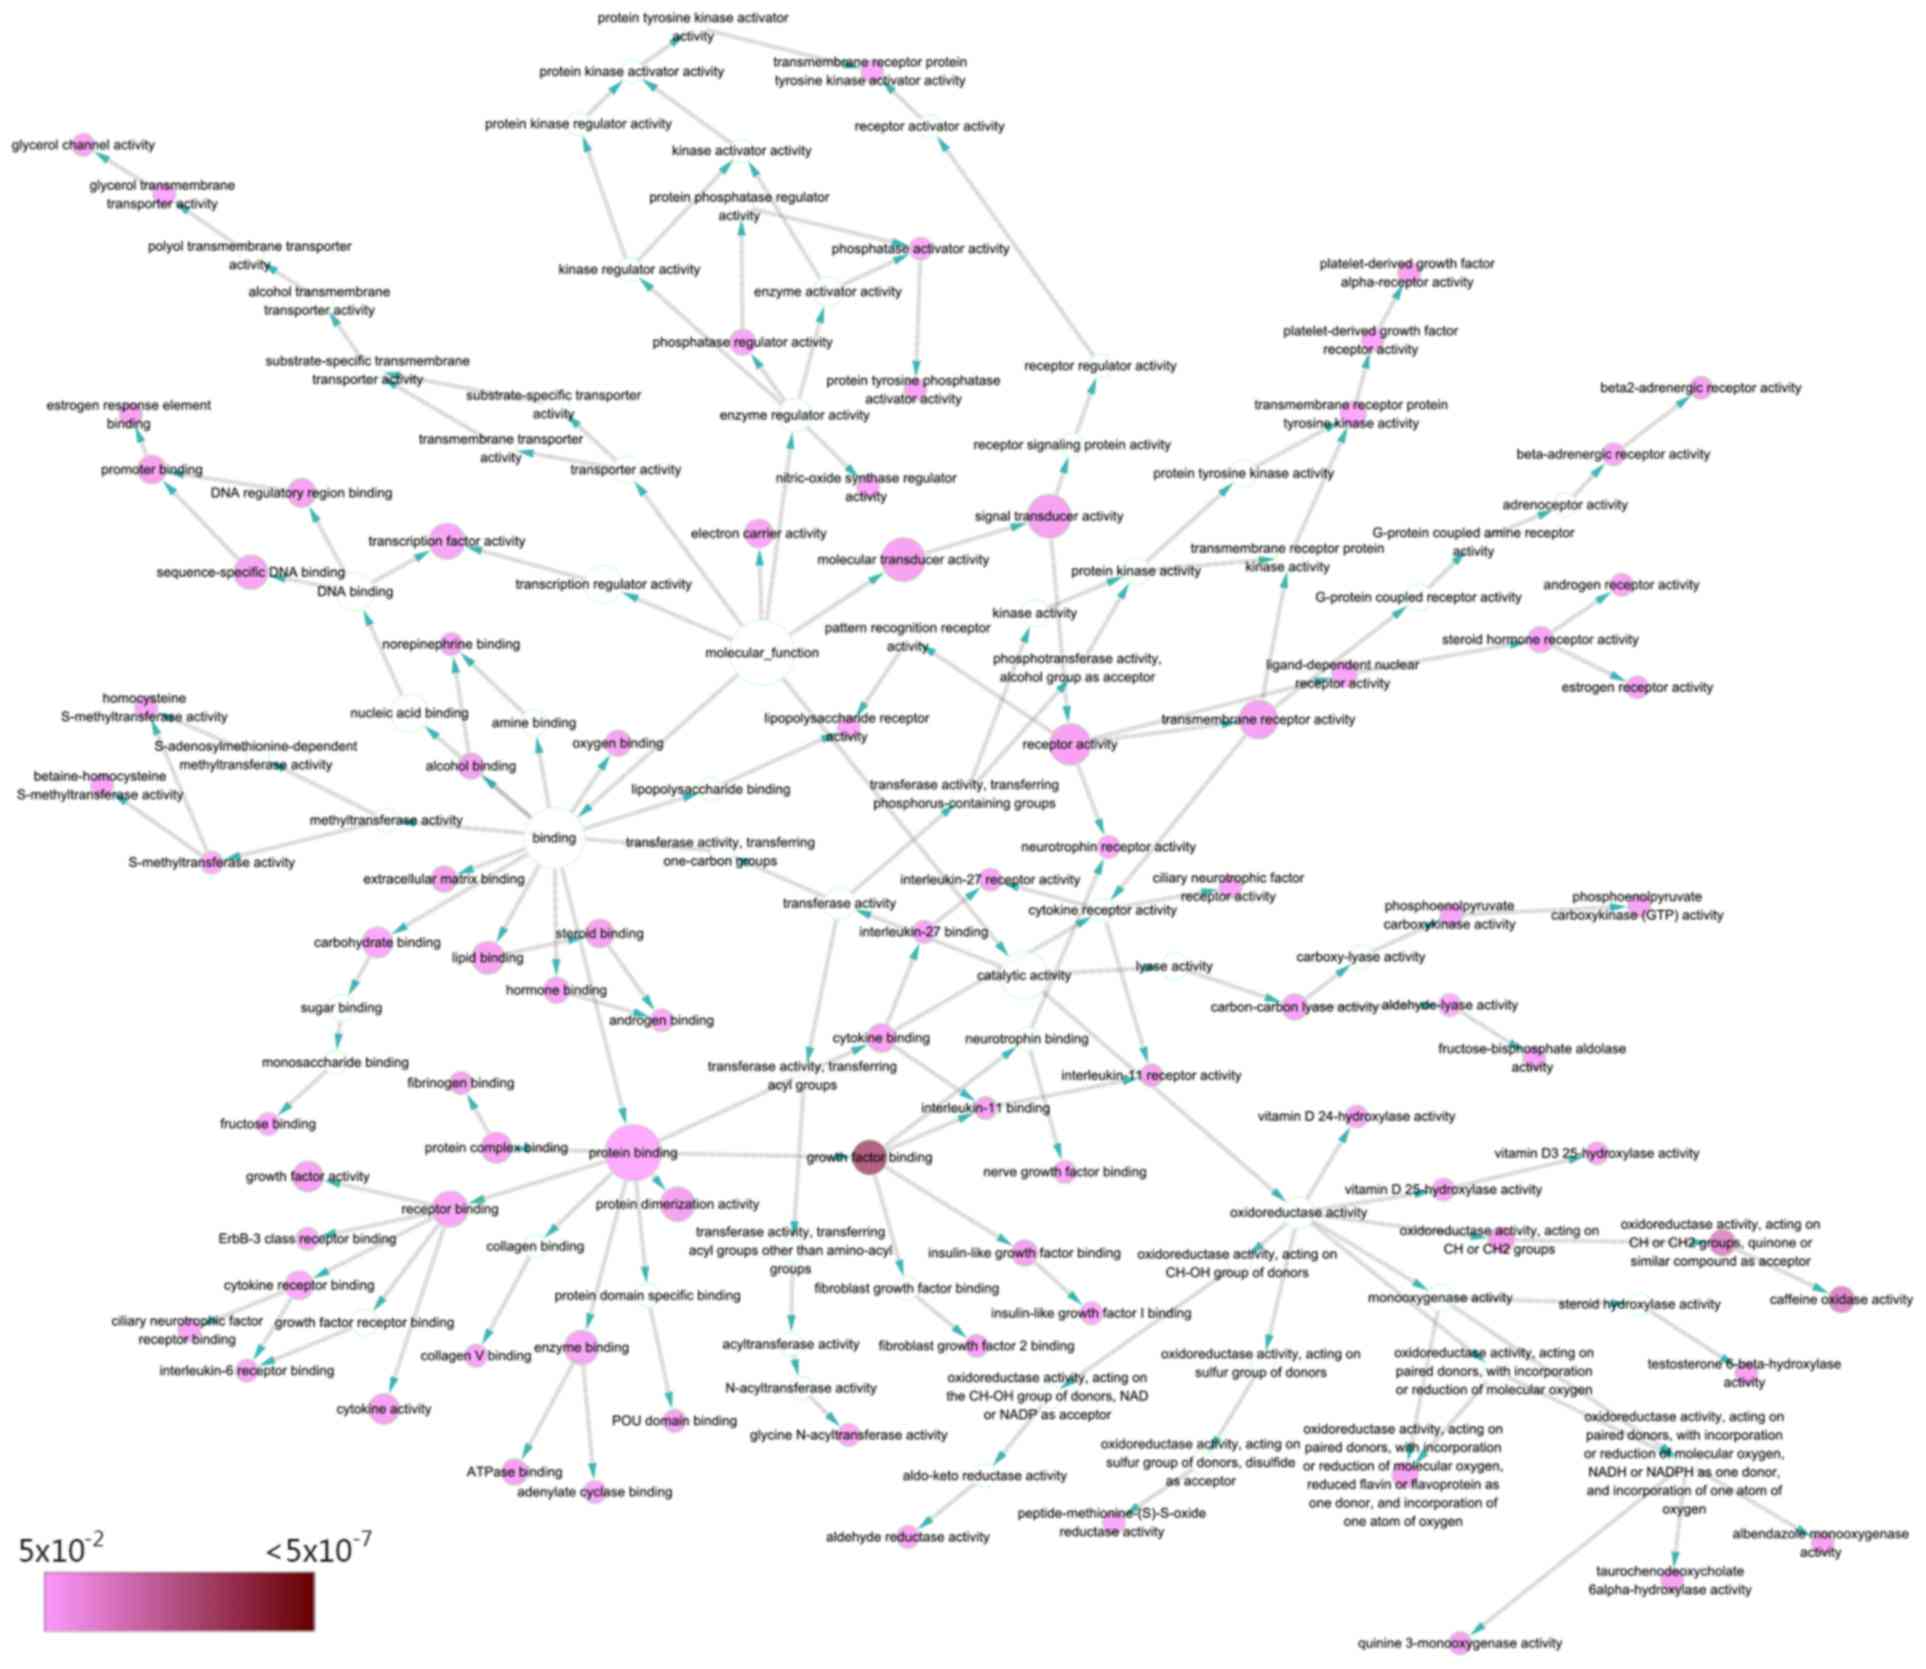
Genes were prominently accumulated in 3 molecular
functions, including ‘growth factor binding’ (GO:0019838;
P=2.10×10⁻⁷), ‘caffeine oxidase activity’ (GO:0034875;
P=3.53×10⁻⁵) and ‘oxidoreductase activity, acting on CH
or CH2 groups, quinone or similar compound as acceptor’
(GO:0033695; P=3.53×10⁻⁵ (Table IV; Fig.
9). Additionally, five pathways took precedence in KEGG pathway
analysis (FDR<0.01): ‘Cytokine-cytokine receptor interaction’
(hsa04060; FDR=0.00262), ‘Rap1 signaling pathway’ (hsa04015;
FDR=0.00393), ‘PI3K-Akt signaling pathway’ (hsa04151; FDR=0.00393),
‘Malaria’ (hsa05144; FDR=0.00659) and ‘MicroRNAs in cancer’
(hsa05206; FDR=0.00894) (Table
V).
| Table V.KEGG pathway analysis of the target
genes of miR-21-5p. |
Table V.
KEGG pathway analysis of the target
genes of miR-21-5p.
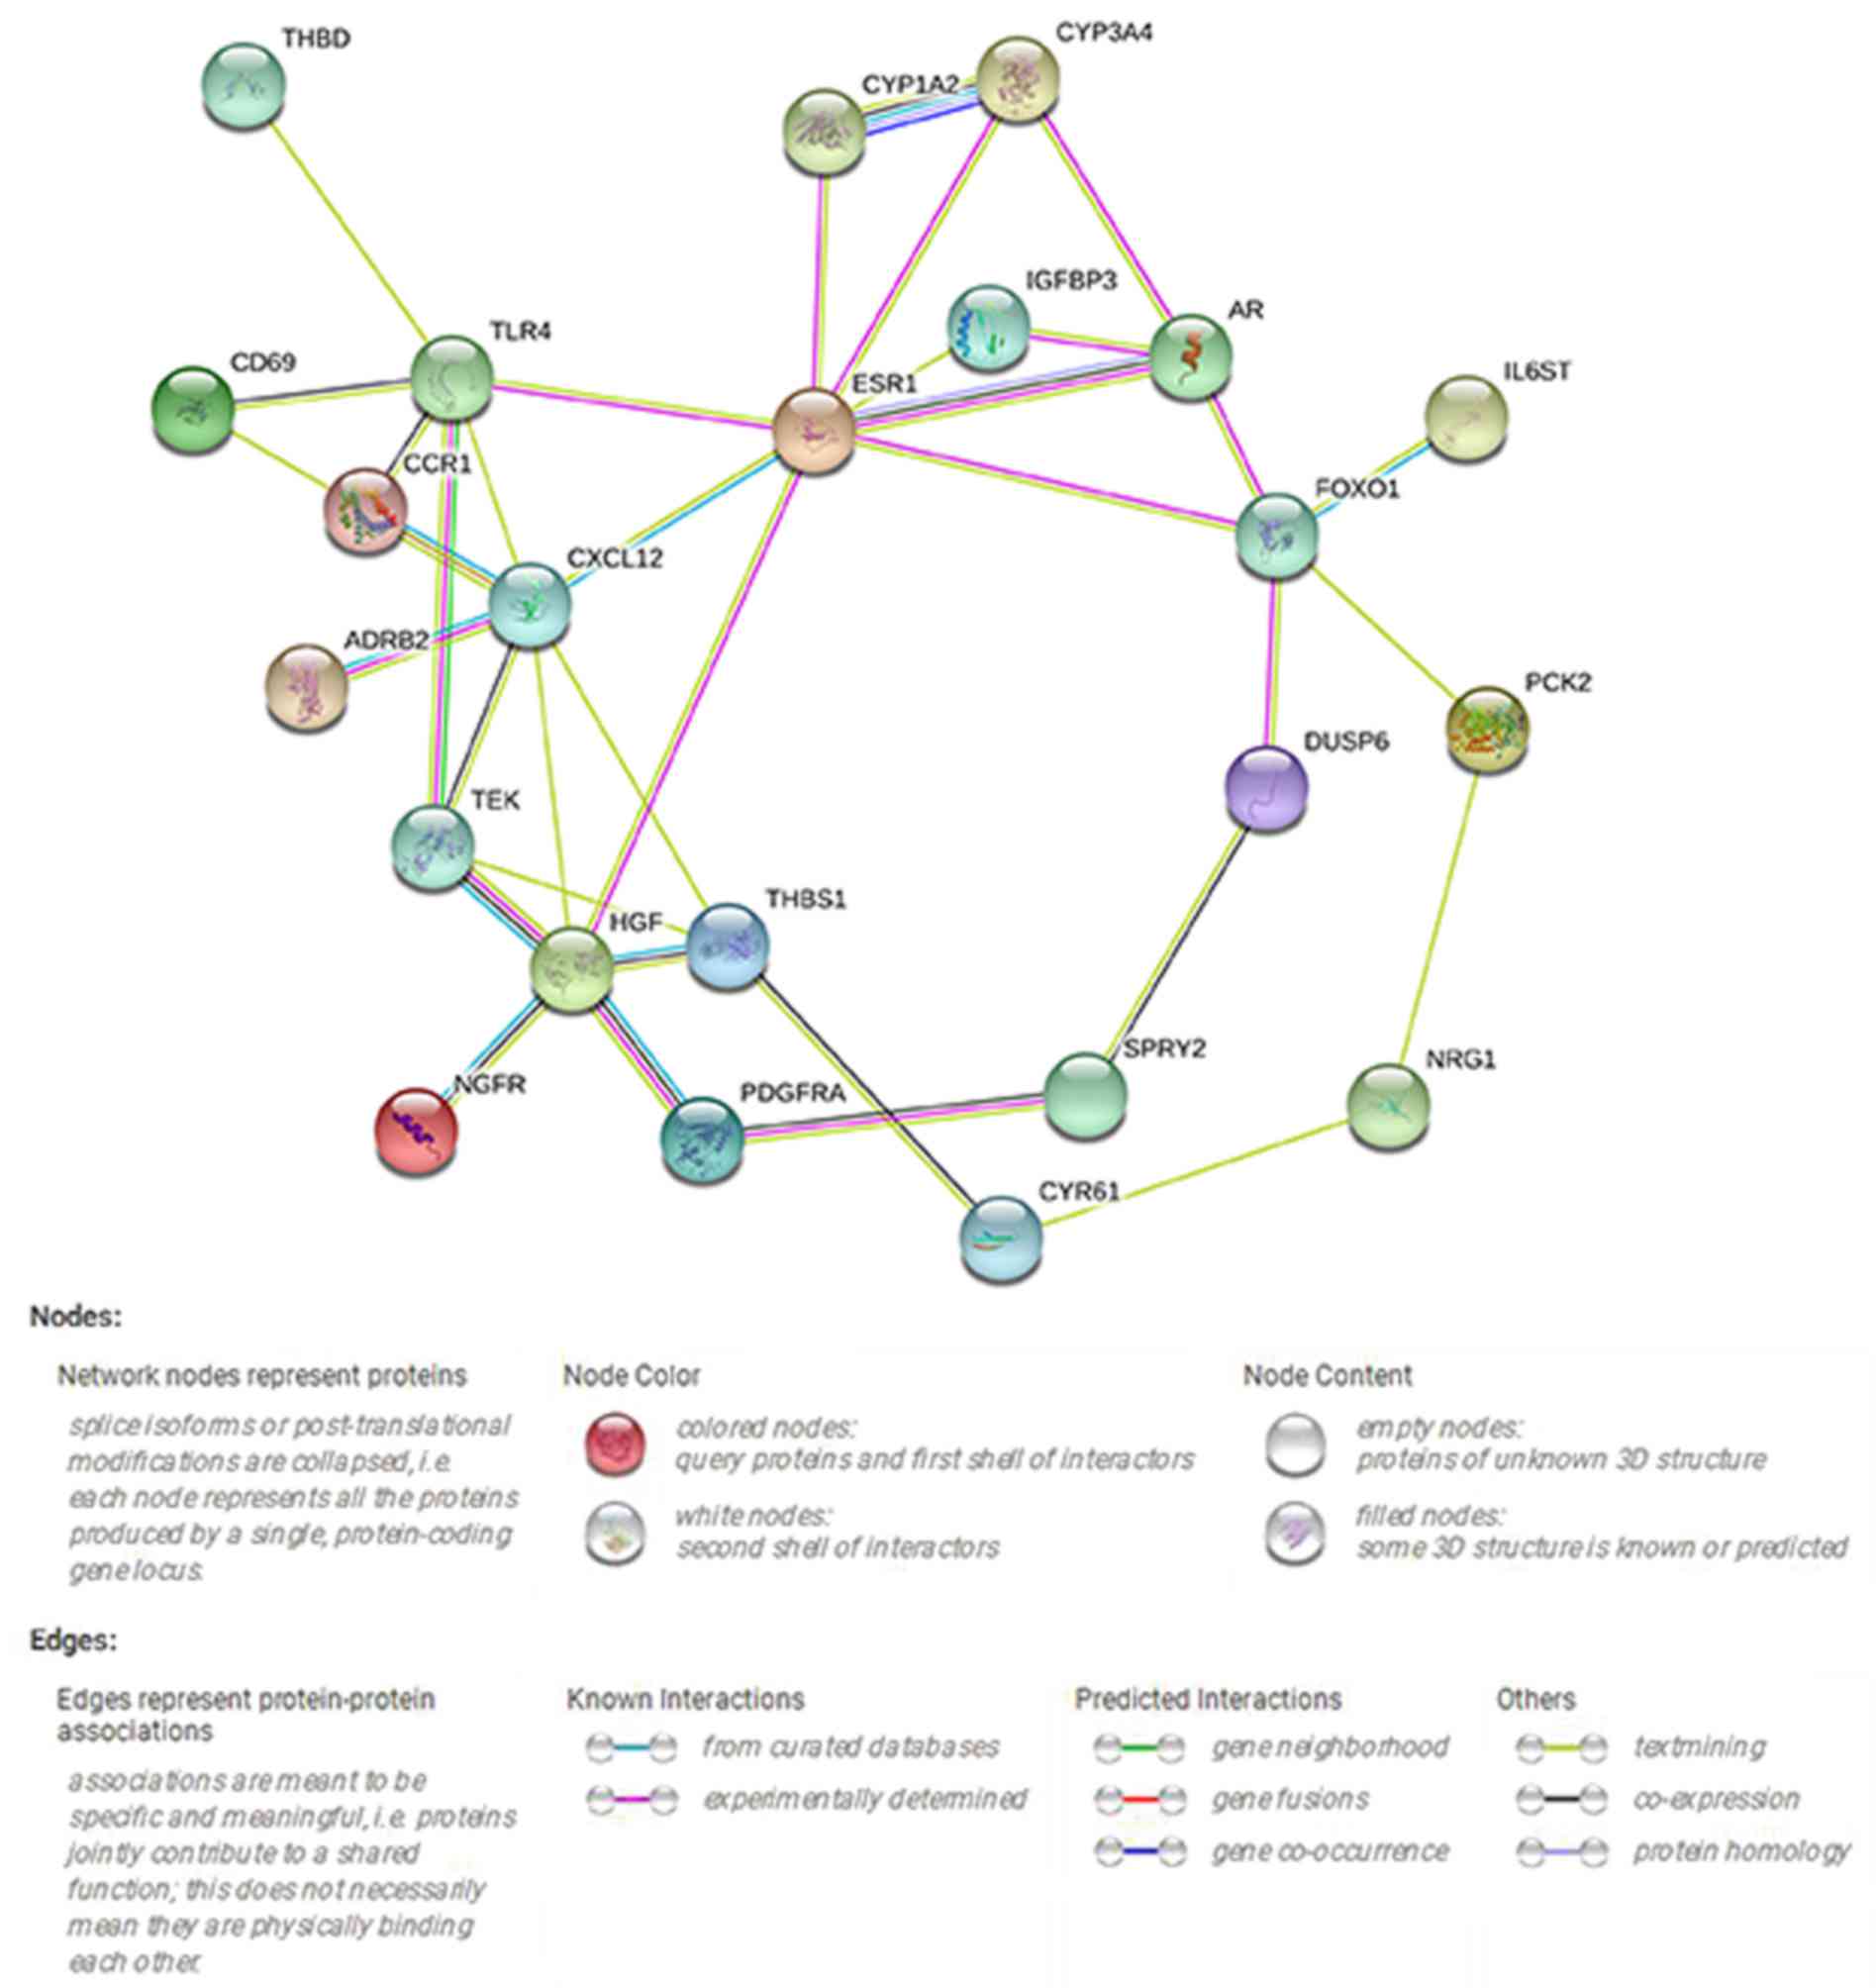
| KEGG ID | Name | Count | FDR | Gene symbol |
|---|
| hsa04060 | Cytokine-cytokine
receptor interaction | 6 | 0.00262 | CCR1, CXCL12, HGF,
IL6ST, NGFR, PDGFRA |
| hsa04015 | Rap1 signaling
pathway | 5 | 0.00393 | HGF, NGFR, PDGFRA,
TEK, THBS1 |
| hsa04151 | PI3K-Akt signaling
pathway | 6 | 0.00393 | HGF, NGFR, PDGFRA,
TEK, THBS1, TLR4 |
| hsa05144 | Malaria | 3 | 0.00659 | HGF, THBS1,
TLR4 |
| hsa05206 | MicroRNAs in
cancer | 4 | 0.00894 | PDGFRA, SPRY2,
THBS1, ZEB2 |
| hsa05202 | Transcriptional
misregulation in cancer | 4 | 0.0126 | DUSP6, FOXO1,
IGFBP3, NGFR |
| hsa05215 | Prostate
cancer | 3 | 0.0204 | AR, FOXO1,
PDGFRA |
| hsa05323 | Rheumatoid
arthritis | 3 | 0.0204 | CXCL12, TEK,
TLR4 |
| hsa04014 | Ras signaling
pathway | 4 | 0.0225 | HGF, NGFR, PDGFRA,
TEK |
| hsa05205 | Proteoglycans in
cancer | 4 | 0.0225 | ESR1, HGF, THBS1,
TLR4 |
PPI network construction
The PPI network indicating the interactions between
39 target genes of miR-21-5p is demonstrated by 39 nodes and 36
edges in Fig. 10. A total of 5 hub
genes were identified according to their scores, including HGF,
FOXO1, THBS1, ESR1 and CXCL12.
Diagnostic values of the 5 hub
genes
Significantly increased expression of HGF was
observed in normal controls (10.19±0.13) compared with patients
with HCC (7.45±0.23) (P<0.001; Fig.
11Aa). Similarly, the FOXO1 expression level was significantly
increased in normal controls (11.36±0.11) compared with patients
with HCC (10.15±0.13) (P<0.001; Fig.
11Ab). Patients with HCC had a significantly decreased THBS1
expression level (11.57±0.24) compared with healthy controls
(13.09±0.18) (P<0.001; Fig.
11Ac). Expression of ESR1 was significantly increased in normal
controls (10.51±0.10) compared with patients with HCC (7.52±0.33)
(P<0.001; Fig. 11Ad).
Significantly increased CXCL12 expression level was observed in
normal controls (13.18±0.10) compared with patients with HCC
(10.15±0.25) P<0.001; Fig. 11Ae).
The AUCs of HGF, FOXO1, THBS1, ESR1 and CXCL12 were 0.9437 (95% CI,
0.9220–0.9654; P<0.0001; Fig.
11Ba), 0.9232 (95% CI, 0.8951–0.9513; P<0.0001; Fig. 11Bb), 0.8686 (95% CI, 0.8258–0.9114;
P<0.0001; Fig. 11Bc), 0.9511 (95%
CI, 0.9299–0.9724; P<0.0001; Fig.
11Bd) and 0.9816 (95% CI, 0.9705–0.9927; P<0.0001; Fig. 11Be), respectively. The results of
correlation analysis between the hub genes (HGF, FOXO1, THBS1, ESR1
and CXCL12) and miR-21-5p were as follows: (R=0.01851; P=0.08995;
Fig. 11Ca), (R=−0.3467; P=0.0147;
Fig. 11Cb), (R=0.4334; P=0.0019;
Fig. 11Cc), (R=−0.4129; P=0.0032;
Fig. 11Cd), (R=0.3830; P=0.0066;
Fig. 11Ce), respectively.
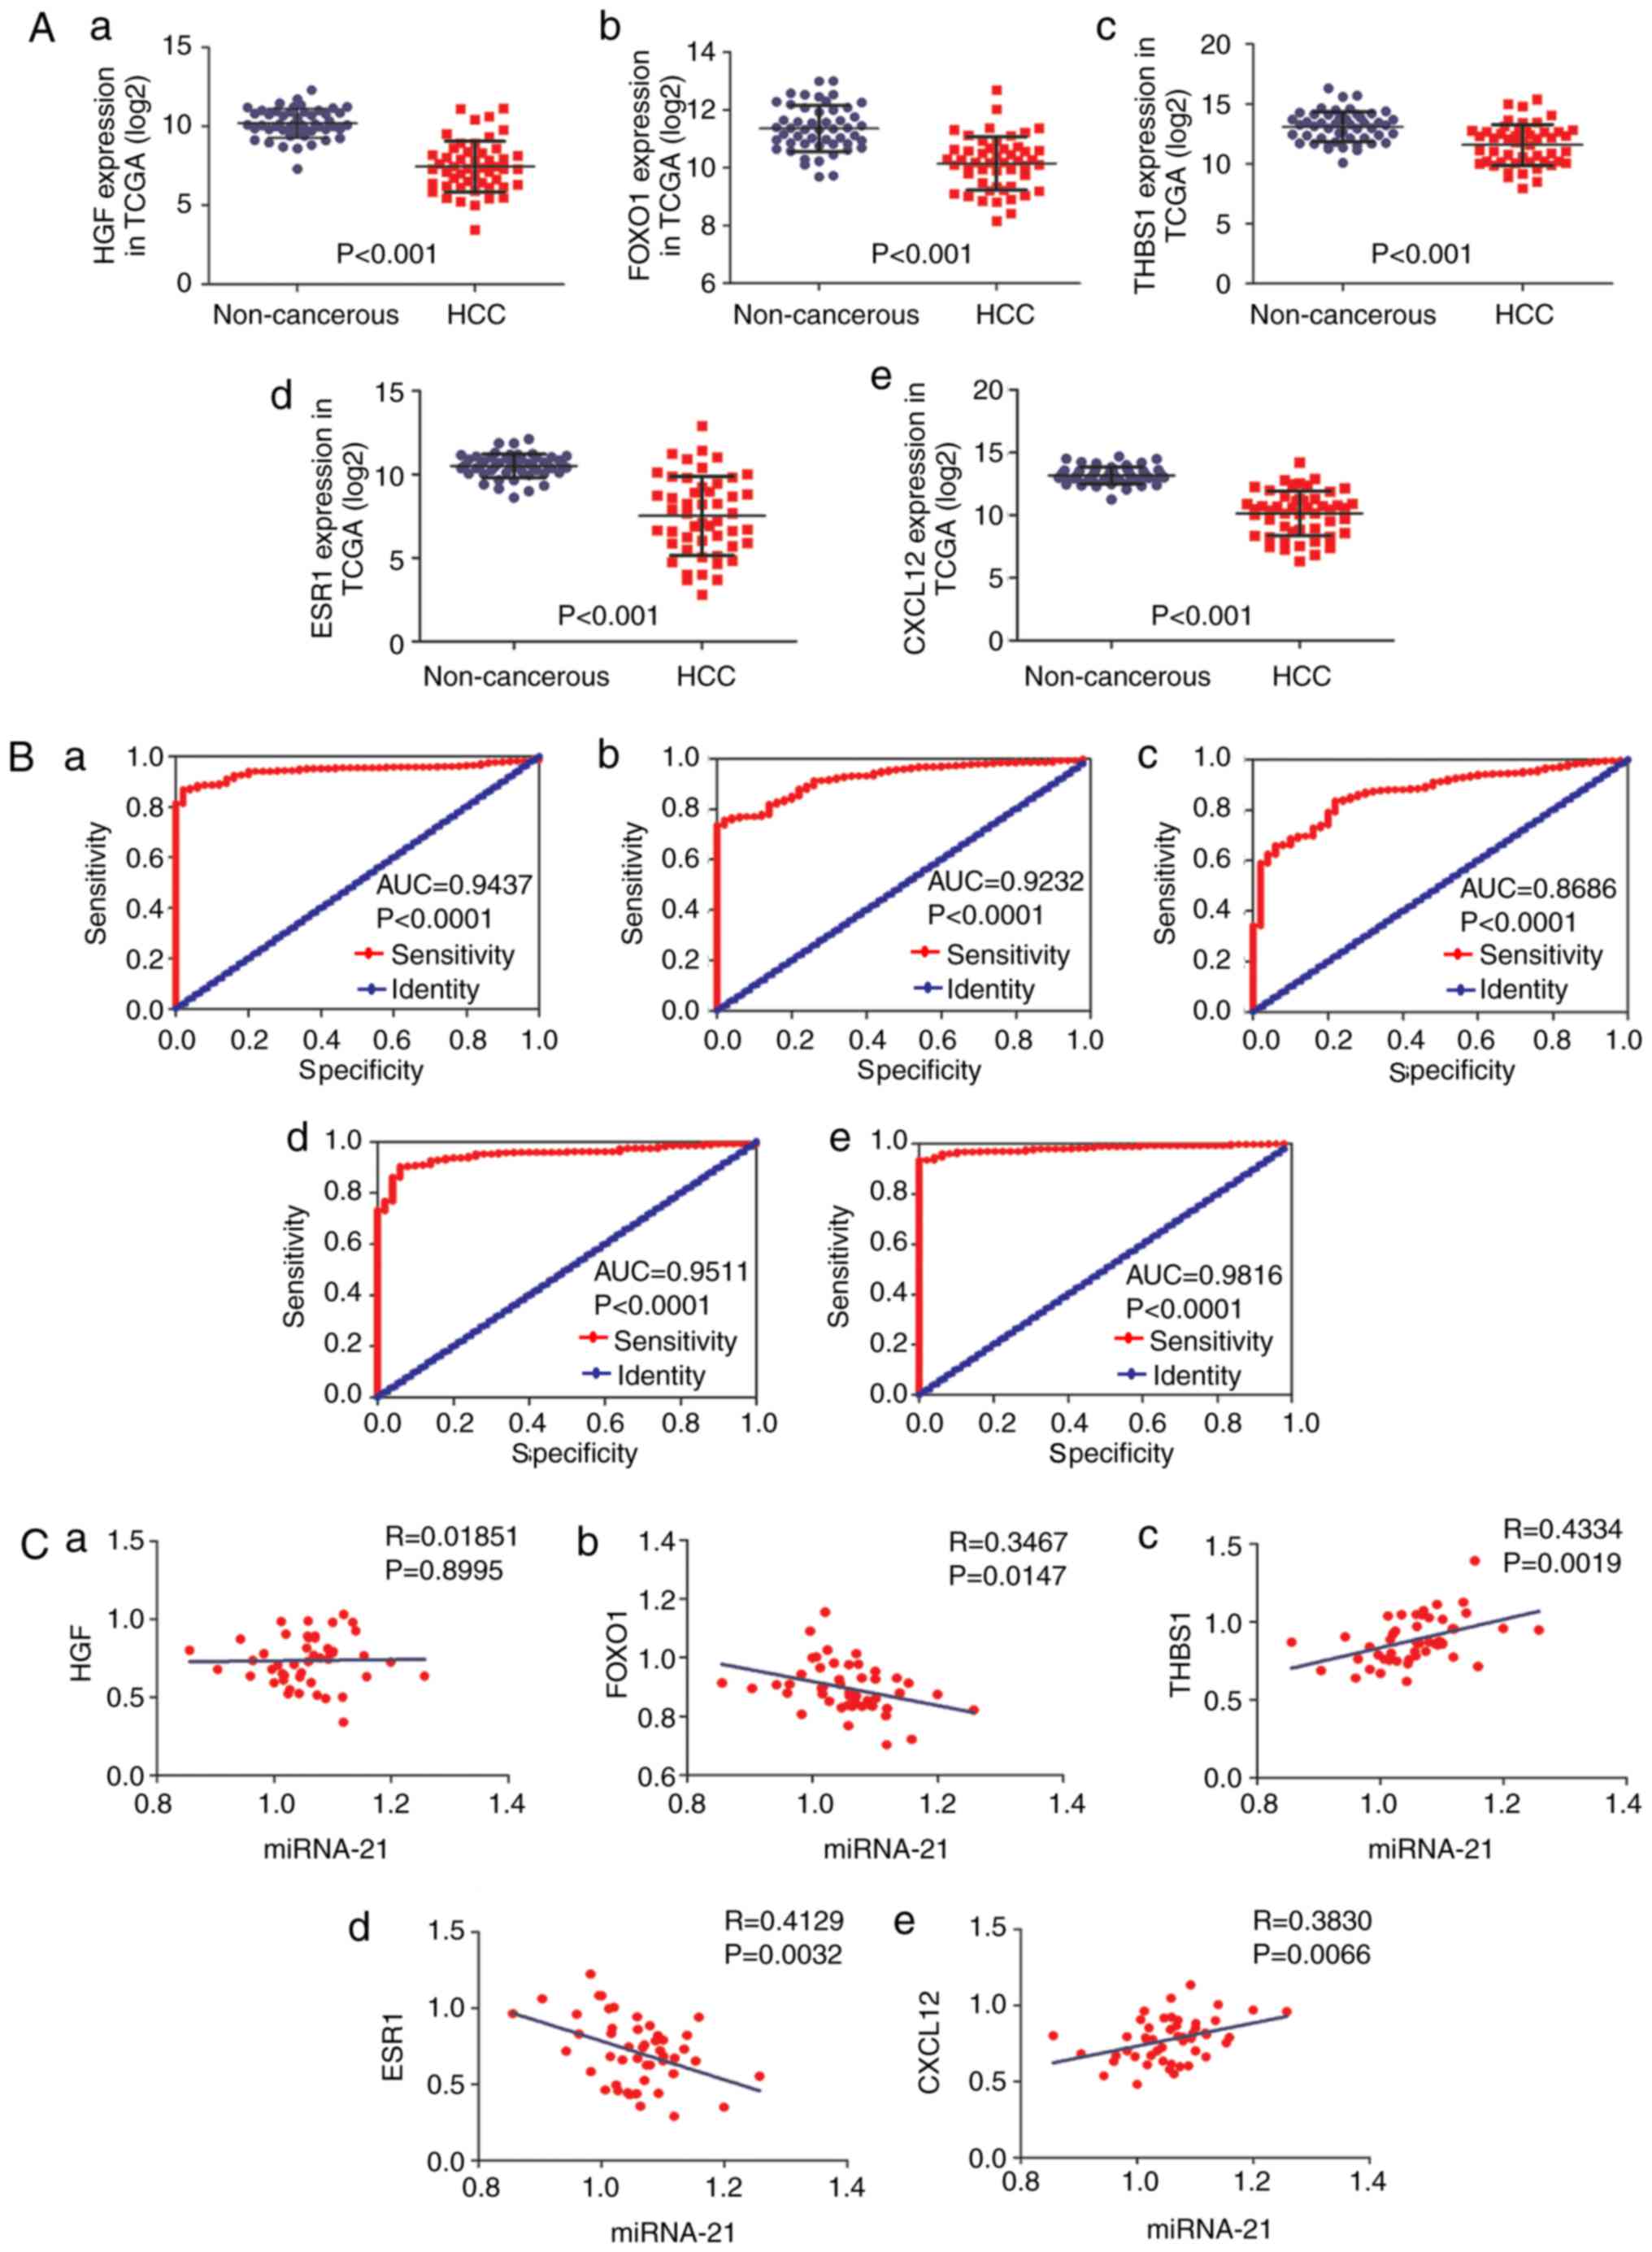 | Figure 11.Expression levels, ROC curves and
correlation analysis of the 5 hub genes. (A) Expression levels of
(a) HGF, (b) FOXO1, (c) THBS1, (d) ESR1 and (e) CXCL12 in HCC
tissues and non-cancerous tissues from TCGA data. (B) ROC curves of
(a) HGF, (b) FOXO1, (c) THBS1, (d) ESR1 and (e) CXCL12 in HCC from
TCGA data. (C) Correlation analysis of (a) HGF, (b) FOXO1, (c)
THBS1, (d) ESR1 and (e) CXCL12 and miR-21-5p from TCGA data. HCC,
hepatocellular carcinoma; TCGA, The Cancer Genome Atlas; ROC,
receiver operating characteristic; HGF, hepatocyte growth factor;
FOXO1, forkhead box 1; THBS1, thrombospondin 1; ESR1, estrogen
receptor 1; CXCL12, C-X-C motif chemokine ligand 12. |
Discussion
The pathogenesis of HCC has been extensively
investigated and there is a consensus that miRNAs may act as vital
diagnostic markers for the detection of multiple types of
malignancy. In particular, miR-21-5p, located on chromosome
17q23.1, has been reported to be implicated in cancer diagnosis and
prognosis (47,48). Numerous previous studies have
investigated the underlying functional mechanism of miR-21-5p in
numerous types of tumor. Wu et al (49), Zeng et al (50), Qu et al (51) and Markou et al (52) have investigated miR-2-5p in colorectal
cancer, gastric cancer, pancreatic cancer and non-small cell lung
cancer, respectively. Previous studies have also reported a
decrease in tumor-cell proliferation, migration and invasion
following the knockdown of miR-21-5p expression in HCC cells
(53,54). Tomimaru et al demonstrated that
the ROC analysis of plasma miR-21 yielded an AUC of 0.953 (87.3%
sensitivity and 92.0% specificity) for differentiating HCC from
healthy participants. In addition, when distinguishing between
liver cancer and chronic hepatitis, plasma miR-21 yielded an AUC of
0.773 (83.3% specificity and 61.1% sensitivity) (37). This meta-analysis of integrated
studies from literature, GEO and TCGA demonstrated appreciable
diagnostic significance of miR-21-5p for HCC. Studies based on
RT-qPCR and serum/plasma have been identified to have improved
diagnostic value compared with the array and tissue studies.
Furthermore, the detection of miR-21 expression from serum/plasma
is non-invasive, making it more applicable in a clinical
setting.
In previous studies, miR-21-5p diagnostic ability
has been reported, due to an increased level of expression being
correlated with HBV infection, advanced tumor grade, history of
risk factors and advanced pathological stage. HBV infection is
considered to be a major risk factor for hepatocarcinogenesis
(55). However, the underlying
mechanism of miRNAs with HBV-associated HCC requires further
investigation. Xie et al have identified certain factors
contributing to HCC, including long-term HBV infection, high levels
of HBV replication, HBV genotype, specific HBV variants, HBV
integration and HBV coding proteins (56). Xie et al (57) have summarized the change in expression
of numerous miRNAs in HBV infection and have demonstrated the
upregulation of miR-21 expression in HBV-associated HCC. In the
present study, a more accurate diagnostic effect of miR-21-5p was
demonstrated in distinguishing patients with HCC from a healthy
population (AUC=0.926) compared with patients from chronic HBV
(AUC=0.904). The result further verified the elevated expression of
miR-21-5p in HBV-associated HCC.
A total of 5 hub genes (HGF, FOXO1, THBS1, ESR1 and
CXCL12) were identified by PPI network construction. It should be
noted that FOXO1 and ESR1 were negatively correlated with
miR-21-5p. Forkhead box O1 (FOXO1 or FKHR) has been reported to be
the target gene of miR-21 in various types of tumor, including
large B-cell lymphoma, pancreatic ductal adenocarcinoma and
glioblastoma (58–60). The aforementioned studies have
identified that overexpression of miR-21 decreased the level of
FOXO1. Dong et al have claimed that FOXO1 inhibits the
invasion and metastasis of HCC (61).
However, the specific function of FOXO1 in HCC has not yet been
determined. The role of estrogen receptor 1 (ESR1) in breast cancer
has been investigated, but also its clinical relevance in prostate,
endometrial and other types of cancer (62). The expression of ESR1 can predict the
grade and stage of non-muscle-invasive bladder carcinoma have been
reported (63). Dou et al have
stated that methylation of ESR1 in HBV-associated HCC may be
affected by HBV (64). A study by
Hishida et al (65) considered
ESR1 as a candidate tumor suppressor gene in HCC. THBS1 may serve a
role as an inhibitor of tumor growth, cell migration and
neovascularization in lung cancer (66). From the functional annotation analysis
in the present study, the hub genes participated in various
processes, including ‘response to chemical stimulus’, ‘cell
surface’ and ‘growth factor binding’. It was speculated that
miR-21-5p expression may be involved in metabolism or apoptotic
processes of HCC.
While the present study provides additional evidence
supporting the use of miR-21-5p to diagnose HCC, there are
limitations that should be acknowledged. Firstly, significant
heterogeneity was unavoidable. As noted in the meta-analysis,
samples from serum or plasma and the use of RT-qPCR were more
precise in diagnosing HCC compared with studies using tissues or
the array method, which indicated that the sample type and
experiment type may influence the accuracy of diagnosis. Secondly,
variation in sample size, sex ratio and age may also have
contributed to heterogeneity. Thirdly, miR-21-5p expression levels
in patients with HCC from different geographic locations and times
may also have an effect. In addition, the results were based solely
on data from a range of databases. Therefore, verification
experiments to reveal the underlying molecular mechanisms of
miR-21-5p are required to confirm the results of the present study,
particularly the pathway and functional analysis of miR-21-5p.
In conclusion, an accumulation of data from GEO
datasets, TCGA, NLP and literature databases was performed to
describe the application potential of miR-21-5p in HCC. Using
bioinformatics methods, including pathway enrichment analyses,
functional annotation by GO and correlation analysis, the
underlying molecular mechanism of miR-21-5p was investigated.
Subgroup analyses for different types of experiment and sample were
also conducted, in order to compare the diagnostic capacity and
identify sources of heterogeneity. FOXO1 and ESR1 were negatively
correlated with upregulation of miR-21-5p expression. The highest
enriched pathway (cytokine-cytokine receptor interaction) requires
further investigation. Prospective studies with large cohorts are
required to verify the present study's findings, and to clarify the
underlying molecular mechanism of miR-21-5p in HCC.
Acknowledgements
Not applicable.
Funding
The present study was partly supported by the Fund
of National Natural Science Foundation of China (grant no.
NSFC81260222 and NSFC81060202) and the Innovation Project of
Guangxi Graduate Education (grant no. YCSW2017105).
Availability of data and materials
All data generated or analyzed during this study are
included in this published article.
Authors' contributions
XZZ and YD conceived and designed the study,
acquired data, interpreted the results and drafted the manuscript.
HY and GC contributed to the acquisition of funding and support.
XZZ and YD analyzed the data. All authors read and approved the
final manuscript.
Ethics approval and consent to
participate
Not applicable.
Patient consent for publication
Not applicable.
Competing interests
The authors declare that they have no competing
interests.
Glossary
Abbreviations
Abbreviations:
|
HCC
|
hepatocellular carcinoma
|
|
TCGA
|
The Cancer Genome Atlas
|
|
GEO
|
Gene Expression Omnibus
|
|
GO
|
Gene Ontology
|
|
KEGG
|
Kyoto Encyclopedia of Genes and
Genomes
|
|
PPI
|
protein-protein interaction
network
|
|
NLP
|
Natural Language Processing
|
|
TP
|
true positive
|
|
FP
|
false positive
|
|
TN
|
true negative
|
|
FN
|
false negative
|
|
SEN
|
sensitivity
|
|
SPE
|
specificity
|
|
PLR
|
positive likelihood ratio
|
|
NLR
|
negative likelihood ratio
|
|
DOR
|
diagnostic odds ratio
|
|
ROC
|
receiver operating characteristic
|
|
AUC
|
area under the curve
|
References
|
1
|
Wallace MC, Preen D, Jeffrey GP and Adams
LA: The evolving epidemiology of hepatocellular carcinoma: A global
perspective. Expert Rev Gastroenterol Hepatol. 9:765–779. 2015.
View Article : Google Scholar : PubMed/NCBI
|
|
2
|
Siegel RL, Miller KD and Jemal A: Cancer
statistics, 2017. CA Cancer J Clin. 67:7–30. 2017. View Article : Google Scholar : PubMed/NCBI
|
|
3
|
Corvalan AH: Early diagnosis of
hepatocellular carcinoma by microRNAs: Shining a light from the
genome's ‘dark matter’. Dig Dis Sci. 57:2737–2739. 2012. View Article : Google Scholar : PubMed/NCBI
|
|
4
|
Omata M, Cheng A, Kokudo N, Kudo M, Lee
JM, Jia J, Tateishi R, Han KH, Chawla YK, Shiina S, et al:
Asia-Pacific clinical practice guidelines on the management of
hepatocellular carcinoma: A 2017 update. Hepatol Int. 11:317–370.
2017. View Article : Google Scholar : PubMed/NCBI
|
|
5
|
Yang N, Feng J, Li ZR, Ming KH, Lei XX and
Xu BL: Evaluation of serum α-fetoprotein levels during different
infection phases of CHB patients. Clin Lab. 64:43–49. 2018.
View Article : Google Scholar : PubMed/NCBI
|
|
6
|
Bai DS, Zhang C, Chen P, Jin SJ and Jiang
GQ: The prognostic correlation of AFP level at diagnosis with
pathological grade, progression, and survival of patients with
hepatocellular carcinoma. Sci Rep. 7:128702017. View Article : Google Scholar : PubMed/NCBI
|
|
7
|
Daniele B, Bencivenga A, Megna AS and
Tinessa V: Alpha-fetoprotein and ultrasonography screening for
hepatocellular carcinoma. Gastroenterology. 127 (Suppl
1):S108–S112. 2004. View Article : Google Scholar : PubMed/NCBI
|
|
8
|
Marks EI and Yee NS: Molecular genetics
and targeted therapy in hepatocellular carcinoma. Curr Cancer Drug
Targets. 16:53–70. 2016. View Article : Google Scholar : PubMed/NCBI
|
|
9
|
Akhtar B, Muhammad F, Sharif A, Akhtar M
and Majeed W: Diverse signaling pathways and current status of
molecular targeted treatments for hepatocellular carcinoma. Crit
Rev Eukaryot Gene Expr. 27:373–385. 2017. View Article : Google Scholar : PubMed/NCBI
|
|
10
|
Singh A, Kumar R and Pandey A:
Hepatocellular carcinoma: Causes, mechanism of progression and
biomarkers. Curr Chem Genom Transl Med. 12:9–26. 2018. View Article : Google Scholar : PubMed/NCBI
|
|
11
|
Klungboonkrong V, Das D and McLennan G:
Molecular mechanisms and targets of therapy for hepatocellular
carcinoma. J Vasc Interv Radiol. 28:949–955. 2017. View Article : Google Scholar : PubMed/NCBI
|
|
12
|
Herceg Z and Paliwal A: Epigenetic
mechanisms in hepatocellular carcinoma: How environmental factors
influence the epigenome. Mutat Res. 727:55–61. 2011. View Article : Google Scholar : PubMed/NCBI
|
|
13
|
Aigner A: MicroRNAs (miRNAs) in cancer
invasion and metastasis: Therapeutic approaches based on
metastasis-related miRNAs. J Mol Med. 89:445–457. 2011. View Article : Google Scholar : PubMed/NCBI
|
|
14
|
El-Tawdi AH, Matboli M, Shehata HH, Tash
F, El-Khazragy N, Azazy Ael-S and Abdel-Rahman O: Evaluation of
circulatory RNA-Based biomarker panel in hepatocellular carcinoma.
Mol Diagn Ther. 20:265–277. 2016. View Article : Google Scholar : PubMed/NCBI
|
|
15
|
Kloosterman WP and Plasterk RH: The
diverse functions of microRNAs in animal development and disease.
Dev Cell. 11:441–450. 2006. View Article : Google Scholar : PubMed/NCBI
|
|
16
|
Backes C, Meese E and Keller A: Specific
miRNA disease biomarkers in blood, serum and plasma: Challenges and
prospects. Mol Diagn Ther. 20:509–518. 2016. View Article : Google Scholar : PubMed/NCBI
|
|
17
|
Wurster DH: Sex-chromosome translocations
and karyotypes in bovid tribes. Cytogenetics. 11:197–207. 1972.
View Article : Google Scholar : PubMed/NCBI
|
|
18
|
Fendereski M, Zia MF, Shafiee M, Safari F,
Saneie MH and Tavassoli M: MicroRNA-196a as a potential diagnostic
biomarker for esophageal squamous cell carcinoma. Cancer Invest.
35:78–84. 2017. View Article : Google Scholar : PubMed/NCBI
|
|
19
|
Du C, Zheng J, Lu X and Wang Y:
Downregulation of miR-18a or miR-328 inhibits the invasion and
migration of lung adenocarcinoma A549 cells. Xi Bao Yu Fen Zi Mian
Yi Xue Za Zhi. 32:1051–1054. 2016.(In Chinese). PubMed/NCBI
|
|
20
|
Cheng RF, Wang J, Zhang JY, Sun L, Zhao
YR, Qiu ZQ, Sun BC and Sun Y: MicroRNA-506 is up-regulated in the
development of pancreatic ductal adenocarcinoma and is associated
with attenuated disease progression. Chin J Cancer. 35:642016.
View Article : Google Scholar : PubMed/NCBI
|
|
21
|
Sun L, Liang J, Wang Q, Li Z, Du Y and Xu
X: MicroRNA-137 suppresses tongue squamous carcinoma cell
proliferation, migration and invasion. Cell Prolif. 49:628–635.
2016. View Article : Google Scholar : PubMed/NCBI
|
|
22
|
Pan X, Wang ZX and Wang R: MicroRNA-21: A
novel therapeutic target in human cancer. Cancer Biol Ther.
10:1224–1232. 2010. View Article : Google Scholar : PubMed/NCBI
|
|
23
|
Si ML, Zhu S, Wu H, Lu Z, Wu F and Mo YY:
miR-21-mediated tumor growth. Oncogene. 26:2799–2803. 2007.
View Article : Google Scholar : PubMed/NCBI
|
|
24
|
Guo X, Lv X, Lv X, Ma Y, Chen L and Chen
Y: Circulating miR-21 serves as a serum biomarker for
hepatocellular carcinoma and correlated with distant metastasis.
Oncotarget. 8:44050–44058. 2017.PubMed/NCBI
|
|
25
|
Eteriia GP: Characteristics of suture
materials for bronchoplasty. Vestn Khir Im I I Grek. 107:103–108.
1971.(In Russian). PubMed/NCBI
|
|
26
|
Wang X, Zhang J, Zhou L, Lu P, Zheng ZG,
Sun W, Wang JL, Yang XS, Li XL, Xia N, et al: Significance of serum
microRNA-21 in diagnosis of hepatocellular carcinoma (HCC):
Clinical analyses of patients and an HCC rat model. Int J Clin Exp
Pathol. 8:1466–1478. 2015.PubMed/NCBI
|
|
27
|
Wen Y, Han J, Chen J, Dong J, Xia Y, Liu
J, Jiang Y, Dai J, Lu J, Jin G, et al: Plasma miRNAs as early
biomarkers for detecting hepatocellular carcinoma. Int J Cancer.
137:1679–1690. 2015. View Article : Google Scholar : PubMed/NCBI
|
|
28
|
Zamora J, Abraira V, Muriel A, Khan K and
Coomarasamy A: Meta-DiSc: A software for meta-analysis of test
accuracy data. BMC Med Res Methodol. 6:312006. View Article : Google Scholar : PubMed/NCBI
|
|
29
|
Shannon P, Markiel A, Ozier O, Baliga NS,
Wang JT, Ramage D, Amin N, Schwikowski B and Ideker T: Cytoscape: A
software environment for integrated models of biomolecular
interaction networks. Genome Res. 13:2498–2504. 2003. View Article : Google Scholar : PubMed/NCBI
|
|
30
|
Szklarczyk D, Franceschini A, Wyder S,
Forslund K, Heller D, Huerta-Cepas J, Simonovic M, Roth A, Santos
A, Tsafou KP, et al: STRING v10: Protein-protein interaction
networks, integrated over the tree of life. Nucleic Acids Res.
43:D447–D452. 2015. View Article : Google Scholar : PubMed/NCBI
|
|
31
|
Jackson D, White IR and Thompson SG:
Extending DerSimonian and Laird's methodology to perform
multivariate random effects meta-analyses. Stat Med. 29:1282–1297.
2010. View Article : Google Scholar : PubMed/NCBI
|
|
32
|
Deeks JJ, Macaskill P and Irwig L: The
performance of tests of publication bias and other sample size
effects in systematic reviews of diagnostic test accuracy was
assessed. J Clin Epidemiol. 58:882–893. 2005. View Article : Google Scholar : PubMed/NCBI
|
|
33
|
Xu J, Wu C, Che X, Wang L, Yu D, Zhang T,
Huang L, Li H, Tan W, Wang C and Lin D: Circulating microRNAs,
miR-21, miR-122, and miR-223, in patients with hepatocellular
carcinoma or chronic hepatitis. Mol Carcinog. 50:136–142. 2011.
View Article : Google Scholar : PubMed/NCBI
|
|
34
|
Liu AM, Yao TJ, Wang W, Wong KF, Lee NP,
Fan ST, Poon RT, Gao C and Luk JM: Circulating miR-15b and miR-130b
in serum as potential markers for detecting hepatocellular
carcinoma: A retrospective cohort study. BMJ Open. 2:e0008252012.
View Article : Google Scholar : PubMed/NCBI
|
|
35
|
Amr K, Ezzat W, Elhosary Y, Hegazy A,
Fahim H and Kamel R: The potential role of miRNAs 21 and 199-a in
early diagnosis of hepatocellular carcinoma. Gene. 575:66–70. 2016.
View Article : Google Scholar : PubMed/NCBI
|
|
36
|
Zhuang C, Jiang W, Huang D, Xu L, Yang Q,
Zheng L, Wang X and Hu L: Serum miR-21, miR-26a and miR-101 as
potential biomarkers of hepatocellular carcinoma. Clin Res Hepatol
Gastroenterol. 40:386–396. 2016. View Article : Google Scholar : PubMed/NCBI
|
|
37
|
Tomimaru Y, Eguchi H, Nagano H, Wada H,
Kobayashi S, Marubashi S, Tanemura M, Tomokuni A, Takemasa I,
Umeshita K, et al: Circulating microRNA-21 as a novel biomarker for
hepatocellular carcinoma. J Hepatol. 56:167–175. 2012. View Article : Google Scholar : PubMed/NCBI
|
|
38
|
Mizuguchi Y, Mishima T, Yokomuro S, Arima
Y, Kawahigashi Y, Shigehara K, Kanda T, Yoshida H, Uchida E, Tajiri
T and Takizawa T: Sequencing and bioinformatics-based analyses of
the microRNA transcriptome in hepatitis B-related hepatocellular
carcinoma. PLoS ONE. 6:e153042011. View Article : Google Scholar : PubMed/NCBI
|
|
39
|
Qin Z, Zhu X and Huang Y: Circulating
microRNA-21 as a novel biomarker for hepatocellular carcinoma.
Sichuan Med J. 34:1463–1465. 2013.
|
|
40
|
Burchard J, Zhang C, Liu AM, Poon RT, Lee
NP, Wong KF, Sham PC, Lam BY, Ferguson MD, Tokiwa G, et al:
microRNA-122 as a regulator of mitochondrial metabolic gene network
in hepatocellular carcinoma. Mol Syst Biol. 6:4022010. View Article : Google Scholar : PubMed/NCBI
|
|
41
|
Li W, Xie L, He X, Li J, Tu K, Wei L, Wu
J, Guo Y, Ma X, Zhang P, et al: Diagnostic and prognostic
implications of microRNAs in human hepatocellular carcinoma. Int J
Cancer. 123:1616–1622. 2008. View Article : Google Scholar : PubMed/NCBI
|
|
42
|
Hou J, Lin L, Zhou W, Wang Z, Ding G, Dong
Q, Qin L, Wu X, Zheng Y, Yang Y, et al: Identification of miRNomes
in human liver and hepatocellular carcinoma reveals miR-199a/b-3p
as therapeutic target for hepatocellular carcinoma. Cancer cell.
19:232–243. 2011. View Article : Google Scholar : PubMed/NCBI
|
|
43
|
Murakami Y, Kubo S, Tamori A, Itami S,
Kawamura E, Iwaisako K, Ikeda K, Kawada N, Ochiya T and Taguchi YH:
Comprehensive analysis of transcriptome and metabolome analysis in
intrahepatic cholangiocarcinoma and hepatocellular carcinoma. Sci
Rep. 5:162942015. View Article : Google Scholar : PubMed/NCBI
|
|
44
|
Su H, Yang JR, Xu T, Huang J, Xu L, Yuan Y
and Zhuang SM: MicroRNA-101, down-regulated in hepatocellular
carcinoma, promotes apoptosis and suppresses tumorigenicity. Cancer
Res. 69:1135–1142. 2009. View Article : Google Scholar : PubMed/NCBI
|
|
45
|
Zhao L and Zhang Y: miR-342-3p affects
hepatocellular carcinoma cell proliferation via regulating
NF-kappaB pathway. Biochem Biophys Res Commun. 457:370–377. 2015.
View Article : Google Scholar : PubMed/NCBI
|
|
46
|
Shen J, Wang A, Wang Q, Gurvich I, Siegel
AB, Remotti H and Santella RM: Exploration of genome-wide
circulating microRNA in hepatocellular carcinoma: MiR-483-5p as a
potential biomarker. Cancer Epidemiol Biomarkers Prev.
22:2364–2373. 2013. View Article : Google Scholar : PubMed/NCBI
|
|
47
|
Clancy C, Joyce MR and Kerin MJ: The use
of circulating microRNAs as diagnostic biomarkers in colorectal
cancer. Cancer Biomark. 15:103–113. 2015. View Article : Google Scholar : PubMed/NCBI
|
|
48
|
Labib H, Elantouny N, Ibrahim N and
Alnagar A: Upregulation of microRNA-21 is a poor prognostic marker
in patients with childhood B cell acute lymphoblastic leukemia.
Hematology. 22:392–397. 2017. View Article : Google Scholar : PubMed/NCBI
|
|
49
|
Wu Y, Song Y, Xiong Y, Wang X, Xu K, Han
B, Bai Y, Li L, Zhang Y and Zhou L: MicroRNA-21 (Mir-21) promotes
cell growth and invasion by repressing tumor suppressor PTEN in
colorectal cancer. Cell Physiol Biochem. 43:945–958. 2017.
View Article : Google Scholar : PubMed/NCBI
|
|
50
|
Zeng Z, Wang J, Zhao L, Hu P, Zhang H,
Tang X, He D, Tang S and Zeng Z: Potential role of microRNA-21 in
the diagnosis of gastric cancer: A meta-analysis. PLoS One.
8:e732782013. View Article : Google Scholar : PubMed/NCBI
|
|
51
|
Qu K, Zhang X, Lin T, Liu T, Wang Z, Liu
S, Zhou L, Wei J, Chang H, Li K, et al: Circulating miRNA-21-5p as
a diagnostic biomarker for pancreatic cancer: Evidence from
comprehensive miRNA expression profiling analysis and clinical
validation. Sci Rep. 7:16922017. View Article : Google Scholar : PubMed/NCBI
|
|
52
|
Markou A, Tsaroucha EG, Kaklamanis L,
Fotinou M, Georgoulias V and Lianidou ES: Prognostic value of
mature microRNA-21 and microRNA-205 overexpression in non-small
cell lung cancer by quantitative real-time RT-PCR. Clin Chem.
54:1696–1704. 2008. View Article : Google Scholar : PubMed/NCBI
|
|
53
|
Meng F, Henson R, Wehbe-Janek H, Ghoshal
K, Jacob ST and Patel T: MicroRNA-21 regulates expression of the
PTEN tumor suppressor gene in human hepatocellular cancer.
Gastroenterology. 133:647–658. 2007. View Article : Google Scholar : PubMed/NCBI
|
|
54
|
Feng YH and Tsao CJ: Emerging role of
microRNA-21 in cancer. Biomed Rep. 5:395–402. 2016. View Article : Google Scholar : PubMed/NCBI
|
|
55
|
Yang HI, Yeh SH, Chen PJ, Iloeje UH, Jen
CL, Su J, Wang LY, Lu SN, You SL, Chen DS, et al: Associations
between hepatitis B virus genotype and mutants and the risk of
hepatocellular carcinoma. J Natl Cancer Inst. 100:1134–1143. 2008.
View Article : Google Scholar : PubMed/NCBI
|
|
56
|
Xie Y: Hepatitis B virus-associated
hepatocellular carcinoma. Adv Exp Med Biol. 1018:11–21. 2017.
View Article : Google Scholar : PubMed/NCBI
|
|
57
|
Xie K, Zhang Y, Liu J, Zeng Y and Wu H:
MicroRNAs associated with HBV infection and HBV-related HCC.
Theranostics. 4:1176–1192. 2014. View Article : Google Scholar : PubMed/NCBI
|
|
58
|
Song W, Wang L, Wang L and Li Q: Interplay
of miR-21 and FoxO1 modulates growth of pancreatic ductal
adenocarcinoma. Tumour Biol. 36:4741–4745. 2015. View Article : Google Scholar : PubMed/NCBI
|
|
59
|
Lei BX, Liu ZH, Li ZJ, Li C and Deng YF:
miR-21 induces cell proliferation and suppresses the
chemosensitivity in glioblastoma cells via downregulation of FOXO1.
Int J Clin Exp Med. 7:2060–2066. 2014.PubMed/NCBI
|
|
60
|
Go H, Jang JY, Kim PJ, Kim YG, Nam SJ,
Paik JH, Kim TM, Heo DS, Kim CW and Jeon YK: MicroRNA-21 plays an
oncogenic role by targeting FOXO1 and activating the PI3K/AKT
pathway in diffuse large B-cell lymphoma. Oncotarget.
6:15035–15049. 2015. View Article : Google Scholar : PubMed/NCBI
|
|
61
|
Dong T, Zhang Y, Chen Y, Liu P, An T,
Zhang J, Yang H, Zhu W and Yang X: FOXO1 inhibits the invasion and
metastasis of hepatocellular carcinoma by reversing ZEB2-induced
epithelial-mesenchymal transition. Oncotarget. 8:1703–1713.
2017.PubMed/NCBI
|
|
62
|
Sun H, Hou J, Shi W and Zhang L: Estrogen
receptor 1 (ESR1) genetic variations in cancer risk: A systematic
review and meta-analysis. Clin Res Hepatol Gastroenterol.
39:127–135. 2015. View Article : Google Scholar : PubMed/NCBI
|
|
63
|
Breyer J, Wirtz R, Laible M, Schlombs K,
Erben P, Kriegmair MC, Stoehr R, Eidt S, Denzinger S, Burger M, et
al: ESR1, ERBB2, and Ki67 mRNA expression predicts stage and grade
of non-muscle-invasive bladder carcinoma (NMIBC). Virchows Arch.
469:547–552. 2016. View Article : Google Scholar : PubMed/NCBI
|
|
64
|
Dou CY, Fan YC, Cao CJ, Yang Y and Wang K:
Sera DNA methylation of CDH1, DNMT3b and ESR1 promoters as
biomarker for the early diagnosis of hepatitis B virus-related
hepatocellular carcinoma. Dig Dis Sci. 61:1130–1138. 2016.
View Article : Google Scholar : PubMed/NCBI
|
|
65
|
Hishida M, Nomoto S, Inokawa Y, Hayashi M,
Kanda M, Okamura Y, Nishikawa Y, Tanaka C, Kobayashi D, Yamada S,
et al: Estrogen receptor 1 gene as a tumor suppressor gene in
hepatocellular carcinoma detected by triple-combination array
analysis. Int J Oncol. 43:88–94. 2013. View Article : Google Scholar : PubMed/NCBI
|
|
66
|
Weng TY, Wang CY, Hung YH, Chen WC, Chen
YL and Lai MD: Differential expression pattern of THBS1 and THBS2
in lung cancer: Clinical outcome and a systematic-analysis of
microarray databases. PLoS One. 11:e01610072016. View Article : Google Scholar : PubMed/NCBI
|