Introduction
Endometrial carcinoma (EC) is one of the most common
gynecological cancer types, with increasing global incidence in
recent years (1). A total of 60,050
cases of EC and 10,470 EC-associated cases of mortality were
reported in the USA in 2016 (1),
which was markedly higher than the 2012 statistics of 47,130 cases
and 8,010 mortalities (2). Although
numerous studies have been conducted to investigate the mechanisms
of endometrial tumorigenesis and development, to the best of our
knowledge, the exact etiology remains unknown. Understanding the
potential molecular mechanisms underlying EC initiation and
progression is of great clinical significance. Previously,
microarray technologies and bioinformatics have widely been used
for the differential expression analysis of cancer and healthy
cells to identify novel diagnostic and therapeutic biomarkers
(3).
MicroRNAs (miRNAs) are small, noncoding RNAs that
regulate the expression of critical genes involved in cancer
progression and treatment (4). They
bind to the 3′-untranslated region (3′-UTR) of target mRNAs
(5), resulting in either degradation
or inhibition of the expression and function of protein-coding
mRNAs. miRNAs regulate several functions in cancer cells, including
proliferation, apoptosis, metastasis, immune evasion and
differentiation (6). In addition,
several miRNAs serve critical roles in EC pathogenesis (7,8) and are
associated with clinicopathological features and survival (9). However, the specific mechanisms
associated with miRNA-mediated regulation in EC require further
investigation.
The current study evaluated the potential molecular
mechanisms and biomarkers of EC using a bioinformatics approach.
Microarray expression data were downloaded from the Gene Expression
Omnibus (GEO) database and The Cancer Genome Atlas (TCGA).
Differentially expressed genes (DEGs) and miRNAs (DEMs) in the EC
samples compared with normal samples were identified using the
GEO2R program and R software. The DEGs were subjected to functional
and pathway enrichment analysis, followed by protein-protein
interaction (PPI) network and survival analysis. A putative
miRNA-mRNA network relevant to EC pathogenesis was then
constructed.
Materials and methods
Microarray expression data
The two gene expression datasets, GSE17025 (10) and GSE63678 (11), the miRNA expression dataset, GSE35794,
and the DNA methylation profile, GSE40032, were downloaded from the
GEO database (www.ncbi.nlm.nih.gov/geo). The GSE17025 dataset
included data of 91 EC tissue samples, of which 79 were
endometrioid and 12 were papillary serous, and 12 were atrophic
endometrium samples from postmenopausal women. The tissue samples
were analyzed on the GPL570 Platform Affymetrix Human Genome U133
Plus 2.0 (Affymetrix; Thermo Fisher Scientific, Inc., Waltham, MA,
USA) (10). The GSE63678 dataset
included data from seven EC tissues and five normal endometrium
samples, and was analyzed on the GPL571 Platform Affymetrix Human
Genome U133A 2.0 Array (Affymetrix; Thermo Fisher Scientific, Inc.)
(11). The GSE35794 dataset included
data from 18 EC samples and four normal samples, and was analyzed
on the GPL10850 Agilent-021827 Human miRNA Microarray V3 (Agilent
Technologies, Palo Alto, CA, USA). The GSE40032 dataset included
data of 64 EC tissue samples and 23 normal endometrium samples,
which was detected using the Illumina HumanMethylation27 BeadChip
(HumanMethylation27_270596_v.1.2) on GPL8490 (Illumina, Inc., San
Diego, CA, USA).
The RNA-seq ht seq-count data of mRNA, miRNA-seq and
clinical data (project ID. TCGA-UCEC) of patients diagnosed with
uterine corpus endometrial carcinoma were downloaded from TCGA
(www.cancergenome.nih.gov) using the
shengxin.ren download tool (http://www.shengxin.ren). Data of 552 EC samples and
23 normal endometrium samples were included.
Identification of DEGs and DEMs
DEGs, DEMs and differentially methylated genes
(DMGs) in the GSE17025, GSE35794 and GSE40032 datasets were
identified using the GEO2R program of the GEO (www.ncbi.nlm.nih.gov/geo/geo2r/). The
screening threshold of DEGs and DEMs was adjusted to P<0.05 and
|log2 fold-change (FC)|>1. DMGs were identified with the
thresholds of P<0.05 and |t|>2, where t is the ratio of the
difference of the estimated value of a parameter from its
hypothesized value to its standard error. For the dataset GSE63678,
the original CEL files of the Affymetrix platform were background
corrected, normalized and log2 transformed using the Robust
Multi-array Average (RMA) (12)
method and the affy package in R software (version 3.4.0;
www.r-project.org). The Limma package (version
3.34.9) (13) was subsequently used
for the calculation of aberrantly expressed mRNAs and the
Benjamini-Hochberg (BH) method (14)
was used to identify DEGs with the threshold criterion of P<0.05
and absolute log2FC >1. The mRNA expression data of TCGA were
calculated using Bioconductor package edgeR (version 3.20.9)
(15) and were analyzed using the
same strategy as used for the Affymetrix data analysis. The miRNA
expression data of TCGA were analyzed using a Student's t-test in
GraphPad Prism (version 6; GraphPad Software, Inc., La Jolla, CA,
USA).
Gene ontology (GO) and Kyoto
Encyclopedia of Genes and Genomes (KEGG) pathway enrichment
analysis
GO and KEGG pathway enrichment analysis were
performed to determine the biological significance of DEGs, using
the Database for Annotation, Visualization and Integrated Discovery
(DAVID; version 6.8; http://david.ncifcrf.gov/). The BH and Bonferroni
methods were used for GO and pathway enrichment analysis.
PPI network and modular analysis
PPI networks are mathematical representations of
physically interacting proteins (16). The STRING database (version 10.5;
www.string-db.org) was used to establish the PPI
network of DEGs and Cytoscape version 3.5 (17) was used to visualize the results. A
confidence score ≥0.7 was set as the cut-off criterion. Molecular
Complex Detection (MCODE) was used to filter modules of the PPI
network with a node score cut-off value of 0.2, degree cut-off
value of 2, k-core of 2 and maximum depth of 100 (18).
Prediction of miRNA targets
The miRecords database (19) was used to predict the target genes of
the DEMs. miRecords is a comprehensive database created using 11
established miRNA target prediction programs: MirTarget2, miTarget,
MicroInspector, RNA22, PITA, miRanda, DIANA-microT, NBmiRTar,
RNAhybrid, PicTar and TargetScan. Genes that were predicted by at
least four programs were selected as the candidate targets of
miRNAs.
Construction of the miRNA-target gene
regulatory network
Overlaps between DEGs and DEM targets were selected
and the association between overlapping genes and DEMs was
validated using Pearson's correlation analysis in starBase (version
2.0; http://starbase.sysu.edu.cn/). The
miRNA-gene regulatory network was constructed based on the
overlapping genes and their upstream miRNAs, which were then
visualized by Cytoscape software.
DEG survival analysis
OncoLnc (www.oncolnc.org) is a tool used for studying survival
correlations by comparing clinical data with expression profiles of
mRNAs, miRNAs and long non-coding RNAs (lncRNAs) (20). The overall survival (OS) rate of
patients with EC relative to different DEGs was calculated using
Kaplan-Meier analysis in OncoLnc. The associations between gene
expression and clinical characteristics were analyzed using one-way
ANOVA and a Bonferroni's multiple comparisons test in GraphPad
Prism software.
Results
Identifying DEGs and DEMs
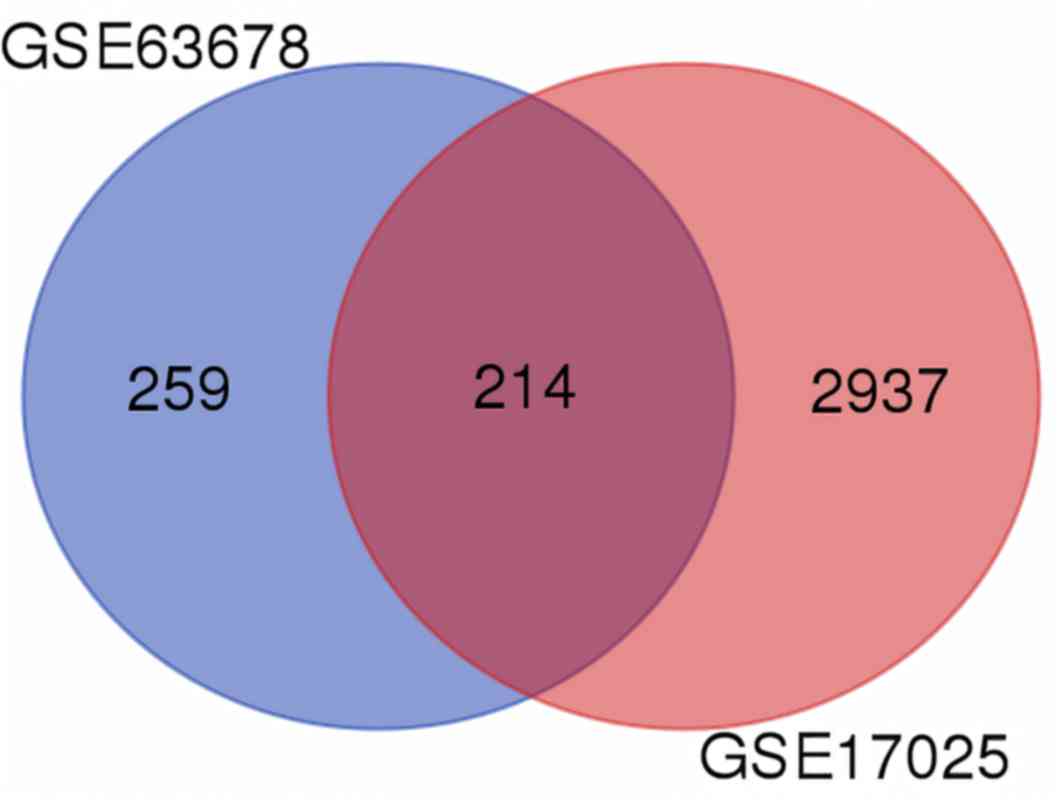
Gene expression profiles of EC and normal
endometrium tissue datasets GSE17025 and GSE63678 were downloaded
from GEO and normalized using the RMA method. The Limma package was
used to analyze and compare the transcriptional data between EC
samples and normal samples. Using P<0.05 and absolute log2FC
>1 as the cut-off criteria, 214 aberrantly expressed mRNAs were
identified in EC (Fig. 1). A total of
205 identical DEGs were filtered from the two datasets, consisting
of 131 upregulated and 74 downregulated genes that were similarly
aberrantly expressed in the two datasets.
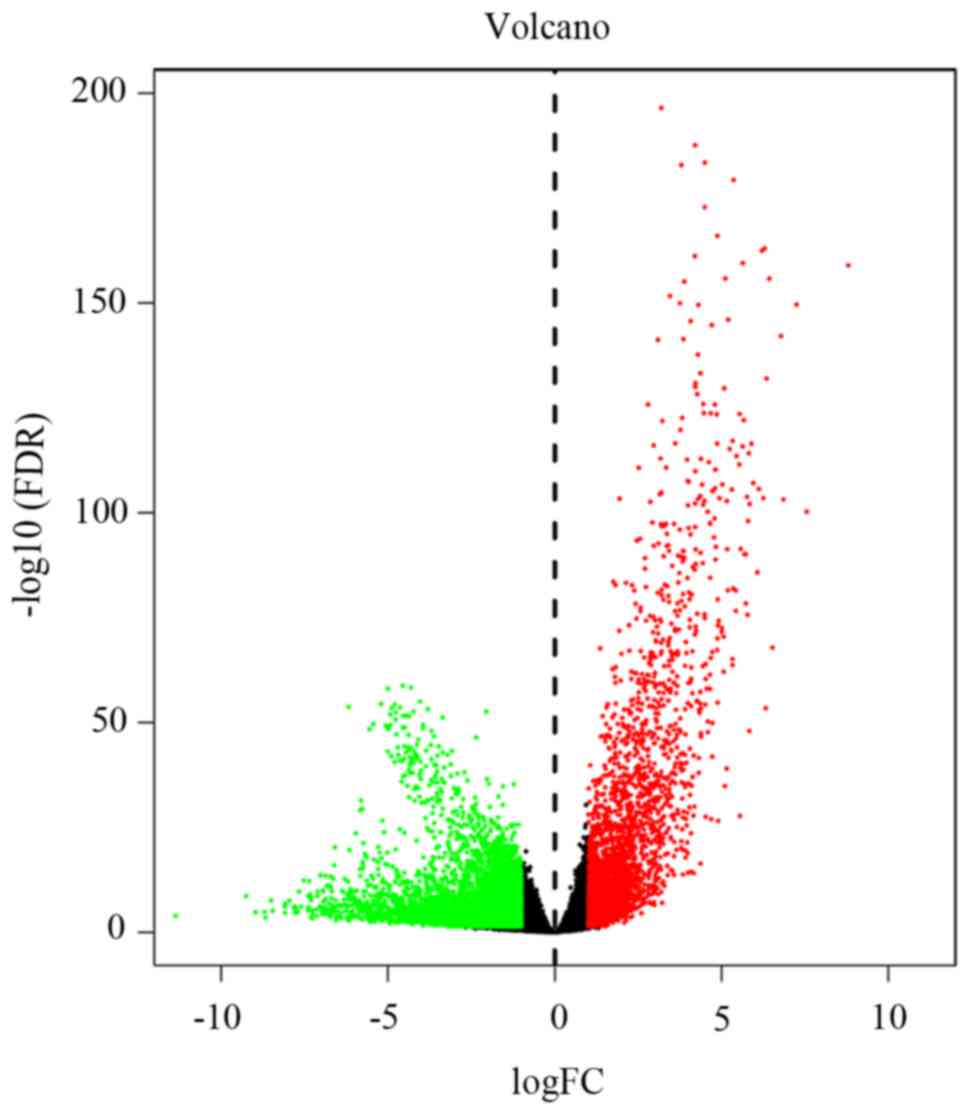
The TCGA RNA-seq data from 552 EC samples and 23
normal samples were normalized and corrected using the quantile
normalization method and volcano plot analysis was performed using
R software. A total of 7,562 aberrantly expressed mRNAs were
obtained, of which 2,871 and 4,681 were upregulated and
downregulated, respectively (Fig. 2).
Finally, 160 aberrantly expressed genes, including 111 upregulated
and 49 downregulated genes, were identified in EC samples from both
the GEO and TCGA databases. The top ten DEGs identified between EC
and normal tissue data from TCGA are presented in Table I.
 | Table I.Top 10 differentially expressed genes
in endometrial cancer compared with normal tissue according to data
from The Cancer Genome Atlas. |
Table I.
Top 10 differentially expressed genes
in endometrial cancer compared with normal tissue according to data
from The Cancer Genome Atlas.
| A, Upregulated
genes |
|---|
|
|---|
| DEG | logFC | P-value |
|---|
| SFN | 5.967256 |
1.35×10⁻²⁵ |
| UBE2C | 5.549047 |
7.32×10−51 |
| CDC20 | 5.063798 |
1.02×10−51 |
| HJURP | 5.004414 |
1.18×10−60 |
| CENPA | 4.997543 |
7.26×10−51 |
| BIRC5 | 4.996426 |
2.41×10−45 |
| MELK | 4.883253 |
6.08×10−56 |
| RRM2 | 4.797486 |
6.62×10−43 |
| CDC45 | 4.797066 |
7.65×10−57 |
| TPX2 | 4.748579 |
1.44×10−49 |
|
| B, Downregulated
genes |
|
| DEG | logFC | P-value |
|
| BCHE | −5.68360 |
4.65×10−93 |
| PEG3 | −5.53075 |
7.97×10−115 |
| BNC2 | −4.43921 |
4.84×10−105 |
| KIAA1644 | −4.23679 |
1.44×10−74 |
| HAND2-AS1 | −3.59737 |
1.32×10−41 |
| FGF2 | −3.52440 |
1.21×10−67 |
| TRPC4 | −3.47055 |
1.19×10−60 |
| TGFBR3 | −3.40246 |
4.98×10−72 |
| AKT3 | −3.35874 |
4.21×10−95 |
| SNCA | −3.25712 |
1.35×10−56 |
For the dataset GSE40032, a total of 2,151
hypermethylated genes and 1,173 hypomethylated genes were
identified using the cut-off criteria P<0.05 and |t|>2.
Subsequently, hypomethylation-high expression genes were obtained
by overlapping hypomethylated and upregulated DEGs, and
hypermethylation-low expression genes were obtained by overlapping
hypermethylated and downregulated DEGs. A total of 12
hypomethylation-high expression genes (ESPL1, KIF14, KRT8, TYMS,
SFN, TRIP13, S100A11, TK1, ASPM, CDCA3, CDCP1 and FUT2) and 15
hypermethylation-low expression genes (NAALAD2, RUNX1T1, TRPC4,
TSPYL5, GPM6A, TCEAL2, ENPEP, ZFP2, PEG3, EFS, ST8SIA1, MAGEH1,
CDO1, GSPT2 and FGF2) were obtained.
GO and KEGG pathway enrichment
analysis of DEGs in EC
GO and KEGG enrichment analysis of the DEGs were
conducted using DAVID. The DEGs were most highly enriched in
biological processes associated with cell division, mitotic nuclear
division and cell proliferation (Table
II). According to KEGG pathway enrichment analysis, the DEGs
were predominantly associated with cell cycle, human T-lymphotropic
virus (HTLV-I) infection and pathways in cancer (Table III).
| Table II.GO enrichment analysis of
differentially expressed genes in endometrial cancer. |
Table II.
GO enrichment analysis of
differentially expressed genes in endometrial cancer.
| Term | Description | Count | P-value | FDR |
|---|
| GO:0051301 | Cell division | 33 |
9.46131×10⁻²⁴ |
1.53×10⁻²⁰ |
| GO:0007067 | Mitotic nuclear
division | 23 |
3.07185×10⁻¹⁶ |
5.32907×10⁻¹³ |
| GO:0005829 | Cytosol | 69 |
1.14723×10⁻¹³ |
1.46927×10⁻¹⁰ |
| GO:0030496 | Midbody | 16 |
2.8856×10⁻¹³ |
3.69671×10⁻¹⁰ |
| GO:0007062 | Sister chromatid
cohesion | 15 |
2.92563×10⁻¹³ |
4.71811×10⁻¹⁰ |
| GO:0005634 | Nucleus | 87 |
1.79532×10⁻¹¹ |
2.30007×10⁻⁸ |
| GO:0000070 | Mitotic sister
chromatid segregation | 9 |
2.71519×10⁻¹¹ |
4.379×10⁻⁸ |
| GO:0000775 | Chromosome,
centromeric region | 11 |
4.53211×10⁻¹¹ |
5.80631×10⁻⁸ |
| GO:0000777 | Condensed
chromosome kinetochore | 12 |
1.89383×10⁻¹⁰ |
2.42628×10⁻⁷ |
| GO:0000776 | Kinetochore | 11 |
1.65624×10⁻⁹ |
2.12189×10⁻⁶ |
| GO:0000086 | G2/M transition of
mitotic cell cycle | 13 |
2.80607×10⁻⁹ |
4.52556×10⁻⁶ |
| GO:0005654 | Nucleoplasm | 54 |
3.75741×10⁻⁹ |
4.81381×10⁻⁶ |
| GO:0005515 | Protein
binding | 113 |
9.52955×10⁻⁹ |
1.2931×10⁻⁵ |
| GO:0008283 | Cell
proliferation | 18 |
2.22925×10⁻⁸ |
3.59528×10⁻⁵ |
| GO:0000922 | Spindle pole | 11 |
3.06811×10⁻⁸ |
3.9307×10⁻⁵ |
| GO:0000083 | Regulation of
transcription involved in G1/S transition of mitotic cell
cycle | 7 |
3.62732×10⁻⁸ |
5.85005×10⁻⁵ |
| GO:0005737 | Cytoplasm | 77 |
6.06599×10⁻⁸ |
7.77145×10⁻⁵ |
| GO:0005876 | Spindle
microtubule | 8 |
8.27121×10⁻⁸ | 0.000105967 |
| GO:0005819 | Spindle | 11 |
8.34624×10⁻⁸ | 0.000106928 |
| GO:0007059 | Chromosome
segregation | 9 |
1.35128×10⁻⁷ | 0.00021793 |
| GO:0015630 | Microtubule
cytoskeleton | 11 |
2.69353×10⁻⁷ | 0.000345081 |
| GO:0000082 | G1/S transition of
mitotic cell cycle | 10 |
2.70795×10⁻⁷ | 0.00043673 |
| GO:0008017 | Microtubule
binding | 13 |
3.46922×10⁻⁷ | 0.000470751 |
| GO:0031145 | Anaphase-promoting
complex-dependent catabolic process | 9 |
4.39782×10⁻⁷ | 0.000709267 |
| GO:0007080 | Mitotic metaphase
plate congression | 7 |
7.55172×10⁻⁷ | 0.001217916 |
| GO:0005524 | ATP binding | 34 |
7.5564×10⁻⁷ | 0.001025353 |
| GO:0005874 | Microtubule | 14 |
2.64534×10⁻⁶ | 0.003389028 |
| GO:0005813 | Centrosome | 16 |
3.66421×10⁻⁶ | 0.004694296 |
| GO:0000281 | Mitotic
cytokinesis | 6 |
4.8143×10⁻⁶ | 0.007764095 |
| GO:0005871 | Kinesin
complex | 7 |
5.67045×10⁻⁶ | 0.007264447 |
| Table III.Signaling pathway enrichment analysis
of differentially expressed genes in endometrial cancer. |
Table III.
Signaling pathway enrichment analysis
of differentially expressed genes in endometrial cancer.
| ID | Term | Count | P-value | FDR |
|---|
| hsa04110 | Cell cycle | 17 |
7.65415×10⁻¹⁴ |
9.04832×10⁻¹¹ |
| hsa04115 | p53 signaling
pathway | 7 |
6.26158×10⁻⁵ | 0.074039093 |
| hsa04914 |
Progesterone-mediated oocyte
maturation | 7 | 0.000268953 | 0.317664885 |
| hsa05166 | HTLV-I
infection | 9 | 0.004891749 | 5.635320021 |
| hsa04114 | Oocyte meiosis | 6 | 0.005389396 | 6.192004384 |
| hsa01200 | Carbon
metabolism | 6 | 0.006271196 | 7.171038253 |
| hsa05161 | Hepatitis B | 6 | 0.017244392 | 18.59650509 |
| hsa03460 | Fanconi anemia
pathway | 4 | 0.017517104 | 18.86329792 |
| hsa05200 | Pathways in
cancer | 10 | 0.020108452 | 21.35875474 |
| hsa01130 | Biosynthesis of
antibiotics | 7 | 0.022606828 | 23.69795919 |
| hsa00010 |
Glycolysis/Gluconeogenesis | 4 | 0.032322528 | 32.20200981 |
| hsa01230 | Biosynthesis of
amino acids | 4 | 0.041557594 | 39.47199877 |
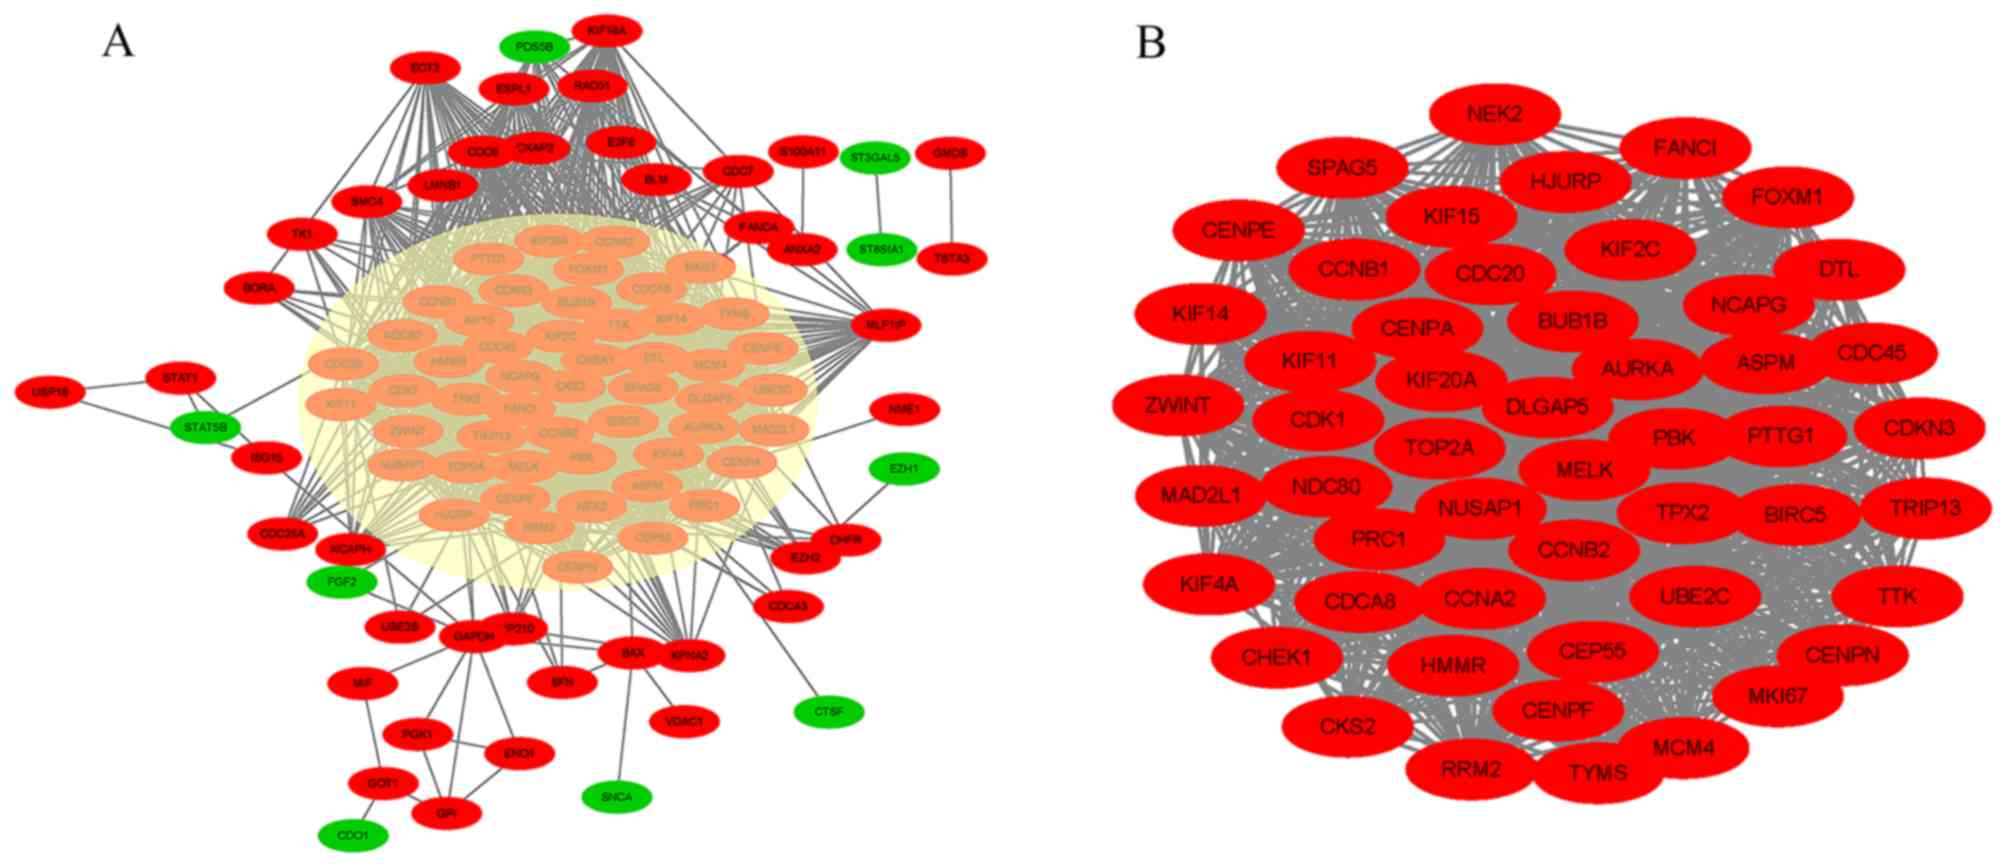
PPI network construction and modular
analysis reveal critical candidate genes and pathways
STRING and Cytoscape software were used to screen
100 of the 160 DEGs into a PPI network complex, which contained
3,140 edges and 100 nodes (Fig. 3A).
The remaining 60 DEGs did not fit into the PPI network. Of the 100
nodes, 57 hub genes were identified with a cut-off degree value of
>30 and the top 10 genes with the most significant nodes were
CDK1, CCNB1, CCNB2, TOP2A, CCNA2, CDC20, MAD2L1, BUB1B, NCAPG and
CDCA8. According to the degree of importance, a significant module
was selected from the PPI network complex for further analysis
using MCODE. A total of 51 DEGs, including 51 nodes and 2,392
edges, were then selected as hub genes from the module (Fig. 3B).
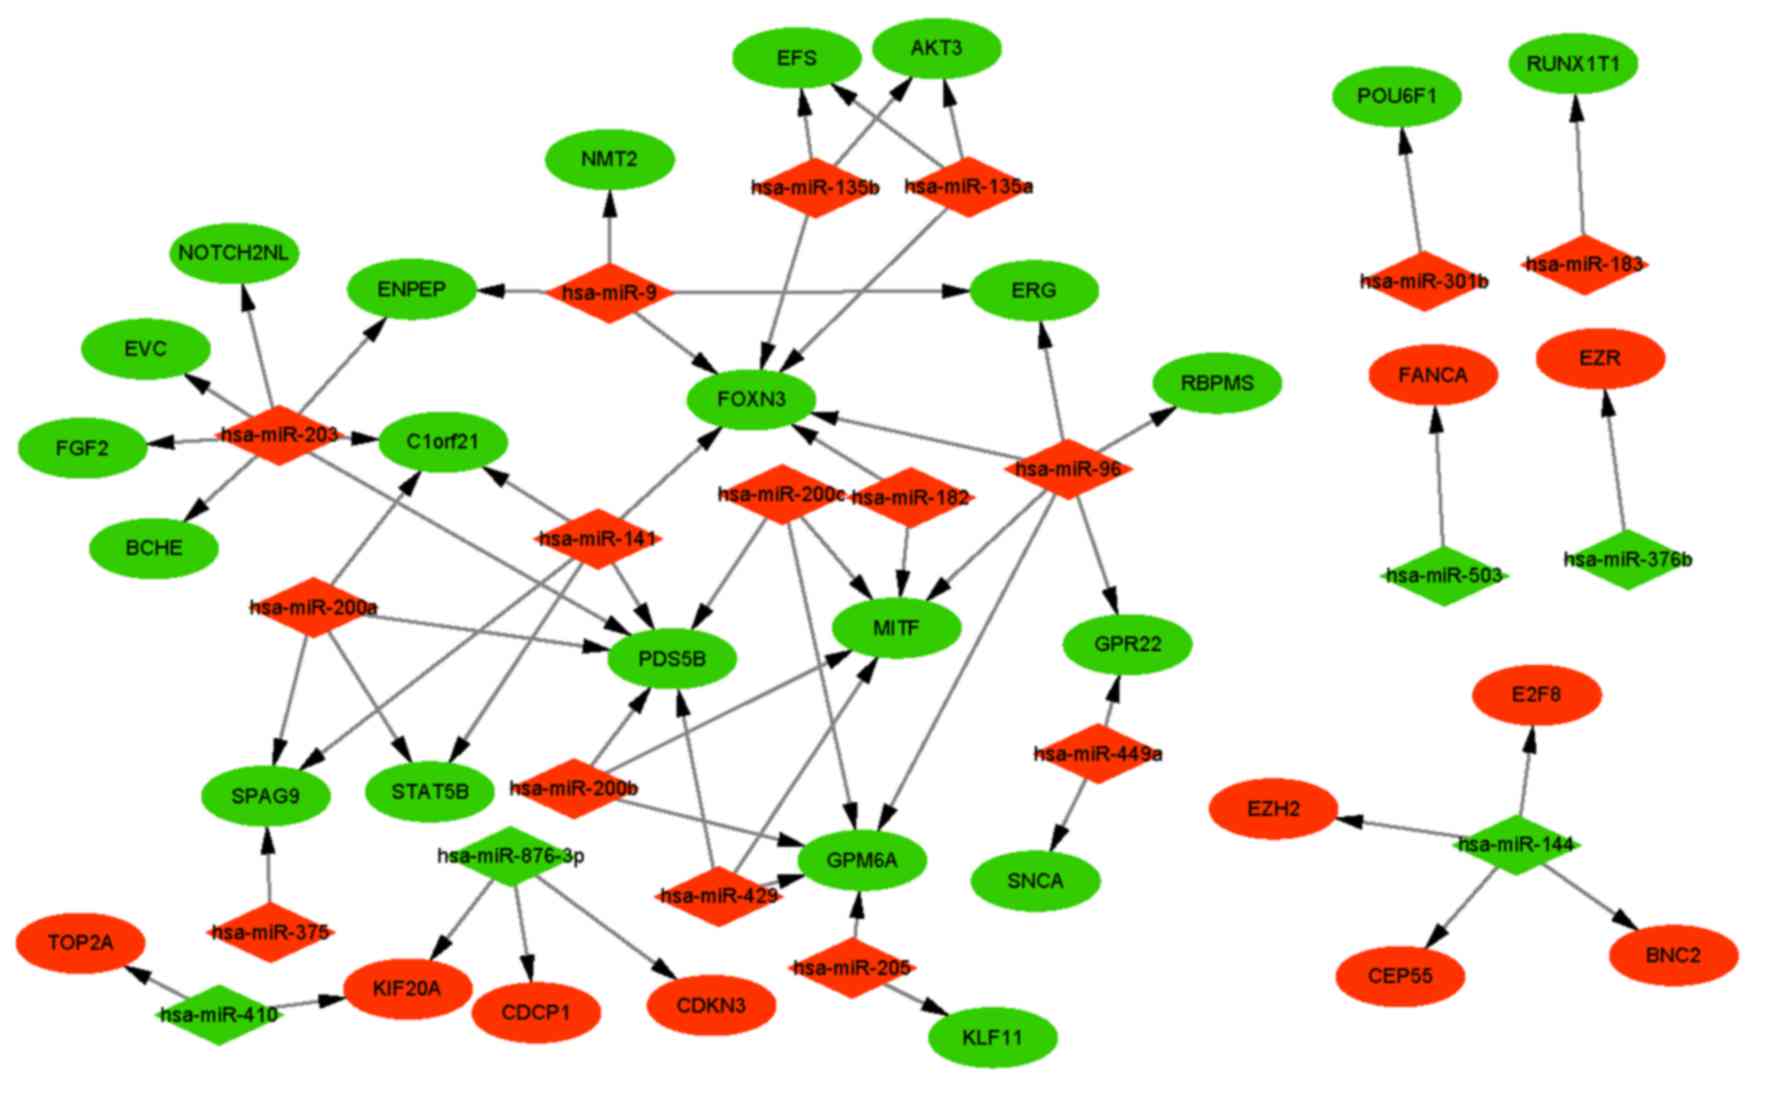
Integrated network analysis of
miRNA-mRNA interaction
A total of 35 DEMs were filtered from the GSE35794
dataset, of which 20, consisting of 14 upregulated and 6
downregulated miRNAs, were validated in TCGA data. As presented in
Table IV, the most significantly
upregulated miRNA was hsa-miR-200b, while the most significantly
downregulated miRNA was hsa-miR-503. Subsequently, the predicted
targets of DEMs were obtained on the basis of the miRecords
database. Since an inverse association was observed between miRNA
expression and that of its target mRNA, DEMs with target genes
identified as DEGs were selected for network analysis. A total of
29 pairs of DEMs and DEGs with an inverse association of expression
met this criterion, including 14 DEMs and 14 overlapping genes
(Fig. 4, Table V). Hsa-miR-203, hsa-miR-429,
hsa-miR-200a, hsa-miR-200c and hsa-miR-141 exhibited the highest
degrees (degree ≥3) in the network (Table VI).
| Table IV.Top five differentially expressed
miRNAs in endometrial cancer compared with normal tissue. |
Table IV.
Top five differentially expressed
miRNAs in endometrial cancer compared with normal tissue.
| A, Upregulated |
|---|
|
|---|
| miRNA | P-value | logFC |
|---|
| hsa-miR-200b | 0.000101 | 7.633409 |
| hsa-miR-205 | 0.001261 | 7.413916 |
| hsa-miR-200a | 0.000101 | 7.382017 |
| hsa-miR-141 | 0.000143 | 7.254374 |
| hsa-miR-200c | 0.000143 | 7.108838 |
|
| B,
Downregulated |
|
| miRNA | P-value | logFC |
|
| hsa-miR-503 | 0.027533 | −3.923641 |
| hsa-miR-876-3p | 0.047710 | −3.048536 |
| hsa-miR-144 | 0.043335 | −2.710278 |
| has-miR-133a | 0.000100 | −2.596223 |
| has-miR-154 | 0.000100 | −2.588022 |
| Table V.Correlation between differentially
expressed miRNAs and target genes. |
Table V.
Correlation between differentially
expressed miRNAs and target genes.
| miRNA | Expression | Target gene | Expression | r | P-value |
|---|
| hsa-miR-96 | Up | MITF | Down | −0.66790 |
3.77×10⁻²² |
| hsa-miR-449a | Up | SNCA | Down | −0.26599 | 0.00064878 |
| hsa-miR-429 | Up | PDS5B | Down | −0.48758 |
5.39×10⁻¹¹ |
| hsa-miR-429 | Up | MITF | Down | −0.55316 |
2.76×10⁻¹⁴ |
| hsa-miR-203 | Up | SPARC | Down | −0.39811 |
1.70×10⁻⁷ |
| hsa-miR-203 | Up | PDS5B | Down | −0.43891 |
5.75×10⁻⁹ |
| hsa-miR-203 | Up | FGF2 | Down | −0.42727 |
1.58×10⁻⁸ |
| hsa-miR-200c | Up | PDS5B | Down | −0.52345 |
1.05×10⁻¹² |
| hsa-miR-200c | Up | MITF | Down | −0.61052 |
8.09×10⁻¹⁸ |
| hsa-miR-200c | Up | GPM6A | Down | −0.61152 |
6.92×10⁻¹⁸ |
| hsa-miR-200b | Up | PDS5B | Down | −0.46714 |
4.19×10⁻¹⁰ |
| hsa-miR-200b | Up | GPM6A | Down | −0.64805 |
1.51×10⁻²⁰ |
| hsa-miR-200a | Up | STAT5B | Down | −0.61687 |
2.96×10⁻¹⁸ |
| hsa-miR-200a | Up | SPAG9 | Down | −0.45047 |
2.02×10⁻⁹ |
| hsa-miR-200a | Up | PDS5B | Down | −0.46840 |
3.71×10⁻¹⁰ |
| hsa-miR-200a | Up | C1orf21 | Down | −0.43953 |
5.44×10⁻⁹ |
| hsa-miR-182 | Up | MITF | Down | −0.69192 |
2.90×10⁻²⁴ |
| hsa-miR-182 | Up | FOXN3 | Down | −0.60518 |
1.85×10⁻¹⁷ |
| hsa-miR-141 | Up | STAT5B | Down | −0.66087 |
1.44×10⁻²¹ |
| hsa-miR-141 | Up | SPAG9 | Down | −0.47761 |
1.49×10⁻¹⁰ |
| hsa-miR-141 | Up | PDS5B | Down | −0.51944 |
1.66×10⁻¹² |
| hsa-miR-141 | Up | FOXN3 | Down | −0.58257 |
5.20×10⁻¹⁶ |
| hsa-miR-141 | Up | C1orf21 | Down | −0.42973 |
1.28×10⁻⁸ |
| hsa-miR-135b | Up | FOXN3 | Down | −0.64504 |
2.59×10⁻²⁰ |
| hsa-miR-429 | Up | GPM6A | Down | −0.66256 |
1.05×10⁻²¹ |
| hsa-miR-136 | Down | BIRC5 | Up | −0.16483 |
3.67×10⁻² |
| hsa-miR-133a | Down | CENPF | Up | −0.39548 |
2.08×10⁻⁷ |
| hsa-miR-144 | Down | BNC2 | Up | −0.19293 | 0.0142069 |
| has-miR-154 | Down | HJURP | Up | −0.16526 | 0.0361743 |
| Table VI.Node-degree analysis of miRNA-mRNA
interactions. |
Table VI.
Node-degree analysis of miRNA-mRNA
interactions.
| Node | Degree |
|---|
| hsa-miR-141 | 5 |
| hsa-miR-200a | 4 |
| hsa-miR-200c | 3 |
| hsa-miR-203 | 3 |
| hsa-miR-429 | 3 |
| hsa-miR-200b | 2 |
| hsa-miR-182 | 2 |
| hsa-miR-96 | 1 |
| hsa-miR-449a | 1 |
| hsa-miR-144 | 1 |
| hsa-miR-135b | 1 |
| hsa-miR-136 | 1 |
| hsa-miR-133a | 1 |
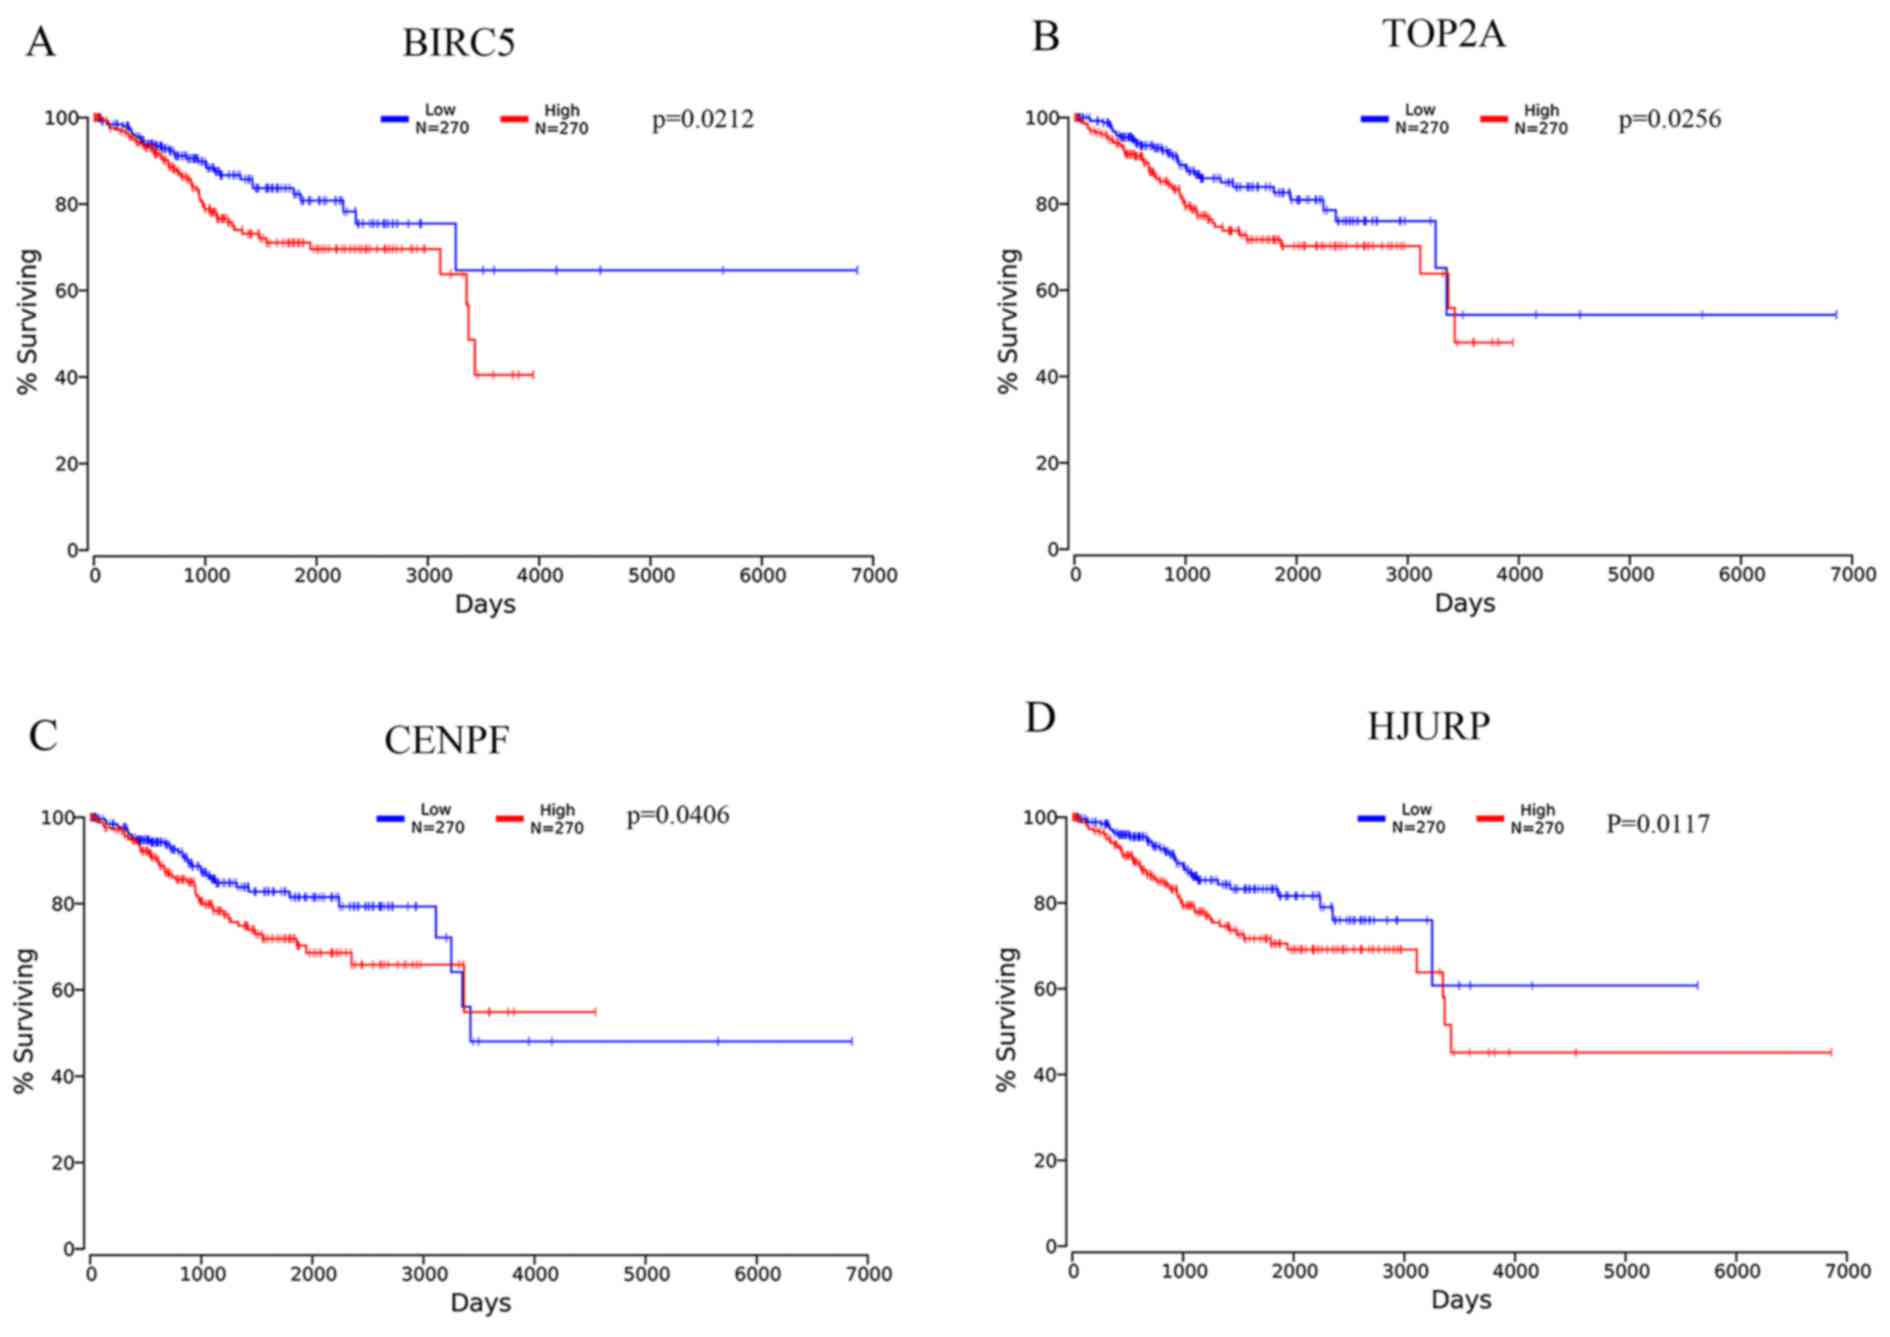
Survival analysis
The prognostic effects of the 51 hub genes in the
PPI network were evaluated in OncoLnc. The OS of patients with EC
was analyzed depending on low and high expression of each hub gene.
TOP2A, CDCA8, AURKA, TTK, ASPM, CENPA, DLGAP5, RRM2, TPX2, KIF2C,
UBE2C, CDC45, HMMR, FOXM1, KIF4A, TRIP13, SPAG5, MCM4, MKI67 and
ESPL1 were significantly associated with worse OS (data not shown).
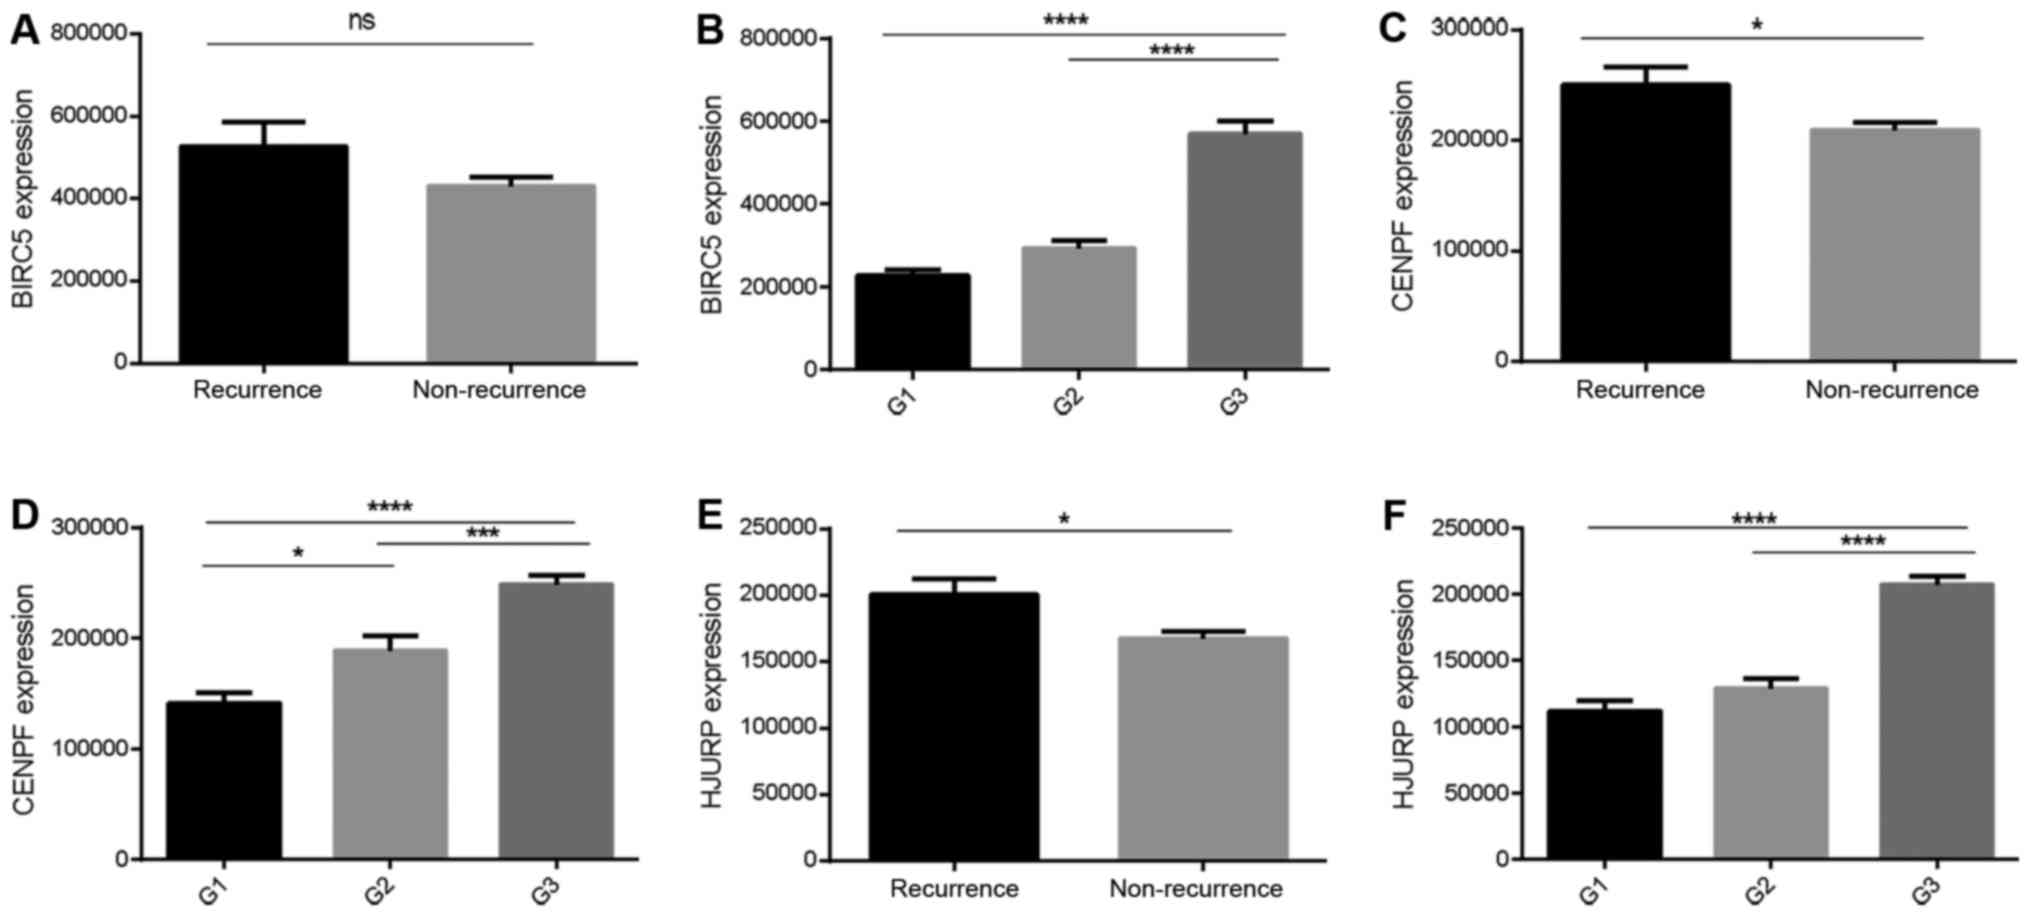
The high mRNA expression levels of BIRC5, CENPF and HJURP were
associated with worse OS of patients with EC (Fig. 5). In addition, BIRC5, CENPF and HJURP
were identified as target genes of the DEMs (Table V). Furthermore, the BIRC5 expression
level was significantly associated with tumor grade (P<0.01),
while CENPF and HJURP expression levels were significantly
associated with high tumor grade and recurrence (P<0.05;
Fig. 6).
Discussion
The incidence of EC and EC-associated mortality rate
have been increasing in recent years despite improvements in
surgical and chemo-therapies (1).
Therefore, it is important to elucidate the potential mechanisms of
EC tumorigenesis and development, and identify the key pathogenic
factors to improve prognosis and clinical outcome.
The current study integrated two microarray
expression profiles from GEO with TCGA data and identified 160 DEGs
between the normal and tumor samples, including 111 upregulated and
49 downregulated genes. As per the GO and KEGG enrichment analysis,
most of the DEGs were predicted to be associated with cell cycle,
HTLV-I infection and pathways in cancer. Following construction of
the PPI network, 51 hub genes were identified. Similarly, 20 DEMs
were identified from the GEO and TCGA databases. After integrating
the target genes of these DEMs with the DEGs, 14 overlapping genes
were identified, of which three hub genes (BIRC5, CENPF, HJURP)
were associated with poor prognosis and aggressive grade of
patients with EC.
The results of KEGG pathway analysis are noteworthy
as several studies have previously demonstrated the involvement of
the cell cycle in the development of EC (21,22).
HTLV-1 has been identified to cause specific T cell leukemias and
lymphoma (23). HTLV-1 infection is
also associated with other diseases, including neuroinflammatory
disease (24), dermatitis (25) and uveitis (26). In some populations, the development of
aggressive cervical carcinomas is associated with high HTLV-1
seroprevalence (27). In addition,
certain cancer types have been associated with HTLV-1-hematologic
malignancies (28), including
adenocarcinoma of the thyroid or stomach and squamous cell
carcinoma of the larynx, lip or lung. Notably, one previous study
revealed the occurrence of endometrial adenocarcinoma in a rabbit
inoculated with HTLV-1 (29). These
findings are consistent with the current study, indicating an
important role of the HTLV-1 infection pathway in EC.
miRNAs are a group of endogenous non-coding RNA
molecules that can repress gene expression by targeting the 3′-UTR
of mRNAs. Recent studies have reported that miRNA dysregulation may
serve important roles in cancer development (30,31). In
the current study, 20 DEMs were identified in EC compared with
normal tissues, including hsa-miR-203, hsa-miR-429, has-miR-200a,
hsa-miR-200c and hsa-miR-141. Several studies have suggested that
hsa-miR-203 not only functions as an oncogene, but also as a tumor
suppressor. It is downregulated in several tumors, including
non-small-cell lung cancer, gastric mucosa-associated lymphoid
tissue lymphoma and myeloma, and can inhibit G protein signaling
17, as well as the oncogene, B-cell-specific Moloney murine
leukemia virus insertion site-1 (32–34). As an
oncogene, hsa-miR-203 is overexpressed in ovarian cancer tissues
where it promotes glycolysis (35).
One study has reported frequent hypermethylation of miR-203 in EC
(36), however the expression of
miR-203 was upregulated in the current study, consistent with the
findings of Benati et al (37). miRNAs are regulated by multiple
mechanisms including epigenetic, transcriptional,
post-transcriptional and degradation regulation (38). Although it is reported that miR-203
hypermethylation is associated with EC, to the best of our
knowledge, no studies have investigated the association between
miR-203 hypermethylation and its expression level. The pathways of
miR-203 upregulation in EC may be due to other mechanisms, which
requires further investigation.
Hsa-miR-429 has been revealed to act as a tumor
suppressor in renal cell carcinoma, gastric cancer and
glioblastoma, by inhibiting cell proliferation, invasion and
metastasis (39–41). However, hsa-miR-429 was upregulated in
the current study, implying that it may function as an oncogene in
EC. Hsa-miR-141 downregulates transmembrane-4-L-six-family-1 to
inhibit pancreatic cancer cell invasion and migration and is widely
considered as a potential candidate for the post-transcriptional
regulation of phospholipase A2 receptor 1 expression in mammary
cancer cells (42,43). One study has demonstrated that
hsa-miR-141 upregulation is important for EC growth (44). Based on the aforementioned findings,
the current study hypothesizes that hsa-miR-203, hsa-miR-141 and
hsa-miR-429 serve important roles in EC via different pathways.
Survival analysis of the overlapping DEGs and the
target genes of the DEMs revealed that BIRC5, CENPF and HJURP were
associated with poor prognosis of patients with EC. BIRC5 encodes
survivin, which can regulate p21 expression in HeLa cells (45) and may be regulated by certain miRNAs
(45,46). Chuwa et al (47) reported that a high expression level of
BIRC5 is associated with poor prognosis of EC, while Li et
al (48) demonstrated that low
expression levels of CENPF are associated with better overall
survival of patients with bladder cancer. HJURP encodes holiday
junction recognition protein, a centromeric histone chaperone
involved in de novo histone H3 variant CenH3 recruitment and
may regulate proliferation and apoptosis in bladder cancer cells by
dysregulating the cell cycle and reactive oxygen species metabolism
via the peroxisome proliferator-activated receptor γ-sirtuin 1
feedback loop (49). Hu et al
(50) identified that the
overexpression of HJURP predicts a poor prognosis of hepatocellular
carcinoma.
In conclusion, the current study identified 160 DEGs
and 20 DEMs in EC, and 14 DEGs were identified as target genes of
the DEMs. Network analysis indicated a co-regulatory association
between hsa-miR-203, hsa-miR-429 and hsa-miR-141, as well as the
corresponding target mRNAs. These findings may improve
understanding of the pathogenesis and the potential molecular
mechanisms involved in EC, and assist with the identification of
novel diagnostic and therapeutic biomarkers. However, the current
study has limitations. The regulation of DEGs is complicated and
the current study has only investigated the regulators of DEGs at
the post-transcriptional level (miRNA) and the epigenetic level
(DNA methylation). Additional studies should be performed to
identify the putative regulators of DEGs. For example, future
studies may construct a transcription factor-mRNA network to
identify regulators at the transcriptional level.
Acknowledgements
Not applicable.
Funding
Not applicable.
Availability of data and materials
The datasets used and analyzed during the present
study are available from the corresponding author on reasonable
request.
Authors' contributions
YL and HW conceived and designed the study; YL, TH,
and SC performed data analysis; YL and HW wrote the manuscript.
Ethics approval and consent to
participate
Not applicable.
Patient consent for publication
Not applicable.
Competing interests
The authors declare that they have no competing
interests.
References
|
1
|
Siegel RL, Miller KD and Jemal A: Cancer
statistics, 2016. CA Cancer J Clin. 66:7–30. 2016. View Article : Google Scholar : PubMed/NCBI
|
|
2
|
Siegel R, Naishadham D and Jemal A: Cancer
statistics, 2012. CA Cancer J Clin. 62:10–29. 2012. View Article : Google Scholar : PubMed/NCBI
|
|
3
|
Vogelstein B, Papadopoulos N, Velculescu
VE, Zhou S, Diaz LA Jr and Kinzler KW: Cancer genome landscapes.
Science. 339:1546–1558. 2013. View Article : Google Scholar : PubMed/NCBI
|
|
4
|
Mehrgou A and Akouchekian M: Therapeutic
impacts of microRNAs in breast cancer by their roles in regulating
processes involved in this disease. J Res Med Sci. 22:1302017.
View Article : Google Scholar : PubMed/NCBI
|
|
5
|
Ambros V: The functions of animal
microRNAs. Nature. 431:350–355. 2004. View Article : Google Scholar : PubMed/NCBI
|
|
6
|
Croce CM and Calin GA: miRNAs, cancer, and
stem cell division. Cell. 122:6–7. 2005. View Article : Google Scholar : PubMed/NCBI
|
|
7
|
Dong P, Konno Y, Watari H, Hosaka M,
Noguchi M and Sakuragi N: The impact of microRNA-mediated PI3K/AKT
signaling on epithelial-mesenchymal transition and cancer stemness
in endometrial cancer. J Transl Med. 12:2312014. View Article : Google Scholar : PubMed/NCBI
|
|
8
|
Ramón LA, Braza-Boïls A, Gilabert J,
Chirivella M, España F, Estellés A and Gilabert-Estellés J:
microRNAs related to angiogenesis are dysregulated in endometrioid
endometrial cancer. Hum Reprod. 27:3036–3045. 2012. View Article : Google Scholar : PubMed/NCBI
|
|
9
|
Devor EJ, Miecznikowski J, Schickling BM,
Gonzalez-Bosquet J, Lankes HA, Thaker P, Argenta PA, Pearl ML,
Zweizig SL, Mannel RS, et al: Dysregulation of miR-181c expression
influences recurrence of endometrial endometrioid adenocarcinoma by
modulating NOTCH2 expression: An NRG oncology/gynecologic oncology
group study. Gynecol Oncol. 147:648–653. 2017. View Article : Google Scholar : PubMed/NCBI
|
|
10
|
Day RS, McDade KK, Chandran UR, Lisovich
A, Conrads TP, Hood BL, Kolli VS, Kirchner D, Litzi T and Maxwell
GL: Identifier mapping performance for integrating transcriptomics
and proteomics experimental results. BMC Bioinformatics.
12:2132011. View Article : Google Scholar : PubMed/NCBI
|
|
11
|
Pappa KI, Polyzos A, Jacob-Hirsch J,
Amariglio N, Vlachos GD, Loutradis D and Anagnou NP: Profiling of
discrete gynecological cancers reveals novel transcriptional
modules and common features shared by other cancer types and
embryonic stem cells. PLoS One. 10:e01422292015. View Article : Google Scholar : PubMed/NCBI
|
|
12
|
Wilson CL and Miller CJ: Simpleaffy: A
BioConductor package for affymetrix quality control and data
analysis. Bioinformatics. 21:3683–3685. 2005. View Article : Google Scholar : PubMed/NCBI
|
|
13
|
Ritchie ME, Phipson B, Wu D, Hu Y, Law CW,
Shi W and Smyth GK: limma powers differential expression analyses
for RNA-sequencing and microarray studies. Nucleic Acids Res.
43:e472015. View Article : Google Scholar : PubMed/NCBI
|
|
14
|
Hardcastle TJ: Generalized empirical
Bayesian methods for discovery of differential data in
high-throughput biology. Bioinformatics. 32:195–202.
2016.PubMed/NCBI
|
|
15
|
Robinson MD, McCarthy DJ and Smyth GK:
edgeR: A Bioconductor package for differential expression analysis
of digital gene expression data. Bioinformatics. 26:139–140. 2010.
View Article : Google Scholar : PubMed/NCBI
|
|
16
|
Szklarczyk D, Morris JH, Cook H, Kuhn M,
Wyder S, Simonovic M, Santos A, Doncheva NT, Roth A, Bork P, et al:
The STRING database in 2017: Quality-controlled protein-protein
association networks, made broadly accessible. Nucleic Acids Res.
45:D362–D368. 2017. View Article : Google Scholar : PubMed/NCBI
|
|
17
|
Shannon P, Markiel A, Ozier O, Baliga NS,
Wang JT, Ramage D, Amin N, Schwikowski B and Ideker T: Cytoscape: A
software environment for integrated models of biomolecular
interaction networks. Genome Res. 13:2498–2504. 2003. View Article : Google Scholar : PubMed/NCBI
|
|
18
|
Bader GD and Hogue CW: An automated method
for finding molecular complexes in large protein interaction
networks. BMC Bioinformatics. 4:22003. View Article : Google Scholar : PubMed/NCBI
|
|
19
|
Xiao F, Zuo Z, Cai G, Kang S, Gao X and Li
T: miRecords: An integrated resource for microRNA-target
interactions. Nucleic Acids Res. 37:D105–D110. 2009. View Article : Google Scholar : PubMed/NCBI
|
|
20
|
Anaya J: OncoLnc: Linking TCGA survival
data to mRNAs, miRNAs, and lncRNAs. PeerJ Computer Science.
2:e672016. View Article : Google Scholar
|
|
21
|
Suh DS, Park SE, Jin H, Lee K and Bae J:
LRIG2 is a growth suppressor of Hec-1A and Ishikawa endometrial
adenocarcinoma cells by regulating PI3K/AKT- and EGFR-mediated
apoptosis and cell-cycle. Oncogenesis. 7:32018. View Article : Google Scholar : PubMed/NCBI
|
|
22
|
Shyam H, Singh N, Kaushik S, Sharma R and
Balapure AK: Centchroman induces redox-dependent apoptosis and
cell-cycle arrest in human endometrial cancer cells. Apoptosis.
22:570–584. 2017. View Article : Google Scholar : PubMed/NCBI
|
|
23
|
Nosaka K, Iwanaga M, Imaizumi Y, Ishitsuka
K, Ishizawa K, Ishida Y, Amano M, Ishida T, Uike N, Utsunomiya A,
et al: Epidemiological and clinical features of adult T-cell
leukemia-lymphoma in Japan, 2010–2011: A nationwide survey. Cancer
Sci. 108:2478–2486. 2017. View Article : Google Scholar : PubMed/NCBI
|
|
24
|
Matsuura E, Nozuma S, Tashiro Y, Kubota R,
Izumo S and Takashima H: HTLV-1 associated myelopathy/tropical
spastic paraparesis (HAM/TSP): A comparative study to identify
factors that influence disease progression. J Neurol Sci.
371:112–116. 2016. View Article : Google Scholar : PubMed/NCBI
|
|
25
|
Lee R and Schwartz RA: Human
T-lymphotrophic virus type 1-associated infective dermatitis: A
comprehensive review. J Am Acad Dermatol. 64:152–160. 2011.
View Article : Google Scholar : PubMed/NCBI
|
|
26
|
Kamoi K and Mochizuki M: HTLV-1 uveitis.
Front Microbiol. 3:2702012. View Article : Google Scholar : PubMed/NCBI
|
|
27
|
Strickler HD, Rattray C, Escoffery C,
Manns A, Schiffman MH, Brown C, Cranston B, Hanchard B, Palefsky JM
and Blattner WA: Human T-cell lymphotropic virus type I and severe
neoplasia of the cervix in Jamaica. Int J Cancer. 61:23–26. 1995.
View Article : Google Scholar : PubMed/NCBI
|
|
28
|
Imamura N, Inada T, Tagaya Y, Yodoi J and
Kuramoto A: Association between ATL and non-hematopoietic
neoplasms. Hematol Oncol. 11:127–137. 1993. View Article : Google Scholar : PubMed/NCBI
|
|
29
|
Zhao TM, Bryant MA, Kindt TJ and Simpson
RM: Monoclonally integrated HTLV type 1 in epithelial cancers from
rabbits infected with an HTLV type 1 molecular clone. AIDS Res Hum
Retroviruses. 18:253–258. 2002. View Article : Google Scholar : PubMed/NCBI
|
|
30
|
Ma J, Li D, Kong FF, Yang D, Yang H and Ma
XX: miR-302a-5p/367-3p-HMGA2 axis regulates malignant processes
during endometrial cancer development. J Exp Clin Cancer Res.
37:192018. View Article : Google Scholar : PubMed/NCBI
|
|
31
|
Srivastava SK, Ahmad A, Zubair H, Miree O,
Singh S, Rocconi RP, Scalici J and Singh AP: MicroRNAs in
gynecological cancers: Small molecules with big implications.
Cancer Lett. 407:123–138. 2017. View Article : Google Scholar : PubMed/NCBI
|
|
32
|
Chi Y, Jin Q, Liu X, Xu L, He X, Shen Y,
Zhou Q, Zhang J and Jin M: miR-203 inhibits cell proliferation,
invasion, and migration of non-small-cell lung cancer by
downregulating RGS17. Cancer Sci. 108:2366–2372. 2017. View Article : Google Scholar : PubMed/NCBI
|
|
33
|
Fernández C, Bellosillo B, Ferraro M,
Seoane A, Sánchez-González B, Pairet S, Pons A, Barranco L, Vela
MC, Gimeno E, et al: MicroRNAs 142-3p, miR-155 and miR-203 are
deregulated in gastric MALT lymphomas compared to chronic
gastritis. Cancer Genomics Proteomics. 14:75–82. 2017. View Article : Google Scholar : PubMed/NCBI
|
|
34
|
Wu SQ, Niu WY, Li YP, Huang HB and Zhan R:
miR-203 inhibits cell growth and regulates G1/S transition by
targeting Bmi-1 in myeloma cells. Mol Med Rep. 14:4795–4801. 2016.
View Article : Google Scholar : PubMed/NCBI
|
|
35
|
Xiaohong Z, Lichun F, Na X, Kejian Z,
Xiaolan X and Shaosheng W: MiR-203 promotes the growth and
migration of ovarian cancer cells by enhancing glycolytic pathway.
Tumour Biol. 37:14989–14997. 2016. View Article : Google Scholar : PubMed/NCBI
|
|
36
|
Huang YW, Kuo CT, Chen JH, Goodfellow PJ,
Huang TH, Rader JS and Uyar DS: Hypermethylation of miR-203 in
endometrial carcinomas. Gynecol Oncol. 133:340–345. 2014.
View Article : Google Scholar : PubMed/NCBI
|
|
37
|
Benati M, Montagnana M, Danese E, Paviati
E, Giudici S, Franchi M and Lippi G: Evaluation of mir-203
expression levels and DNA promoter methylation status in serum of
patients with endometrial cancer. Clin Lab. 63:1675–1681. 2017.
View Article : Google Scholar : PubMed/NCBI
|
|
38
|
Krol J, Loedige I and Filipowicz W: The
widespread regulation of microRNA biogenesis, function and decay.
Nat Rev Genet. 11:597–610. 2010. View
Article : Google Scholar : PubMed/NCBI
|
|
39
|
Machackova T, Mlcochova H, Stanik M,
Dolezel J, Fedorko M, Pacik D, Poprach A, Svoboda M and Slaby O:
MiR-429 is linked to metastasis and poor prognosis in renal cell
carcinoma by affecting epithelial-mesenchymal transition. Tumour
Biol. 37:14653–14658. 2016. View Article : Google Scholar : PubMed/NCBI
|
|
40
|
Peng G, Liao Y and Shen C: miRNA-429
inhibits astrocytoma proliferation and invasion by targeting BMI1.
Pathol Oncol Res. 23:369–376. 2017. View Article : Google Scholar : PubMed/NCBI
|
|
41
|
Liu D, Xia P, Diao D, Cheng Y, Zhang H,
Yuan D, Huang C and Dang C: MiRNA-429 suppresses the growth of
gastric cancer cells in vitro. J Biomed Res. 26:389–393. 2012.
View Article : Google Scholar : PubMed/NCBI
|
|
42
|
Xu L, Li Q, Xu D, Wang Q, An Y, Du Q,
Zhang J, Zhu Y and Miao Y: Hsa-miR-141 downregulates TM4SF1 to
inhibit pancreatic cancer cell invasion and migration. Int J Oncol.
44:459–466. 2014. View Article : Google Scholar : PubMed/NCBI
|
|
43
|
Menschikowski M, Hagelgans A, Nacke B,
Jandeck C, Sukocheva O and Siegert G: Epigenetic control of
phospholipase A2 receptor expression in mammary cancer cells. BMC
Cancer. 15:9712015. View Article : Google Scholar : PubMed/NCBI
|
|
44
|
Lee JW, Park YA, Choi JJ, Lee YY, Kim CJ,
Choi C, Kim TJ, Lee NW, Kim BG and Bae DS: The expression of the
miRNA-200 family in endometrial endometrioid carcinoma. Gynecol
Oncol. 120:56–62. 2011. View Article : Google Scholar : PubMed/NCBI
|
|
45
|
Xu Q, Liu M, Zhang J, Xue L, Zhang G, Hu
C, Wang Z, He S, Chen L, Ma K, et al: Overexpression of KLF4
promotes cell senescence through microRNA-203-survivin-p21 pathway.
Oncotarget. 7:60290–60302. 2016.PubMed/NCBI
|
|
46
|
Zhang D, Liu E, Kang J, Yang X and Liu H:
MiR-3613-3p affects cell proliferation and cell cycle in
hepatocellular carcinoma. Oncotarget. 8:93014–93028.
2017.PubMed/NCBI
|
|
47
|
Chuwa AH, Sone K, Oda K, Ikeda Y, Fukuda
T, Wada-Hiraike O, Inaba K, Makii C, Takeuchi M, Oki S, et al:
Significance of survivin as a prognostic factor and a therapeutic
target in endometrial cancer. Gynecol Oncol. 141:564–569. 2016.
View Article : Google Scholar : PubMed/NCBI
|
|
48
|
Li S, Liu X, Liu T, Meng X, Yin X, Fang C,
Huang D, Cao Y, Weng H, Zeng X and Wang X: Identification of
biomarkers correlated with the TNM staging and overall survival of
patients with bladder cancer. Front Physiol. 8:9472017. View Article : Google Scholar : PubMed/NCBI
|
|
49
|
Cao R, Wang G, Qian K, Chen L, Qian G, Xie
C, Dan HC, Jiang W, Wu M, Wu CL, et al: Silencing of HJURP induces
dysregulation of cell cycle and ROS metabolism in bladder cancer
cells via PPARγ-SIRT1 feedback loop. J Cancer. 8:2282–2295. 2017.
View Article : Google Scholar : PubMed/NCBI
|
|
50
|
Hu B, Wang Q, Wang Y, Chen J, Li P and Han
M: Holliday junction-recognizing protein promotes cell
proliferation and correlates with unfavorable clinical outcome of
hepatocellular carcinoma. OncoTargets Ther. 10:2601–2607. 2017.
View Article : Google Scholar
|