Introduction
Childhood acute lymphoblastic leukemia (cALL) arises
more often from B-cell lineages than from T-cell lineages (1). The survival rate of cALL is
significantly superior in children compared with in adolescents and
adults, partly due to the higher prevalence of favorable genetic
variations in children, including myeloid/lymphoid leukemia
(MLL), cytokine receptor-like factor 2, ETS variant gene
6-runt-related transcription factor 1 and hyperdiploidy (2). After 40 years of research, the cure rate
for cALL has significantly improved, and the overall 5-year
event-free survival rate has reached ~90% (3). Despite this progress, 10–20% of patients
experience relapses, and their prognoses are poor, even after
receiving allogeneic stem cell transplantation (4,5).
Therefore, it is crucial to further explore the pathogenesis of
cALL, particularly its recurrence, and to develop novel treatment
strategies. Long non-coding RNAs (lncRNAs) belong to a class of
transcripts with no protein-coding capacity, which are >200 bp
long (6). Previous studies have
demonstrated that lncRNAs have a wide range of regulatory effects
on tumorigenesis, including proliferation (7), migration (8), invasion (9), apoptosis (10) and recurrence (11). In addition, mechanisms underlying the
involvement of lncRNAs in cALL have previously been explored. Fang
et al reported that a set of lncRNAs affects proliferation
and apoptosis in MLL-rearranged-cALL via co-expression with
the homeobox A gene cluster (12).
Trimarchi et al also demonstrated that the lncRNA LUNAR1 is
essential for the growth of T-cell ALL (T-ALL) and maintains high
expression levels of insulin-like growth factor 1 receptor via a
cis-activation mechanism (13). In addition, Trimarchi et al
documented that several lncRNAs can be regulated by Notch activity
in T-ALL (13). Wang et al
demonstrated that the lncRNA NALT interacts with Notch homolog 1,
translocation-associated to promote cell proliferation in T-ALL
(14). These findings indicated that
lncRNAs may serve essential roles in ALL, including cALL.
In 2016, Yeoh et al (15) previously constructed an RNA-seq
dataset of the time-dependent gene expression profiles of patients
with cALL (GSE67684; http://www.ncbi.nlm.nih.gov/geo/query/acc.cgi?acc=GSE67684)
and revealed that effective response metric was a prognostic
factor. This dataset was then analyzed by another research group,
which revealed that microRNA-590 promotes cell proliferation and
invasion in T-ALL via suppression of RB transcriptional corepressor
1 (16). To further explore the
mechanism underlying the involvement of lncRNAs in cALL, this
RNA-seq dataset was re-analyzed in the current study using
bioinformatics methods to provide novel insights into the ontogeny
and treatment of cALL.
Materials and methods
Data source
A time-series gene expression profiling dataset,
GSE67684, was downloaded from the Gene Expression Omnibus (GEO,
http://www.ncbi.nlm.nih.gov/geo/query/acc.cgi?acc=GSE67684).
A total of 495 cALL blood samples from 210 children (111 males, 90
females and 9 unknown with 160 patients between 1–10 years and 50
patients <1 or >10 years) were used in this study, including
194 at Day 0, 193 at Day 8, 49 at Day 15 and 59 at Day 33
post-diagnosis. In this time series dataset, expression levels of
lncRNAs and mRNAs were detected using the GPL570 [HG-U133 Plus 2]
Affymetrix Human Genome U133 Plus 2.0 Array and GPL96 [HG-U133A]
Affymetrix Human Genome U133A Array, respectively platforms,
respectively (Affymetrix; Thermo Fisher Scientific, Inc., Waltham,
MA, USA).
Identification of differentially
expressed genes (DEGs) and lncRNAs (DELs)
According to the annotation profiles provided by the
GPL570 [HG-U133 Plus 2] Affymetrix Human Genome U133 Plus 2.0
Array, expression information of lncRNA-associated probes was
analyzed using ExpressionConsole (version 1.1; Affymetrix; Thermo
Fisher Scientific, Inc.) to evaluate the gene expression levels.
BLAST (https://blast.ncbi.nlm.nih.gov/Blast.cgi) was used to
annotate the probes matched to lncRNAs. Additionally, expression
information of mRNA-associated probes was analyzed using
ExpressionConsole based on the information provided by GPL96
[HG-U133A] Affymetrix Human Genome U133A Array. Subsequently, DEGs
and DELs between Day 0, 8, 15 and 33 were screened using random
variance model corrective analysis of variance in R 3.5.1 software
(https://cran.r-project.org/). Thresholds
of DEGs and DELs were set as follows: P≤0.001, false discovery rate
(FDR) ≤0.01, and fold change ≥2. Numbers of screened DEGs and DELs
were illustrated using Venn diagrams.
Clustering analysis of overlapping
DEGs and DELs
Using Venn diagrams, overlapping DEGs and DELs were
clustered using Cluster 3.0 (http://bonsai.hgc.jp/~mdehoon/software/cluster/software.htm).
Based on these results, significantly different DEG and DEL
profiles (clusters) over time were selected using a series test of
cluster approach, as previously described (17,18), with
P<0.05.
Enrichment analysis of DEGs
To explore the biological functions of DEGs and the
pathways in which they are involved, function and pathway
enrichments of DEG profiles were conducted using the Database for
Annotation, Visualization and Integration Discovery (DAVID;
http://david.abcc.ncifcrf.gov/) based on
the Gene Ontology (GO; http://www.geneontology.org/) and the Kyoto
Encyclopedia of Genes and Genomes (KEGG; http://www.genome.jp/kegg/pathway.html) databases. GO
terms and KEGG pathways were considered significantly enriched when
the following criteria were met: P≤0.05 and FDR <0.05.
Construction of the lncRNA-mRNA
network
According to the significantly enriched GO terms and
KEGG pathways, overlapping mRNAs were selected. Using the
overlapping mRNA (obtained based on the enrichment of GO terms and
KEGG pathways) and overlapping lncRNAs, the interactions between
lncRNAs and mRNAs were evaluated using dynamic simulations based on
gene-sample matrices, and the Pearson correlation coefficient of
each lncRNA-mRNA pair was calculated using the function cor.test
(X, Y, method = ‘Pearson’) of R software (19). The pairs with Pearson correlation
coefficients >0.8 and P<0.05 were selected; subsequently, the
lncRNA-mRNA network was constructed using Cytoscape version 3.0.2
(http://chianti.ucsd.edu/cytoscape-3.0.2/).
Construction of protein-protein
interaction network (PPI)
Based on the lncRNA-mRNA network, co-expressed DEGs
involved in this network were selected, and the interactions among
them were predicted using the Search Tool for the Retrieval of
Interacting Genes (STRING; version 10.0; http://www.string-db.org/) database (functional
protein interaction networks). Interactions among proteins were
visualized using Cytoscape version 3.0.2 based on these predicted
relationship pairs.
Validation of DEL expression
This study was approved by the Clinical Research
Ethics Committee of The First Affiliated Hospital of Nanjing
Medical University (Nanjing, China). From March 2016 to July 2017,
44 subjects (23 males, 21 females, with mean age of 7.5 years) were
recruited including 14 controls and 30 with cALL. Informed consent
was obtained from the subjects' parents prior to participation. A
total of 14 blood samples (four without cALL and 10 with cALL) were
analyzed using RT-qPCR to verify the expression of DELs identified
in this study. In addition, 30 bone marrow samples, including 10
controls and 20 with cALL, were collected to confirm the findings
using reverse transcription-quantitative polymerase chain reaction
(RT-qPCR). The samples in the cALL group were collected from
patients with recurrent cALL who were receiving methotrexate
chemotherapy and the samples in the control group were collected
from healthy individuals. Total RNA was isolated using
TRIzol® reagent (Invitrogen; Thermo Fisher Scientific,
Inc.) and was quantified using a NanoDrop spectrophotometer
(NanoDrop; Thermo Fisher Scientific, Inc., Wilmington, DE, USA).
Subsequently, 1 µg total RNA was reverse transcribed to cDNA using
a SuperScript III transcript kit (Thermo Fisher Scientific, Inc.,
Waltham, MA, USA), according to the manufacturer's protocol.
Amplification was performed using SYBR reagent (Thermo Fisher
Scientific, Inc.) on a Thermo 7500 PCR thermocycler (Thermo Fisher
Scientific, Inc.) with the following reaction conditions: 95°C for
20 sec, followed by 40 cycles at 95°C for 3 sec and 60°C for 30
sec. GAPDH was used as the internal control for quantitative
analysis with the 2−ΔΔCq method (20). Primers of lncRNAs and GAPDH
were designed as follows: NONHSAT027612.2, forward,
5′-GAGTGCAGTGGCGTGATCTT-3′ and reverse,
5′-GTGGTGGTGCATGCCTGTAGT-3′; NONHSAT134556.2; forward,
5′-GATCATGCGGTTAAGGAGTGTG-3′ and reverse,
5′-TCATCCTGCTAAGCGCTGAG-3′; GAPDH, forward,
5′-GTGGAGTCCACTGGCGTCTT-3′ and reverse 5′-GTGCAGGAGGCATTGCTGAT-3′.
Data are presented as the means ± standard deviation. Comparisons
between groups were performed using Student's t-test in SPSS
version 15.0 software (SPSS, Inc., Chicago, IL, USA) and P<0.05
was considered to indicate a statistically significant
difference.
Results
Identification of DEGs and DELs
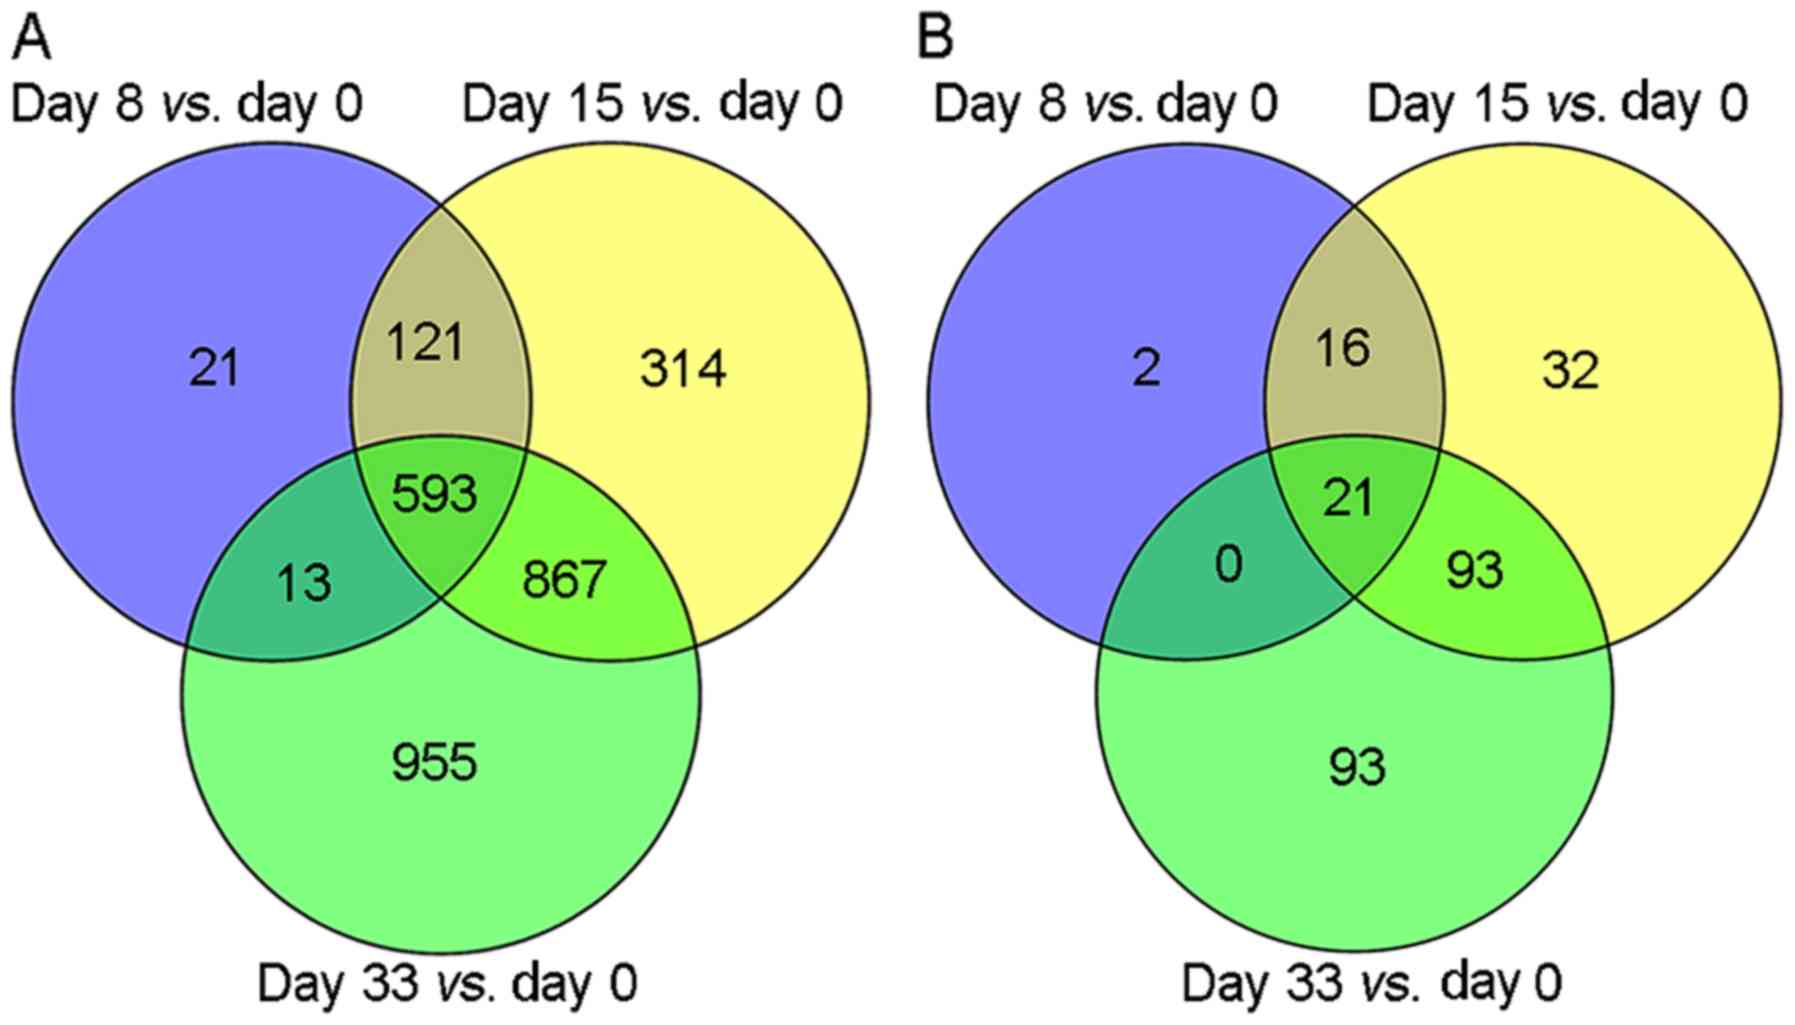
According to the selected thresholds, a total of
748, 1,895 and 2,428 DEGs were identified in the comparisons of Day
0 with Day 8, Day 0 with Day 15, and Day 0 with Day 33,
respectively (Fig. 1A). Among these,
593 overlapping DEGs were identified. In addition, a total of 39,
162 and 207 DELs were identified when Day 0 results were compared
with results from Day 8, 15 and 33, respectively (Fig. 1B). Among these, 21 overlapping DELs
were identified.
Cluster analysis of overlapping DEGs
and DELs
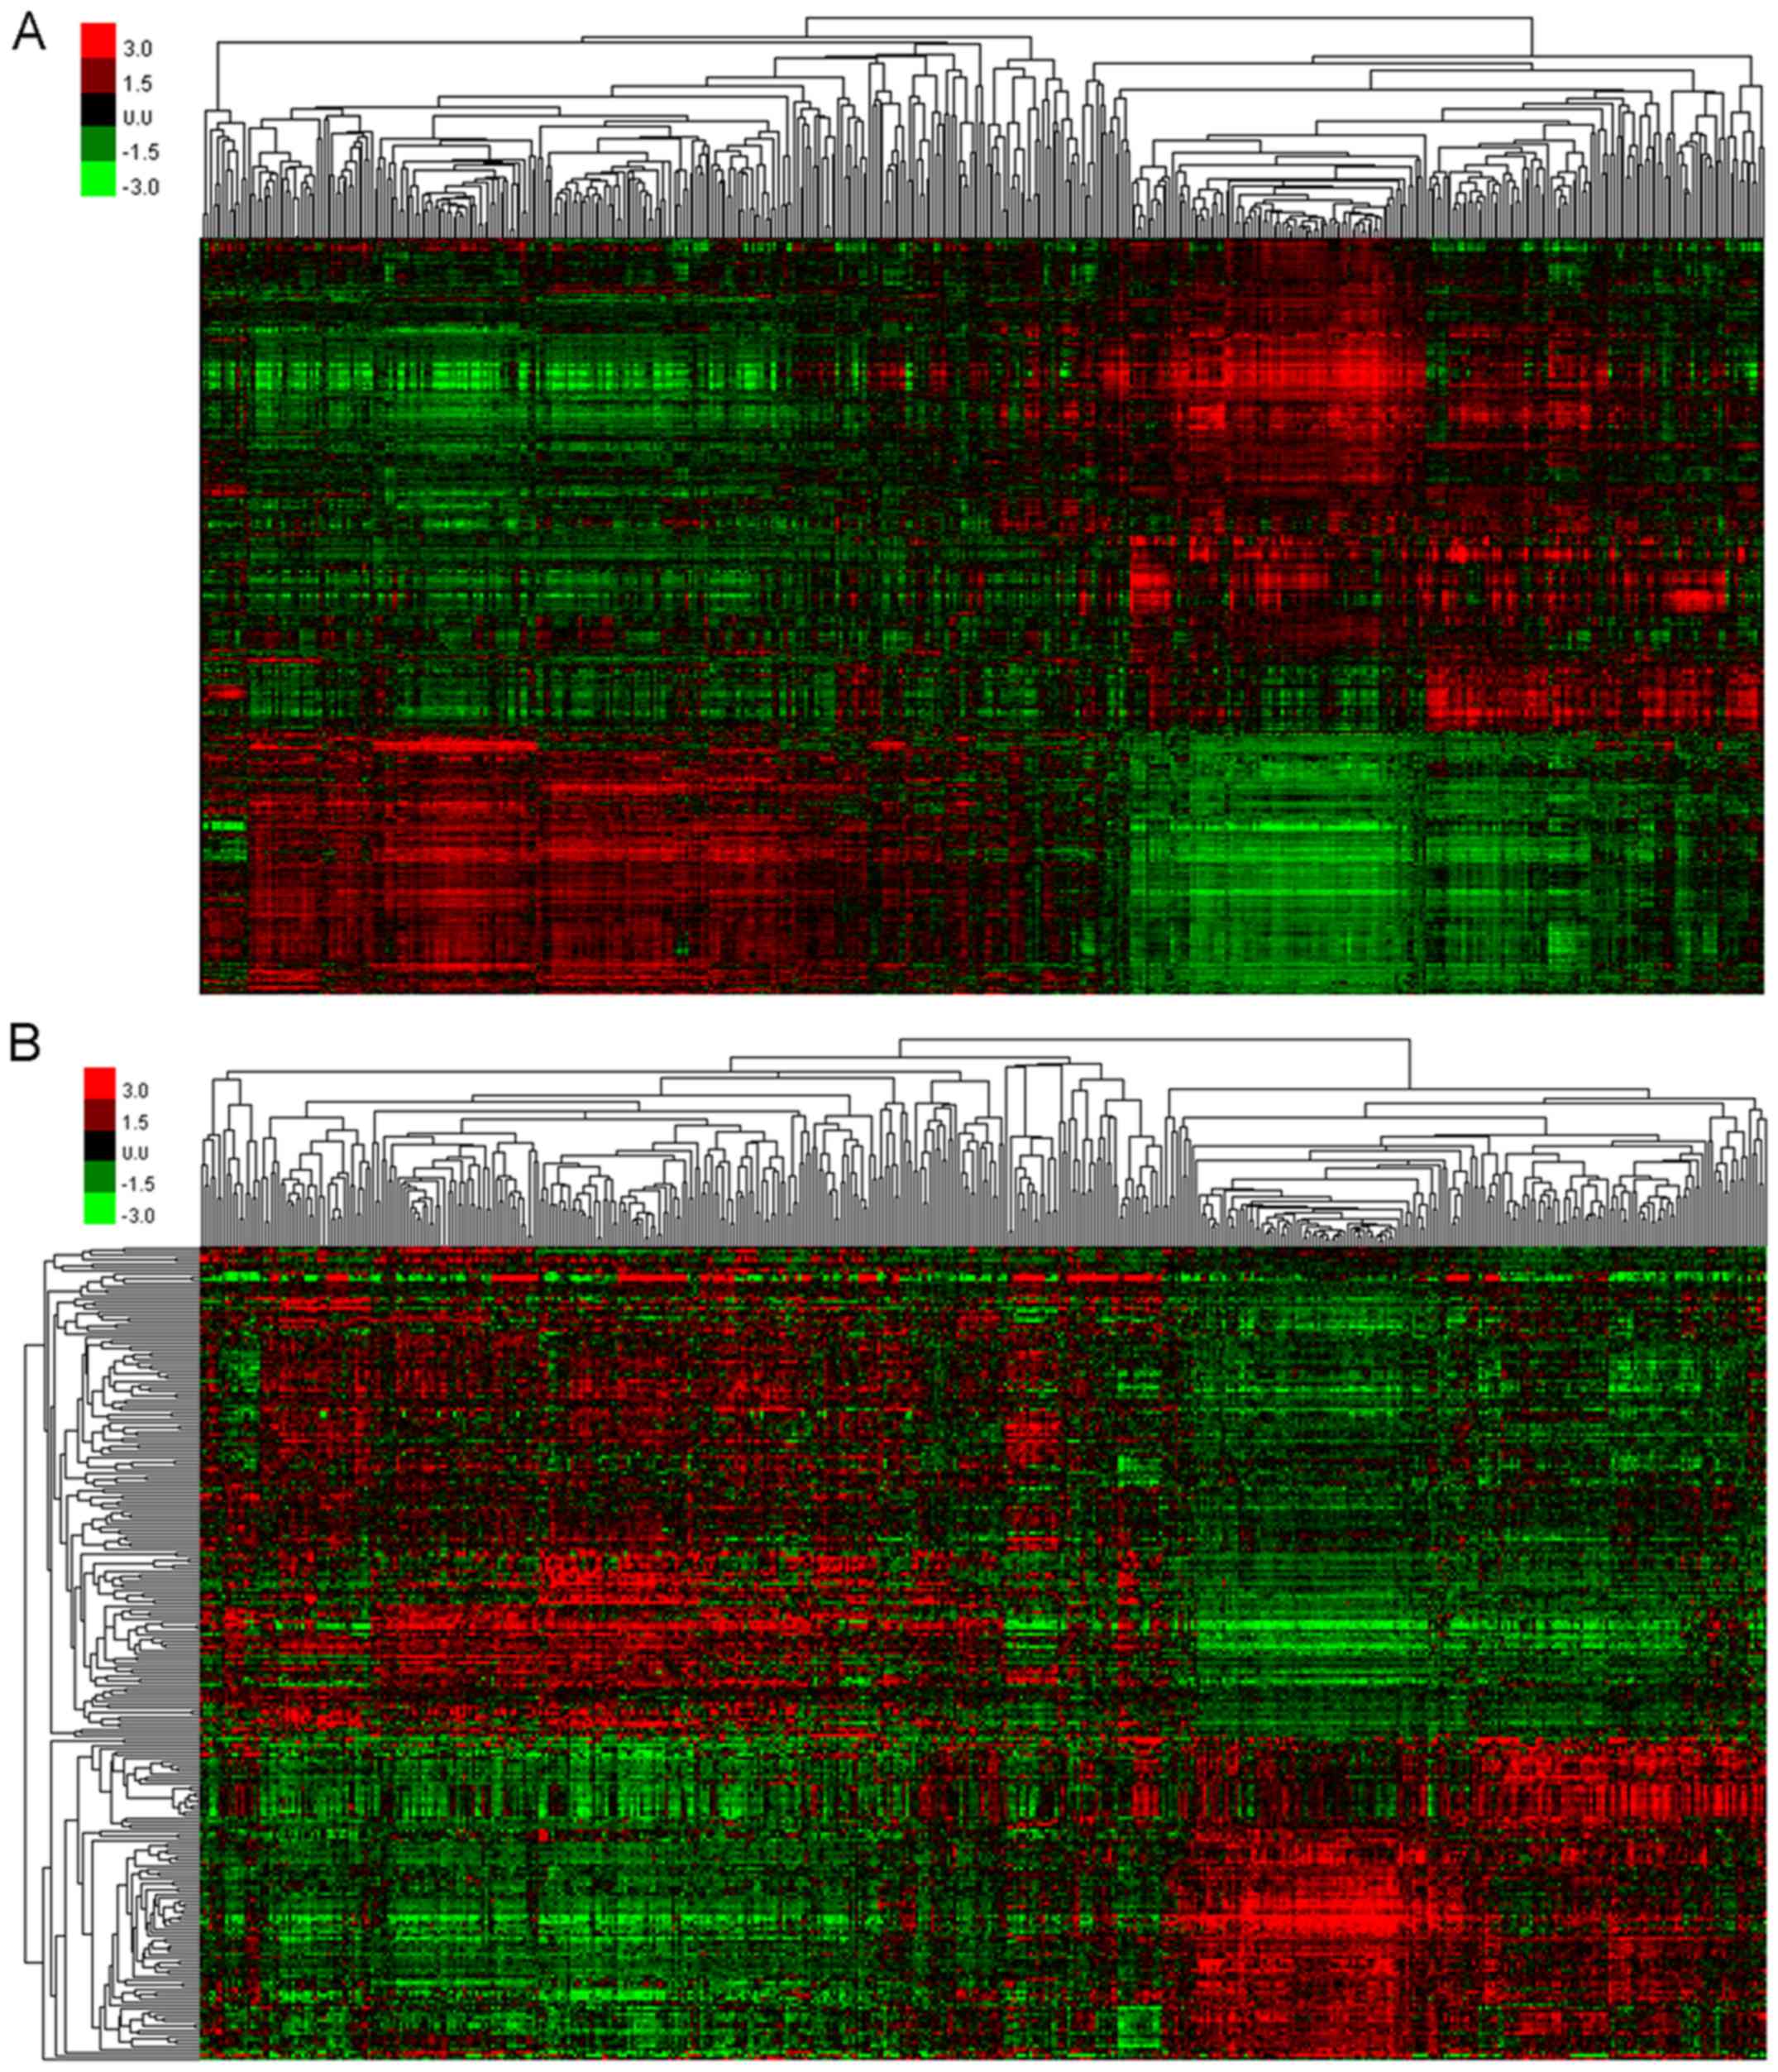
According to the Venn diagram, the overlapping DEGs
were clustered (Fig. 2A) to screen
for gene profiles with significant variations. A total of eight
significantly different profiles were identified, including five
upregulated (Profiles 17, 23, 24, 25 and 26) and three
downregulated (Profiles 1, 2 and 10) profiles. DEGs included in
each of these profiles exhibited a similar tendency to change
compared with other DEGs. Furthermore, overlapping DELs were
similarly clustered (Fig. 2B) to
select those that showed significant variation, and a total of
eight profiles were identified, including four upregulated profiles
(Profiles 23, 24, 25 and 26) and four downregulated profiles
(Profiles 1, 2, 3 and 10). In addition, DELs included in each
profile exhibited a similar tendency to change compared with other
DELs. Among these profiles, Profile 26 exhibited a continuous
increase over time, whereas Profile 1 exhibited a continuous
decrease.
Enrichment analyses of DEGs
Upregulated DEG profiles were significantly enriched
in 1,825 GO terms, such as small molecule metabolic process
(P=4.64×10−67), signal transduction
(P=7.44×10−65), innate immune response
(P=1.95×10−63), blood coagulation
(P=3.41×10−62) and immune response
(P=9.61×10−59). Downregulated DEG profiles were enriched
in 196 GO terms, such as transcription DNA-dependent
(P=2.32×10−49), regulation of transcription,
DNA-dependent (P=1.36×10−43), negative regulation of
transcription from RNA polymerase II promoter
(P=3.65×10⁻²⁵), positive regulation of transcription
from RNA polymerase II promoter (P=2.48×10⁻²²) and
positive regulation of transcription, DNA-dependent
(P=1.54×10⁻¹⁹; Table
I).
 | Table I.The top 10 enriched GO terms of
upregulated and downregulated DEG profiles. |
Table I.
The top 10 enriched GO terms of
upregulated and downregulated DEG profiles.
| A, Upregulated
DEGs |
|---|
|
|---|
| GO term | Gene count | P-value | Genes |
|---|
| Small molecule
metabolic process | 171 |
4.64×10−67 | SAR1B, MARCKS,
MGST1, PAPSS2, NMNAT3 … |
| Signal
transduction | 147 |
7.44×10−65 | TNFSF14, INPP4B,
TNFRSF10C, TNFSF13B, CSF3R … |
| Innate immune
response | 110 |
1.95×10−63 | CTSS, FGR,
KIR2DS5, CLEC7A, CFP … |
| Blood
coagulation | 101 |
3.41×10−62 | TUBA4A, CFL1,
ABCC4, ATP2B1, THBS1 … |
| Immune
response | 87 |
9.61×10−59 | GZMA, IL18,
FCAR, SLC11A1, CEBPB … |
| Inflammatory
response | 75 |
1.46×10−51 | SELP, IL18,
ANXA1, F2RL1, AOAH … |
| Platelet
activation | 57 |
7.95×10−42 | PLA2G4A, COL3A1,
TIMP1, MAPK14, ITGB3 … |
| Cell adhesion | 75 |
1.60×10−37 | MPZL3, CX3CR1,
FPR2, CD300A, GPNMB … |
| Platelet
degranulation | 34 |
3.64×10⁻³² | PPBP, CFL1,
CD36, FN1, TUBA4A … |
| Negative regulation
of apoptotic process | 71 |
3.83×10⁻³² | ITGAV, SFRP1,
MPO, CD59, TIMP1 … |
|
| B, Downregulated
DEGs |
|
| GO term | Gene
count | P-value | Genes |
|
| Transcription,
DNA-dependent | 121 |
2.32×10−49 | FHIT, TCEA2,
KANK2, CHD6, ZNF165 … |
| Regulation of
transcription, | 97 |
1.36×10−43 | PHB, ZNF610,
PDE8B, BMP2, KLF8 … |
| DNA-dependent |
| Negative regulation
of transcription from | 47 |
3.65×10⁻²⁵ | HEY2, CRY1, WT1,
LPIN1, BMP2 … |
| RNA polymerase II
promoter |
| Positive regulation
of transcription from | 51 |
2.48×10⁻²² | CIITA, FOXO1,
TP53BP1, DDX5, HEY2 … |
| RNA polymerase II
promoter |
| Positive regulation
of transcription, | 40 |
1.54×10⁻¹⁹ | EBF1, MED17,
SOX7, IRF7, SOX4 … |
| DNA-dependent |
| Negative regulation
of transcription, | 35 |
1.12×10⁻¹⁶ | PTPRK, ZNF423,
SMARCA4, FOXO1, IFI16 … |
| DNA-dependent |
| Cell adhesion | 31 |
3.18×10⁻¹³ | PRKD2, ADA,
NID2, PNN, FAT1 … |
| Apoptotic
process | 35 |
9.38×10⁻¹² | TIAM1, CASP7,
CASP7, BMF, KANK2 … |
| Nervous system
development | 23 |
1.54×10⁻¹¹ | NRN1, ARHGEF7,
SEMA6A, NOG, DPYSL2 … |
| Antigen processing
and presentation of peptide or polysaccharide antigen via MHC class
II | 7 |
2.61×10⁻¹¹ | HLA-DMB,
HLA-DPA1, HLA-DQB1, HLA-DPB1, HLA-DMA … |
KEGG enrichment analysis revealed that upregulated
DEG profiles were significantly enriched in 166 KEGG pathways,
including metabolic pathways (P=1.10×10−43),
cytokine-cytokine receptor interaction (P=5.71×10⁻³¹),
osteoclast differentiation (P=4.96×10⁻³⁰), phagosome
(P=1.69×10⁻²⁹) and lysosome (P=1.72×10⁻²⁷).
Downregulated DEGs were significantly enriched in 90 KEGG terms,
such as pathways in cancer (P=2.33×10⁻¹²), systemic
lupus erythematous (P=8.32×10⁻¹²), cell adhesion
molecules (CAMs) (P=2.29×10⁻¹⁰), aldosterone synthesis
and secretion (P=2.34×10⁻⁹) and HTLV-1 infection
(P=5.94×10⁻⁹; Table II).
Profile 26, which exhibited continuous increase, was significantly
enriched in the following GO terms: Signal transduction
(P=9.64×10⁻²⁵), small molecule metabolic process
(P=2.58×10⁻²²), blood coagulation
(P=2.73×10⁻²¹), etc.; and the following KEGG pathways:
Metabolic pathways (P=3.33×10⁻¹⁸), lysosome
(P=6.37×10⁻¹⁷), TNF signaling pathway
(P=3.27×10⁻¹¹), etc. (Table
III). The continuously decreasing Profile 1 was significantly
enriched in the following GO terms: Transcription DNA-dependent
(P=1.74×10⁻²⁸), regulation of transcription,
DNA-dependent (P=8.48×10⁻²⁰), negative regulation of
transcription from RNA polymerase II promoter
(P=1.34×10⁻¹⁷), etc.; and the following KEGG pathways:
cGMP-PKG signaling pathway (P=1.88×10⁻⁷), Rap1 signaling
pathway (P=1.65×10⁻⁶), glutamatergic synapse
(P=1.69×10⁻⁵), etc. (Table
III).
| Table II.The top 10 enriched KEGG pathways of
upregulated and downregulated DEG profiles. |
Table II.
The top 10 enriched KEGG pathways of
upregulated and downregulated DEG profiles.
| A, Upregulated
DEGs |
|---|
|
|---|
| KEGG pathway | Gene count | P-value | Genes |
|---|
| Metabolic
pathways | 132 |
1.10×10−43 | CES1, B3GALNT1,
NMNAT3, NNMT, GALNT6 … |
| Cytokine-cytokine
receptor interaction | 53 |
5.71×10⁻³¹ | CCR1, XCL1,
CXCL10, PF4, IL15 … |
| Osteoclast
differentiation | 39 |
4.96×10⁻³⁰ | NCF2, FCGR1A,
SIRPB1, FCGR2A, MAP2K6 … |
| Phagosome | 41 |
1.69×10⁻²⁹ | CYBB, ACTB,
ITGB5, FCAR, FCGR1A … |
| Lysosome | 36 |
1.72×10⁻²⁷ | ARSB, PPT1,
CTSC, CD63, CLTCL1 … |
| Hematopoietic cell
lineage | 29 |
3.94×10⁻²⁴ | GP1BB, ITGA2B,
CD3E, IL1R1, CD33 … |
| TNF signaling
pathway | 31 |
3.10×10⁻²³ | CEBPB, JAG1,
VCAM1, NOD2, CREB5 … |
| Natural killer cell
mediated cytotoxicity | 33 |
1.26×10⁻²² | PRF1, KIR2DS5,
FCGR3B, TYROBP, CD244 … |
| Chemokine signaling
pathway | 37 |
1.08×10⁻²¹ | PIK3CB, PAK1,
PRKCD, STAT3, CXCL10 … |
| Tuberculosis | 35 |
1.47×10⁻²⁰ | VDR, TLR2,
FCGR2B, MAPK1, CD14 … |
|
| B, Downregulated
DEGs |
|
| KEGG
pathway | Gene
count | P-value | Genes |
|
| Pathways in
cancer | 28 |
2.33×10⁻¹² | ADCY9, GNA11,
FZD8, GNAI1, GNAS … |
| Systemic lupus
erythematous | 17 |
8.32×10⁻¹² | HIST1H2AD,
HIST1H2BG, HIST1H2AE, HIST1H2BF, HIST2H4A … |
| Cell adhesion
molecules (CAMs) | 16 |
2.29×10⁻¹⁰ | SDC2, CD22,
HLA-DMB, MPZL1, HLA-DPA1 … |
| Aldosterone
synthesis and secretion | 12 |
2.34×10−09 | CAMK1D, KCNK3,
PRKCE, GNAS, ADCY6 … |
| HTLV-I
infection | 19 |
5.94×10−09 | HLA-DRB1, TCF3,
HLA-DOA, HLA-DQB1, HLA-DPB1 … |
| Transcriptional
misregulation in cancer | 16 |
7.25×10−09 | FOXO1, MEF2C,
WT1, SUPT3H, MDM2 … |
| Asthma | 8 |
1.31×10−08 | HLA-DQA1,
HLA-DPB1, HLA-DPA1, HLA-DMB, HLA-DRB1 … |
| Toxoplasmosis | 13 |
1.90×10−08 | HLA-DMB,
HLA-DPB1, HLA-DRB1, PIK3R3, HLA-DMA … |
| cGMP-PKG signaling
pathway | 15 |
2.17×10−08 | ADCY6, KCNMB4,
GNAI1, MEF2C, MEF2D … |
| Intestinal immune
network for IgA production | 9 |
3.21×10−08 | HLA-DQA1,
HLA-DMA, HLA-DMB, HLA-DQB1, HLA-DPB1 … |
| Table III.Top 5 GO and KEGG enrichment analyses
results of Profile 26 and Profile 1. |
Table III.
Top 5 GO and KEGG enrichment analyses
results of Profile 26 and Profile 1.
| A, GO term |
|---|
|
|---|
| Profile | Gene count | P-value | Genes |
|---|
| Profile 26 |
| Signal
transduction | 52 |
9.64×10⁻²⁵ | ALCAM, CAP1,
C5AR1, TANK, CXCL1 … |
| Small
molecule metabolic process | 56 |
2.58×10⁻²² | NAMPT, PDK3,
HAL, GPI, ARSG … |
| Blood
coagulation | 34 |
2.73×10⁻²¹ | ITPR2, JAK2,
ACTN1, VEGFA, P2RY1 … |
|
Inflammatory response | 25 |
2.41×10⁻¹⁷ | TLR8, TNFAIP6,
CXCR2, IL18, KIT … |
| Innate
immune response | 31 |
3.59×10⁻¹⁶ | KIT, CLEC7A,
EREG, DEFA4, CAPZA2 … |
| Profile 1 |
|
Transcription,
DNA-dependent | 61 |
1.74×10⁻²⁸ | KANK2, DIDO1,
ZNF251, ZBTB10, PATZ1 … |
|
Regulation of transcription,
DNA-dependent | 43 |
8.48×10⁻²⁰ | ZNF555, ZIK1,
PATZ1, ZBTB10, ZNF514 … |
|
Negative regulation of
transcription from | 27 |
1.34×10⁻¹⁷ | SORBS3, ZNF8,
YBX3, KDM2B, ID3 … |
| RNA
Polymerase II promoter |
|
Positive regulation of
transcription, | 23 |
6.16×10⁻¹⁴ | GLI3, ZNF423,
KAT6B, IRF, PHB … |
|
DNA-dependent |
| Negative regulation
of transcription, | 21 |
7.95×10⁻¹³ | HIC2, MAGED1,
BRD7, KAT6B, RASD1 … |
| DNA-dependent |
|
| B, KEGG
pathways |
|
| Profile | Gene
count | P-value | Genes |
|
| Profile 26 |
|
Metabolic pathways | 48 |
3.33×10⁻¹⁸ | AGL, GALNT3,
B3GNT5, ALDH2, SCP2 … |
|
Lysosome | 18 |
6.37×10⁻¹⁷ | CTSG, PPT1,
CD164, CTSS, IGF2R … |
| TNF
signaling pathway | 13 |
3.27×10⁻¹¹ | PTGS2, CREB5,
MAP3K5, CXCL5, MLKL … |
|
Phagosome | 14 |
1.72×10⁻¹⁰ | CTSS, FCAR,
CLEC7A, MPO, TUBA4A … |
|
Cytokine-cytokine receptor
interaction | 17 |
4.12×10⁻¹⁰ | IL17RA, CSF2RA,
CSF3R, CXCL3, TNFSF13B … |
| Profile 1 |
|
cGMP-PKG signaling
pathway | 10 |
1.88×10−07 | MEF2D, MEF2C,
GNA12, ADCY9, PIK3R3 … |
| Rap1
signaling pathway | 10 |
1.65×10−06 | PARD3, PIK3R3,
FLT4, MLLT4, MAGI2 … |
|
Glutamatergic synapse | 7 |
1.69×10−05 | GNG7, CACNA1A,
ADCY9, SHANK3, PPP3CC … |
| Purine
metabolism | 8 |
3.25×10−05 | ADCY6, NPR1,
ADPRM, NUDT5, PDE8B … |
|
Pathways in cancer | 11 |
7.73×10−05 | LAMC1, PIK3R3,
GLI3, BCR, ADCY6 … |
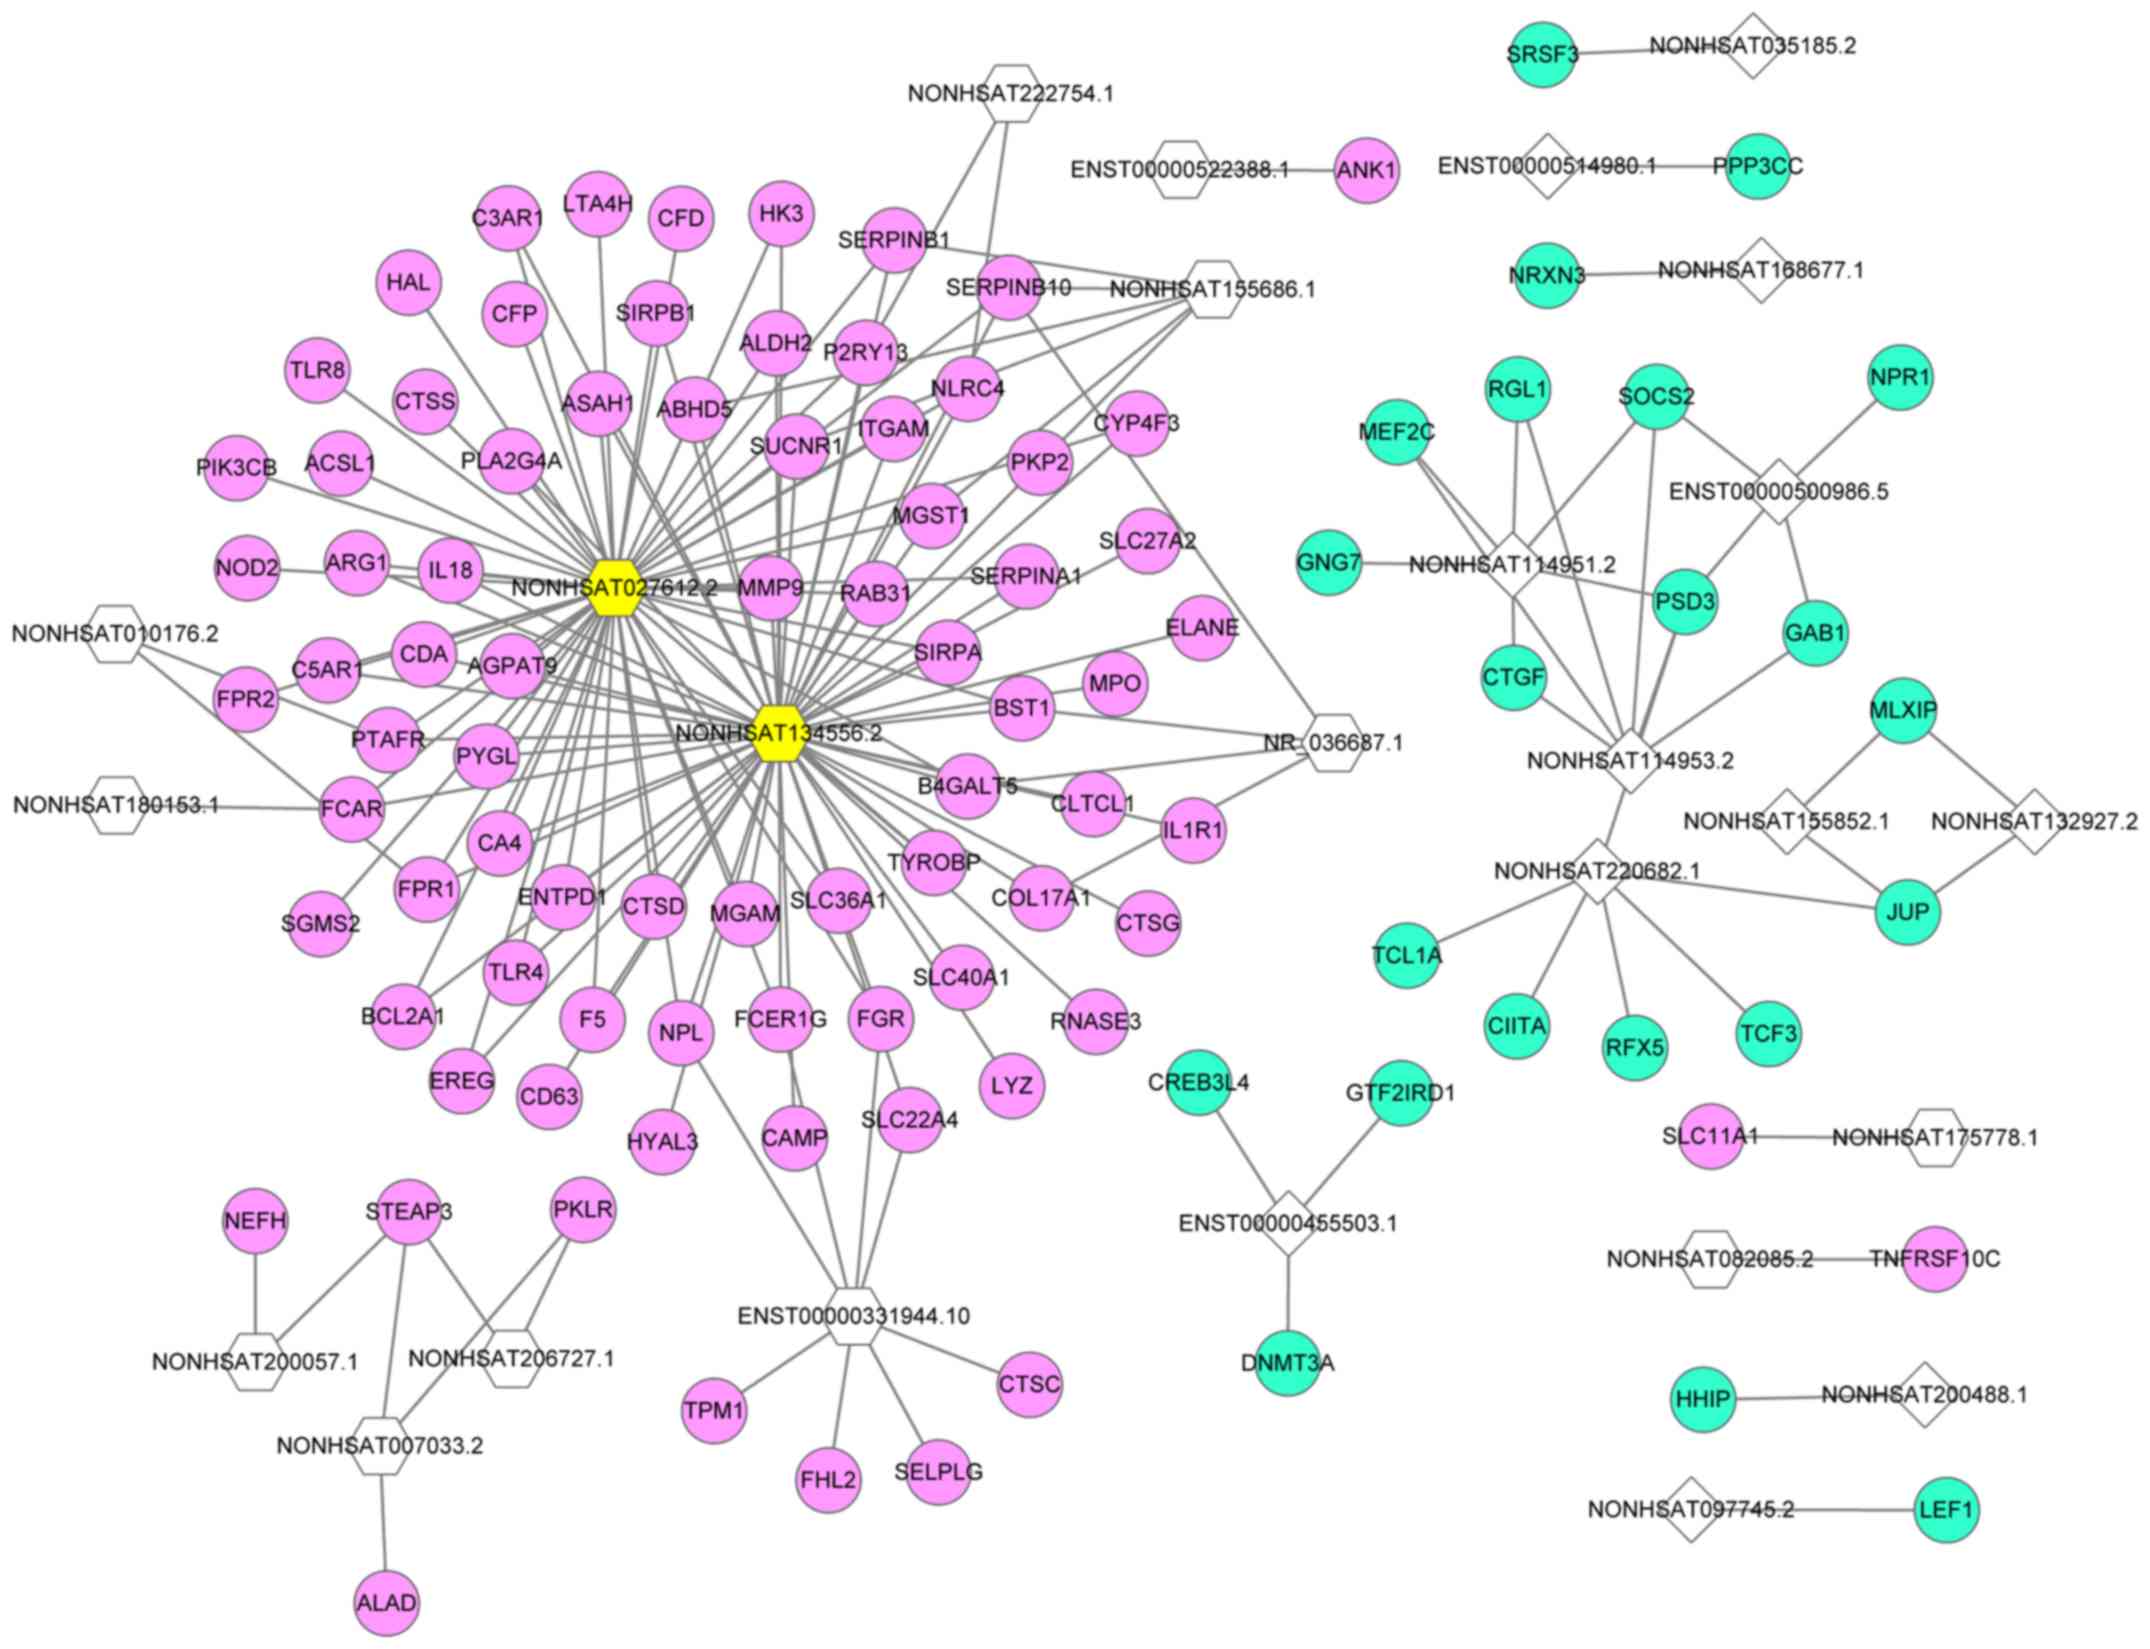
LncRNA-mRNA network
A lncRNA-mRNA network of overlapping lncRNAs and
mRNAs was constructed based on the calculation of dynamic
simulations (Fig. 3). This network
comprised 26 lncRNAs and 103 mRNAs with 179 interaction pairs.
NONHSAT134556.2 was the lncRNA with the highest regulatory
capability (degree=58), followed by NONHSAT027612.2 (degree=54).
The top five target DEGs of lncRNAs were pleckstrin and Sec7 domain
containing 3 (degree=4), serpin family B member 10 (degree=4),
STEAP3 metalloreductase (degree=3), succinate receptor 1 (degree=3)
and microsomal glutathione S-transferase 1 (degree=3).
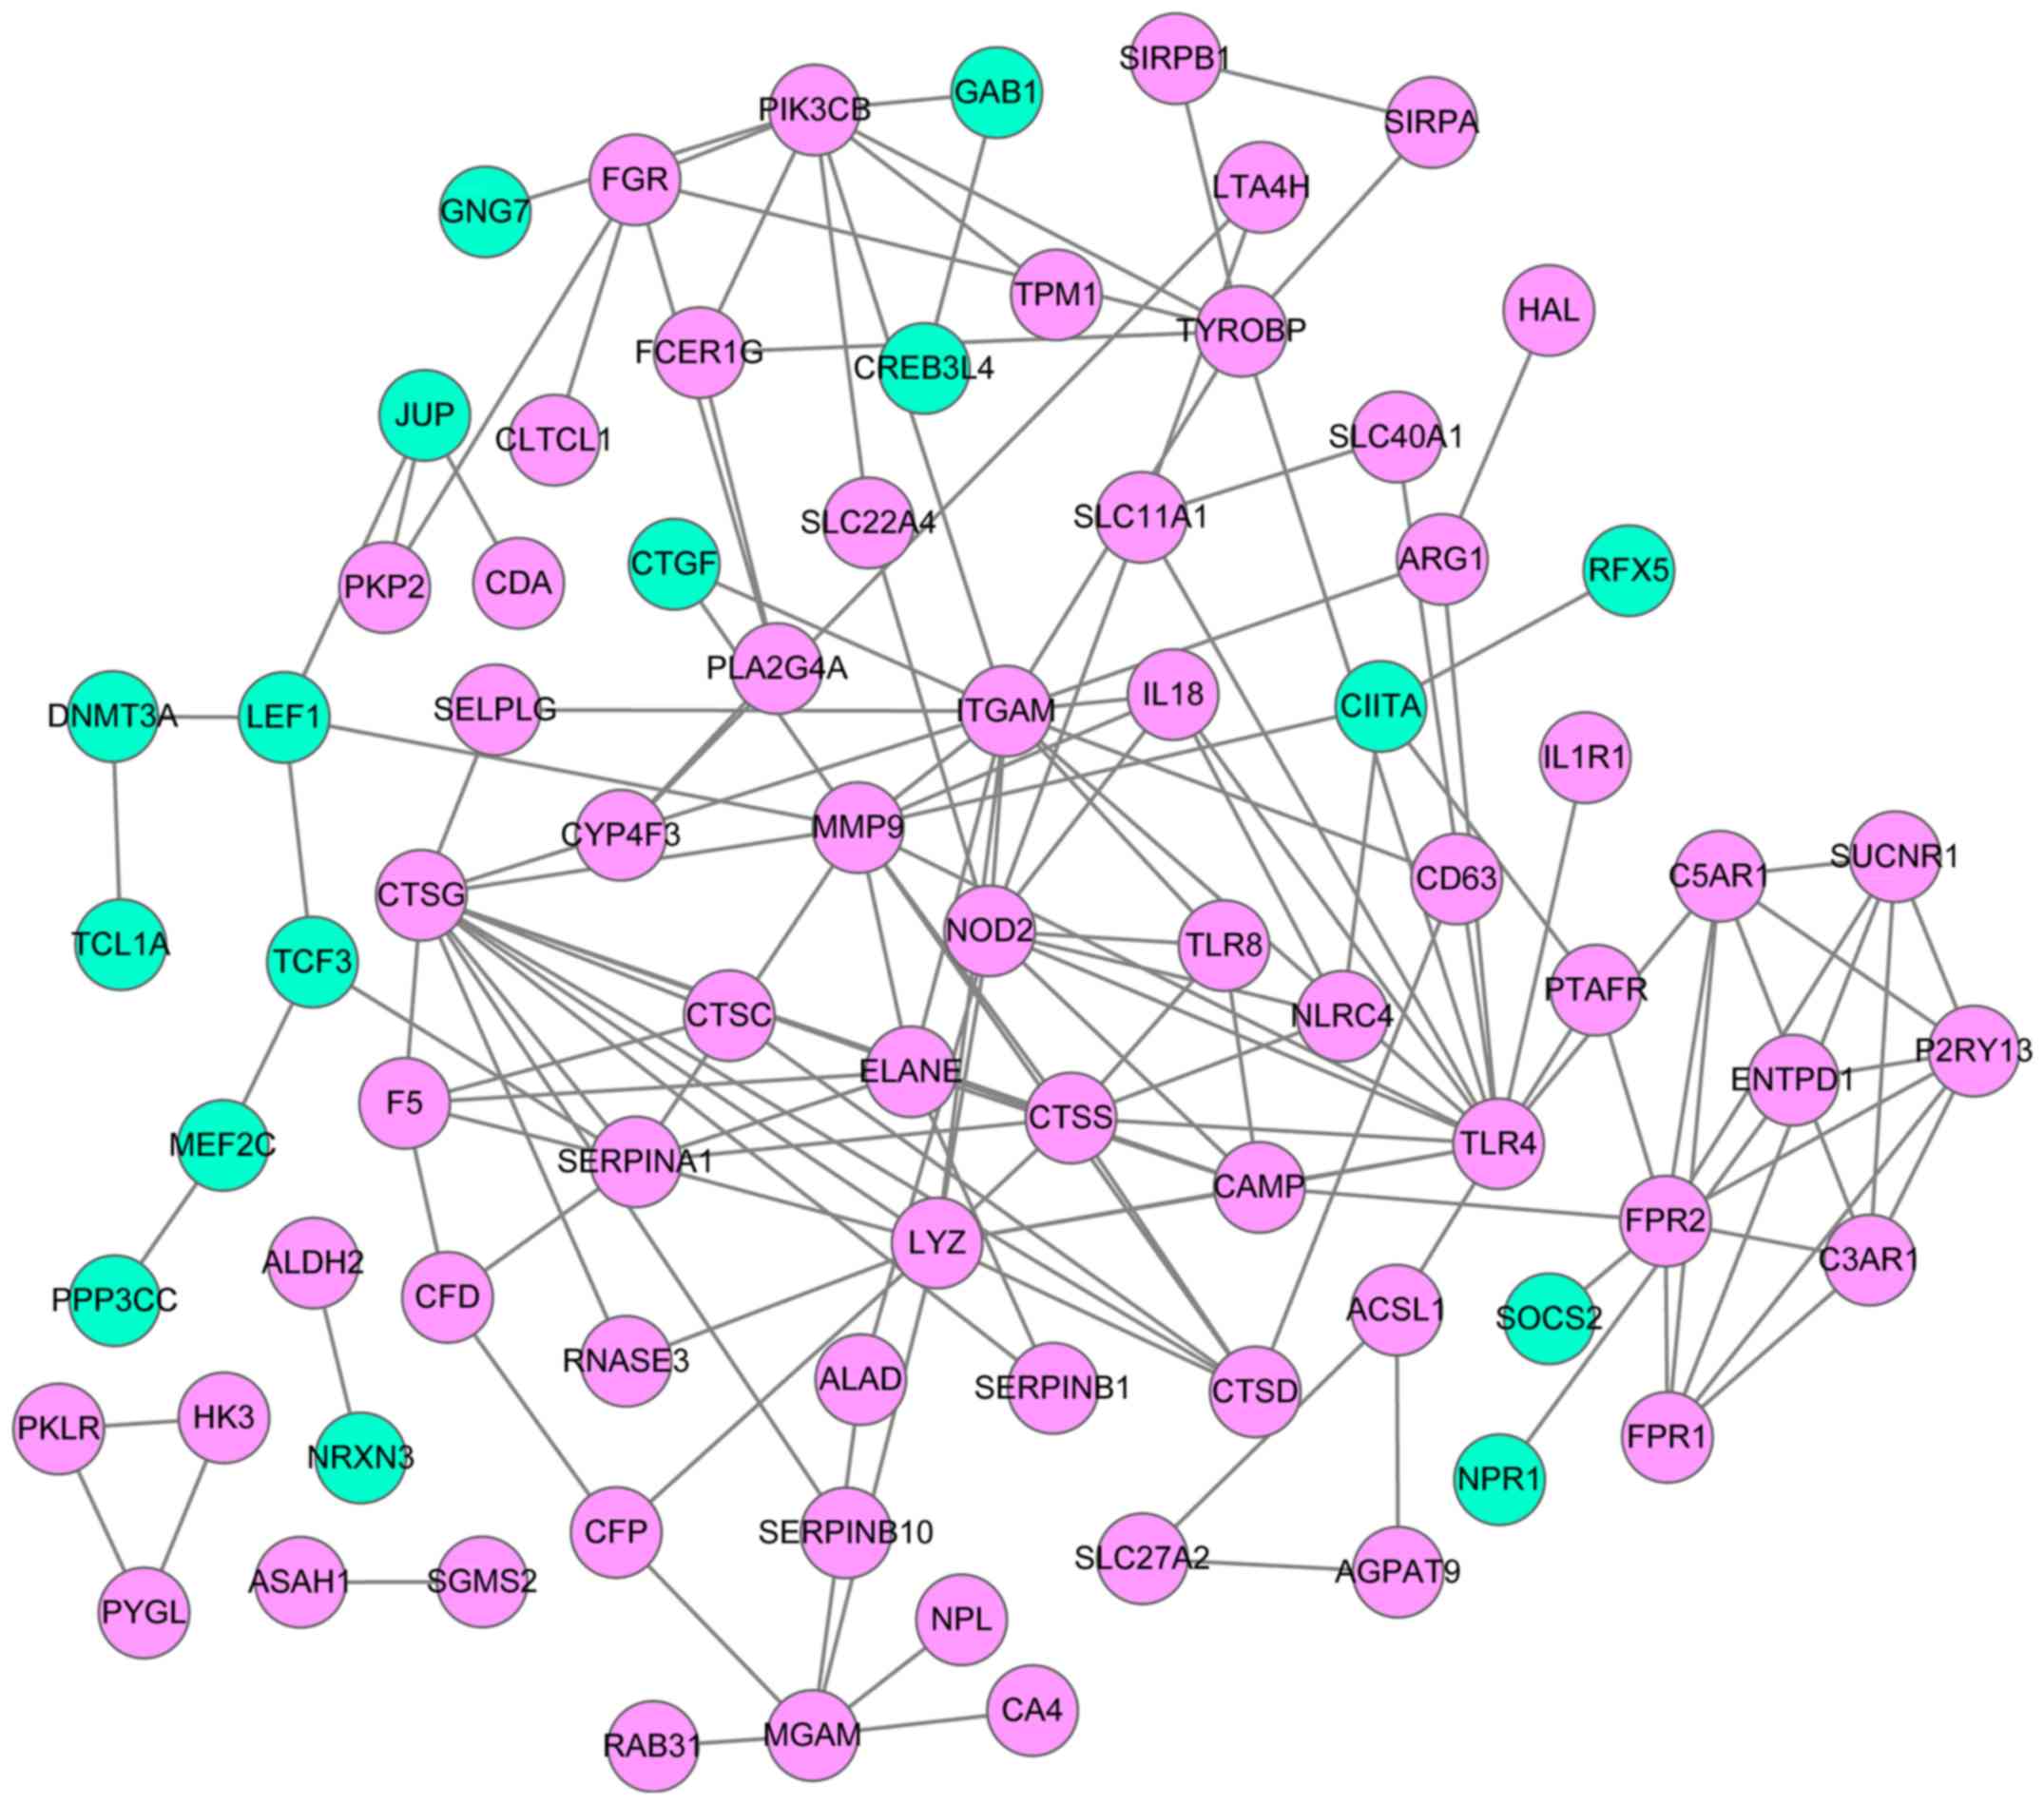
PPI network
Based on the lncRNA-mRNA network, mRNAs were
selected to construct a PPI network using the STRING database
(Fig. 4). This network comprised 80
mRNA-coded proteins and 147 interaction pairs. The top 10 hub nodes
of this network were Toll-like receptor 4 (TLR4)
(degree=15), integrin subunit αM (degree=14), cathepsin G
(CTSG) (degree=13), lysozyme (degree=11), matrix
metallopeptidase 9 (MMP9) (degree=11), nucleotide-binding
oligomerization domain-containing 2 (NOD2) (degree=10),
cathepsin S (CTSS) (degree=8), formyl peptide receptor 1
(FPR1) (degree=8), phosphatidylinositol-4,5-bisphosphate
3-kinase catalytic subunit β (degree=8) and serpin family A member
1 (degree=8).
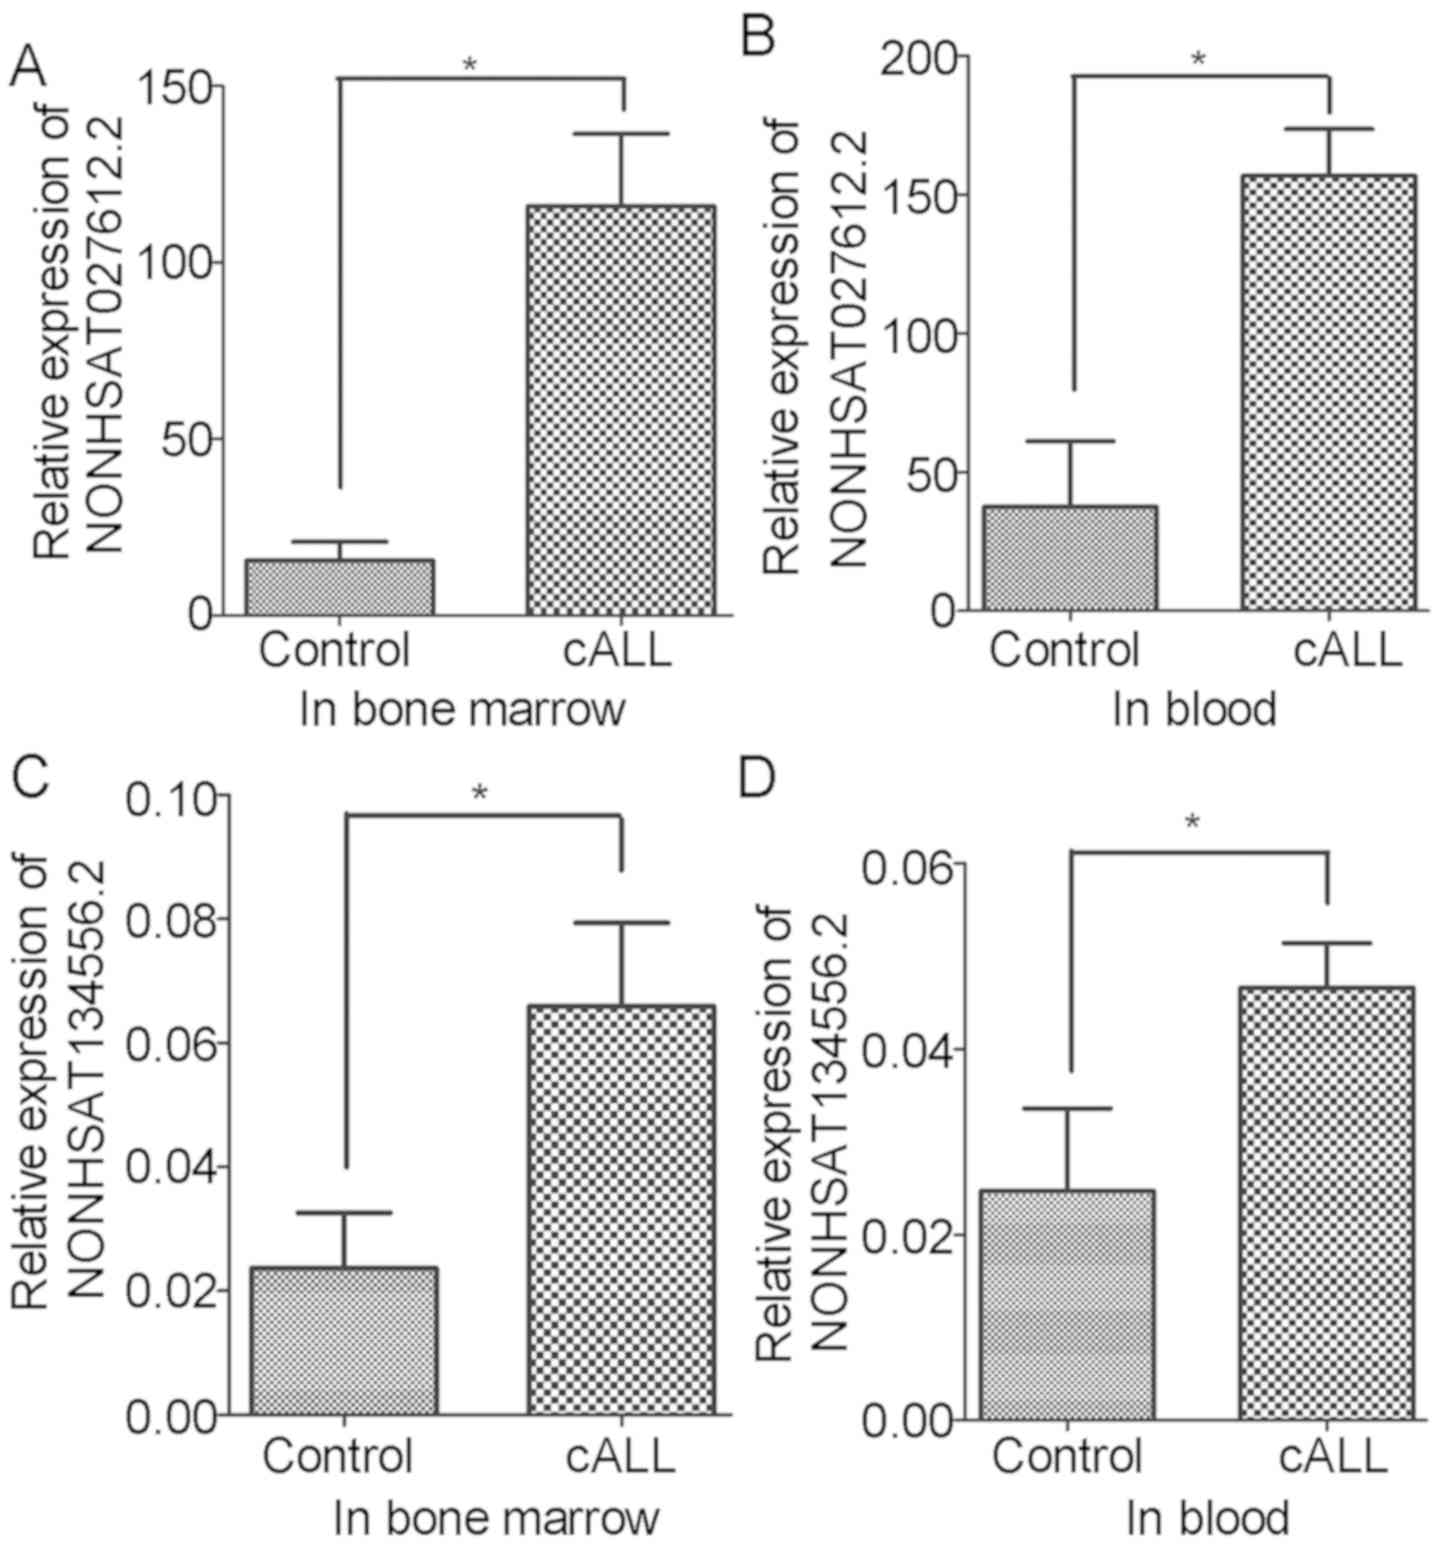
Validation of DELs
To confirm the present findings, variations in the
expression levels of NONHSAT027612.2 and NONHSAT134556.2 were
verified in the blood and bone marrow of patients with cALL. The
results revealed that the expression levels of NONHSAT027612.2 and
NONHSAT134556.2 were significantly increased in blood and bone
marrow samples of patients with cALL compared with in the control
samples (Fig. 5). These verifications
were consistent with the results obtained from bioinformatics
analysis.
Discussion
In the current study, the gene dataset GSE67684 was
re-analyzed, and 593 DEGs and 21 DELs were identified that varied
over time post-diagnosis of cALL. Among the clustered DEGs, Profile
26 presented a tendency to increase across all time points, whereas
Profile 1 tended to decrease over the same interval. GO enrichment
analysis revealed that Profiles 26 and 1 were significantly
enriched in immune response (GO:0006955, immune response;
GO:0045087, innate immune response) and proliferation-associated
biological (GO:0050680, negative regulation of epithelial cell
proliferation) processes, respectively. In addition, the lncRNAs
NONHSAT027612.2 and NONHSAT134556.2 were revealed to be
significantly upregulated in cALL and could regulate most
upregulated DEGs identified in this study.
Previous studies have reported that lncRNAs exhibit
a wide array of regulatory effects on gene expression (21,22). The
lncRNAs NONHSAT027612.2 and NONHSAT134556.2, which are newly
identified lncRNAs, are located on chromosomes 12 and 9,
respectively. At present, to the best of our knowledge, only
sequencing of their expression levels in tissues has been reported
(http://www.noncode.org/). In the present study,
the lncRNAs NONHSAT027612.2 and NONHSAT134556.2 were significantly
elevated in cALL samples compared with in control blood and bone
marrow samples. Further analysis demonstrated that NONHSAT027612.2
directly upregulated the expression levels of TLR4 and its
regulator, NOD2. In addition, NONHSAT134556.2 directly
upregulated the expression of TLR4. TLR4 and
NOD2 are key genes involved in innate immunity (23); they were both identified in this study
and are expected to interact with each other. Previous studies have
demonstrated that TLR4 promotes B-cell maturation (24), and that TLR4 polymorphisms are
associated with neutropenia development in cALL (25). He et al also reported that TLR4
signaling promotes immune-escape evasion in human pulmonary cancer
cells by inducing apoptosis resistance and immunosuppressive
cytokine expression (26).
Furthermore, TLR4 stimulation induces delayed activation of the
nuclear factor-κB subunit Rel A (27), which is reported to serve a crucial
role in in vitro survival and clinical progression of
chronic lymphocytic leukemia (28).
Chronic lymphocytic leukemia cells are unresponsive to TLR4 and
TLR8 stimulation (29), which may
explain the upregulation of TLR4 and TLR8 in cALL
observed in the present study. Whether a feedback mechanism exists
between TLR4 and the response of chronic lymphocytic leukemia cells
requires further investigation. As important regulators of TLRs,
NOD2 polymorphisms are also associated with increased
relapse and mortality rates in patients with ALL who have undergone
hematopoietic stem-cell transplantation (30). NOD2 is an intracellular protein that
recognizes bacterial peptidoglycans. This protein is widely
expressed in cells, including B cells, in which interaction among
TLRs occurs (31). In the current
study, NOD2 was revealed to interact with TLR4 and
TLR8, and its expression was significantly enriched in the
innate immune response and TLR signaling pathways. Muzio et
al demonstrated that NOD2 and other TLR ligands, particularly
TLR1/2 and TLR6/2, induce the activation of chronic lymphocytic
leukemia cells via induction of IκB kinase phosphorylation and
elevation of the expression of cluster of differentiation (CD) 25
and CD86 (32). Furthermore, NOD2 is
functionally relevant in regulatory T cells and inhibits
Fas-mediated apoptosis in T cells (33). However, a deeper understanding of the
signal transduction and interaction between TLR4 and NOD2 in cALL
remains to be established.
CTSG and CTSS are genes coding for the
proteins cathepsin G and cathepsin S, which belong to the cathepsin
family (34), and are involved in the
immune response. CTSG and CTSS were revealed to be
upregulated by lncRNAs NONHSAT134556.2 and NONHSAT027612.2,
respectively. Chang et al reported that the expression of
CTSG is significantly downregulated, alongside interleukin-6
(IL-6), IL-8, IL-12 and B-cell lymphoma 2 in HT1080
cells via tilapia hepcidin 1–5, which is an antimicrobial peptide
that possesses potential anticancer activity (35). Zöller (36) suggested out that CTSG and
MMP9-activated transforming growth factor-β contribute to bone
resorption and niche preparation for cancer-initiating cells. Other
studies have suggested that CTSG is activated by various classes of
proteinases, such as MMPs or serine/cysteine proteinases, during
the development of human disease (37). These observations indicated that
CTSG serves a positive role in carcinogenesis. In agreement
with the present observations, CTSS expression is elevated
in pancreatic cancer and results in the production of γ2 peptide,
which is an important molecule involved in cell adhesion, migration
and metastasis during carcinogenesis (38,39).
CTSS is also involved in protumorigenic activities during
intestinal carcinogenesis (40).
Other studies have documented that CTSS has an important
role in the migration and invasion of gastric cancer cells via a
network of metastasis-associated proteins (41). Taken together, these findings
indicated that CTSG and CTSS may have important roles
in tumorigenesis and could serve as potential targets for tumor
treatment. However, the underlying mechanisms of CTSG and
CTSS in cALL remain unknown and warrant further
analysis.
Although this study revealed some interesting
results, it also presented some limitations. Firstly, the majority
of results were identified in silico; therefore, further
experimental validation is required. Secondly, the parameters used
were set manually; therefore, some genes may have been ignored due
to thresholds. Thirdly, although the study validated the findings,
the expression levels of NONHSAT134556.2 and NONHSAT134556.2 were
not consistent with their degree in the regulatory network;
therefore, a larger sample size will be required in further
studies. Finally, due to limited resources, not enough cALL samples
at Day 0 were collected; therefore blood samples from healthy
subjects were collected instead and used as controls in the present
study, which could induce a bias. Considering these limitations, we
aim to further confirm these findings using cALL samples collected
from patients at Day 0 as controls as soon as enough samples are
collected.
In conclusion, the expression levels of the lncRNAs
NONHSAT027612.2 and NONHSAT134556.2 were significantly increased in
patients with cALL, and may serve as potential regulators for the
pathogenesis of cALL. From these two lncRNAs, TLR4, NOD2,
CTSG and CTSS may be potential gene targets, and may
promote development of cALL via immune response-associated
biological processes.
Acknowledgements
Not applicable.
Funding
This study was supported by the National Natural
Science Foundation of China (grant nos. 30872804, 81170661 and
31640048 to GPZ) and Jiangsu Province Science and Education
Enhancing Health Project Innovation Team (Leading Talent) Program
(no. CXTDA2017018 to GPZ).
Availability of data and materials
All data generated or analyzed during this study are
included in this published article.
Authors' contributions
GZ and YF conceived and designed the study. SL and
HB performed the data analysis and wrote the manuscript. YC
identified the DEGs and DELs. CJ performed the GO analysis, KEGG
pathway analysis and PPI analysis. QC performed the RT-qPCR. All
authors read and approved the final manuscript.
Ethics approval and consent to
participate
The Clinical Research Ethics Committee of the First
Hospital of Nanjing Medical University approved this study.
Informed consent was obtained from the subjects' parents.
Patient consent for publication
Not applicable.
Competing interests
The authors declare that they have no competing
interests.
References
|
1
|
Roberts KG, Li Y, Payne-Turner D, Harvey
RC, Yang YL, Pei D, McCastlain K, Ding L, Lu C, Song G, et al:
Targetable kinase-activating lesions in Ph-like acute lymphoblastic
leukemia. N Engl J Med. 371:1005–1015. 2014. View Article : Google Scholar : PubMed/NCBI
|
|
2
|
Stock W: Adolescents and young adults with
acute lymphoblastic leukemia. Hematology Am Soc Hematol Educ
Program. 2010:21–29. 2010. View Article : Google Scholar : PubMed/NCBI
|
|
3
|
Hunger SP, Lu X, Devidas M, Camitta BM,
Gaynon PS, Winick NJ, Reaman GH and Carroll WL: Improved survival
for children and adolescents with acute lymphoblastic leukemia
between 1990 and 2005: A report from the children's oncology group.
J Clin Oncol. 30:1663–1669. 2012. View Article : Google Scholar : PubMed/NCBI
|
|
4
|
Hoelzer D: Treatment of acute
lymphoblastic leukemia. Semin Hematol. 31:1–15. 1994.PubMed/NCBI
|
|
5
|
Eapen M, Zhang MJ, Devidas M, Raetz E,
Barredo JC, Ritchey AK, Godder K, Grupp S, Lewis VA, Malloy K, et
al: Outcomes after HLA-matched sibling transplantation or
chemotherapy in children with acute lymphoblastic leukemia in a
second remission after an isolated central nervous system relapse:
A collaborative study of the Children's Oncology Group and the
center for international blood and marrow transplant research.
Leukemia. 22:281–286. 2008. View Article : Google Scholar : PubMed/NCBI
|
|
6
|
Liz J and Esteller M: lncRNAs and
microRNAs with a role in cancer development. Biochim Biophys Acta.
1859:169–176. 2016. View Article : Google Scholar : PubMed/NCBI
|
|
7
|
Zhou X, Ye F, Yin C, Zhuang Y, Yue G and
Zhang G: The Interaction between MiR-141 and lncRNA-H19 in
regulating cell proliferation and migration in gastric cancer. Cell
Physiol Biochem. 36:1440–1452. 2015. View Article : Google Scholar : PubMed/NCBI
|
|
8
|
Fang Z, Wu L, Wang L, Yang Y, Meng Y and
Yang H: Increased expression of the long non-coding RNA UCA1 in
tongue squamous cell carcinomas: A possible correlation with cancer
metastasis. Oral Surg Oral Med Oral Pathol Oral Radiol. 117:89–95.
2014. View Article : Google Scholar : PubMed/NCBI
|
|
9
|
Shi SJ, Wang LJ, Yu B, Li YH, Jin Y and
Bai XZ: LncRNA-ATB promotes trastuzumab resistance and
invasion-metastasis cascade in breast cancer. Oncotarget.
6:11652–11663. 2015. View Article : Google Scholar : PubMed/NCBI
|
|
10
|
Wang K, Long B, Zhou LY, Liu F, Zhou QY,
Liu CY, Fan YY and Li PF: CARL lncRNA inhibits anoxia-induced
mitochondrial fission and apoptosis in cardiomyocytes by impairing
miR-539-dependent PHB2 downregulation. Nat Commun. 5:35962014.
View Article : Google Scholar : PubMed/NCBI
|
|
11
|
Ding C, Yang Z, Lv Z, DU C, Xiao H, Peng
C, Cheng S, Xie H, Zhou L, Wu J and Zheng S: Long non-coding RNA
PVT1 Is associated with tumor progression and predicts recurrence
in hepatocellular carcinoma patients. Oncol Lett. 9:955–963. 2015.
View Article : Google Scholar : PubMed/NCBI
|
|
12
|
Fang K, Han BW, Chen ZH, Lin KY, Zeng CW,
Li XJ, Li JH, Luo XQ and Chen YQ: A distinct set of long non-coding
RNAs in childhood MLL-rearranged acute lymphoblastic leukemia:
Biology and epigenetic target. Hum Mol Genet. 23:3278–3288. 2014.
View Article : Google Scholar : PubMed/NCBI
|
|
13
|
Trimarchi T, Bilal E, Ntziachristos P,
Fabbri G, Dalla-Favera R, Tsirigos A and Aifantis I: Genome-wide
mapping and characterization of Notch-regulated long noncoding RNAs
in acute leukemia. Cell. 158:593–606. 2014. View Article : Google Scholar : PubMed/NCBI
|
|
14
|
Wang Y, Wu P, Lin R, Rong L, Xue Y and
Fang Y: LncRNA NALT interaction with NOTCH1 promoted cell
proliferation in pediatric T cell acute lymphoblastic leukemia. Sci
Rep. 5:137492015. View Article : Google Scholar : PubMed/NCBI
|
|
15
|
Yeoh A, Li ZH, Dong DF, Lu Y, Jiang N,
Trka J, Tan AM, Lin HP, Quah TC, Ariffin H and Wong L: Effective
response metric: A novel tool to predict relapse in childhood acute
lymphoblastic leukaemia using time-series gene expression
profiling. Br J Haematol. 181:653–663. 2018. View Article : Google Scholar : PubMed/NCBI
|
|
16
|
Miao MH, Ji XQ, Zhang H, Xu J, Zhu H and
Shao XJ: miR-590 promotes cell proliferation and invasion in T-cell
acute lymphoblastic leukaemia by inhibiting RB1. Oncotarget.
7:39527–39534. 2016. View Article : Google Scholar : PubMed/NCBI
|
|
17
|
Miller LD, Long PM, Wong L, Mukherjee S,
Mcshane LM and Liu ET: Optimal gene expression analysis by
microarrays. Cancer Cell. 2:353–361. 2002. View Article : Google Scholar : PubMed/NCBI
|
|
18
|
Ramoni MF, Sebastiani P and Kohane IS:
Cluster analysis of gene expression dynamics. Proc Natl Acad Sci
USA. 99:9121–9126. 2002. View Article : Google Scholar : PubMed/NCBI
|
|
19
|
Wang CF, Zhao CC, Weng WJ, Lei J, Lin Y,
Mao Q, Gao GY, Feng JF and Jiang JY: Alteration in long non-coding
RNA expression after traumatic brain injury in rats. J Neurotrauma.
34:2100–2108. 2017. View Article : Google Scholar : PubMed/NCBI
|
|
20
|
Livak KJ and Schmittgen TD: Analysis of
relative gene expression data using real-time quantitative PCR and
the 2(-Delta Delta C(T)) method. Methods. 25:402–408. 2001.
View Article : Google Scholar : PubMed/NCBI
|
|
21
|
Monnier P, Martinet C, Pontis J, Stancheva
I, Ait-Si-Ali S and Dandolo L: H19 lncRNA controls gene expression
of the Imprinted Gene Network by recruiting MBD1. Proc Natl Acad
Sci USA. 110:20693–20698. 2013. View Article : Google Scholar : PubMed/NCBI
|
|
22
|
Nie L, Wu HJ, Hsu JM, Chang SS, Labaff AM,
Li CW, Wang Y, Hsu JL and Hung MC: Long non-coding RNAs: Versatile
master regulators of gene expression and crucial players in cancer.
Am J Transl Res. 4:127–150. 2012.PubMed/NCBI
|
|
23
|
Mrózek K, Radmacher MD, Bloomfield CD and
Marcucci G: Molecular signatures in acute myeloid leukemia. Curr
Opin Hematol. 16:64–69. 2009. View Article : Google Scholar : PubMed/NCBI
|
|
24
|
Hayashi EA, Akira S and Nobrega A: Role of
TLR in B cell development: Signaling through TLR4 promotes B cell
maturation and is inhibited by TLR2. J Immunol. 174:6639–6647.
2005. View Article : Google Scholar : PubMed/NCBI
|
|
25
|
Miedema KG, te Poele EM, Tissing WJ,
Postma DS, Koppelman GH, de Pagter AP, Kamps WA, Alizadeh BZ,
Boezen HM and de Bont ES: Association of polymorphisms in the TLR4
gene with the risk of developing neutropenia in children with
leukemia. Leukemia. 25:995–1000. 2011. View Article : Google Scholar : PubMed/NCBI
|
|
26
|
He W, Liu Q, Wang L, Chen W, Li N and Cao
X: TLR4 signaling promotes immune escape of human lung cancer cells
by inducing immunosuppressive cytokines and apoptosis resistance.
Mol Immunol. 44:2850–2859. 2007. View Article : Google Scholar : PubMed/NCBI
|
|
27
|
McGettrick AF and O'Neill LA: Toll-like
receptors: Key activators of leucocytes and regulator of
haematopoiesis. Br J Haematol. 139:185–193. 2007. View Article : Google Scholar : PubMed/NCBI
|
|
28
|
Hewamana S, Alghazal S, Lin TT, Clement M,
Jenkins C, Guzman ML, Jordan CT, Neelakantan S, Crooks PA, Burnett
AK, et al: The NF-kappaB subunit Rel A is associated with in vitro
survival and clinical disease progression in chronic lymphocytic
leukemia and represents a promising therapeutic target. Blood.
111:4681–4689. 2008. View Article : Google Scholar : PubMed/NCBI
|
|
29
|
Ntoufa S, Vardi A, Papakonstantinou N,
Anagnostopoulos A, Aleporou-Marinou V, Belessi C, Ghia P,
Caligaris-Cappio F, Muzio M and Stamatopoulos K: Distinct innate
immunity pathways to activation and tolerance in subgroups of
chronic lymphocytic leukemia with distinct immunoglobulin
receptors. Mol Med. 18:1281–1291. 2012. View Article : Google Scholar : PubMed/NCBI
|
|
30
|
Mayor NP, Shaw BE, Hughes DA,
Maldonado-Torres H, Madrigal JA, Keshav S and Marsh SG: Single
nucleotide polymorphisms in the NOD2/CARD15 gene are associated
with an increased risk of relapse and death for patients with acute
leukemia after hematopoietic stem-cell transplantation with
unrelated donors. J Clin Oncol. 25:4262–4269. 2007. View Article : Google Scholar : PubMed/NCBI
|
|
31
|
Muzio M, Fonte E and Caligaris-Cappio F:
Toll-like receptors in chronic lymphocytic leukemia. Mediterr J
Hematol Infect Dis. 4:e20120552012. View Article : Google Scholar : PubMed/NCBI
|
|
32
|
Muzio M, Scielzo C, Bertilaccio MT,
Frenquelli M, Ghia P and Caligaris-Cappio F: Expression and
function of toll like receptors in chronic lymphocytic leukaemia
cells. Br J Haematol. 144:507–516. 2009. View Article : Google Scholar : PubMed/NCBI
|
|
33
|
Rahman MK, Midtling EH, Svingen PA, Xiong
Y, Bell MP, Tung J, Smyrk T, Egan LJ and Faubion WA Jr: The
pathogen recognition receptor NOD2 regulates human
FOXP3+ T cell survival. J Immunol. 184:7247–7256. 2010.
View Article : Google Scholar : PubMed/NCBI
|
|
34
|
Gomes S, Marques PI, Matthiesen R and
Seixas S: Adaptive evolution and divergence of SERPINB3: A young
duplicate in great Apes. PLoS One. 9:e1049352014. View Article : Google Scholar : PubMed/NCBI
|
|
35
|
Chang WT, Pan CY, Rajanbabu V, Cheng CW
and Chen JY: Tilapia (Oreochromis mossambicus) antimicrobial
peptide, hepcidin 1–5, shows antitumor activity in cancer cells.
Peptides. 32:342–352. 2011. View Article : Google Scholar : PubMed/NCBI
|
|
36
|
Zöller M: CD44: Can a cancer-initiating
cell profit from an abundantly expressed molecule? Nat Rev Cancer.
11:254–267. 2011. View Article : Google Scholar : PubMed/NCBI
|
|
37
|
Korkmaz B, Horwitz MS, Jenne DE and
Gauthier F: Neutrophil elastase, proteinase 3 and cathepsin G as
therapeutic targets in human diseases. Pharmacol Rev. 62:726–759.
2010. View Article : Google Scholar : PubMed/NCBI
|
|
38
|
Gocheva V, Zeng W, Ke D, Klimstra D,
Reinheckel T, Peters C, Hanahan D and Joyce JA: Distinct roles for
cysteine cathepsin genes in multistage tumorigenesis. Genes Dev.
20:543–556. 2006. View Article : Google Scholar : PubMed/NCBI
|
|
39
|
Wang B, Sun J, Kitamoto S, Yang M, Grubb
A, Chapman HA, Kalluri R and Shi GP: Cathepsin S controls
angiogenesis and tumor growth via matrix-derived angiogenic
factors. J Biol Chem. 281:6020–6029. 2006. View Article : Google Scholar : PubMed/NCBI
|
|
40
|
Gounaris E, Tung CH, Restaino C, Maehr R,
Kohler R, Joyce JA, Ploegh HL, Barrett TA, Weissleder R and Khazaie
K: Live imaging of cysteine-cathepsin activity reveals dynamics of
focal inflammation, angiogenesis and polyp growth. PLoS One.
3:e29162008. View Article : Google Scholar : PubMed/NCBI
|
|
41
|
Yang Y, Lim SK, Choong LY, Lee H, Chen Y,
Chong PK, Ashktorab H, Wang TT, Salto-Tellez M, Yeoh KG and Lim YP:
Cathepsin S mediates gastric cancer cell migration and invasion via
a putative network of metastasis-associated proteins. J Proteome
Res. 9:4767–4778. 2010. View Article : Google Scholar : PubMed/NCBI
|