Introduction
Locally advanced rectal cancer (LARC) occurs in the
distal large intestine (1) and is
the fourth most common cause of mortality worldwide, with a ~30%
incidence rate (2). Preoperative
chemoradiotherapy (CRT) has been established as the standard
treatment for LARC (3). Of patients
with LARC, 12–15% undergo a complete response to long-term CRT
(4). Despite CRT improving the
efficiency of clinical treatment and decreasing toxicity, it does
not result in an improved survival rate for patients with LARC
(5). Furthermore, a number of
patients with LARC do not respond well to specific CRT regimes
(6). Thus, to understand the
heterogeneity of patient response to CRT, investigation of
predictive biomarkers in LARC is of considerable clinical
interest.
MicroRNAs (miRNAs, miRs) have emerged as crucial
factors in carcinogenesis (7). The
translational control by miRNA expression patterns of rectal cancer
can be used to predict responses to CRT (8). A previous study identified that miRNAs,
including miR-215 and miR-450b-5p, are involved in the response of
patients with LARC to preoperative CRT (9). Drebber et al (10) identified that high expression levels
of certain miRNAs, including onco-miRNA-21, were associated with
successful CRT, which further indicated an association between
miRNA expression and radioresistance and chemoresistance in LARC
(10). Furthermore, identifying the
target genes of miRNAs is key to understanding the disease and
identifying potential predictive biomarkers (11). In a study of colorectal cancer,
miR-338-5p was identified to induce cancer cell migration by
suppressing phosphoinositide 3-kinase subunit 3 (PIK3C3)
expression and autophagy (12).
Additionally, polymorphisms in miRNA-binding sites in nucleotide
excision repair genes have been associated with increased risk of
rectal cancer (13). However, the
potential association between miRNA expression in LARC and
sensitivity to CRT remains unclear.
The miRNA expression profile of LARC samples with
preoperative CRT was generated and made available in the Gene
Expression Omnibus (GEO) database (GSE98959) (14). This dataset was previously used to
identify differentially expressed miRNAs (DEMs) between responders
and non-responders to CRT, and an association between the DEMs and
c-MYC was revealed. miRNA-375 and c-MYC were
suggested to be promising predictive biomarkers of the response to
neoadjuvant treatment in patients with LARC (14). The aim of the present study was to
identify candidate genes and key mechanisms underlying CRT
sensitivity in patients with LARC, using the available miRNA
expression profile dataset to investigate DEMs between responders
and non-responders to CRT, and to subsequently perform a
comprehensive bioinformatics analysis, including function and
pathway enrichment analysis, and to conduct miRNA-target gene
regulation network and a protein-protein interaction (PPI) network
analysis.
Materials and methods
Microarray data
The miRNA expression profile GSE98959 dataset was
obtained from the GEO database (http://www.ncbi.nlm.nih.gov/geo). In total, samples
from 22 patients with LARC who had received preoperative
chemotherapy and radiotherapy were profiled using TaqMan OpenArray
human microRNA plates (14). Each
patient sample was profiled twice, initially in pool A, and
replicated in pool B.
Data preprocessing
The preprocessing of expression profile data,
including original data formation, background correction and
expression quantile normalization was performed in pool A and pool
B using linear models for microarray data package (limma; version
3.36.1; http://www.bioconductor.org/packages/release/bioc/html/limma.html)
(15) for R software (version 3.5.2;
http://www.r-project.org/). The probe ID
was converted into the gene symbol based on the chip platform notes
file.
Analysis of DEMs
DEMs between the responder and non-responder groups
were revealed respectively in pool A and pool B using the limma
package. The P-values of the DEMs were corrected using
Benjamini-Hochberg method (16).
P<0.05 was selected as the threshold for the identification of
DEMs. Subsequently, the top 10 DEMs according to their P-values in
pool A and pool B were used for further investigation.
miRNA-gene regulation network
construction
Using the miRWalk 2.0 (http://zmf.umm.uni-heidelberg.de/apps/zmf/mirwalk2/index.html)
(17) software, the potential target
genes for the top 10 DEMs were investigated using on six databases
including miRWalk (http://mirwalk.uni-hd.de) (18), miRanda (http://www.microrna.org/microrna/home.do) (19), miRDB (http://www.mirdb.org) (20), miRMap (http://mirmap.ezlab.org) (21), RNA22 (https://cm.jefferson.edu/rna22) (22) and Targetscan (http://www.targetscan.org) (23). The parameters for the miRNA
information retrieval system were as follows: Minimum seed length,
7 and P-value <0.05. Subsequently, the common miRNA-target genes
that were present in the six databases were submitted for network
construction. The resulting miRNA-gene regulation network was
visualized using cytoscape software (version 3.2.0; http://www.cytoscape.org) (24).
Functional annotation and pathway
analysis
Kyoto Encyclopedia of Genes and Genomes (KEGG)
pathway enrichment analysis of miRNAs in the miRNA-target gene
regulation network was performed based on the clusterProfiler
package (25) for R software. The
Gene Ontology-Biological Process (GO-BP) function analysis and KEGG
pathway analysis of target genes in the miRNA-target gene
regulation network were performed by using the multifaceted
analysis tool for human transcriptome (http://www.biocloudservice.com) (26). The present enrichment analyses for
target genes were based on Fisher's method. P<0.01 was
considered to indicate a statistically significant difference.
PPI network construction
The search tool for the retrieval of interacting
genes/proteins (STRING) database (version 10.0; http://www.string-db.org) is a biological database of
known and predicted PPIs (27). In
the present study, STRING was used to predict interactions between
the target genes of the DEMs. PPIs were selected according to the
STRING database with a high confidence score of 0.7. The centrality
degree was defined as the number of connections for each target
protein. The PPI network was then constructed using cytoscape
software. The sub-networks (modules) with a score of >5 were
identified using the molecular complex detection plugin (version
1.4.2; http://apps.cytoscape.org/apps/MCODE) for cytoscape.
KEGG and GO-BP analysis were performed on the top 10 genes in the
PPI network according to centrality degree, as well as on genes in
modules with P<0.05.
Results
Identification of DEMs
Following data preprocessing of the gene set, there
were 361 and 371 miRNAs in pool A and pool B, respectively. A total
of 18 DEMs and 12 DEMs with P<0.05 were identified in pool A and
pool B, respectively. The DEMs identified in pool A and pool B were
combined, with a total of 10 upregulated and 20 downregulated DEMs.
These DEMs are listed in Table
I.
 | Table I.Differentially expressed miRNAs
between rectal cancer chemoradiotherapy responders and
non-responders. |
Table I.
Differentially expressed miRNAs
between rectal cancer chemoradiotherapy responders and
non-responders.
| miRNA | P-value |
|---|
| hsa-miR-381 |
6.05×10⁻⁴ |
| hsa-miR-371-3p |
2.47×10⁻³ |
| hsa-miR-644 |
3.68×10⁻³ |
| hsa-miR-375 |
6.27×10⁻³ |
| hsa-miR-221 |
6.66×10⁻³ |
| hsa-miR-561 |
9.07×10⁻³ |
| hsa-miR-1291 |
1.00×10⁻² |
| hsa-miR-98 |
1.22×10⁻² |
| hsa-miR-452# |
1.46×10⁻² |
| hsa-miR-148a |
1.59×10⁻² |
| hsa-miR-370 |
1.76×10⁻² |
| hsa-miR-149# |
1.77×10⁻² |
| hsa-miR-502 |
2.05×10⁻² |
| hsa-miR-361 |
2.30×10⁻² |
| hsa-miR-1272 |
2.41×10⁻² |
| hsa-miR-372 |
2.55×10⁻² |
| hsa-miR-605 |
2.70×10⁻² |
| hsa-miR-672 |
2.80×10⁻² |
| hsa-miR-888 |
2.80×10⁻² |
| hsa-miR-142-5p |
3.65×10⁻² |
| hsa-miR-155 |
3.69×10⁻² |
| hsa-let-7f |
3.70×10⁻² |
| hsa-miR-146a# |
4.09×10⁻² |
| hsa-miR-129 |
4.17×10⁻² |
| hsa-miR-650 |
4.29×10⁻² |
| hsa-miR-635 |
4.41×10⁻² |
| hsa-miR-548K |
4.43×10⁻² |
| hsa-miR-617 |
4.64×10⁻² |
| hsa-miR-503 |
4.81×10⁻² |
| hsa-miR-1256 |
4.97×10⁻² |
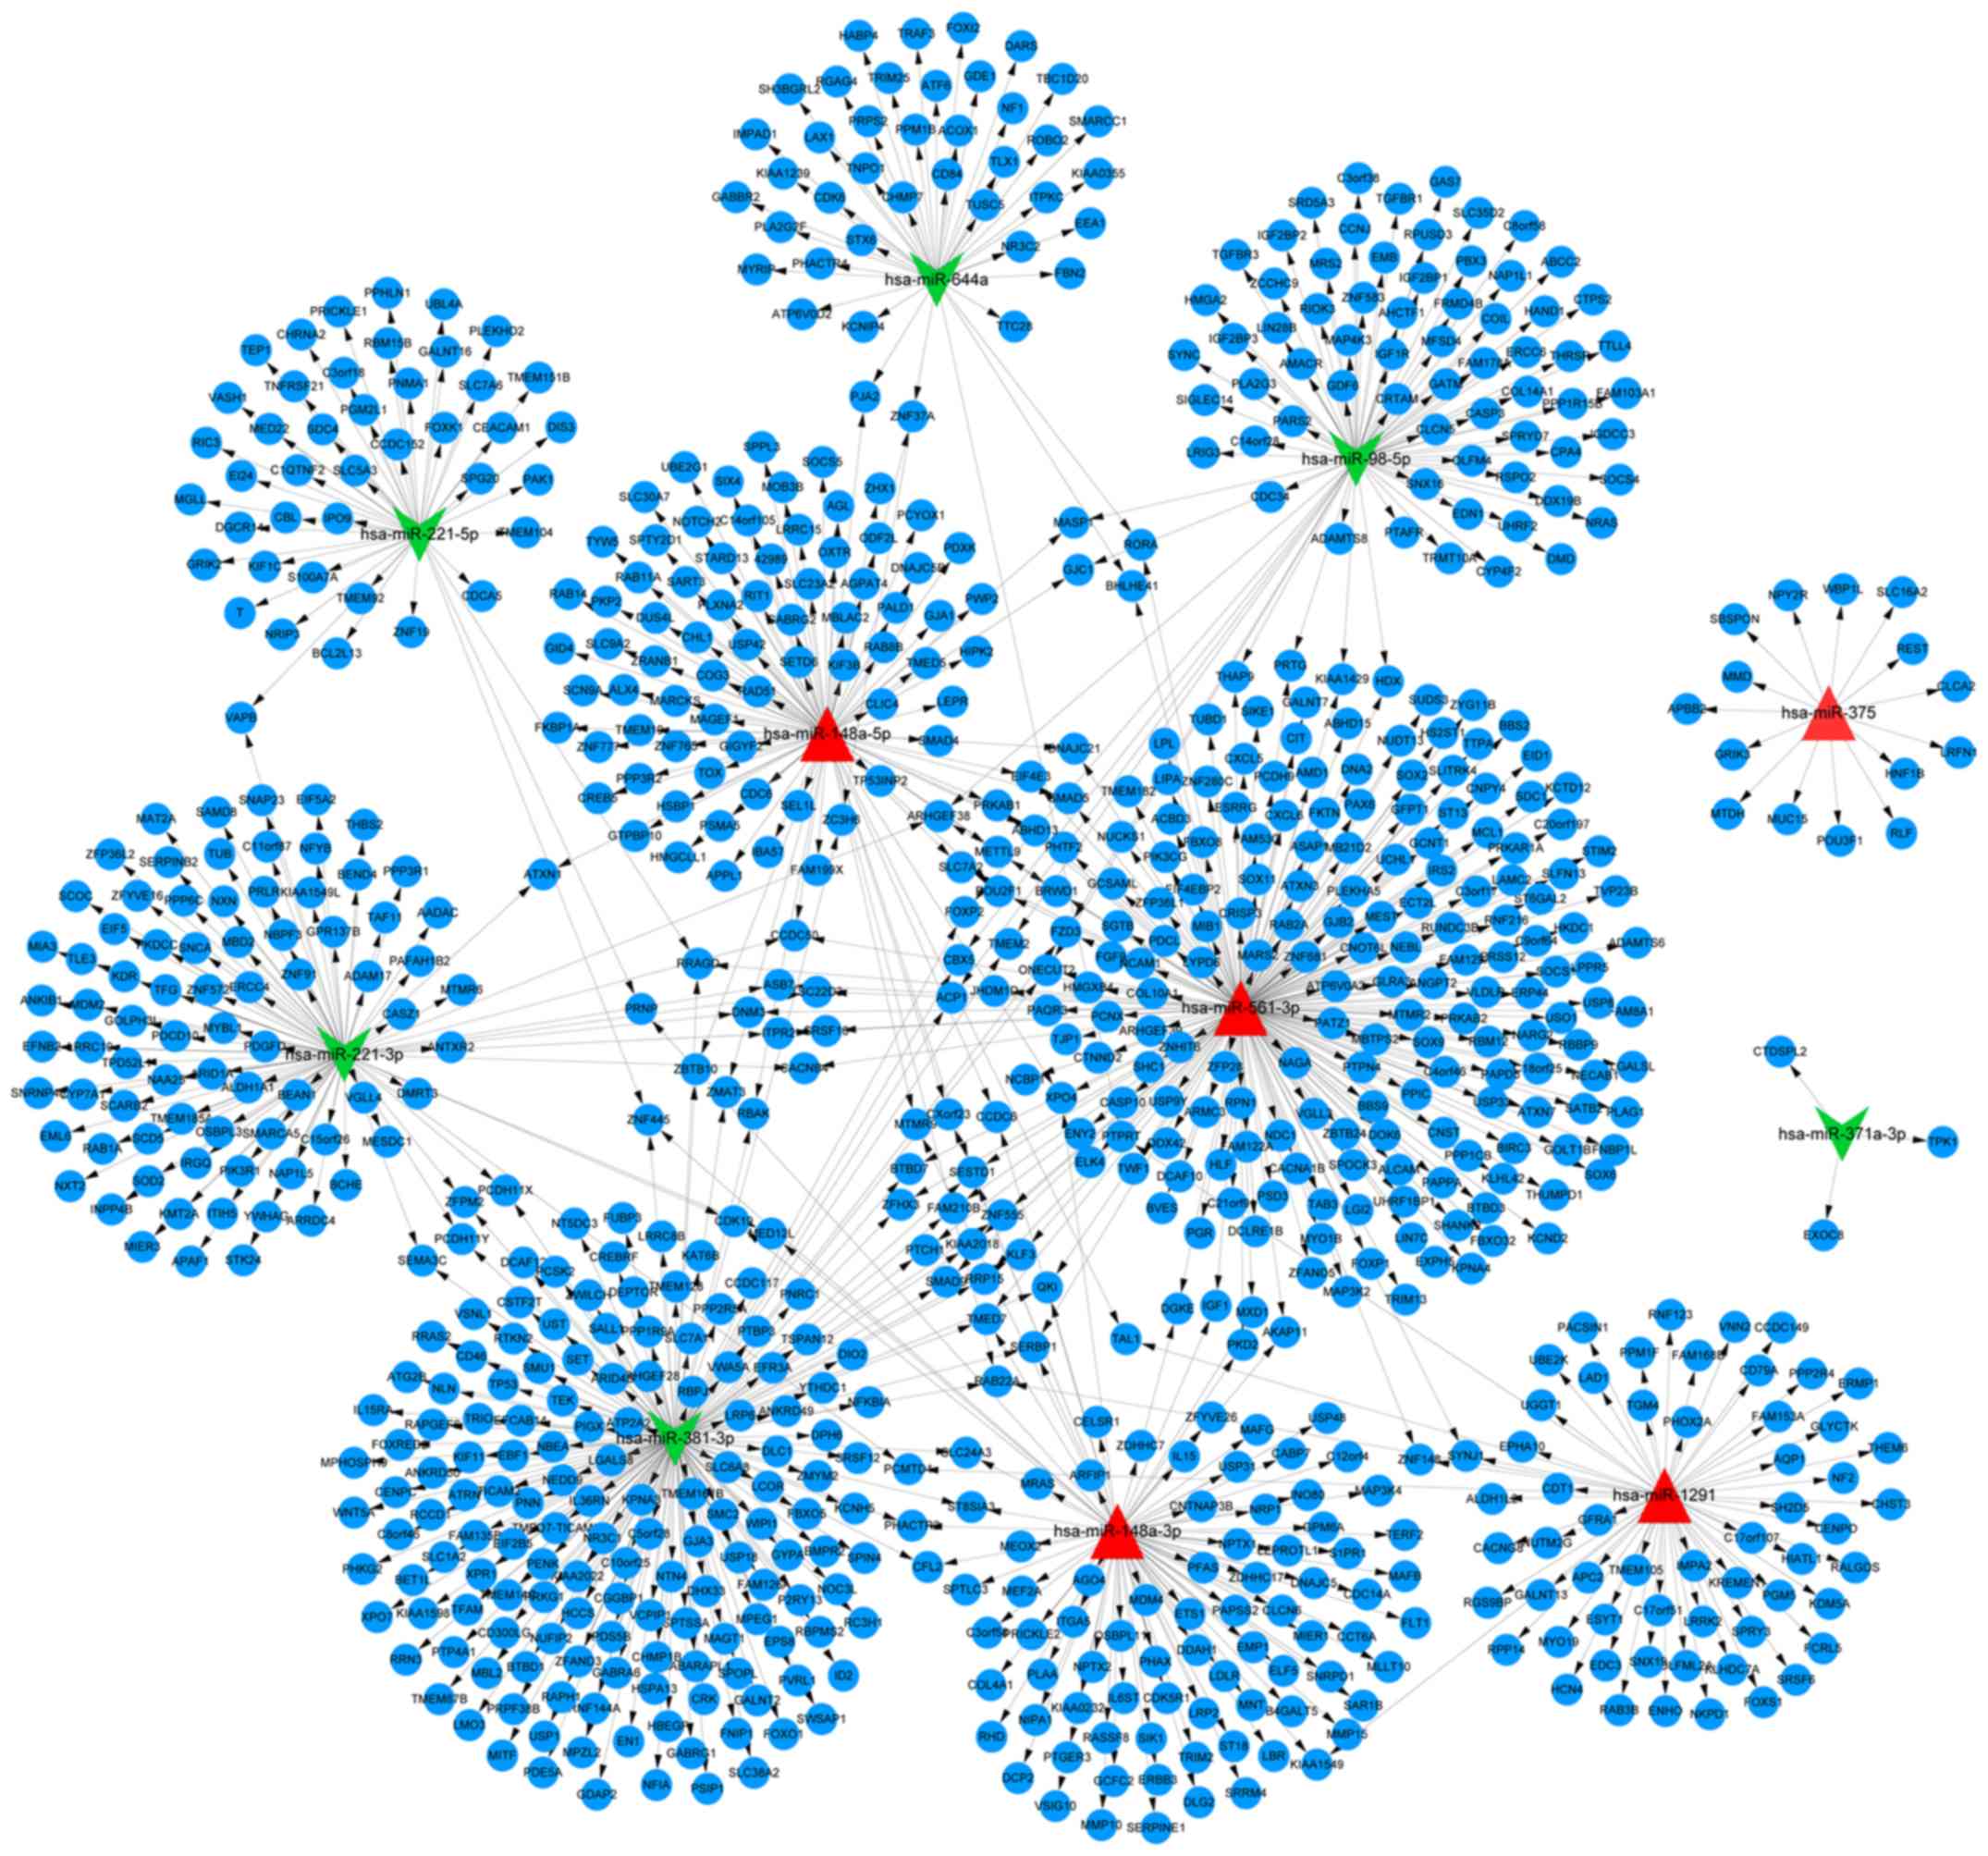
miRNA-target gene regulation network
analysis
To investigate the function of DEMs, the association
between miRNAs and their target genes were identified using the
following six databases: miRWalk, miRanda, miRDB, miRMap, RNA22 and
Targetscan. A total of 935 interactions and 849 nodes were revealed
in the miRNA-target gene interaction network. Furthermore, five
upregulated miRNAs, miR-561-3p, miR-148a-5p, miR-148a-3p, miR-1291
and miR-375, and six downregulated miRNAs, miR-644a, miR-98-5p,
miR-221-5p, miR-221-3p, miR-381-3p and miR-371a-3p, were prominent
in the miRNA-gene regulation network (Fig. 1). Notably, the target genes of
miR-371a-3p were those encoding C-terminal domain small
phosphatase-like 2, thiamin pyrophosphokinase 1 and exocyst complex
component 8.
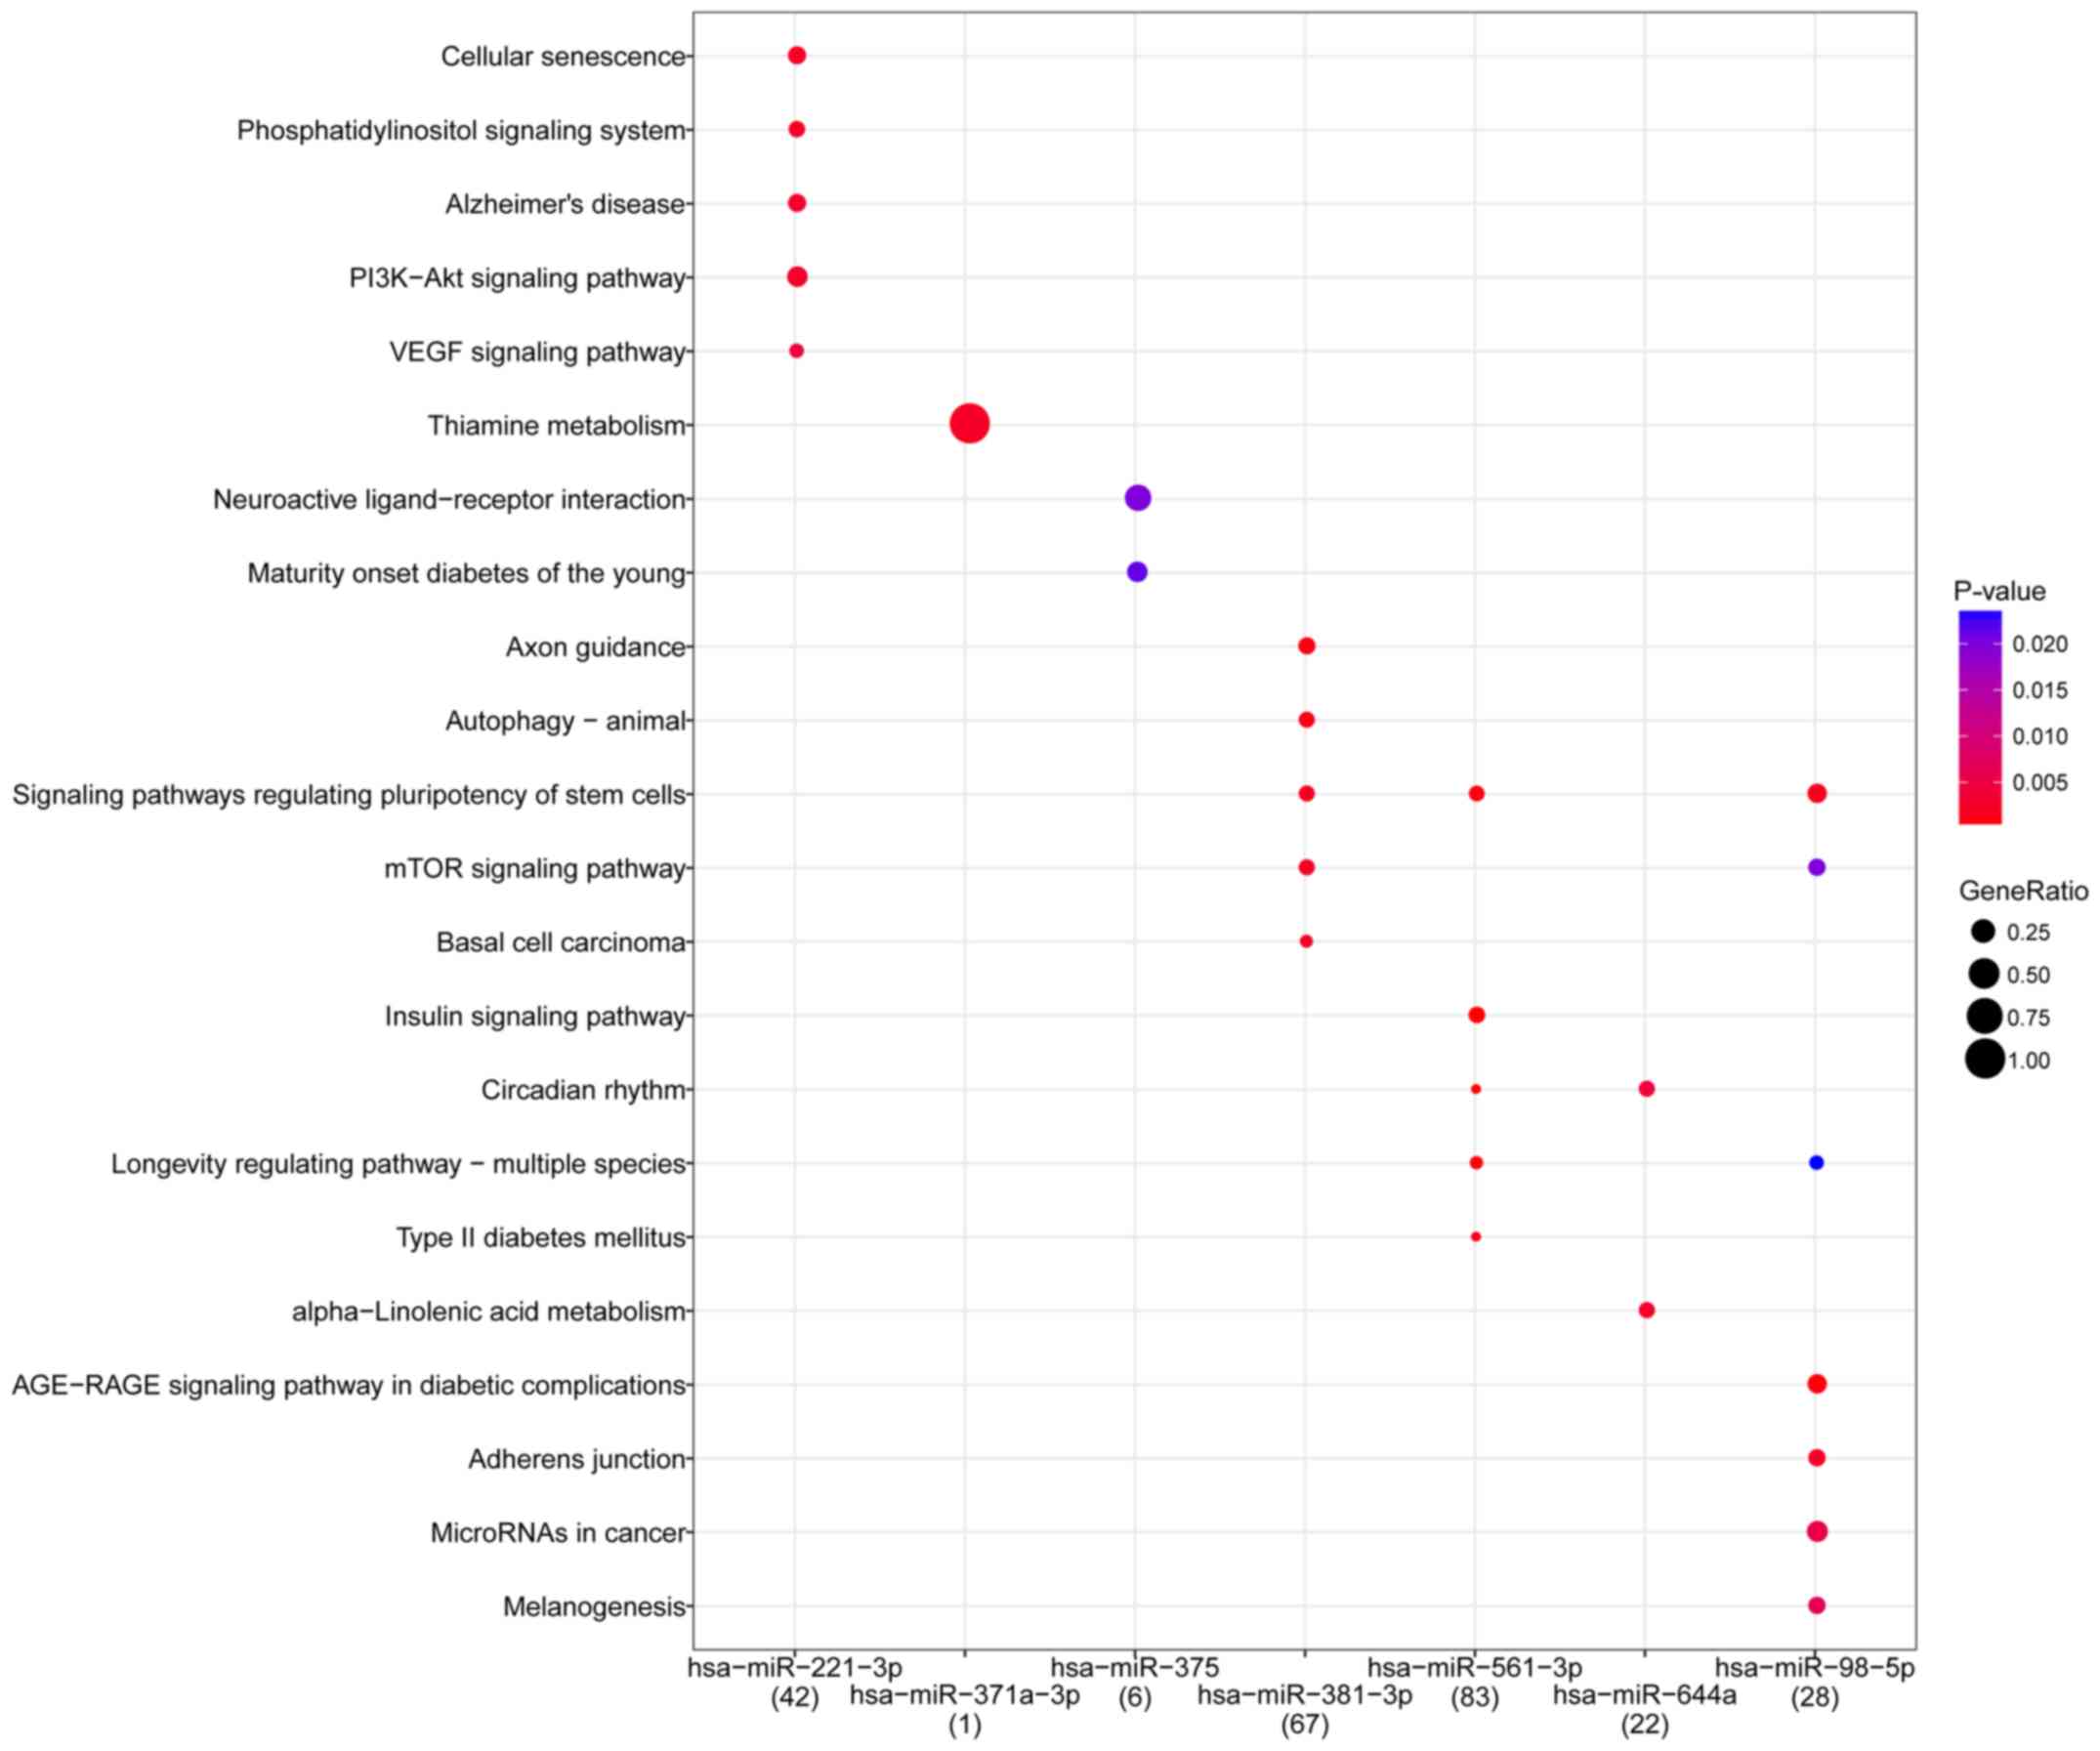
Function and pathway
investigation
KEGG pathway analysis was performed on the top 10
DEMs to evaluate their functions in the miRNA-gene regulation
network. A total of 59 pathways, including thiamine metabolism
[Homo sapiens (hsa) 00730; P=2.20×10⁻³],
signaling pathways regulating pluripotency of stem cells (hsa04550;
P=6.21×10⁻²) and neuroactive ligand-receptor interaction
(hsa04080; P=6.71×10⁻²) were enriched by DEMs. Notably,
miR-371a-3p was significantly enriched in thiamine metabolism. The
main pathways enriched by the top 10 DEMs are presented in Fig. 2.
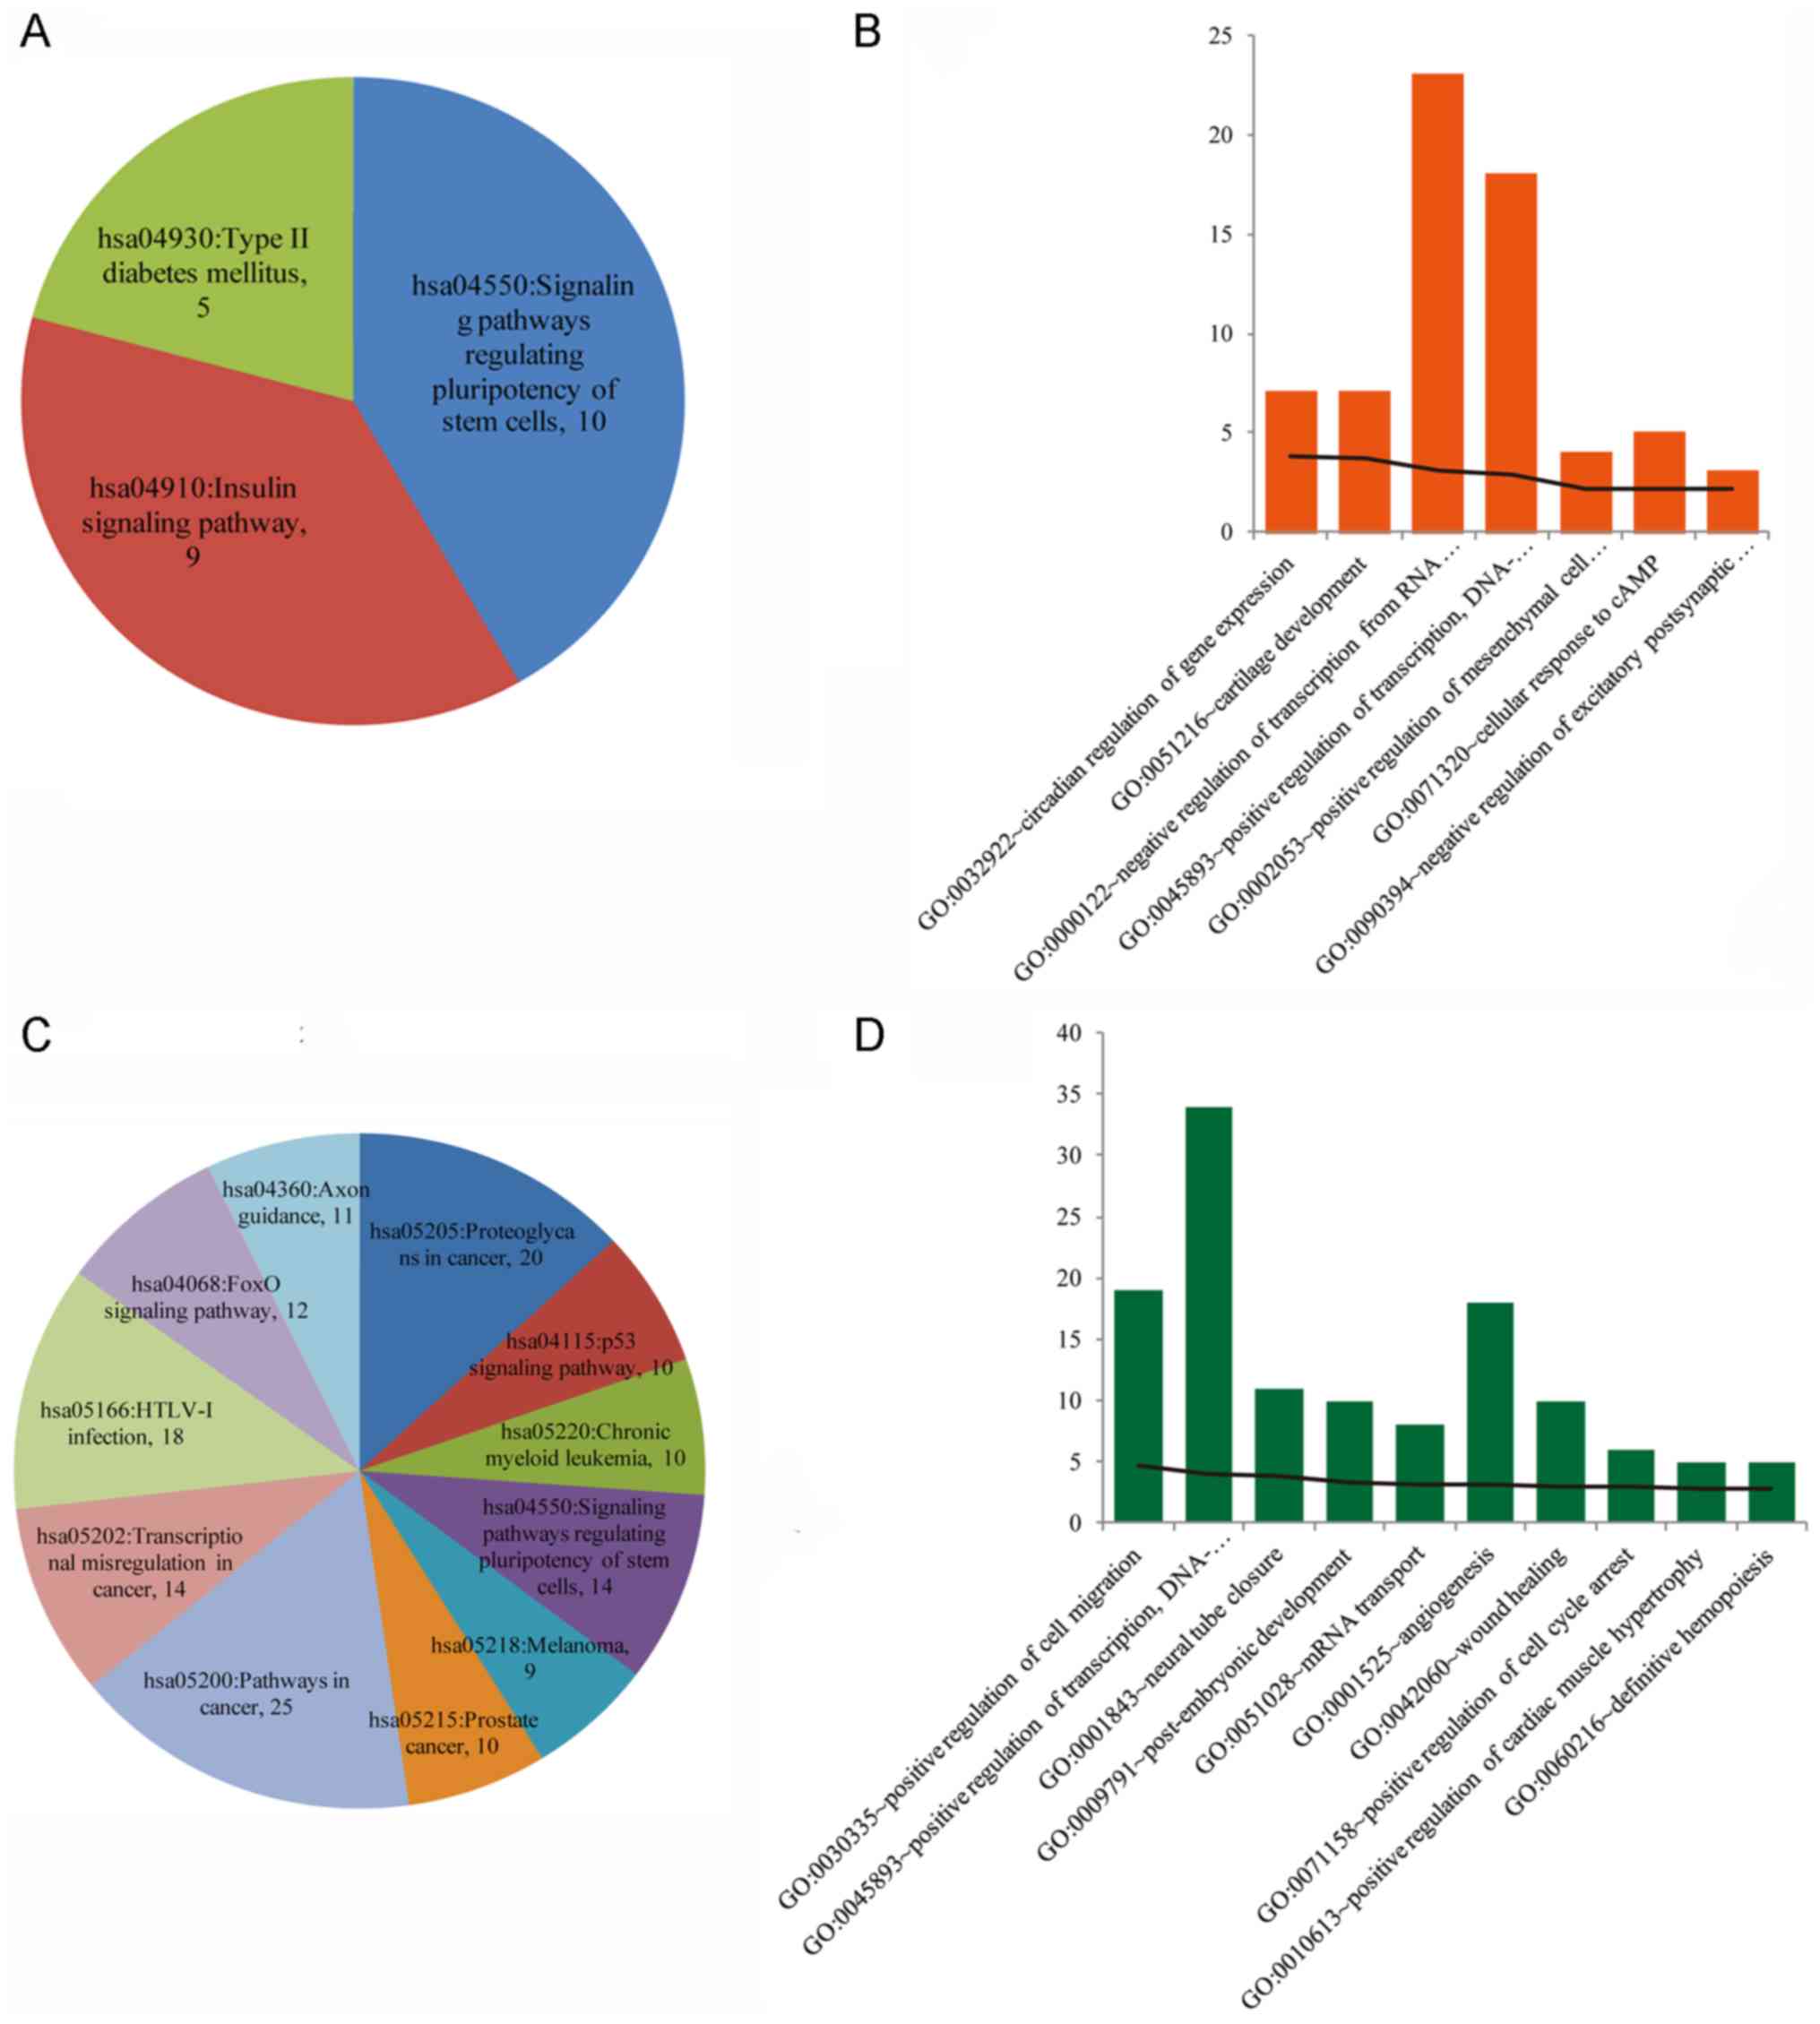
GO function analysis and KEGG pathway investigation
were performed on miRNA-target genes. The results of the KEGG
pathway analysis indicated that genes associated with upregulated
miRNAs were primarily enriched in certain pathways, including
signaling pathways regulating the pluripotency of stem cells,
insulin signaling pathway and Type II diabetes mellitus (Fig. 3A). The regulation of the pluripotency
of stem cells pathway (hsa04550; P=2.39 ×10⁻⁴) was
identified by the following genes:
Phosphoinositide-4,5-bisphosphate 3-kinase γ (PIK3CG), SMAD
family member 9, anaphase-promoting complex subunit 2
(APC2), SMAD family member 5 (SMAD5), sex-determining
region Y box 2 (SOX2) and others. The insulin signaling
pathway (hsa04910; P=1.06×10⁻³) was identified by the
genes PIK3CG, insulin receptor substrate 2 (IRS2),
hexokinase domain-containing 1 (HKDC1), protein kinase
AMP-activated non-catalytic subunit β2, suppressor of cytokine
signaling 1 (SOCS1) and others. The Type II diabetes
mellitus pathway (hsa04930; P=5.67×10⁻³) was identified
by the following genes: PIK3CG, IRS2, HKDC1, SOCS1 and
calcium voltage-gated channel α1 B. GO-BP function analysis
indicated that the target genes that were associated with
upregulated miRNAs were primarily enriched in the functions
presented in Fig. 3B, including
negative regulation of transcription by RNA polymerase II (GO,
0000122; P=8.07×10⁻⁴) as indicated by the following
genes: EP300-interacting inhibitor of differentiation 1, hepatocyte
nuclear factor 1 homeobox B (HNF1B), SATB homeo box 2, zinc
finger protein 280C, metadherin and others.
Furthermore, the KEGG pathway analysis of the target
genes of the downregulated miRNAs were enriched in certain
pathways, including pathways in cancer (hsa05200;
P=2.31×10⁻³), proteoglycans in cancer (hsa05205;
P=2.77×10⁻⁵) and human T-cell lymphotropic virus-I
infection (hsa05166; P=4.41×10⁻³) (Fig. 3C). These three pathways were
identified by the following genes: Wnt family member 5A, collagen
type IV α1 chain, prostaglandin E receptor 3 (PTGER3),
transforming growth factor β receptor 1, melanogenesis-associated
transcription factor and others. The GO-BP function analysis
indicated that the target genes associated with downregulated
miRNAs were primarily involved in functions including positive
regulation of transcription, DNA-templated (GO, 045893;
P=1.39×10⁻³), as indicated by the following genes: ENY2
transcription and export complex 2 subunit, HNF1B, SOX11, SMAD5,
SOX2 and others (Fig. 3D).
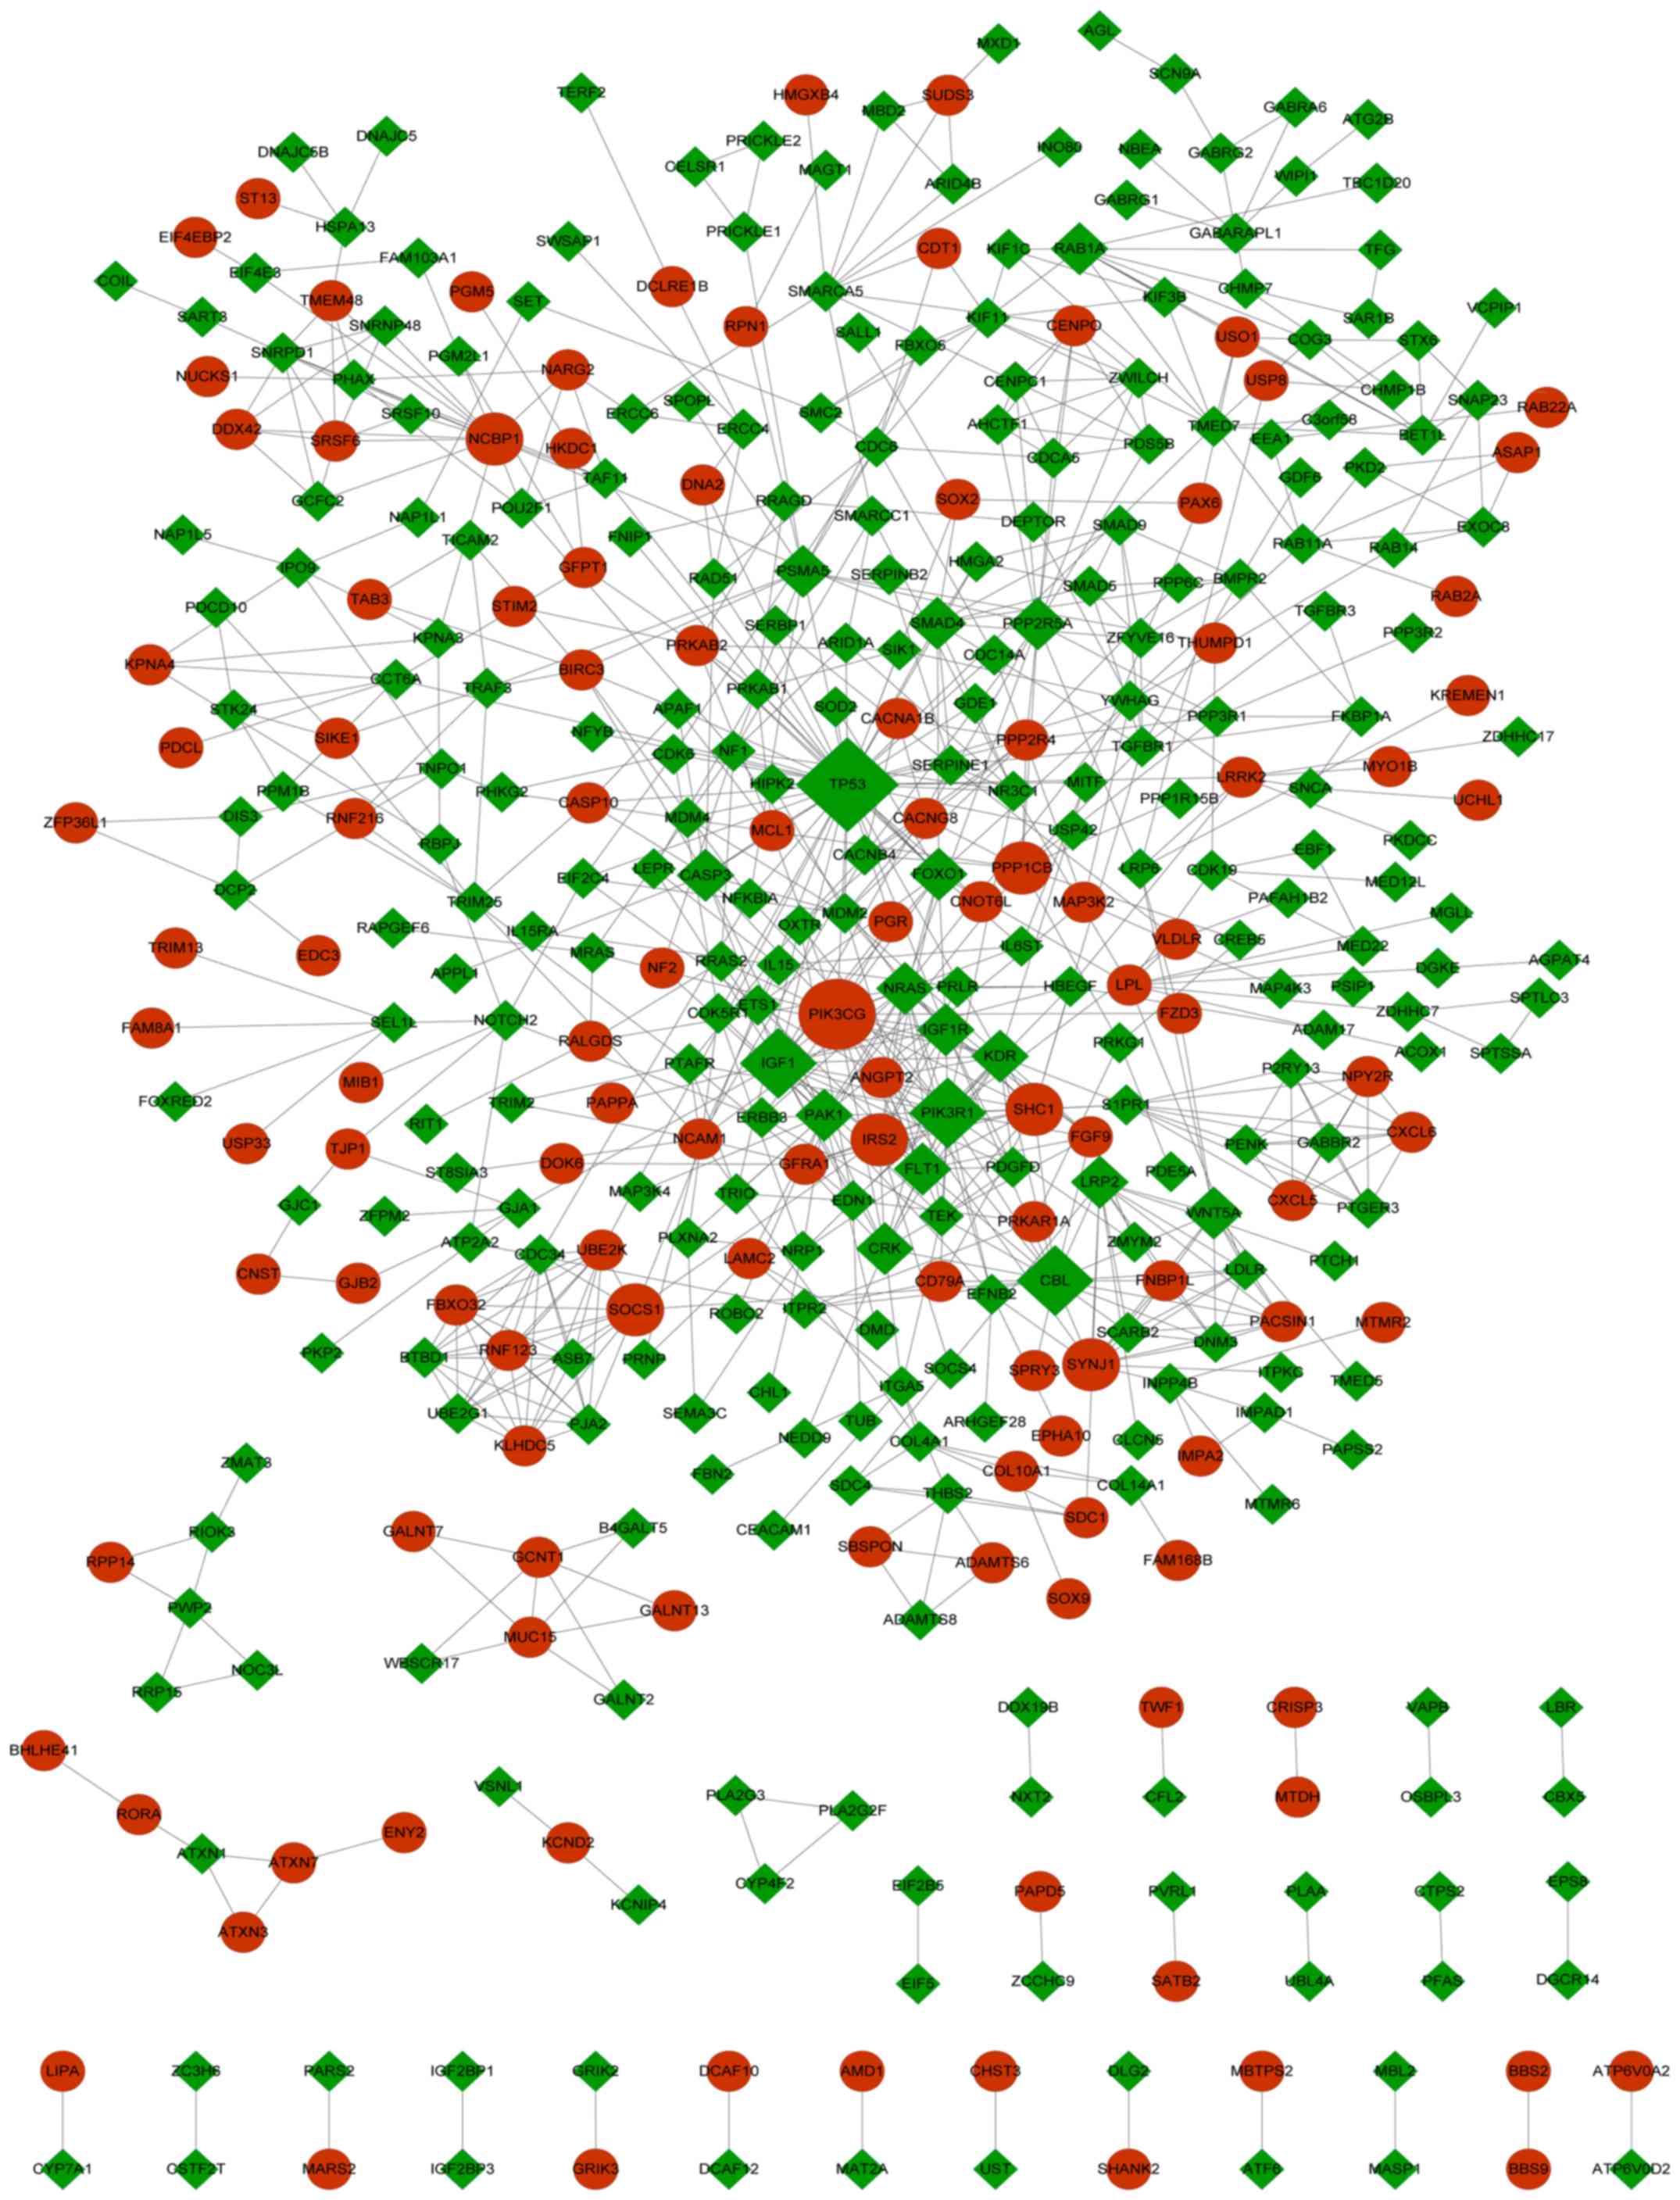
PPI network and module analysis
To identify the potential interactions of the target
genes associated with DEMs, a PPI network and associated modules
were constructed on the basis of the protein interactions of the
target genes. The results indicated that a total of 406 nodes and
830 interactions were included in the present PPI network (Fig. 4). According to the degree of
centrality, the top 10 nodes included seven downregulated and three
upregulated genes. The downregulated genes were tumor protein p53
(TP53), phosphoinositide-3-kinase regulatory subunit 1
(PIK3R1), CBL proto-oncogene, insulin-like growth
factor 1 (IGF1), NRAS, kinase insert domain receptor
(KDR) and p21-activated kinase 1 (PAK1). The three
upregulated genes that were in the top 10 nodes were PIK3CG,
SHC adaptor protein 1 (SHC1) and nuclear cap-binding protein
subunit 1. The GO functional analysis indicated that these genes
were primarily assembled in functions including intracellular
signaling cascade (GO, 0007242; P=4.16×10⁻⁵), as
indicated by the genes PIK3CG, NRAS, TP53, IGF1, SHC1, PAK1
and PIK3R1. The KEGG pathway analysis indicated that these
genes were primarily enriched in pathways such as glioma (hsa05214;
P=3.01×10⁻⁸), as indicated by PIK3CG, NRAS, TP53,
IGF1, SHC1 and PIK3R1 (Table
II).
| Table II.GO function and KEGG pathway analysis
for target genes associated with differentially expressed
miRNAs. |
Table II.
GO function and KEGG pathway analysis
for target genes associated with differentially expressed
miRNAs.
| Analysis | Identifier | Name | Count | P-value | Genes |
|---|
| GO | GO:0007242 | Intracellular
signaling cascade | 7 |
4.16×10⁻⁵ | NRAS, TP53,
IGF1, SHC1, PAK1, PIK3R1 |
|
| GO:0007169 | Transmembrane
receptor protein tyrosine kinase signaling pathway | 4 |
3.50×10⁻⁴ | CBL, SHC1,
PIK3R1, KDR |
|
| GO:0006275 | Regulation of DNA
replication | 3 |
7.29×10⁻⁴ | TP53, IGF1,
SHC1 |
|
| GO:0042127 | Regulation of cell
proliferation | 5 |
1.13×10⁻³ | NRAS, TP53,
IGF1, SHC1, KDR |
|
| GO:0007167 | Enzyme-linked
receptor protein signaling pathway | 4 |
1.20×10⁻³ | CBL, SHC1,
PIK3R1, KDR |
| KEGG | hsa05214 | Glioma | 6 |
3.01×10⁻⁸ | PIK3CG, NRAS,
TP53, IGF1, SHC1, PIK3R1 |
|
| hsa05220 | Chronic myeloid
leukemia | 6 |
7.34×10⁻⁸ | PIK3CG, NRAS,
CBL, TP53, SHC1, PIK3R1 |
|
| hsa04012 | ErbB signaling
pathway | 6 |
1.56×10⁻⁷ | PIK3CG, NRAS,
CBL, SHC1, PAK1, PIK3R1 |
|
| hsa05218 | Melanoma | 5 |
4.17×10⁻⁶ | PIK3CG, NRAS,
TP53, IGF1, PIK3R1 |
|
| hsa04510 | Focal adhesion | 6 |
1.02×10⁻⁵ | PIK3CG, IGF1,
SHC1, PAK1, PIK3R1, KDR |
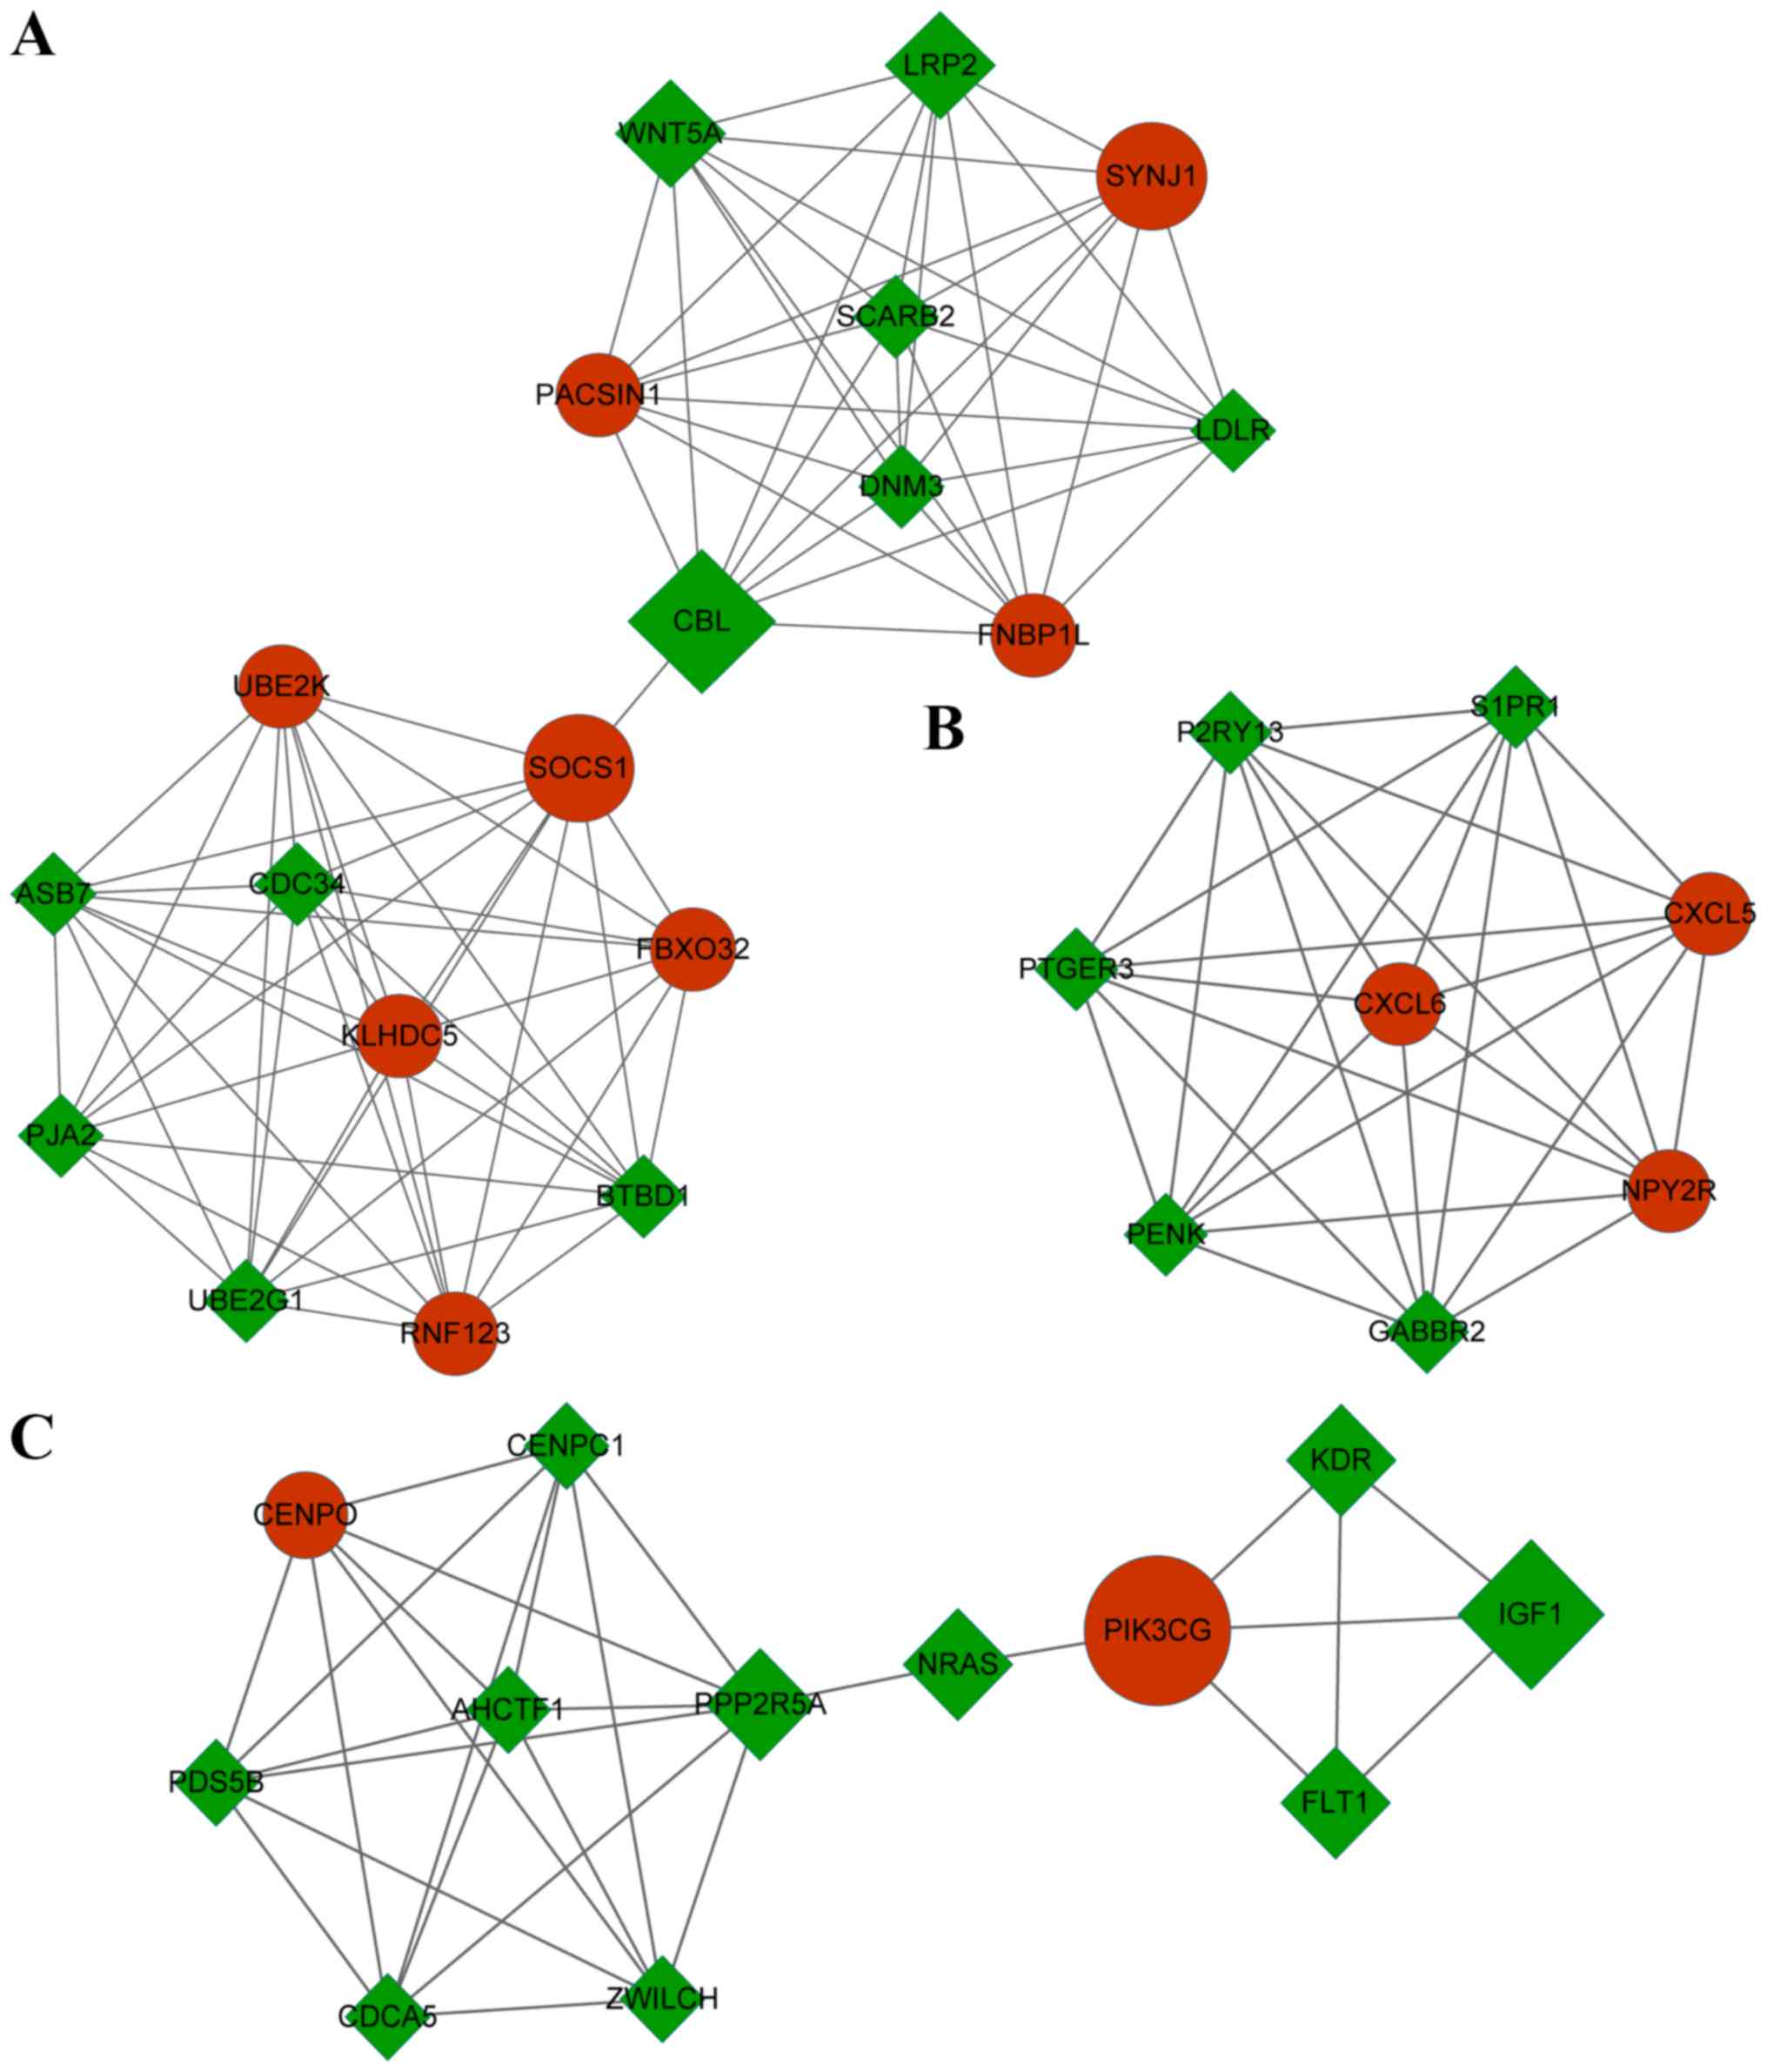
In addition, three modules with a score of >5
were identified (Fig. 5). There were
19 nodes and 82 interactions in module A (score=9.11), eight nodes
and 28 interactions in module B (score=8), and 12 nodes and 29
interactions in module C (score=5.27). The GO functions in which
the target genes of DEMs in module A, module B and module C were
highly enriched were cellular macromolecule catabolic process,
G-protein-coupled receptor protein signaling pathway and cell
division, respectively. Cellular macromolecule catabolic process
(GO, 0044265; P=2.54×10⁻⁹), was identified by the genes
E3 ubiquitin-protein ligase Praja-2, E3 ubiquitin-protein ligase
RNF123, low-density lipoprotein receptor, BTB domain-containing 1,
ubiquitin-conjugating enzyme E2K (UBE2K), and others.
G-protein-coupled receptor protein signaling pathway (GO, 0007186;
P=2.67×10⁻⁸) was identified by the genes P2Y
purinoceptor 13 (P2RY13), sphingosine 1-phosphate receptor 1
(S1PR1), PTGER3, proenkephalin A, C-X-C motif
chemokine 5 and others. Cell division (GO, 0051301;
P=2.56×10⁻⁵) was identified by the genes centromere
protein O, PDS5 cohesion-associated factor B, AT-hook-containing
transcription factor 1, zwilch kinetochore protein and cell
division cycle-associated 5. The KEGG pathways with the highest
enrichment of target genes of DEMs in module A, module B and module
C were ubiquitin-mediated proteolysis, neuroactive ligand-receptor
and focal adhesion, respectively (Table III). The ubiquitin mediated
proteolysis pathway (hsa04120; P=9.34×10⁻⁵) was
identified by the genes UBE2K, ubiquitin-conjugating enzyme
E2 G1, SOCS1, CBL and cell division cycle 34. The
neuroactive ligand-receptor pathway (hsa04080;
P=8.69×10⁻⁵) was indicated by P2RY13, S1PR1,
PTGER3, neuropeptide Y receptor Y2 and γ-aminobutyric acid type
B receptor subunit 2, and the genes identifying the focal adhesion
pathway (hsa04510; P=5.74×10⁻⁴) were PIK3CG,
FMS-related tyrosine kinase 1, IGF1 and KDR.
| Table III.GO function and Kyoto Encyclopedia of
Genes and Genomes pathway analysis for target genes associated with
differentially expressed miRNAs in modules. |
Table III.
GO function and Kyoto Encyclopedia of
Genes and Genomes pathway analysis for target genes associated with
differentially expressed miRNAs in modules.
| Module | Identifier | Name | Count | P-value | Genes |
|---|
| A | GO:0044265 | Cellular
macromolecule catabolic process | 11 |
2.54×10⁻⁹ | PJA2, RNF123,
LDLR, BTBD1, UBE2K |
|
| GO:0009057 | Macromolecule
catabolic process | 11 |
5.22×10⁻⁹ | PJA2, RNF123,
LDLR, BTBD1, UBE2K |
|
| GO:0019941 |
Modification-dependent protein catabolic
process | 10 |
7.51×10⁻⁹ | PJA2, RNF123,
BTBD1, UBE2K, UBE2G1 |
|
| GO:0043632 |
Modification-dependent macromolecule
catabolic process | 10 |
7.51×10⁻⁹ | PJA2, RNF123,
BTBD1, UBE2K, UBE2G1 |
|
| GO:0051603 | Proteolysis
involved in cellular protein catabolic process | 10 |
1.11×10⁻⁸ | PJA2, RNF123,
BTBD1, UBE2K, UBE2G1 |
|
| hsa04120 | Ubiquitin-mediated
proteolysis | 5 |
9.34×10⁻⁵ | UBE2K, UBE2G1,
SOCS1, CBL, CDC34 |
|
| hsa04144 | Endocytosis | 3 |
4.84×10⁻² | DNM3, LDLR,
CBL |
| B | GO:0007186 | G-protein-coupled
receptor protein signaling pathway | 8 |
2.67×10⁻⁸ | P2RY13, S1PR1,
PTGER3, PENK, CXCL5 |
|
| GO:0007166 | Cell-surface
receptor-linked signal transduction | 8 |
9.06×10⁻⁷ | P2RY13, S1PR1,
PTGER3, PENK, CXCL5 |
|
| GO:0051350 | Negative regulation
of lyase activity | 3 |
3.36×10⁻⁴ | S1PR1, NPY2R,
GABBR2 |
|
| GO:0031280 | Negative regulation
of cyclase activity | 3 |
3.36×10⁻⁴ | S1PR1, NPY2R,
GABBR2 |
|
| GO:0007194 | Negative regulation
of adenylate cyclase activity | 3 |
3.36×10⁻⁴ | S1PR1, NPY2R,
GABBR2 |
|
| hsa04080 | Neuroactive
ligand-receptor interaction | 5 |
8.69×10⁻⁵ | P2RY13, S1PR1,
PTGER3, NPY2R, GABBR2 |
| C | GO:0051301 | Cell division | 5 |
2.56×10⁻⁵ | CENPO, PDS5B,
AHCTF1, ZWILCH, CDCA5 |
|
| GO:0048754 | Branching
morphogenesis of a tube | 3 |
8.01×10⁻⁴ | FLT1, IGF1,
KDR |
|
| GO:0001763 | Morphogenesis of a
branching structure | 3 |
1.04×10⁻³ | FLT1, IGF1,
KDR |
|
| GO:0042127 | Regulation of cell
proliferation | 5 |
1.13×10⁻³ | NRAS, FLT1,
PDS5B, IGF1, KDR |
|
| GO:0007059 | Chromosome
segregation | 3 |
1.24×10⁻³ | CENPO, PDS5B,
CDCA5 |
|
| hsa04510 | Focal adhesion | 4 |
5.74×10⁻⁴ | PIK3CG, FLT1,
IGF1, KDR |
|
| hsa05214 | Glioma | 3 |
1.47×10⁻³ | PIK3CG, NRAS,
IGF1 |
|
| hsa05218 | Melanoma | 3 |
1.87×10⁻³ | PIK3CG, NRAS,
IGF1 |
|
| hsa04370 | Vascular
endothelial growth factor signaling pathway | 3 |
2.09×10⁻³ | PIK3CG, NRAS,
KDR |
|
| hsa05215 | Prostate
cancer | 3 |
2.93×10⁻³ | PIK3CG, NRAS,
IGF1 |
Discussion
Although CRT has been established as a gold standard
for LARC, the differences in CRT sensitivity between patients with
LARC remain a challenge in clinical treatment (3). In the present study, a total of 30 DEMs
were identified between responders and non-responders in terms of
sensitivity to CRT. Consistent with previous results (14), it was also identified that miR-375
and miR-148a were differentially expressed. In addition, a total of
11 miRNAs, including miR-371a-3p, exhibited significantly altered
expressed in the miRNA-target gene network. These miRNAs were
enriched in pathways including thiamine metabolism, signaling
pathways regulating pluripotency of stem cells and neuroactive
ligand-receptor interaction. The target genes of these miRNAs were
enriched in signaling pathways regulating pluripotency of stem
cells and functions such as negative regulation of transcription
from the RNA polymerase II promoter. Furthermore, NRAS was
revealed to be a key target gene of DEMs based on the PPI network,
which was mainly enriched in functions such as intracellular
signaling cascade.
miRNAs are involved in post-transcriptional gene
regulation, and thus serve an essential role in numerous biological
processes, including cancer cell proliferation (28,29).
miR-371a-3p has been associated with tumor cell proliferation
(30). Although previous studies
have indicated that serum miR-371a-3p may be a novel biomarker for
tumor cells (31,32), the association between miR-371a-3p
and CRT sensitivity in LARC remains unknown. In the present study,
the miRNA-target gene interaction analysis revealed that
miR-371a-3p was downregulated. This result may indicate that
miR-371a-3p is a potential factor for predicting CRT sensitivity in
LARC. However, investigation of the mechanism of the effect of
miR-371a-3p on CRT sensitivity is lacking. Notably, pathway
analysis in the current study showed that thiamine metabolism was
the pathway with the highest enrichment by miR-371a-3p. The role of
thiamine in cancer is controversial according to previous studies.
In one study, thiamine intake was inversely correlated with colon
cancer risk (33). However, another
study indicated that increased thiamine levels were beneficial for
tumor cell survival, proliferation and chemotherapy resistance
(34). Therefore, downregulated
miR-371a-3p may affect CRT sensitivity in patients with LARC via
the thiamine metabolism pathway.
Stem cells are responsible for maintaining
differentiated cell numbers during normal physiology and at times
of tissue stress (35). In
CRT-treated patients with colorectal cancer, the upregulation of
circulating cancer stem cell markers is vital for clinical
parameters including CRT sensitivity (36). Hiroishi et al (37) indicated that prominin-1 and signal
transducer CD24 contributed to the sensitivity of preoperative CRT
for LARC. In the present study, the GO functional analysis
indicated that signaling pathways regulating the pluripotency of
stem cells had the highest enrichment of upregulated miRNA-target
genes, including PIK3CG and APC2. The product of
PIK3CG is an modulator of extracellular signals and is vital
for the maintenance of epithelia. A previous study indicated that
downregulation of PIK3CG led to inhibition of the
phosphoinositide 3-kinase/protein kinase B signaling pathway, and
was associated with tumorigenesis and progression of colorectal
cancer (38). Downregulation of
APC2 may result in cancerous tumors, as APC2
regulates the uncontrolled growth of cells (39). The most common mutation in colon
cancer is inactivation of APC (40). Thus, on the basis of the results of
the present study, miRNA-target genes APC2 and PIK3CG
may contribute to CRT sensitivity through signaling pathways
regulating the pluripotency of stem cells.
NRAS is an intracellular signal cascade
mediator that initiates the mitogen-activated protein kinase
signaling pathway (41). Mutation of
NRAS is associated with progression of colorectal cancer
(42). Although NRAS is an
intracellular signal cascade mediator (41), the role of NRAS in CRT
sensitivity in patients with LARC remains unknown. In the present
study, target genes in the PPI network, including NRAS were
enriched the intracellular signaling cascade pathway. This
indicates that the differential expression of NRAS may serve
an important role in determining CRT sensitivity in LARC via the
intracellular signaling cascade.
The present study has a number of limitations.
First, the sample size was small. Secondly, the present study used
bioinformatic tools to filter and predict potential target genes
which could affect the CRT response in LARC, but did not
investigate the potential mechanism in vitro or in
vivo. No experiments using clinical samples were performed.
Lastly, previous studies have confirmed that mutations in genes for
potential biomarkers, including KRAS proto-oncogene,
BRAF proto-oncogene and NRAS, are associated with
tumorigenesis and response to anti-epidermal growth factor receptor
therapy in colorectal cancer (43–45).
Next-generation sequencing to identify mutations in these potential
biomarkers may elucidate the key mechanisms mediating CRT
sensitivity in patients with LARC. Therefore, further clinical
investigation based on a larger sample size and using
high-throughput sequencing data is required to confirm the results
of the present study.
In conclusion, downregulated miR-371a-3p may affect
CRT sensitivity in patients with LARC via the thiamine metabolism
pathway. Target genes including PIK3CG and APC2 may
contribute to CRT sensitivity through signaling pathways regulating
the pluripotency of stem cells. Furthermore, NRAS may serve
an important role in determining CRT sensitivity in LARC via the
intracellular signaling cascade.
Acknowledgements
Not applicable.
Funding
No funding was received.
Availability of data and materials
All data generated or analyzed during this study are
included in this published article.
Authors' contributions
CL and CE were responsible for the conception and
design of the research, drafting of the manuscript and performing
the statistical analysis. YZ performed the data acquisition. WY
performed the data analysis and interpretation. All authors read
and approved the manuscript.
Ethics approval and consent to
participate
Not applicable.
Patient consent for publication
Not applicable.
Competing interests
The authors declare that they have no competing
interests.
References
|
1
|
WS Jr, Tarbell NJ, Yao M, Mehta MP and Wo
JY: Rectal Cancer. John Wiley & Sons, Inc. 2017.
|
|
2
|
Jomrich G, Silberhumer GR, Marian B, Beer
A and Müllauer L: Programmed death-ligand 1 expression in rectal
cancer. Eur Surg. 48:1–5. 2016. View Article : Google Scholar
|
|
3
|
Kim JS, Jeong SY, Shin R, Oh HK, Park KJ
and Park JG: 314. Preoperative versus postoperative
chemoradiotherapy for locally advanced rectal cancer. Eur J Surg
Oncol. 38:831. 2012. View Article : Google Scholar
|
|
4
|
Alderdice M, Dunne PD, Cole AJ, O'Reilly
PG, McArt DG, Bingham V, Fuchs MA, McQuaid S, Loughrey MB, Murray
GI, et al: Natural killer-like signature observed post therapy in
locally advanced rectal cancer is a determinant of pathological
response and improved survival. Mod Pathol. 30:1287–1298. 2017.
View Article : Google Scholar : PubMed/NCBI
|
|
5
|
Sauer R, Becker H, Hohenberger W, Rödel C,
Wittekind C, Fietkau R, Martus P, Tschmelitsch J, Hager E, Hess CF,
et al: Preoperative versus postoperative chemoradiotherapy for
rectal cancer. N Engl J Med. 351:1731–1740. 2004. View Article : Google Scholar : PubMed/NCBI
|
|
6
|
Cervantes A and Glynne-Jones R: Adjuvant
chemotherapy for rectal cancer after preoperative radiation or
chemoradiation: One size does not fit all. Ann Oncol. 26:617–619.
2015. View Article : Google Scholar : PubMed/NCBI
|
|
7
|
Bandres E, Agirre X, Bitarte N, Ramirez N,
Zarate R, Roman-Gomez J, Prosper F and Garcia-Foncillas J:
Epigenetic regulation of microRNA expression in colorectal cancer.
Int J Cancer. 125:2737–2743. 2009. View Article : Google Scholar : PubMed/NCBI
|
|
8
|
Gaedcke J, Grade M, Søkilde R, Kaczkowski
B, Difilippantonio M, Ghadimi M, Ried T and Litman T: Abstract
#584: miRNA profiles predictive for response to chemoradiotherapy
in rectal cancer. Cancer Res. 69:2009.
|
|
9
|
Svoboda M, Sana J, Fabian P, Kocakova I,
Gombosova J, Nekvindova J, Radova L, Vyzula R and Slaby O: MicroRNA
expression profile associated with response to neoadjuvant
chemoradiotherapy in locally advanced rectal cancer patients.
Radiat Oncol. 7:1952012. View Article : Google Scholar : PubMed/NCBI
|
|
10
|
Drebber U, Lay M, Wedemeyer I, Vallböhmer
D, Bollschweiler E, Brabender J, Mönig SP, Hölscher AH, Dienes HP
and Odenthal M: Altered levels of the onco-microRNA 21 and the
tumor-suppressor microRNAs 143 and 145 in advanced rectal cancer
indicate successful neoadjuvant chemoradiotherapy. Int J Oncol.
39:409–415. 2011.PubMed/NCBI
|
|
11
|
Pradhan M, Ledford L, Pandit Y and Palakal
M: Global analysis of miRNA target genes in colon rectal cancer.
IEEE International Conference on Bioinformatics and Biomedicine.
341–345. 2011.
|
|
12
|
Ju JA, Huang CT, Lan SH, Wang TH, Lin PC,
Lee JC, Tian YF and Liu HS: Characterization of a colorectal cancer
migration and autophagy-related microRNA miR-338-5p and its target
gene PIK3C3. Biomarkers Genomic Med. 5:74–78. 2013. View Article : Google Scholar
|
|
13
|
Naccarati A, Pardini B, Stefano L, Landi
D, Slyskova J, Novotny J, Levy M, Polakova V, Lipska L and Vodicka
P: Polymorphisms in miRNA-binding sites of nucleotide excision
repair genes and colorectal cancer risk. Carcinogenesis.
33:1346–1351. 2012. View Article : Google Scholar : PubMed/NCBI
|
|
14
|
Conde-Muino R, Cano C, Sanchez-Martin V,
Herrera A, Comino A, Medina PP Palma P and Cuadros M: Preoperative
chemoradiotherapy for rectal cancer: The sensitizer role of the
association between miR-375 and c-Myc. Oncotarget. 8:82294–82302.
2017. View Article : Google Scholar : PubMed/NCBI
|
|
15
|
Smyth GK: Limma: Linear models for
microarray data. Bioinformatics and Computational Biology Solutions
Using R and Bioconductor. Gentleman R, Carey VJ, Huber W, Irizarry
RA and Dudoit S: Springer New York. (New York, NY). 397–420. 2005.
View Article : Google Scholar
|
|
16
|
Benjamini Y and Hochberg Y: Controlling
the false discovery rate: A practical and powerful approach to
multiple testing. J R Stat Soc Series B (Methodological). 289–300.
1995. View Article : Google Scholar
|
|
17
|
Dweep H and Gretz N: miRWalk2.0: A
comprehensive atlas of microRNA-target interactions. Nat Methods.
12:6972015. View Article : Google Scholar : PubMed/NCBI
|
|
18
|
Dweep H, Gretz N and Sticht C: miRWalk
database for miRNA-target interactions. Methods Mol Biol.
1182:289–305. 2014. View Article : Google Scholar : PubMed/NCBI
|
|
19
|
Betel D, Koppal A, Agius P, Sander C and
Leslie C: Comprehensive modeling of microRNA targets predicts
functional non-conserved and non-canonical sites. Genome Biol.
11:R902010. View Article : Google Scholar : PubMed/NCBI
|
|
20
|
Wong N and Wang X: miRDB: An online
resource for microRNA target prediction and functional annotations.
Nucleic Acids Res. 43:D146–D152. 2015. View Article : Google Scholar : PubMed/NCBI
|
|
21
|
Vejnar CE and Zdobnov EM: MiRmap:
Comprehensive prediction of microRNA target repression strength.
Nucleic Acids Res. 40:11673–11683. 2012. View Article : Google Scholar : PubMed/NCBI
|
|
22
|
Rigoutsos I, Miranda K and Huynh T: rna22:
A unified computational framework for discovering miRNA precursors,
localizing mature miRNAs, identifying 3′UTR Target-islands and
determining the targets of mature-miRNAs. IBM Corporation.
(Yorktown Heights, NY, USA). 2007.
|
|
23
|
Agarwal V, Bell GW, Nam JW and Bartel DP:
Predicting effective microRNA target sites in mammalian mRNAs.
eLife. 4:e050052015. View Article : Google Scholar
|
|
24
|
Shannon P, Markiel A, Ozier O, Baliga NS,
Wang JT, Ramage D, Amin N, Schwikowski B and Ideker T: Cytoscape: A
software environment for integrated models of biomolecular
interaction networks. Genome Res. 13:2498–2504. 2003. View Article : Google Scholar : PubMed/NCBI
|
|
25
|
Kanehisa M and Goto S: KEGG: Kyoto
encyclopedia of genes and genomes. Nucleic Acids Res. 28:27–30.
2000. View Article : Google Scholar : PubMed/NCBI
|
|
26
|
Song W, Liu H, Wang J, Kong Y, Yin X and
Zang W: MATHT: A web server for comprehensive transcriptome data
analysis. J Theor Biol. 455:140–146. 2018. View Article : Google Scholar : PubMed/NCBI
|
|
27
|
Szklarczyk D, Franceschini A, Wyder S,
Forslund K, Heller D, Huerta-Cepas J, Simonovic M, Roth A, Santos
A, Tsafou KP, et al: STRING v10: Protein-protein interaction
networks, integrated over the tree of life. Nucleic Acids Res.
43:D447–D452. 2015. View Article : Google Scholar : PubMed/NCBI
|
|
28
|
Catto JW, Alcaraz A, Bjartell AS, De Vere
White R, Evans CP, Fussel S, Hamdy FC, Kallioniemi O, Mengual L,
Schlomm T and Visakorpi T: MicroRNA in prostate, bladder and kidney
cancer: A systematic review. Eur Urol. 59:671–681. 2011. View Article : Google Scholar : PubMed/NCBI
|
|
29
|
Lu J, Getz G, Miska EA, Alvarez-Saavedra
E, Lamb J, Peck D, Sweet-Cordero A, Ebert BL, Mak RH, Ferrando AA,
et al: MicroRNA expression profiles classify human cancers. Nature.
435:834–838. 2005. View Article : Google Scholar : PubMed/NCBI
|
|
30
|
Ruf CG, Dinger D, Port M, Schmelz HU,
Wagner W, Matthies C, Müller-Myhsok B, Meineke V and Abend M: Small
RNAs in the peripheral blood discriminate metastasized from
non-metastasized seminoma. Mol Cancer. 13:472014. View Article : Google Scholar : PubMed/NCBI
|
|
31
|
Dieckmann KP, Radtke A, Spiekermann M,
Balks T, Matthies C, Becker P, Ruf C, Oing C, Oechsle K, Bokemeyer
C, et al: Serum levels of MicroRNA miR-371a-3p: A sensitive and
specific new biomarker for germ cell tumours. Eur Urol. 71:213–220.
2017. View Article : Google Scholar : PubMed/NCBI
|
|
32
|
Spiekermann M, Belge G, Winter N, Ikogho
R, Balks T, Bullerdiek J and Dieckmann KP: MicroRNA miR-371a-3p in
serum of patients with germ cell tumours: Evaluations for
establishing a serum biomarker. Andrology. 3:78–84. 2015.
View Article : Google Scholar : PubMed/NCBI
|
|
33
|
Slattery ML, Potter JD, Coates A, Ma KN,
Berry TD, Duncan DM and Caan BJ: Plant foods and colon cancer: An
assessment of specific foods and their related nutrients (United
States). Cancer Causes Control. 8:575–590. 1997. View Article : Google Scholar : PubMed/NCBI
|
|
34
|
Lu'o'ng KV and Nguyễn LT: The role of
thiamine in cancer: Possible genetic and cellular signaling
mechanisms. Cancer Genomics Proteomics. 10:169–185. 2013.PubMed/NCBI
|
|
35
|
Buczacki S, Davies RJ and Winton DJ: Stem
cells, quiescence and rectal carcinoma: an unexplored relationship
and potential therapeutic target. Br J Cancer. 105:1253–1259. 2011.
View Article : Google Scholar : PubMed/NCBI
|
|
36
|
Mirzaei A, Tavoosidana G, Modarressi MH,
Rad AA, Fazeli MS, Shirkoohi R, Tavakoli-Yaraki M and Madjd Z:
Upregulation of circulating cancer stem cell marker, DCLK1 but not
Lgr5, in chemoradiotherapy-treated colorectal cancer patients.
Tumour Biol. 36:4801–4810. 2015. View Article : Google Scholar : PubMed/NCBI
|
|
37
|
Hiroishi K, Inomata M, Kashima K, Yasuda
K, Shiraishi N, Yokoyama S and Kitano S: Cancer stem cell-related
factors are associated with the efficacy of pre-operative
chemoradiotherapy for locally advanced rectal cancer. Exp Ther Med.
2:465–470. 2011. View Article : Google Scholar : PubMed/NCBI
|
|
38
|
Semba S, Itoh N, Ito M, Youssef EM, Harada
M, Moriya T, Kimura W and Yamakawa M: Down-regulation of PIK3CG, a
catalytic subunit of phosphatidylinositol 3-OH kinase, by CpG
hypermethylation in human colorectal carcinoma. Clin Cancer Res.
8:3824–3831. 2002.PubMed/NCBI
|
|
39
|
Jarrett CR, Blancato J, Cao T, Bressette
DS, Cepeda M, Young PE, King CR and Byers SW: Human APC2
localization and allelic imbalance. Cancer Res. 61:7978–7984.
2001.PubMed/NCBI
|
|
40
|
Yang D, Zhang M and Gold B: Origin of
somatic mutations in β-catenin versus APC in colon cancer: Random
mutagenesis in animal models versus Non-random mutagenesis in
humans. Chem Res Toxicol. 30:1369–1375. 2017. View Article : Google Scholar : PubMed/NCBI
|
|
41
|
Hao T and Brooks TA: Abstract 2110:
Modulating NRAS mRNA translation by nucleic acid clamp-mediated
stabilization of the 5′-UTR G-quadruplex. Cancer Res. 75:21102015.
View Article : Google Scholar
|
|
42
|
Vaughn CP, Zobell SD, Furtado LV, Baker CL
and Samowitz WS: Frequency of KRAS, BRAF, and NRAS mutations in
colorectal cancer. Genes Chromosomes Cancer. 50:307–312. 2011.
View Article : Google Scholar : PubMed/NCBI
|
|
43
|
Jauhri M, Bhatnagar A, Gupta S, Bp M,
Minhas S, Shokeen Y and Aggarwal S: Prevalence and coexistence of
KRAS, BRAF, PIK3CA, NRAS, TP53, and APC mutations in Indian
colorectal cancer patients: Next-generation sequencing-based cohort
study. Tumour Biol. 39:10104283176922652017. View Article : Google Scholar : PubMed/NCBI
|
|
44
|
Hsu HC, Thiam TK, Lu YJ, Yeh CY, Tsai WS,
You JF, Hung HY, Tsai CN, Hsu A, Chen HC, et al: Mutations of
KRAS/NRAS/BRAF predict cetuximab resistance in metastatic
colorectal cancer patients. Oncotarget. 7:22257–22270. 2016.
View Article : Google Scholar : PubMed/NCBI
|
|
45
|
Bagadi SB, Sanghvi M, Nair SB and Das BR:
Combined mutational analysis of KRAS, NRAS and BRAF genes in Indian
patients with colorectal carcinoma. Int J Biol Markers. 27:27–33.
2012. View Article : Google Scholar : PubMed/NCBI
|