Introduction
Gastric cancer (GC) originates from the lining of
the stomach, and may metastasize to other tissues and organs,
including the lungs, liver, lymph nodes and bones (1). It is estimated that 22,220 new cases of
GC were diagnosed and 10,990 patients succumbed to GC in 2014
(2). GC is more common in males, and
has a high incidence in East Asia and Eastern Europe (3). The most common inducer of GC is
Helicobacter pylori infection, although other risk factors
include pickled foods, smoking and obesity (4,5).
Patients with GC usually have an unfavorable prognosis, as the
majority reach the advanced stages of disease prior to diagnosis
(6). Therefore, determining the
mechanisms of GC is required for the identification of key
biomarkers and the development of effective targeted therapies.
The human genome project indicates that only 1.2% of
the mammalian genome encodes proteins (7), and that the majority of the genome is
transcribed to tens of thousands of long non-coding RNAs (lncRNAs),
which are >200 nt in length (8).
lncRNAs function in various biological processes, including
cellular development and differentiation (9). It has increasingly been suggested that
the principal role of lncRNAs is the guidance of site specificity
for chromatin-modifying complexes in order to effect epigenetic
alterations (10). lncRNAs act
through a number of mechanisms in the control of cancer. For
instance, specific lncRNAs are key regulators of the protein
signaling pathways underlying carcinogenesis (11). Additionally, other lncRNAs function
as decoys, sequestering biomolecules and preventing cancerous cells
from fulfilling their cellular roles (12,13).
Numerous studies have reported the important role of lncRNAs in GC;
lncRNA-H19 is upregulated in GC tissues and affects the
progression and metastasis of GC by promoting isthmin 1 expression
and inhibiting calneuron 1 expression (14). The downregulated expression of lncRNA
maternally expressed gene 3 promotes cell proliferation and
apoptosis, and predicts a poor prognosis in GC (15,16).
Overexpression of the lncRNA colon cancer associated transcript 2
associates with the progression of GC and may serve as a promising
prognostic marker for the disease (17). Antisense ncRNA in the INK4 locus acts
as a growth regulator in GC by silencing microRNA (miR)-99a
and miR-449a, and may indicate a potential prognostic
biomarker and therapeutic target in GC (18,19).
BRAF-activated non-coding RNA overexpression associates positively
with tumor depth, clinical stage and tumor metastasis, and predicts
a poor prognosis in patients with GC (20). However, the functions of numerous
lncRNAs remain unclear; therefore, it is necessary to conduct a
comprehensive assessment of the functions of lncRNAs in GC.
Bioinformatics analysis of gene expression profiles
has been widely applied to investigate the pathogenesis of various
diseases (21). In the current
study, multiple GC datasets were searched and downloaded from open
access databases. Using comprehensive bioinformatics analyses,
certain prognosis-associated lncRNAs were identified. An optimal
risk score system based on these lncRNAs was constructed to
evaluate the risk of developing GC, the efficiency of which was
determined using various independent datasets.
Subjects and methods
Data sources
The mRNA-sequencing data for GC, sequenced on the
Illumina HiSeq 2000 RNA Sequencing platform (Illumina, Inc., San
Diego, CA, USA), were downloaded from The Cancer Genome Atlas
(TCGA; http://cancergenome.nih.gov/)
database, which included 384 GC samples. Among the 384 samples,
there were 122 samples from deceased patients due to GC, 238
samples from surviving patients (mean survival time, mean ±
standard deviation, 16.17±16.96 months) and 24 samples without
survival information.
From the Gene Expression Omnibus (GEO, http://www.ncbi.nlm.nih.gov/geo/) database, three
kinds of datasets (dataset I–III) were searched and identified
using ‘gastric cancer’ as the key words. Dataset I was searched
according to the following criteria: i) The dataset was a gene
expression profile; ii) the samples were tumor tissues from
patients with GC; iii) the dataset was a human expression profile;
and iv) the total number of samples was ≥100. Thus, GSE15459
(22–26) (including 300 GC samples) and GSE54129
(including 111 GC samples) sequenced on the Affymetrix-GPL570
platform (Affymetrix; Thermo Fisher Scientific, Inc., Waltham, MA,
USA) were selected. The criteria for searching GC dataset II were
as follows: i) The dataset was a gene expression profile; ii) the
samples were tumor tissues from patients with GC; iii) the dataset
was a human expression profile; iv) the samples contained survival
information; and v) the total number of samples was ≥100. Only
GSE62254 (27) (including 300 GC
samples; Affymetrix-GPL570 platform; Affymetrix; Thermo Fisher
Scientific, Inc.,) was selected, involving 135 samples from
deceased patients due to GC, and 148 samples from surviving
patients (mean survival time, mean ± standard deviation,
50.59±31.42 months), and 17 samples without survival information.
Dataset III was selected according to the following criteria: i)
The dataset was a gene expression profile; ii) the samples were
tumor tissues from patients with GC; iii) there were control
tissues; iv) the dataset was a human expression profile; and v) the
total number of samples was ≥50. Ultimately, the GSE65801 (28) (including 32 GC samples and 32 control
samples; Agilent GPL14550 platform; Agilent Technologies, Inc.,
Santa Clara, CA, USA), GSE29998 (29) (including 50 GC samples and 49 control
samples; GPL6947 Illumina HumanHT-12 V3.0 platform; Illumina,
Inc.), GSE33335 (30–32) (including 25 GC samples and 25 control
samples; GPL5175 [HuEx-1_0-st] platform) and GSE27342 (33,34)
(including 80 GC samples and 80 control samples; GPL5175
[HuEx-1_0-st] platform) datasets were selected.
Data preprocessing
The data from the aforementioned databases were
divided into three types based on the testing platforms. For the
dataset from TCGA, the quantile standardization method in the R
package preprocessCore (version 1.40.0; http://bioconductor.org/packages/release/bioc/html/preprocessCore.html)
(35) was used for data
normalization. For the CIMFast Event Language data sequenced on the
Affymetrix platform, the R package oligo (version 1.41.1;
http://www.bioconductor.org/packages/release/bioc/html/oligo.html)
(36) was utilized for format
conversion, missing data filling, background correction and data
normalization. For the TXT data sequenced on the Agilent platform,
the R package Limma (version 3.34.0; http://bioconductor.org/packages/release/bioc/html/limma.html)
(37) was applied for log2
logarithmics and data normalization.
Subsequently, lncRNAs were annotated based on the
Ref_seq and Transcript_ID provided by the annotation platform, and
aligned with human genome sequences (version, GRCh38) on a platform
using Clustal 2.1 software (http://www.clustal.org/clustal2/) (38). Subsequently, multiple annotation
results were merged to identify the lncRNAs and their corresponding
expression information (39–41).
Weighted gene co-expression network
analysis (WGCNA) to identify disease-associated modules
As a bioinformatics algorithm for building
co-expression networks, WGCNA is used to identify
disease-associated modules and thus screen for pathogenic processes
and potential therapeutic targets (42). In the present study, based on the use
of TCGA dataset as the training dataset, and GSE15459 and GSE54129
as the validation datasets, stable modules associated with GC were
identified using the R package WGCNA (version 1.61; http://cran.r-project.org/web/packages/WGCNA/index.html)
(43). Expression correlation
between every two of the three datasets was calculated, and the
adjacent function was defined as follows: WGCNA analysis was
required to satisfy the precondition of scale-free network
distribution, and thus the value of the adjacency matrix weighting
parameter ‘power’ was investigated. Based on the RNA data, the
squares of the correlation coefficients between log (k) and log [p
(k)] were calculated for different ‘power’ values. A higher square
value indicated that the network was closer to a scale-free network
distribution. Following the definition of the adjacent function,
module partition was conducted (the thresholds for module partition
were that the module contained ≥150 RNAs and a cutHeight of 0.99).
Combined with the clinical information from TCGA dataset, the
correlation between each module and the clinical information was
analyzed. Functional annotation was conducted for each stable
module using the userListEnrichment function in the WGCNA package
(43). Additionally, differential
expression analysis of lncRNAs between tumor and control groups was
performed for each module, with a P-value and false discovery rate
(FDR) of <0.05.
Selection of prognosis-associated
lncRNAs
Based on the lncRNAs obtained in the clinical
factors-associated stable modules, univariate Cox regression
analysis was performed using the R package survival (version 2.4;
http://cran.r-project.org/web/packages/survival/index.html)
(44) for the GC samples with
survival information in the TCGA dataset, to identify
prognosis-associated lncRNAs. A log-rank P-value of <0.05 was
considered to indicate a statistically significant difference.
Construction and assessment of a risk
score system
The lncRNAs in the stable modules that correlated
significantly with notable clinical factors were analyzed
separately. Using the Cox-Proportional Hazards (Cox-PH) model in
the R package ‘penalized’ (http://bioconductor.org/packages/penalized/) (45), the optimal lncRNA combinations were
selected. The parameter ‘lambda’ was obtained with 1,000
circulation calculations using a cross-validation likelihood
algorithm (46). Subsequently, the
risk score system was constructed, combined with the regression
coefficient (β) and expression level (exprlncRNA) of
each lncRNA in the optimal lncRNA combination. The risk score of
each sample was calculated using the following formula:
Risk score = β lncRNA1 ×
exprlncRNA1 + β lncRNA2 ×
exprlncRNA2 + ··· + βlncRNAn ×
exprlncRNAn.
The samples in the TCGA dataset were divided into
high-risk and low-risk groups according to the median of their risk
scores. Kaplan-Meier survival curves were used to evaluate the
correlation between the overall survival of the samples and the two
groups. Using GSE15459 and GSE54129 as the validation datasets, the
robustness of the risk score system in predicting sample risk and
prognosis was assessed. Moreover, the predictive results of the
risk score system in the training and validation datasets were
compared to identify the optimal model for subsequent analyses.
Differential expression analysis of
notable lncRNAs in multiple datasets
Using the MetaDE.ES algorithm in the R package
MetaDE (version 1.0.5; http://cran.r-project.org/web/packages/MetaDE/)
(47,48), consensus differentially expressed
RNAs (DE-RNAs; between GC and control samples) were screened from
the GSE65801, GSE29998, GSE33335 and GSE27342 datasets.
τ2=0, Qpval>0.05, P<0.05 and FDR<0.05 were set
as the cut-off criteria. The focus was the differential expression
of the notable lncRNAs that were screened as disease or prognosis
related-lncRNAs.
Analysis of lncRNA-associated
pathways
Based on the correlation coefficients between
notable lncRNAs and mRNAs that were located in the same WGCNA
module, the lncRNA-mRNA network was constructed. Subsequently,
pathway enrichment analysis was conducted for the network nodes
using Gene Set Enrichment Analysis (GSEA; http://software.broadinstitute.org/gsea/index.jsp)
(49). A nominal P-value of <0.05
was considered to indicate a statistically significant
difference.
Results
Identification of GC-associated stable
modules based on WGCNA
Following data preprocessing, a total of 988 lncRNAs
and 15,127 mRNAs shared by TCGA dataset, GSE15459 and GSE54129 were
identified. TCGA dataset was taken as the training dataset, whilst
GSE15459 and GSE54129 were used as the validation datasets to
screen for GC-associated RNA modules.
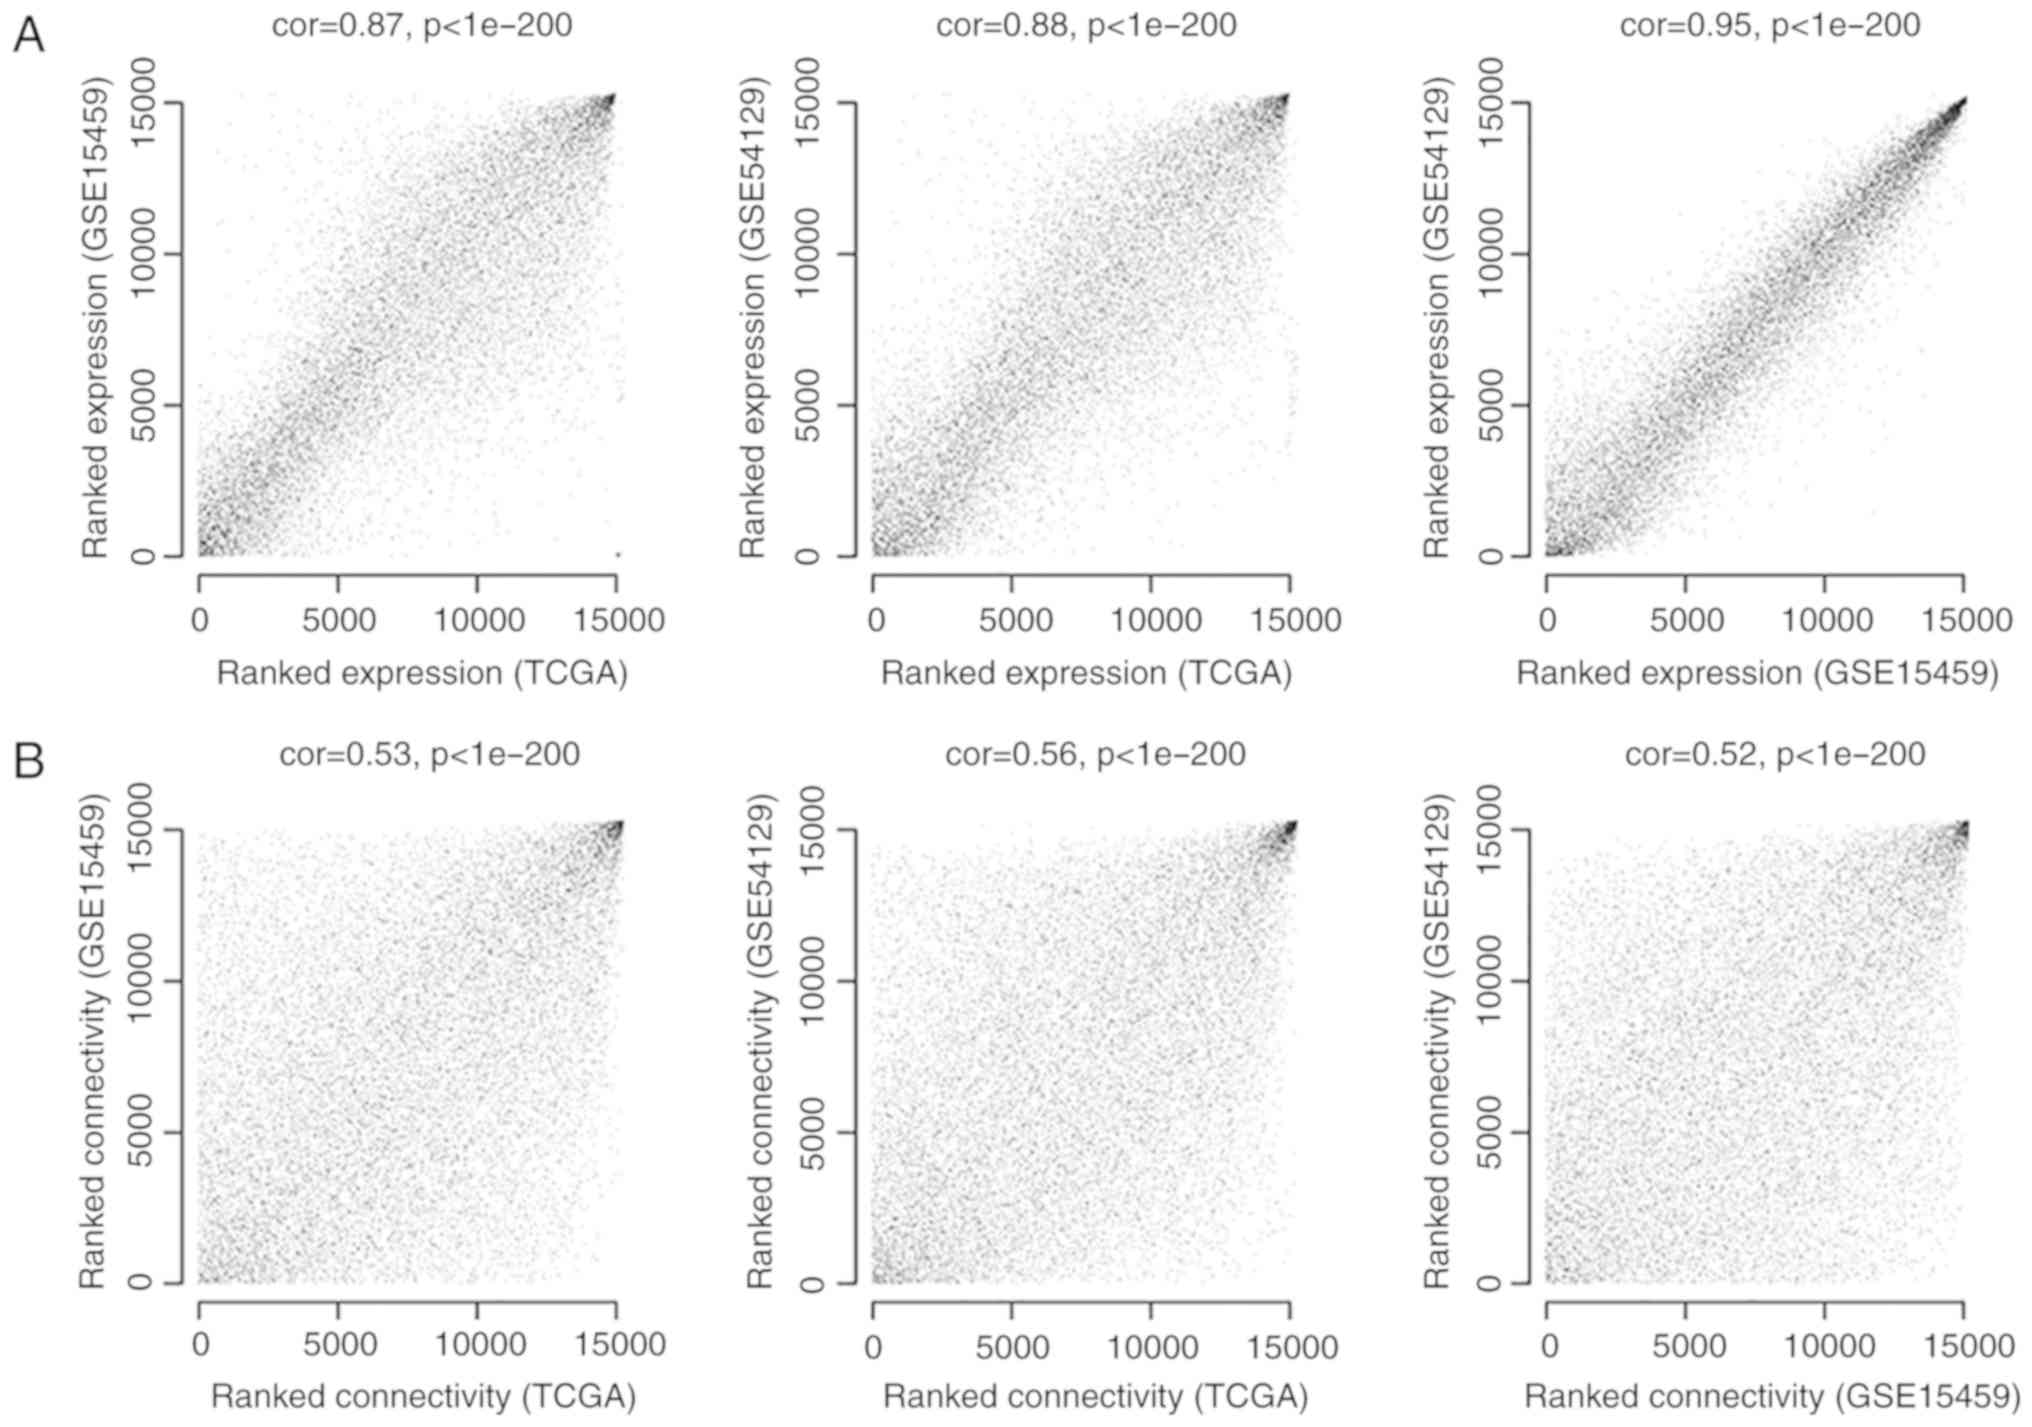
To ensure that the RNA expression levels in each
dataset were comparable, expression consistency analysis was
performed for the expression values of shared RNAs. As outlined in
Fig. 1A, the correlation in
expression between every two of the three datasets was >0.85,
and P-values were <1×10−200, indicating significant
positive correlations between every two datasets and suggesting
that these data sets are comparable and suitable for further
analysis. Additionally, the correlations of connectivity between
nodes were >0.5, and the P-values were <1×10−200,
suggesting that connection correlations between the RNAs of every
two datasets were positive (Fig.
1B).
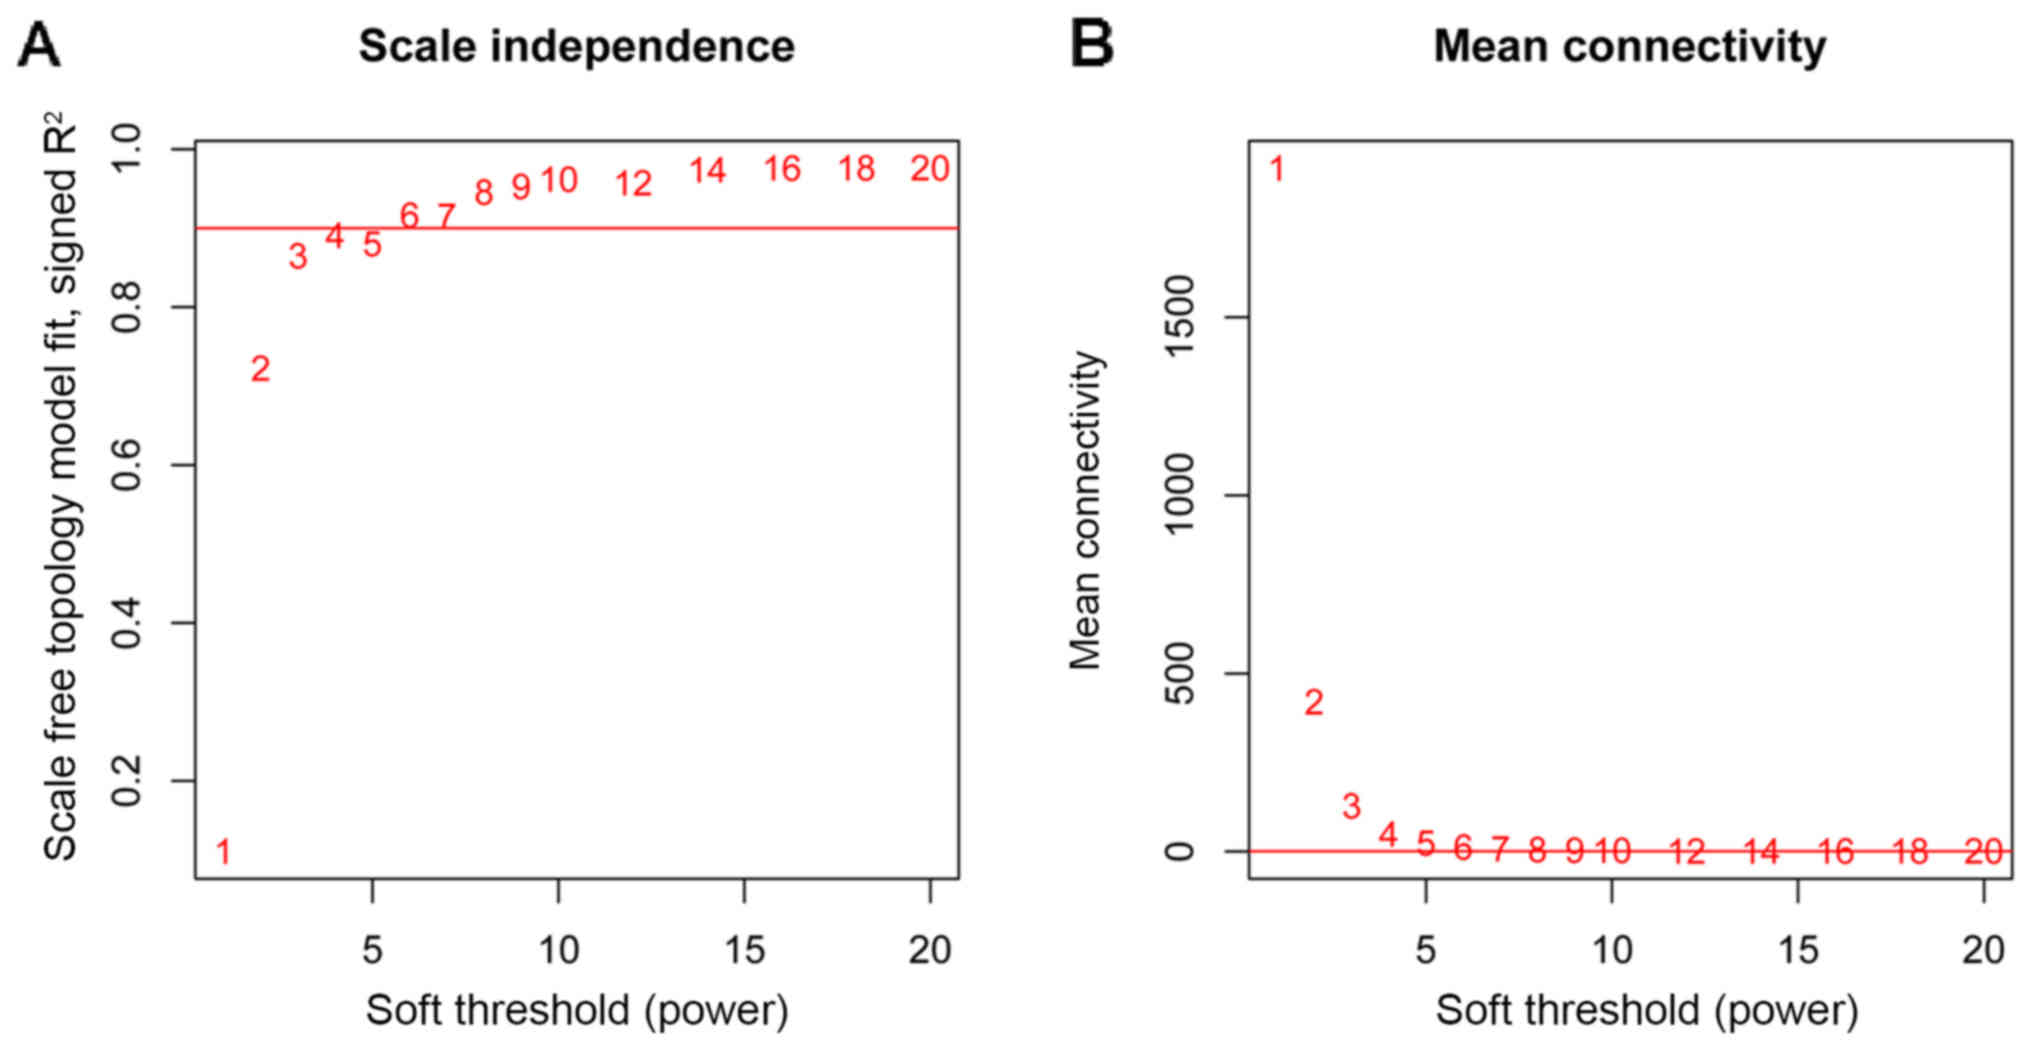
Following definition of the adjacent function, the
power value of 6, for which the square value of the correlation
coefficient reached 0.9 for the first time, was selected (Fig. 2A). Under a power value of 6, the mean
connectivity degree of the RNAs was 2, which conformed to the
small-world property in a scale-free network (Fig. 2B).
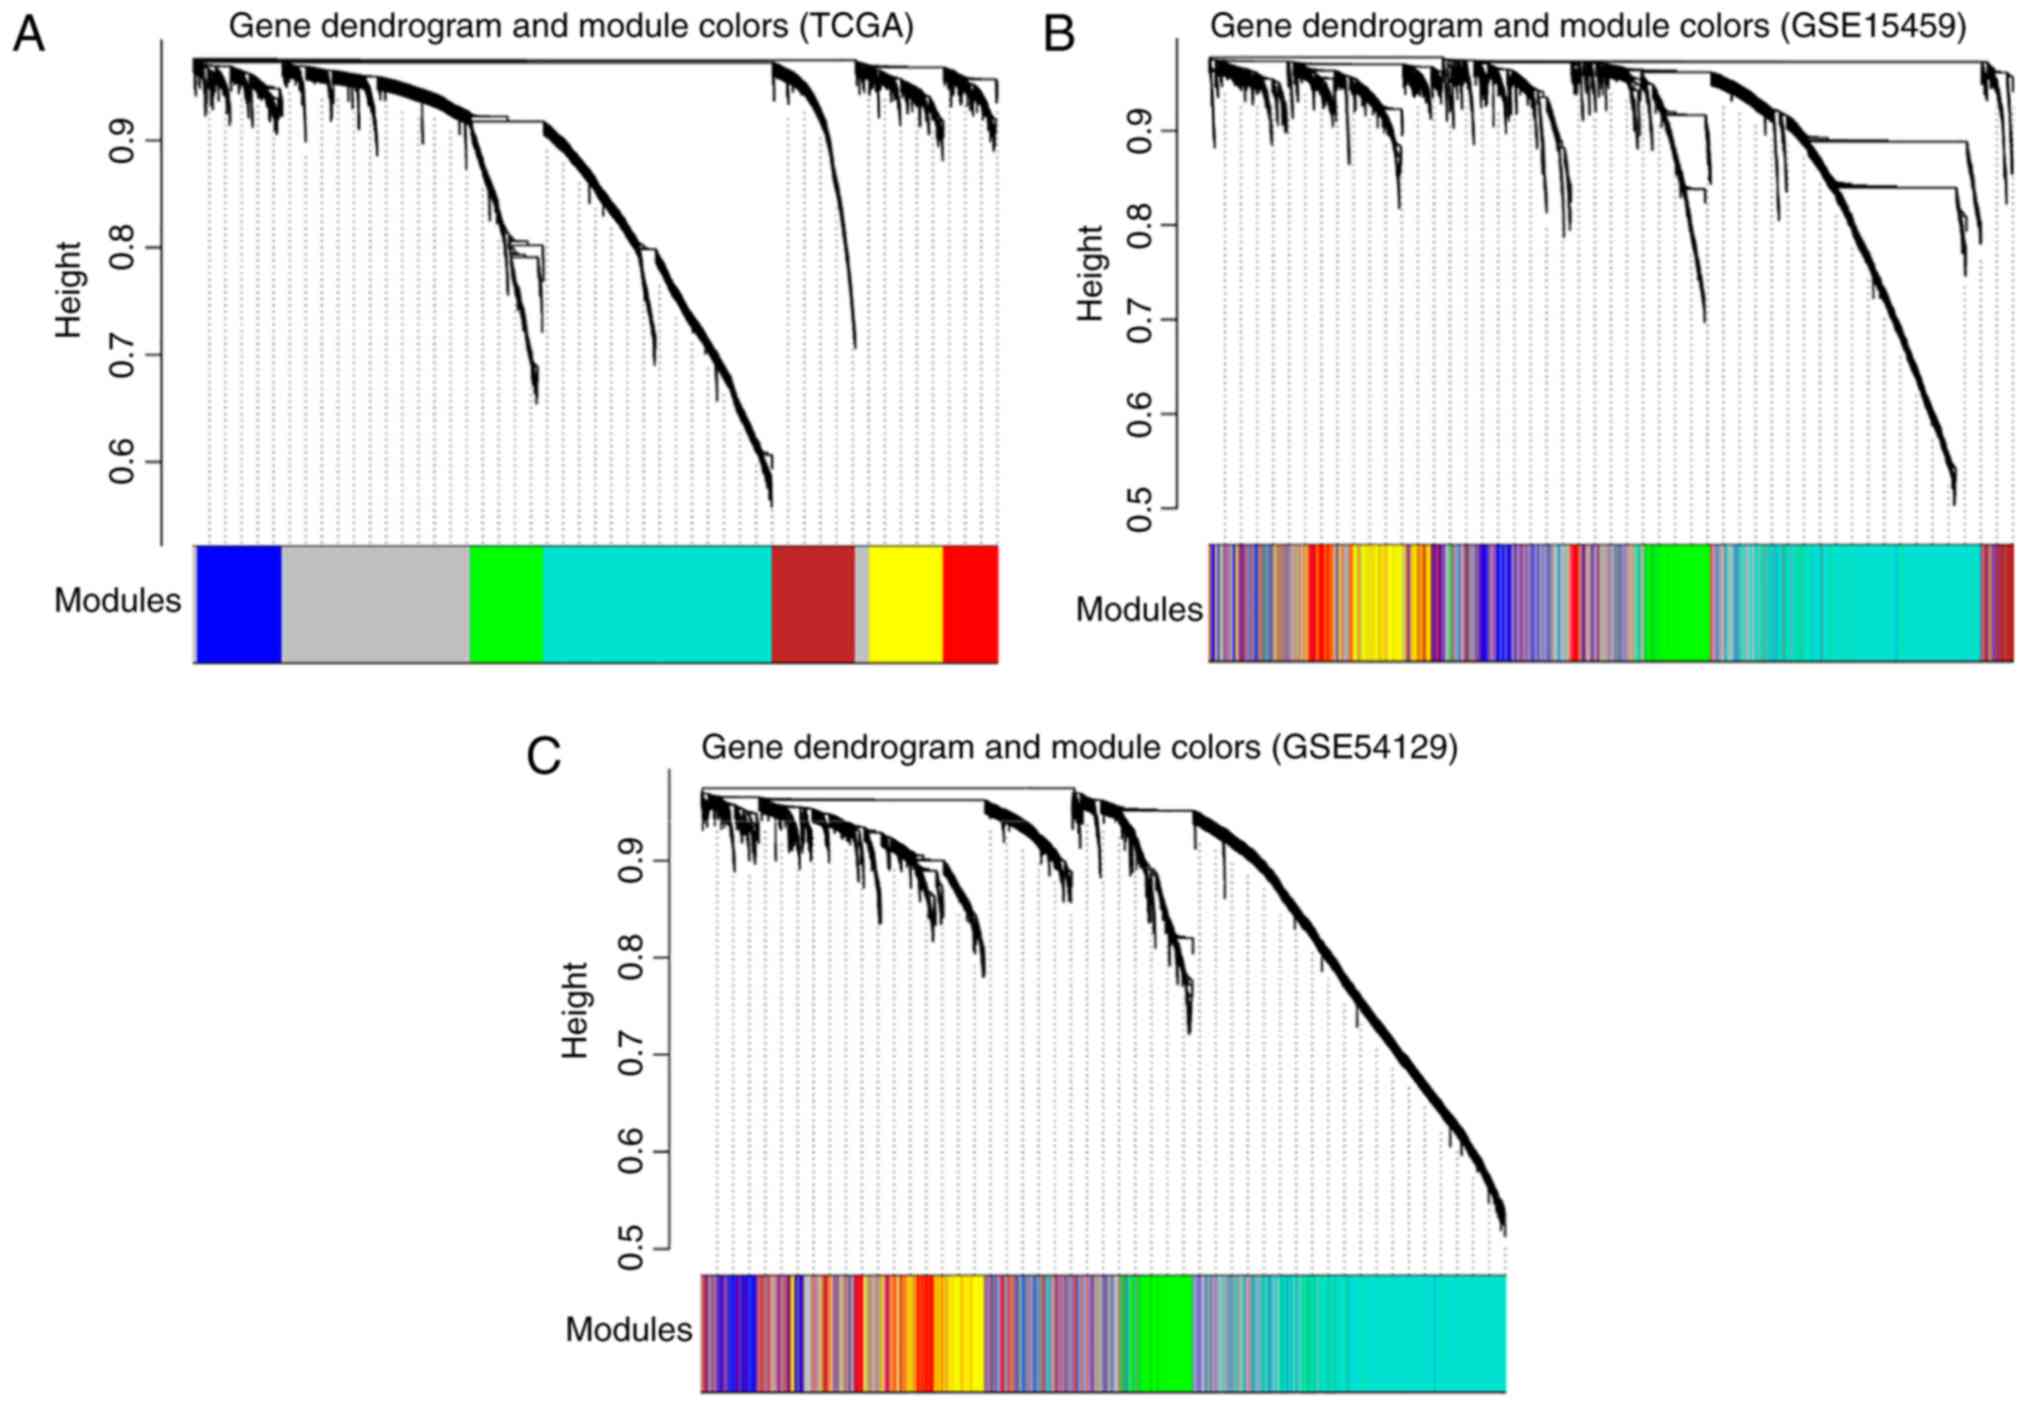
Following construction of the co-expression network
(based on TCGA dataset), the stable modules associated with disease
were screened. A total of seven modules (blue, brown, green, grey,
red, turquoise and yellow) were obtained (Fig. 3A). The differentially expressed
lncRNAs between the tumor and control groups in the seven modules
are listed in Table I. Combined with
the seven modules and the RNAs involved in each module,
corresponding module partition was conducted in GSE15459 (Fig. 3B) and GSE54129 (Fig. 3C).
 | Table I.Differentially expressed lncRNAs
between the tumor and control groups in 7 modules. |
Table I.
Differentially expressed lncRNAs
between the tumor and control groups in 7 modules.
| Group | Module | P-value | FDR | logFC |
|---|
| HOTAIR | Blue |
1.01×10−55 |
1.46×10−53 | 5.2805 |
|
MCF2L-AS1 | Blue |
2.58×10⁻¹⁵ |
3.74×10⁻¹⁴ | 0.9188 |
| GAS5 | Brown |
8.85×10⁻⁷ |
3.38×10⁻⁶ | 0.1977 |
| CASC2 | Green |
5.41×10⁻¹¹ |
3.92×10⁻¹⁰ | 0.7532 |
| CECR3 | Green |
2.06×10⁻¹¹ |
1.66×10⁻¹⁰ | 2.8280 |
|
CPS1-IT1 | Green |
1.58×10⁻² |
2.48×10⁻² | 1.2022 |
| HCG27 | Green |
2.35×10⁻³ |
4.49×10⁻³ | 0.3698 |
| IGF2-AS | Green |
3.12×10⁻⁶ |
1.08×10⁻⁵ | 2.2240 |
|
INHBA-AS1 | Green |
1.85×10⁻² |
2.86×10⁻² | 0.9693 |
|
JAZF1-AS1 | Green |
6.36×10⁻³ |
1.12×10⁻² | −0.5507 |
| KCNQ1DN | Green |
1.59×10⁻² |
2.48×10⁻² | 1.8214 |
|
LINC00032 | Green |
3.31×10⁻³ |
6.15×10⁻³ | 0.8562 |
|
LINC00112 | Green |
1.50×10⁻² |
2.42×10⁻² | 2.1061 |
|
LINC00115 | Green |
1.66×10⁻¹⁰ |
1.09×10⁻⁹ | 0.7638 |
|
LINC00163 | Green |
2.81×10⁻² |
4.16×10⁻² | −1.2973 |
|
LINC00167 | Green |
7.42×10⁻⁴ |
1.58×10⁻³ | 0.5133 |
|
LINC00242 | Green |
1.84×10⁻⁶ |
6.67×10⁻⁶ | 0.6465 |
|
LINC00299 | Green |
2.20×10⁻¹⁶ |
3.99×10⁻¹⁵ | 1.8836 |
|
LINC00326 | Green |
1.72×10⁻³ |
3.47×10⁻³ | 4.7055 |
|
LINC00330 | Green |
1.28×10⁻² |
2.12×10⁻² | −1.9390 |
|
LINC00410 | Green |
4.51×10⁻⁷ |
1.92×10⁻⁶ | 4.2579 |
|
LINC00485 | Green |
2.56×10⁻⁷ |
1.12×10⁻⁶ | 2.6578 |
|
LINC00486 | Green |
3.22×10⁻⁴ |
8.06×10⁻⁴ | 1.6764 |
|
LINC00523 | Green |
1.59×10⁻³ |
3.29×10⁻³ | 3.1421 |
|
LINC00607 | Green |
5.97×10⁻⁷ |
2.40×10⁻⁶ | 1.4066 |
|
WDFY3-AS2 | Green |
6.90×10⁻⁴ |
1.54×10⁻³ | −0.4393 |
|
ADARB2-AS1 | Grey |
1.52×10⁻⁴ |
4.09×10⁻⁴ | 2.0305 |
| TP53TG1 | Grey |
5.11×10⁻⁶ |
1.65×10⁻⁵ | −0.2026 |
| TTTY14 | Grey |
4.86×10⁻⁴ |
1.12×10⁻³ | −1.0856 |
|
AGPAT4-IT1 | Red |
5.75×10⁻⁶ |
1.77×10⁻⁵ | 0.8612 |
| BPESC1 | Red |
1.12×10⁻³ |
2.35×10⁻³ | 1.7243 |
|
BVES-AS1 | Red |
1.82×10⁻⁴ |
4.71×10⁻⁴ | −1.6299 |
| DGCR5 | Red |
6.81×10⁻¹⁵ |
8.98×10⁻¹⁴ | 1.7023 |
| DSCR9 | Red |
8.94×10⁻¹⁴ |
1.08×10⁻¹² | 1.1941 |
|
EPB41L4A-AS1 | Red |
3.87×10⁻² |
5.51×10⁻² | −0.0787 |
| HCG18 | Red |
1.24×10⁻¹² |
1.20×10⁻¹¹ | 0.4696 |
|
LINC00029 | Red |
2.01×10⁻³ |
3.94×10⁻³ | 1.7851 |
|
LINC00467 | Red |
1.06×10⁻¹⁰ |
7.32×10⁻¹⁰ | 0.4418 |
|
LINC00470 | Red |
5.90×10⁻⁶ |
1.78×10⁻⁵ | 1.6068 |
|
LINC00487 | Red |
2.29×10⁻² |
3.49×10⁻² | 0.9837 |
|
LINC00574 | Red |
8.80×10⁻⁵ |
2.45×10⁻⁴ | 0.7952 |
|
MAGI2-AS3 | Red |
3.00×10⁻² |
4.35×10⁻² | −0.4123 |
| MIR17HG | Red |
2.02×10⁻²⁷ |
4.18×10⁻²⁶ | 1.5489 |
|
MORC2-AS1 | Red |
3.08×10⁻¹⁶ |
4.96×10⁻¹⁵ | 0.5989 |
|
SHANK2-AS3 | Red |
1.49×10⁻⁸ |
8.00×10⁻⁸ | 1.6254 |
| TTTY13 | Red |
7.02×10⁻⁴ |
1.54×10⁻³ | 2.8019 |
|
ASMTL-AS1 | Turquoise |
2.97×10⁻¹² |
2.69×10⁻¹¹ | 0.6011 |
|
C20orf166-AS1 | Turquoise |
3.52×10⁻⁴ |
8.64×10⁻⁴ | −1.8050 |
| CCDC26 | Turquoise |
6.66×10⁻³ |
1.15×10⁻² | 0.9937 |
|
CIRBP-AS1 | Turquoise |
2.95×10⁻⁹ |
1.71×10⁻⁸ | 0.6040 |
| CRNDE | Turquoise |
2.43×10⁻³ |
4.58×10⁻³ | 0.4485 |
|
CSNK1G2-AS1 | Turquoise |
3.76×10⁻⁹ |
2.10×10⁻⁸ | 1.2461 |
|
CYP1B1-AS1 | Turquoise |
2.36×10⁻³ |
4.49×10⁻³ | −0.7444 |
| DSCR10 | Turquoise |
5.40×10⁻⁴ |
1.22×10⁻³ | 3.0388 |
|
ENO1-AS1 | Turquoise |
1.73×10⁻⁴ |
4.56×10⁻⁴ | 0.4499 |
|
FBXL19-AS1 | Turquoise |
3.49×10⁻³² |
1.01×10⁻³⁰ | 0.9572 |
| JPX | Turquoise |
3.27×10⁻⁵ |
9.30×10⁻⁵ | 0.2466 |
|
LGALS8-AS1 | Turquoise |
1.04×10⁻⁶ |
3.87×10⁻⁶ | 0.4645 |
|
LINC00052 | Turquoise |
2.46×10⁻⁶ |
8.70×10⁻⁶ | 3.7146 |
|
LINC00161 | Turquoise |
4.63×10⁻⁴ |
1.08×10⁻³ | 0.9597 |
|
LINC00189 | Turquoise |
2.11×10⁻⁸ |
1.09×10⁻⁷ | 1.2475 |
|
LINC00290 | Turquoise |
2.47×10⁻² |
3.73×10⁻² | 2.6024 |
|
LINC00308 | Turquoise |
4.33×10⁻³ |
7.85×10⁻³ | 2.1851 |
|
LINC00309 | Turquoise |
2.65×10⁻⁴ |
6.75×10⁻⁴ | 2.2938 |
|
LINC00311 | Turquoise |
1.32×10⁻² |
2.14×10⁻² | 0.6300 |
|
LINC00323 | Turquoise |
6.57×10⁻³ |
1.15×10⁻² | 0.5396 |
|
LINC00347 | Turquoise |
1.63×10⁻³ |
3.32×10⁻³ | 2.4716 |
|
LINC00471 | Turquoise |
3.59×10⁻⁶ |
1.18×10⁻⁵ | 1.0278 |
|
LINC00477 | Turquoise |
4.83×10⁻³ |
8.64×10⁻³ | 1.4857 |
|
LINC00479 | Turquoise |
4.59×10⁻⁴ |
1.08×10⁻³ | 1.1469 |
|
LINC00482 | Turquoise |
1.02×10⁻⁴ |
2.80×10⁻⁴ | 0.8407 |
|
LINC00518 | Turquoise |
6.17×10⁻⁸ |
2.98×10⁻⁷ | 2.5336 |
|
LINC00582 | Turquoise |
4.52×10⁻⁴ |
1.08×10⁻³ | −1.5306 |
| NBR2 | Turquoise |
1.03×10⁻⁹ |
6.49×10⁻⁹ | 0.3945 |
| NEAT1 | Turquoise |
1.19×10⁻⁵ |
3.45×10⁻⁵ | 0.2762 |
|
NPSR1-AS1 | Turquoise |
9.94×10⁻³¹ |
2.40×10⁻²⁹ | 5.6701 |
|
PCBP1-AS1 | Turquoise |
3.37×10⁻⁸ |
1.69×10⁻⁷ | −0.4557 |
|
RUSC1-AS1 | Turquoise |
7.90×10⁻⁷ |
3.10×10⁻⁶ | 0.1934 |
| ST7-AS2 | Turquoise |
5.65×10⁻⁶ |
1.77×10⁻⁵ | 0.2453 |
|
ZNF295-AS1 | Turquoise |
1.89×10⁻³ |
3.74×10⁻³ | 1.0881 |
|
ZNF503-AS2 | Turquoise |
2.98×10⁻² |
4.35×10⁻² | −0.1638 |
|
C20orf203 | Yellow |
3.31×10⁻² |
4.75×10⁻² | 0.7754 |
| DLEU2 | Yellow |
1.01×10⁻³⁵ |
4.88×10⁻³⁴ | 1.0471 |
| FAM201A | Yellow |
1.42×10⁻⁹ |
8.58×10⁻⁹ | 0.8587 |
| FAM66C | Yellow |
1.54×10⁻² |
2.45×10⁻² | −0.5395 |
| HCG4B | Yellow |
2.42×10⁻⁷ |
1.10×10⁻⁶ | 1.1311 |
| HCG9 | Yellow |
7.28×10⁻³ |
1.24×10⁻² | 0.5412 |
| HCP5 | Yellow |
3.42×10⁻⁶ |
1.15×10⁻⁵ | 0.4477 |
| INE1 | Yellow |
4.51×10⁻¹² |
3.85×10⁻¹¹ | 0.8886 |
|
KIF25-AS1 | Yellow |
1.51×10⁻⁷ |
7.06×10⁻⁷ | 1.7721 |
|
LINC00174 | Yellow |
2.83×10⁻¹³ |
2.93×10⁻¹² | 0.8178 |
|
LINC00265 | Yellow |
4.80×10⁻⁷ |
1.99×10⁻⁶ | 0.5363 |
|
LINC00599 | Yellow |
9.87×10⁻³ |
1.66×10⁻² | 1.5708 |
|
LINC00606 | Yellow |
1.28×10⁻² |
2.12×10⁻² | 4.1423 |
|
LY86-AS1 | Yellow |
7.20×10⁻⁴ |
1.56×10⁻³ | 1.2773 |
| PART1 | Yellow |
6.79×10⁻⁶ |
2.01×10⁻⁵ | −1.5909 |
|
RHPN1-AS1 | Yellow |
6.31×10⁻³³ |
2.29×10⁻³¹ | 1.5361 |
|
SND1-IT1 | Yellow |
1.31×10⁻¹³ |
1.46×10⁻¹² | 1.1209 |
| SOX2-OT | Yellow |
2.75×10⁻² |
4.11×10⁻² | −0.4175 |
|
TP73-AS1 | Yellow |
4.11×10⁻³ |
7.55×10⁻³ | −0.3515 |
| TUG1 | Yellow |
3.08×10⁻¹¹ |
2.35×10⁻¹⁰ | 0.2871 |
|
ZNF252P-AS1 | Yellow |
4.75×10−37 |
3.44×10⁻³⁵ | 1.4731 |
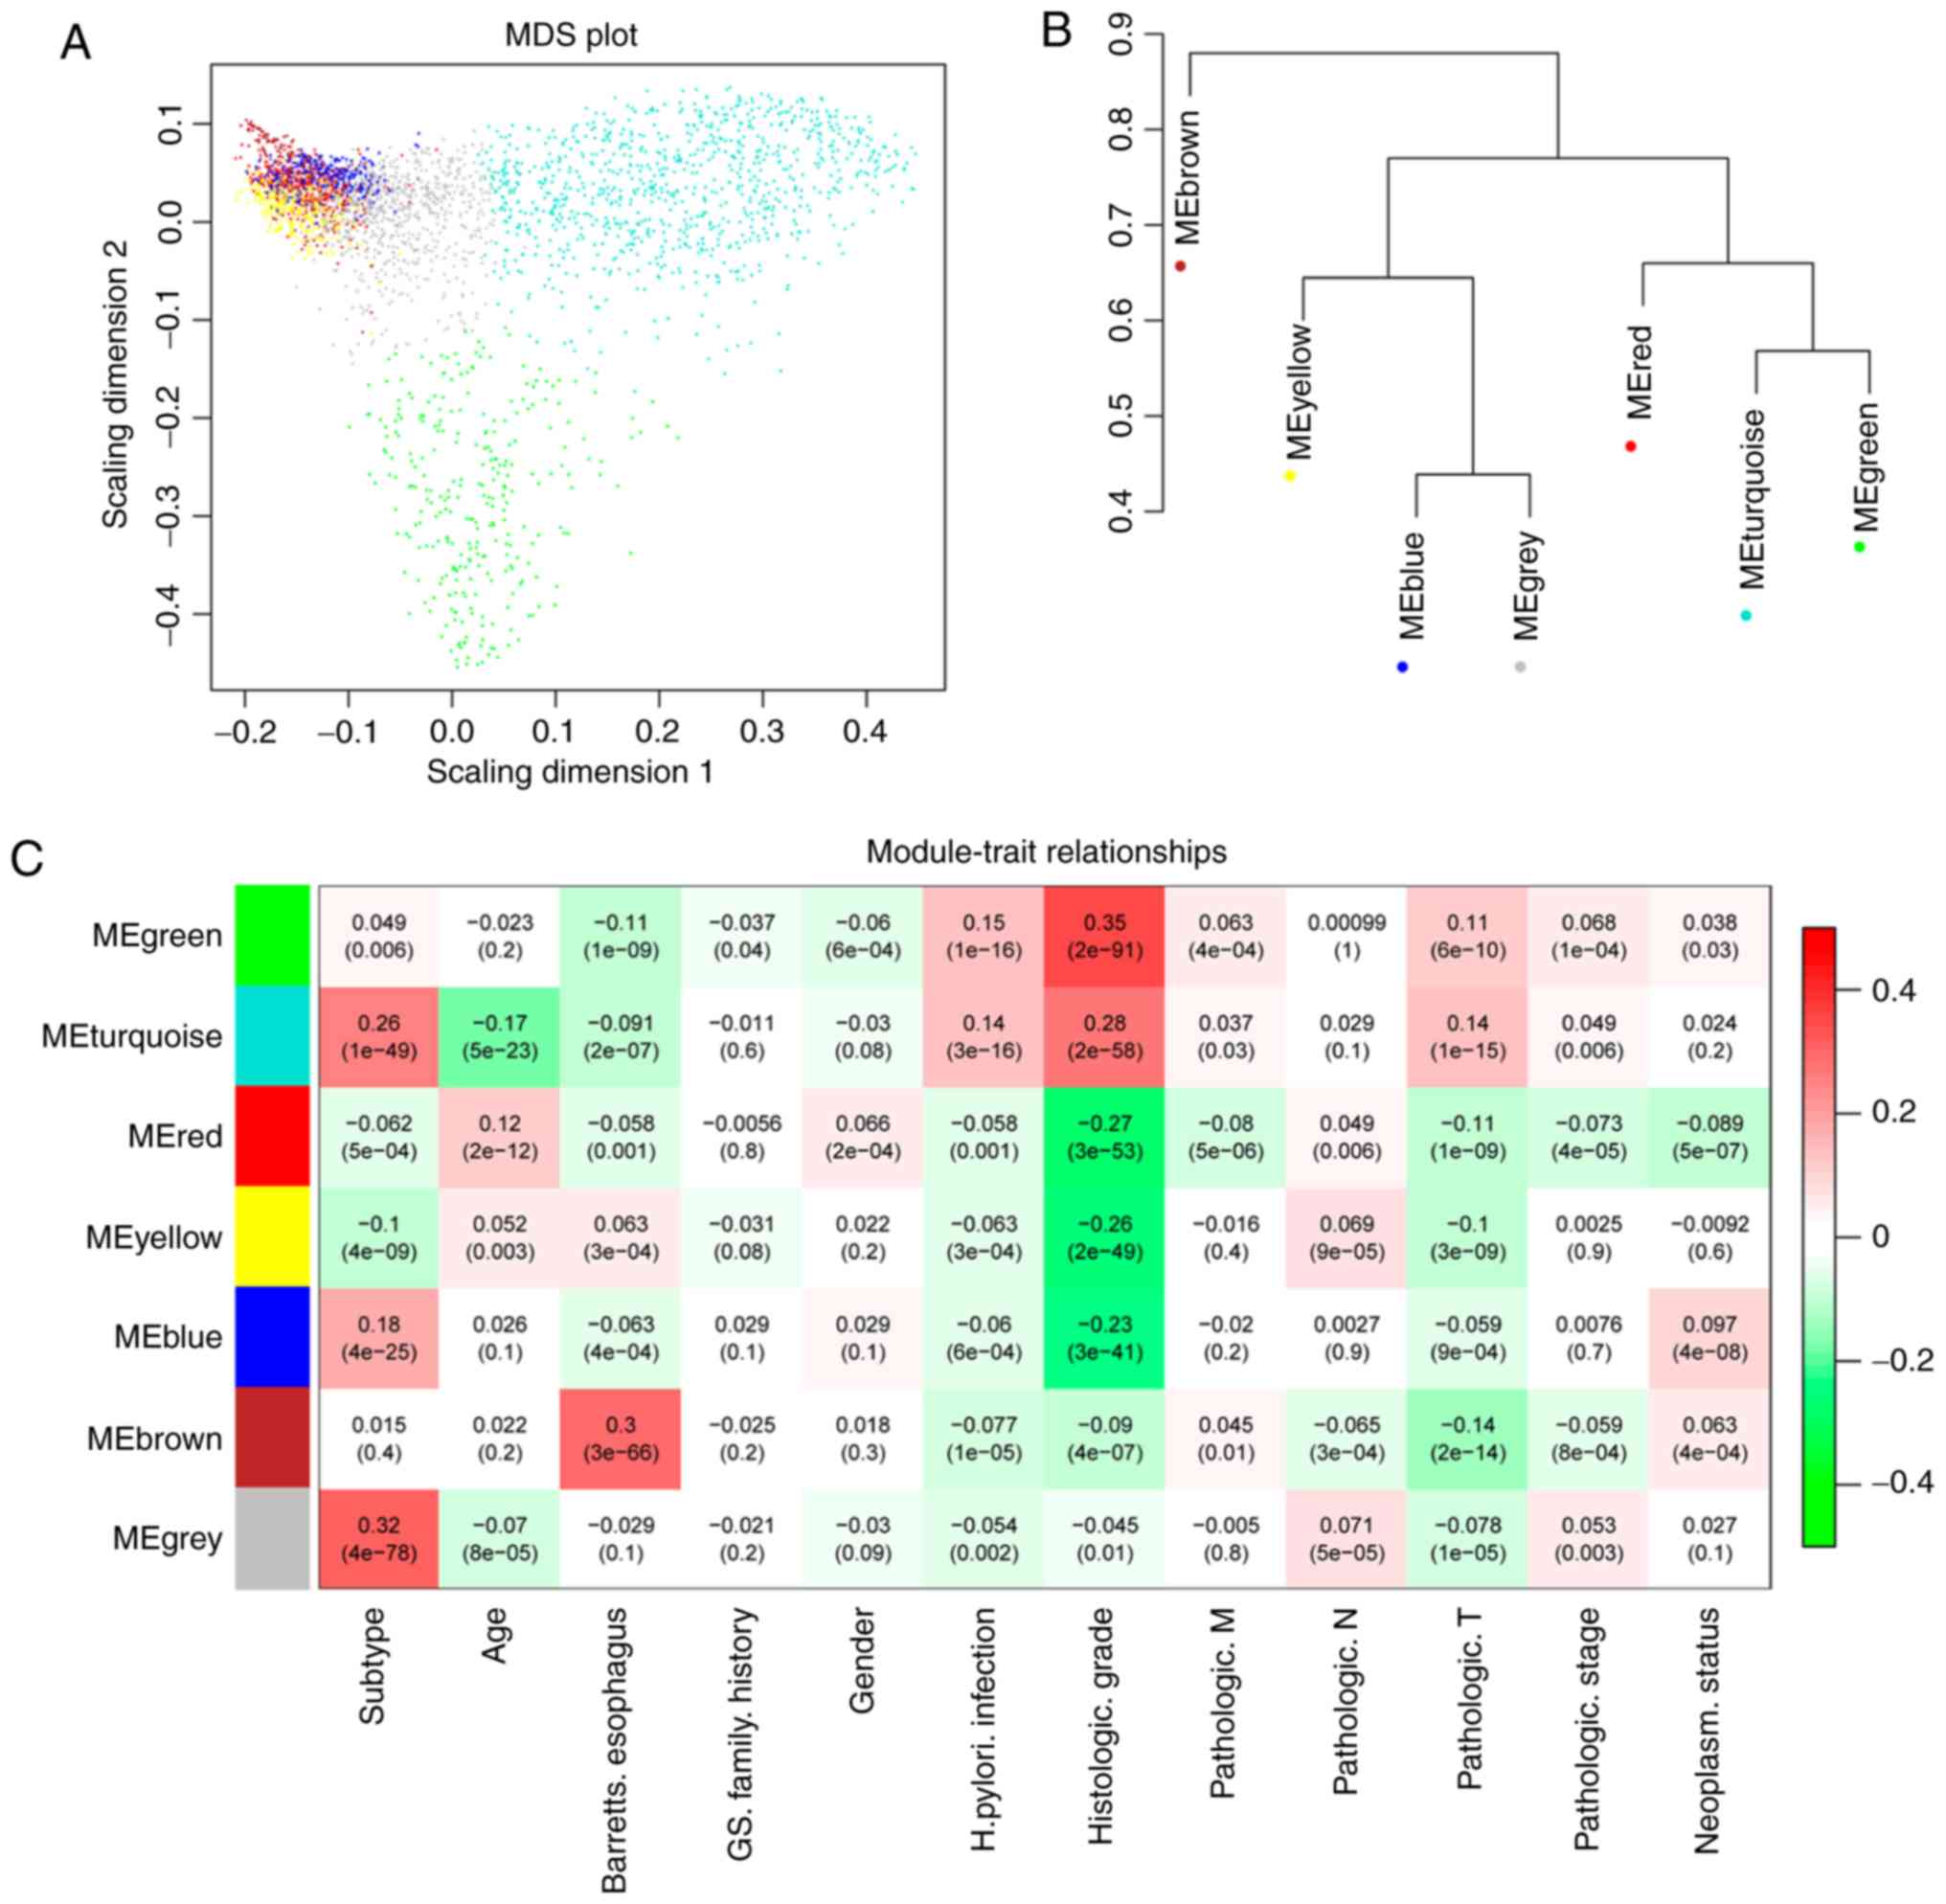
For TCGA dataset, the module partition and module
correlations are presented in Fig.
4. The results illustrate that the RNAs in the same module
tended to cluster together, including the green or blue nodes,
indicating that the RNAs have more similar expression levels
(Fig. 4A). The green and blue
modules have the characteristics of independent branches (Fig. 4B).
The stabilities of the seven modules were assessed,
and the blue, green, red, turquoise and yellow modules were deemed
stable (preservation Z score >5). The top three modules were
turquoise, green and yellow, according to the preservation Z score,
and these three may be associated with GC pathogenesis. Functional
annotation for each stable module revealed that the lncRNAs in the
turquoise (including 46 lncRNAs), green (including 30 lncRNAs) and
yellow (including 32 lncRNAs) modules were predominantly enriched
in cell adhesion, immune response and digestion, respectively
(Table II).
| Table II.Stabilities and functional
annotations of the 7 modules of TCGA dataset. |
Table II.
Stabilities and functional
annotations of the 7 modules of TCGA dataset.
| Module | Color | Module size, n | mRNA | lncRNA | Preservation
Z-score | Module
annotation |
|---|
| 1 | Blue | 336 | 334 | 2 | 9.7094 | Pattern
specification process |
| 2 | Brown | 331 | 328 | 3 | 1.2017 | Epithelium
development |
| 3 | Green | 318 | 288 | 30 | 19.0215 | Immune
response |
| 4 | Grey | 2,856 | 2,822 | 34 | 4.2851 | Cell-cell
signaling |
| 5 | Red | 250 | 213 | 37 | 13.2273 | Digestive system
process |
| 6 | Turquoise | 956 | 910 | 46 | 27.4163 | Cell adhesion |
| 7 | Yellow | 326 | 294 | 32 | 15.7692 | Digestion |
In addition, based on the clinical information in
TCGA dataset, the correlation between each module and the clinical
factors was analyzed. Among the 5 stable modules, the green and
turquoise modules correlated significantly with histological grade
(Fig. 4C). Therefore, the green and
turquoise modules were further analyzed.
Selection of prognosis-associated
lncRNAs
Based on the 76 lncRNAs in the green and turquoise
modules, 12 prognosis-associated lncRNAs were identified in TCGA
dataset using univariate Cox regression analysis. Among the 12
prognosis-associated lncRNAs, 5 belonged to the green module and 7
were from the turquoise module.
Construction and assessment of risk
score system
Based on the expression levels of 12
prognosis-associated lncRNAs in TCGA dataset, the optimal lncRNA
combinations that correlated with prognosis were selected using the
Cox-PH model. 5-lncRNA, 5-lncRNA and 8-lncRNA (Table III) optimal combinations were
separately screened from the prognosis-associated lncRNAs in the
green, turquoise and green + turquoise modules, respectively. The
risk score systems based on each optimal lncRNA combination were as
follows: Risk score (green module) = (−0.9059377) ×
ExpITPK1-AS1 + (3.3537827) ExpKCNQ1DN +
(−2.1388024) × ExpLINC00167 + (−1.037547) ×
ExpLINC00173 + (1.9587271) × ExpLINC00307.
Risk score (turquoise module)=(−0.268429) × ExpASMTL-AS1
+ (−0.3410407) × ExpCIRBP-AS1 + (1.0926567) ×
ExpDSCR10 + (−0.3433227) × ExpJPX +
(0.5437058) × ExpLINC00479. Risk score (green +
turquoise module)=(1.9685961) × ExpKCNQ1DN +
(−0.6567239) × ExpLINC00167 + (−0.4293328) ×
ExpLINC00173 + (−0.246053) × ExpASMTL-AS1 +
(−0.25746771) × ExpCIRBP-AS1 + (0.7023183) ×
ExpDSCR10 + (−0.3204003) × ExpJPX +
(0.5495452) × ExpLINC00479.
| Table III.Optimal lncRNAs screened from the
prognosis-associated lncRNAs in green, turquoise and green +
turquoise modules. |
Table III.
Optimal lncRNAs screened from the
prognosis-associated lncRNAs in green, turquoise and green +
turquoise modules.
| Modules | lncRNA | β-value | P-values | Hazard ratio (95%
CI) |
|---|
| Green |
ITPK1-AS1 | −0.9059 | 0.0496 | 0.0777
(0.0039–1.5300) |
|
| KCNQ1DN | 3.3538 | 0.0050 | 13.7200
(2.1360–18.1400) |
|
|
LINC00167 | −2.1388 | 0.0284 | 0.0500
(0.0035–0.7191) |
|
|
LINC00173 | −1.0376 | 0.0480 | 0.4930
(0.2229–1.0900) |
|
|
LINC00307 | 1.9587 | 0.0357 | 2.0260
(1.0430–3.9380) |
| Turquoise |
ASMTL-AS1 | −0.2684 | 0.0270 | 0.6392
(0.4302–0.9498) |
|
|
CIRBP-AS1 | −0.3410 | 0.0458 | 0.6489
(0.4146–1.0160) |
|
| DSCR10 | 1.0927 | 0.0039 | 4.4030
(1.5400–12.5900) |
|
| JPX | −0.3433 | 0.0470 | 0.6624
(0.4243~1.0340) |
|
|
LINC00479 | 0.5437 | 0.0231 | 1.9880
(1.0900–3.6260) |
| Green +
turquoise | KCNQ1DN | 1.9686 | 0.0029 | 3.3500
(1.3101–5.3910) |
|
|
LINC00167 | −0.6567 | 0.0476 | 0.0790
(0.0048–1.3100) |
|
|
LINC00173 | −0.4293 | 0.0482 | 0.4338
(0.1693–1.1110) |
|
|
ASMTL-AS1 | −0.2461 | 0.0238 | 0.7758
(0.5088–1.1830) |
|
|
CIRBP-AS1 | −0.2575 | 0.0489 | 0.8482
(0.5322–1.3520) |
|
| DSCR10 | 0.7023 | 0.0208 | 2.2280
(1.6399–7.7580) |
|
| JPX | −0.3204 | 0.0131 | 0.6847
(0.4187–1.1200) |
|
|
LINC00479 | 0.5495 | 0.0337 | 1.9057
(1.0510–3.4550) |
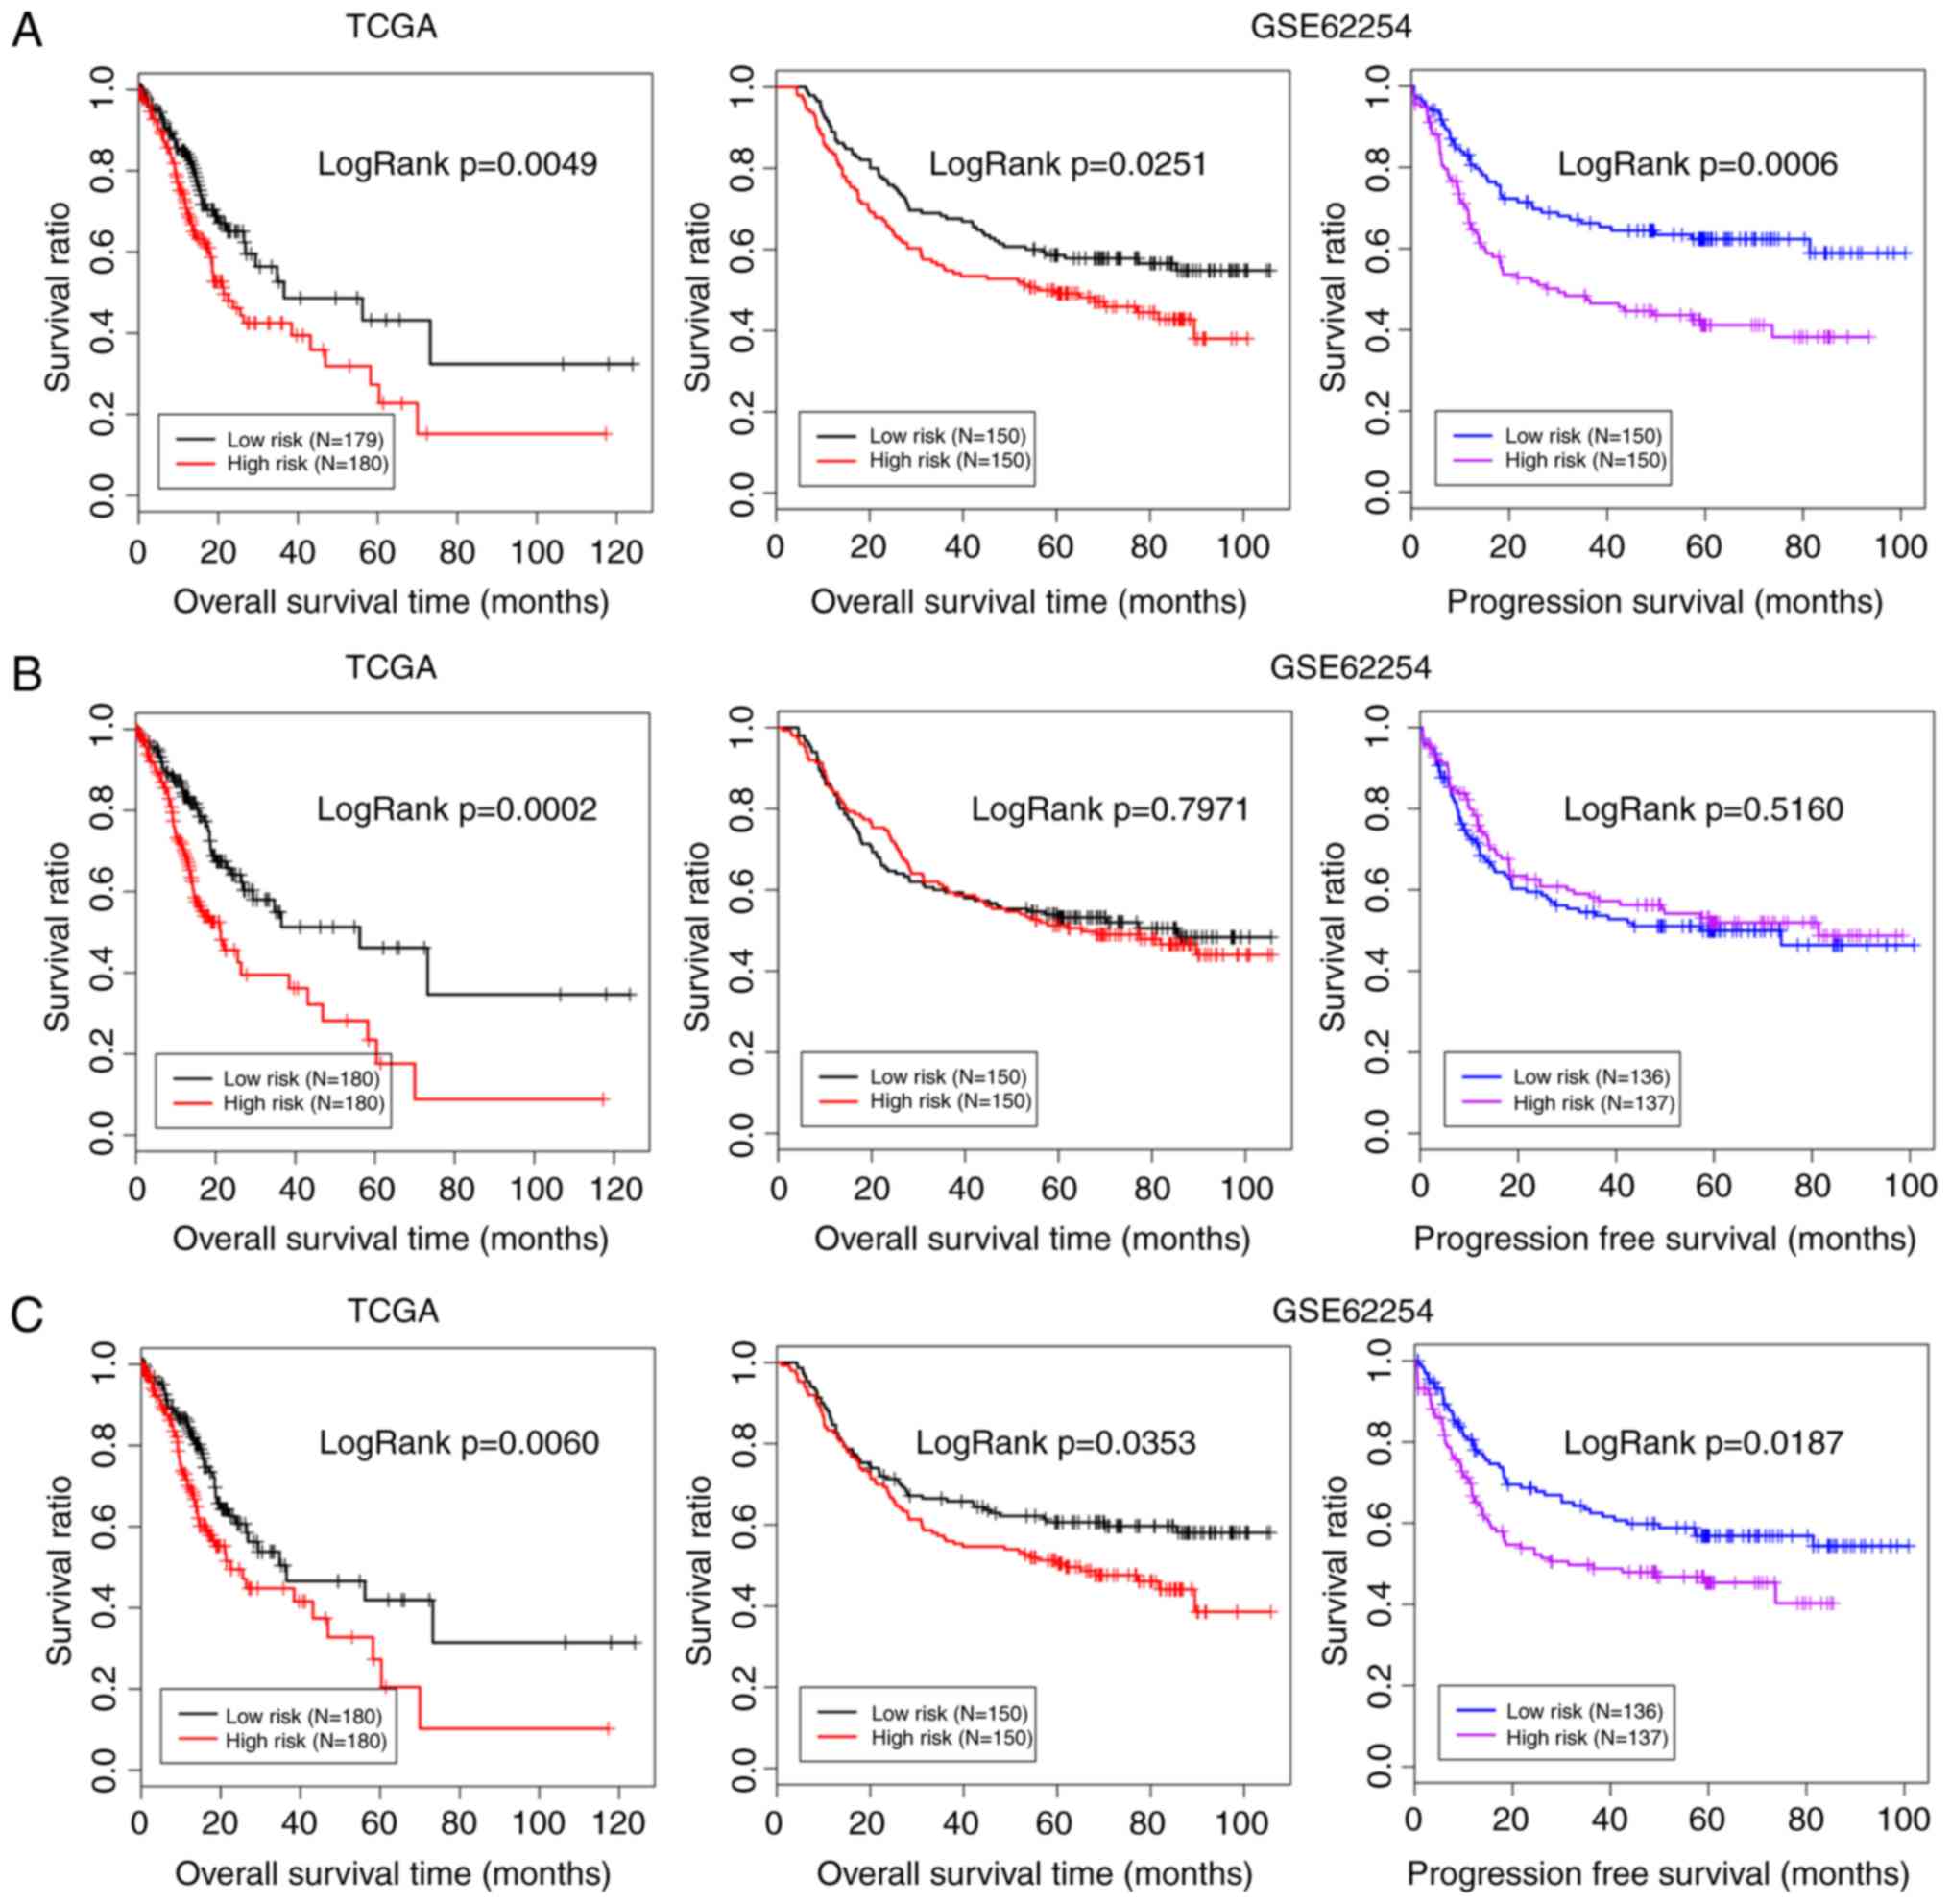
Based on the three risk score systems, the risk
scores of the samples in TCGA dataset were calculated. The samples
in the TCGA dataset were divided into high-risk and low-risk groups
according to the median of their risk scores. Kaplan-Meier survival
curves were used to evaluate the correlation between the overall
survival of the samples and the two groups. The results revealed
that the risk score system based on the optimal lncRNA combination
[including ITPK1 antisense RNA 1 (ITPK1-AS1), KCNQ1
downstream neighbor (KCNQ1DN), long intergenic non-protein
coding RNA 167 (LINC00167), LINC00173 and LINC00307]
of the green module had the most significant predictive effect;
therefore, the risk score system of the green module was the
optimal system (Fig. 5). In this
risk score system, the low-risk group (mean overall survival time,
16.71±18.26 months) had a greater overall survival time compared
with the high-risk group (mean overall survival time, 13.63±15.76
months) for the TCGA training dataset. In addition, the correlation
between overall survival and the two groups was significant
(P=0.0049). For the validation dataset GSE62254, the low-risk group
(mean overall survival time, 57.13±30.88 months; mean
progression-free survival time, 42.34±30.26 months) also had a
greater overall survival time and progression-free survival time
relative to the high-risk group (mean overall survival time,
46.98±29.97 months; mean progression-free survival time,
30.91±27.97 months). Similarly, the two groups were significantly
correlated with overall survival time (P=0.0251) and
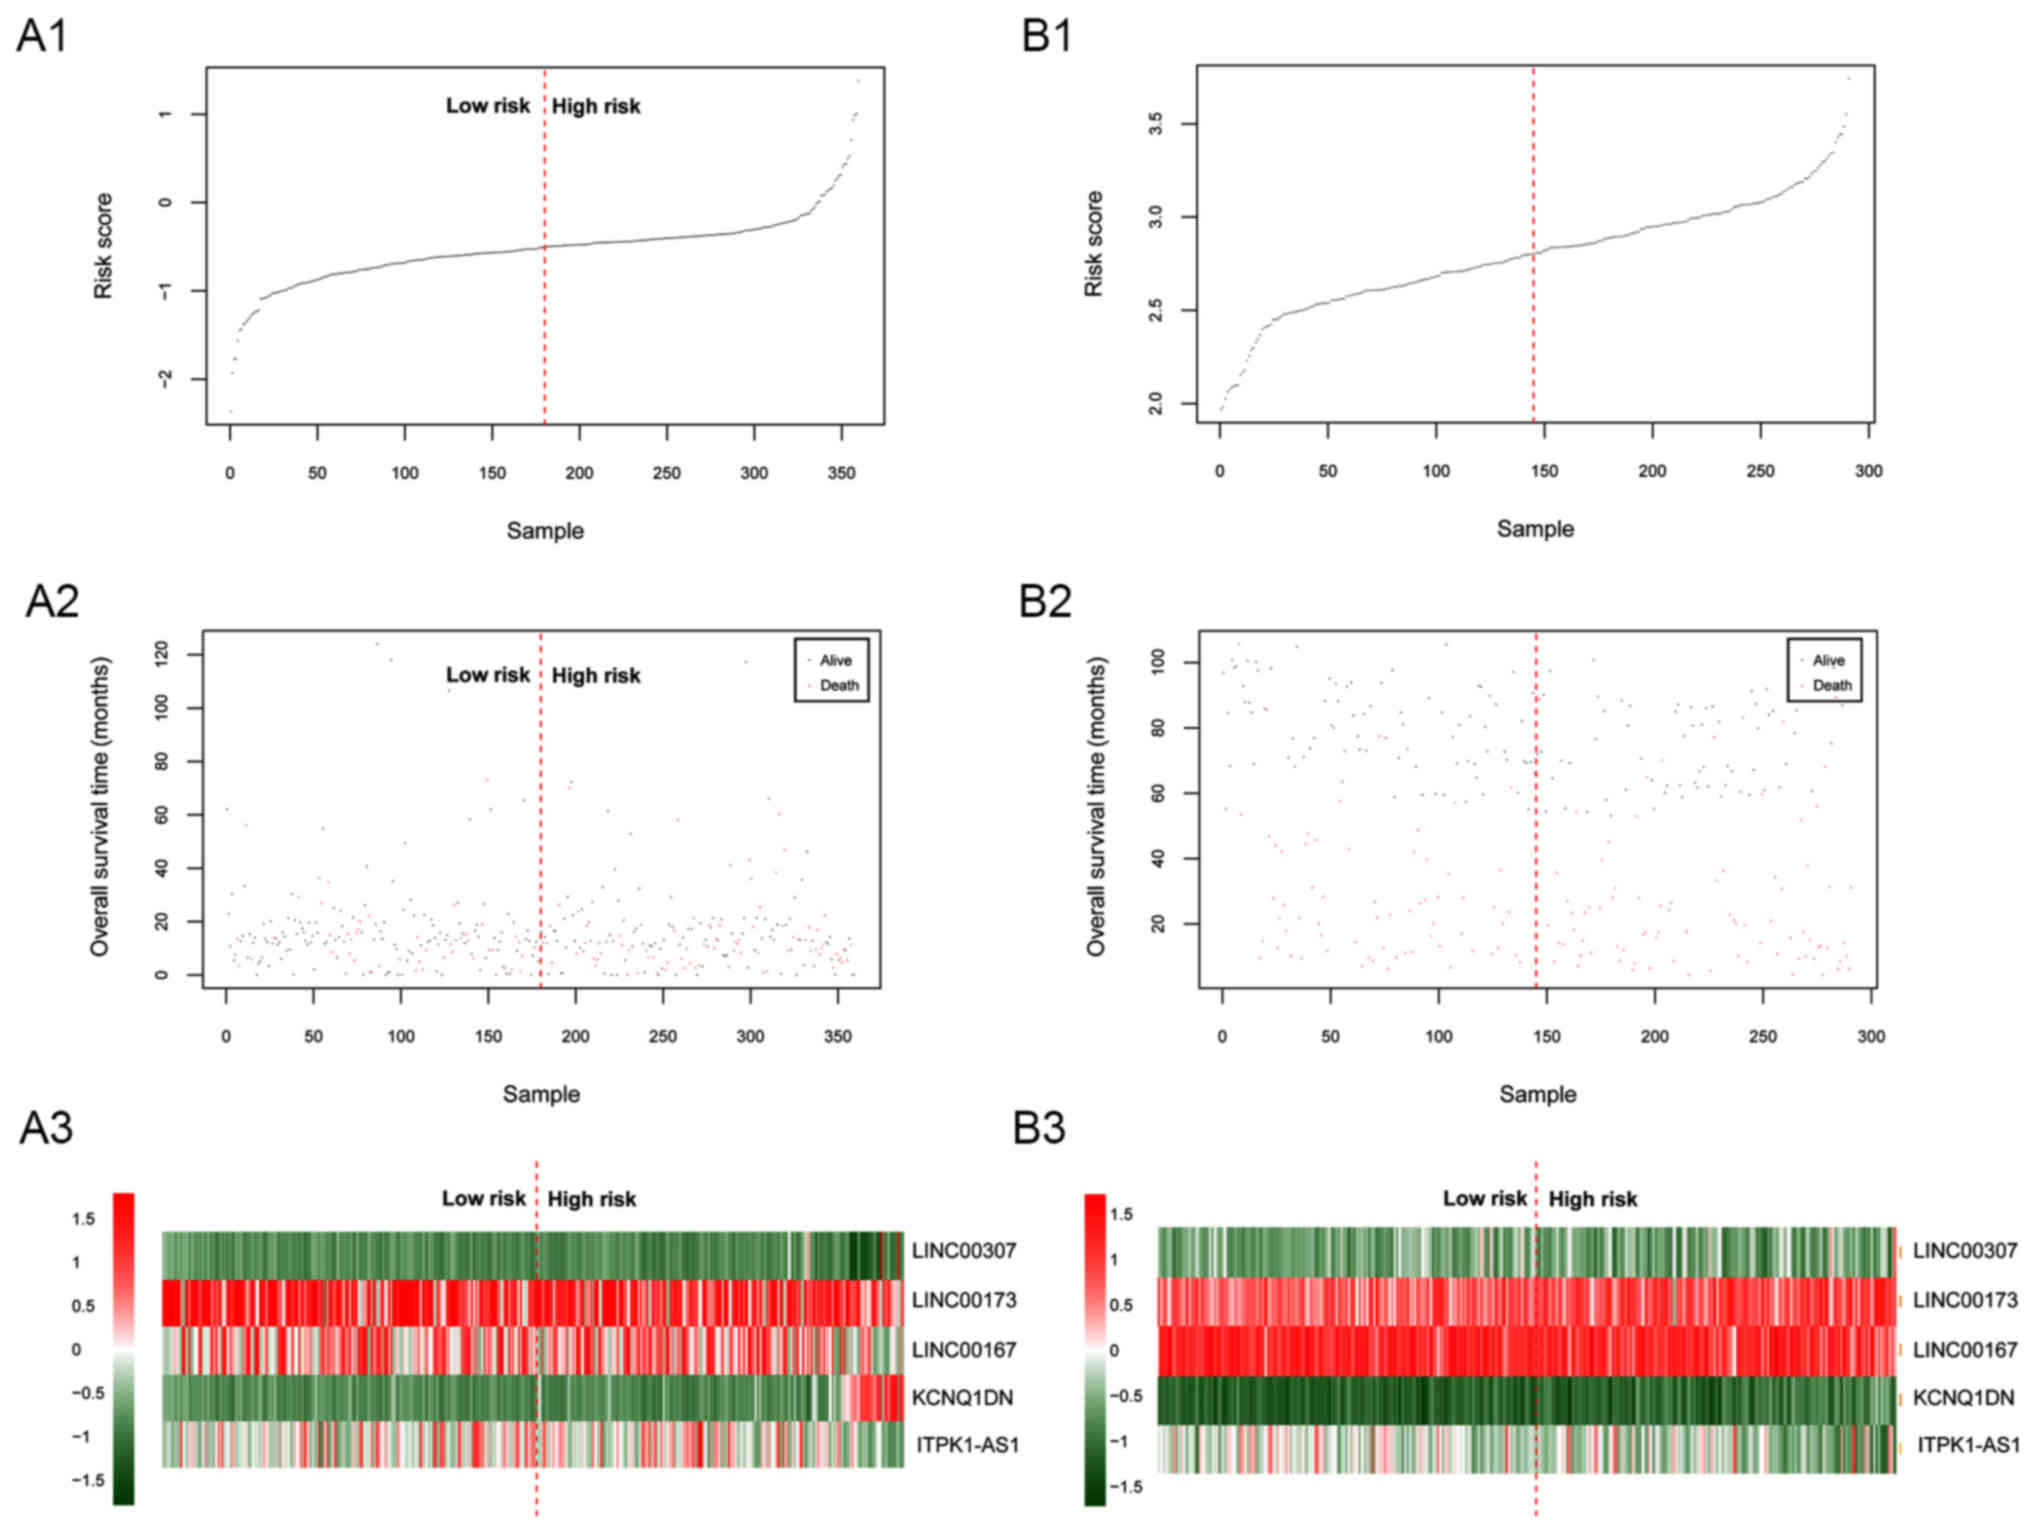
progression-free survival time (P=0.0006). Additionally, the
associations between the risk score and survival status/lncRNA
expression are displayed in Fig. 6.
The risk score altered from low to high on the vertical axis; in
the middle panels, red represents mortality, and black represents
survival, which represented the distribution of mortality and
survival at high and low risk in addition to the distribution of
survival time. Fig. 6 reveals the
expression trend of 5 genes from low risk to high risk (for
example, LINC00307 expression tends to be decreased, while
KCNQ1DN expression tends to be increased).
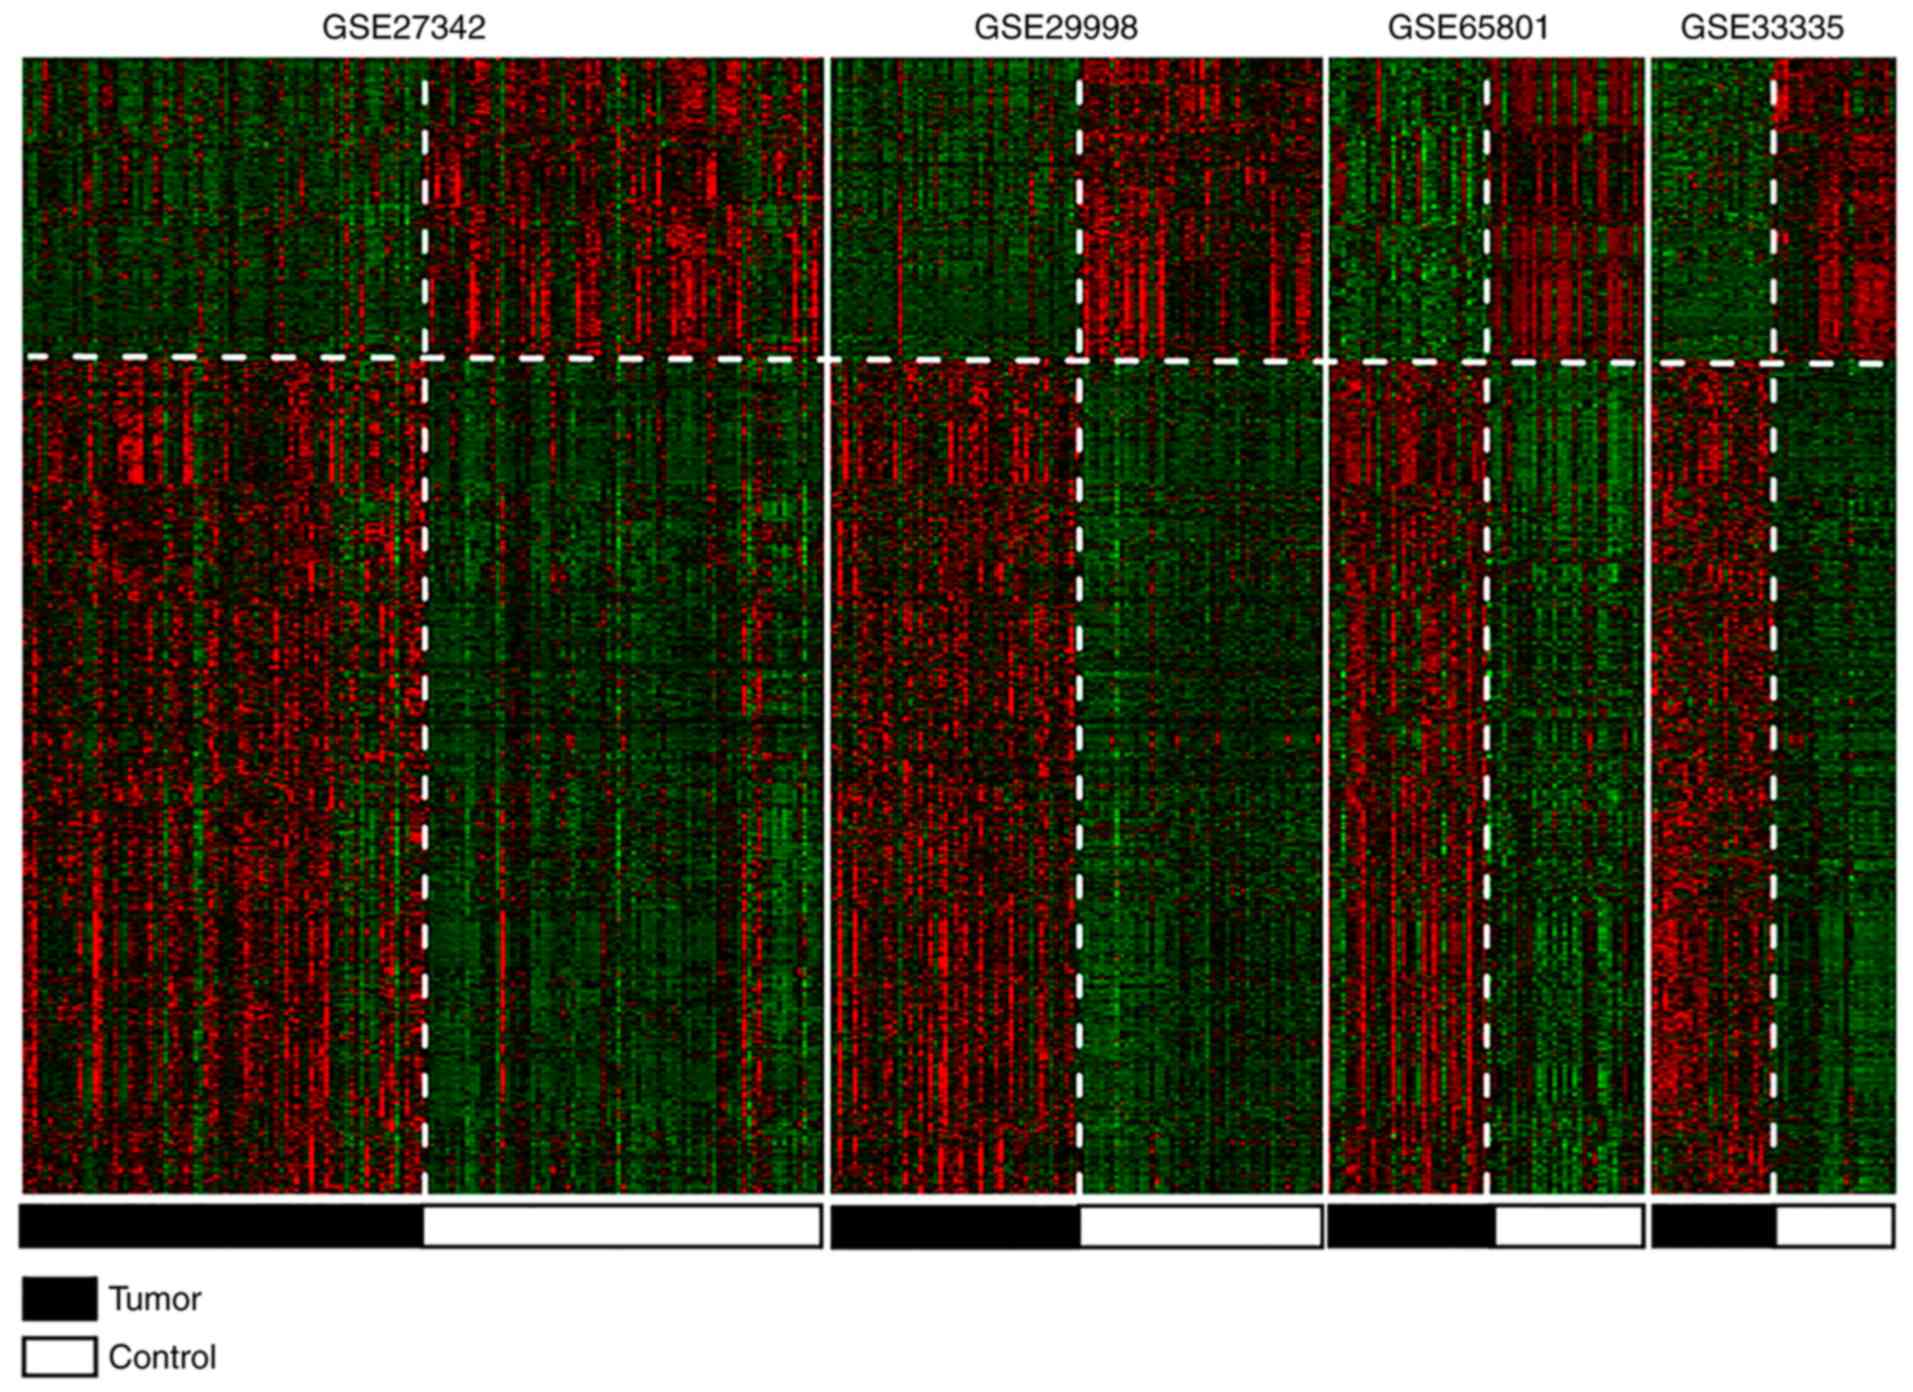
Differential expression analysis
There were a total of 1,105 consensus DE-RNAs (all
were mRNAs) in the GSE65801, GSE29998, GSE33335 and GSE27342
datasets, including 22 mRNAs (2 upregulated and 20 downregulated)
in the green module. The clustering heat map demonstrates that the
different degrees and dysregulation directions of the DE-RNAs were
essentially the same in the 4 datasets (Fig. 7).
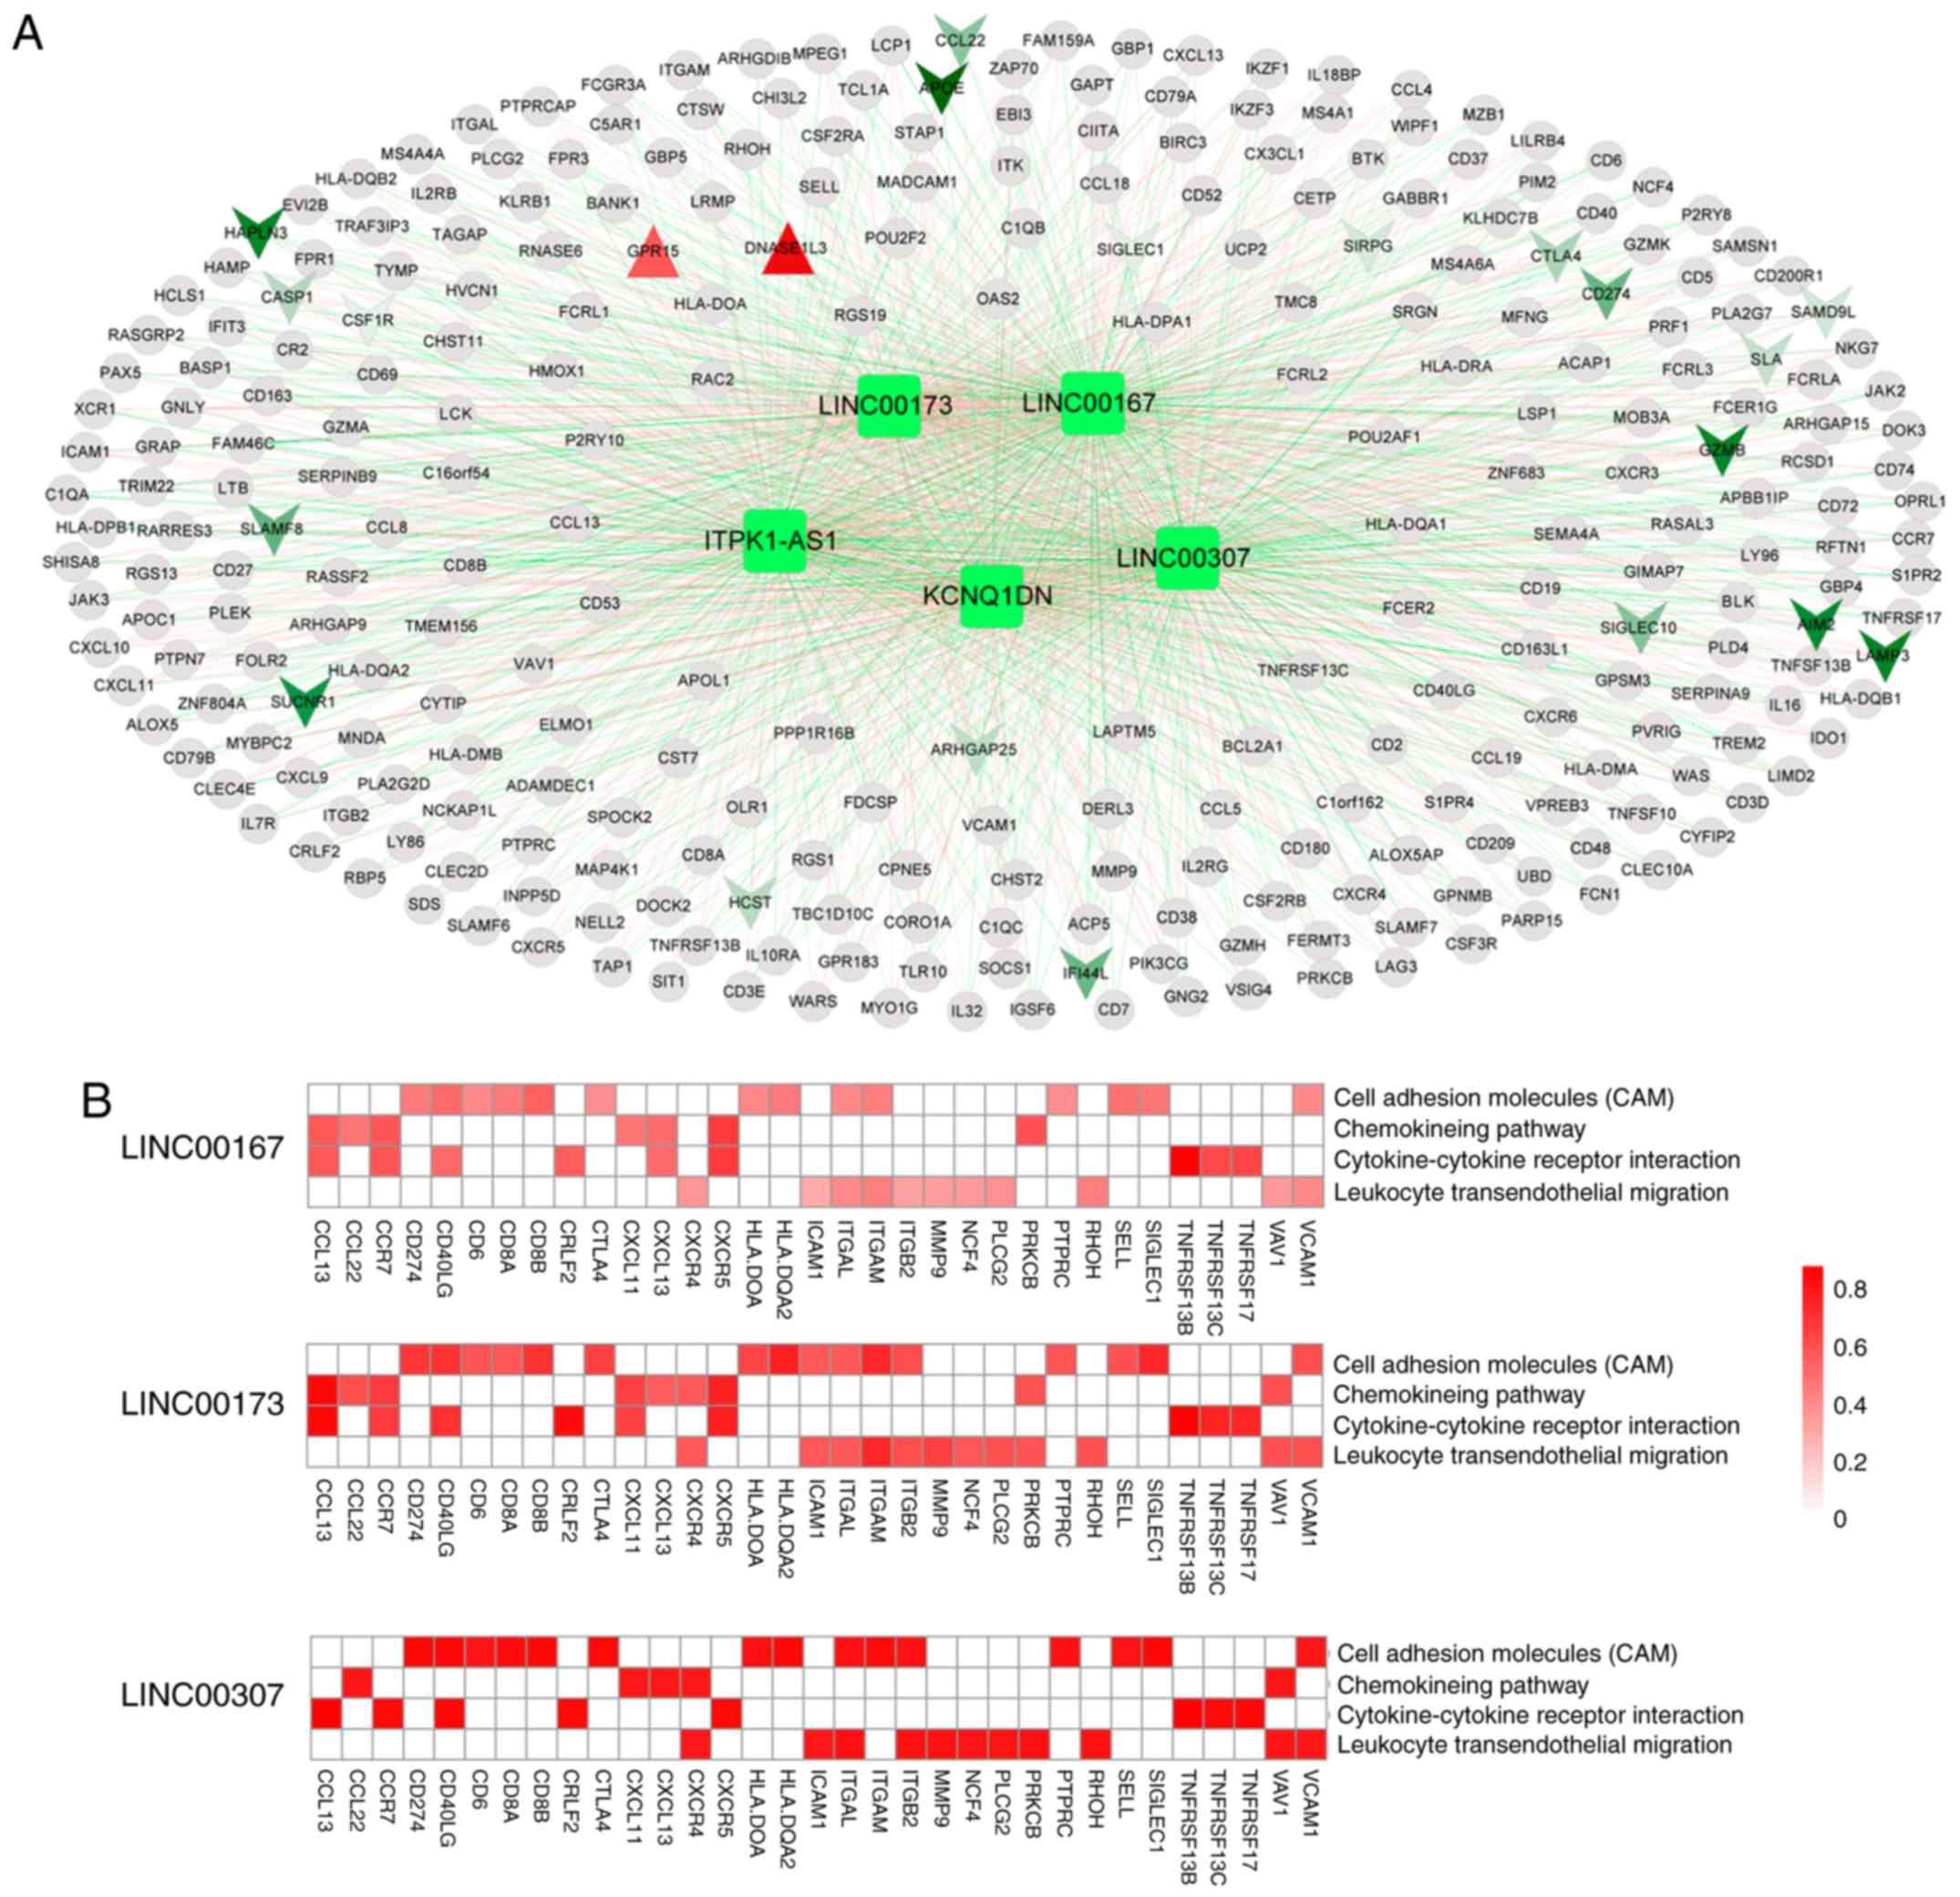
Analysis of lncRNA-associated
pathways
Based on the correlation coefficients of the 5
optimal lncRNAs in the green module, and the 22 mRNAs obtained as
aforementioned, the lncRNA-mRNA network (involving 106 nodes) was
constructed (Fig. 8A). GSEA analysis
illustrated that 4 pathways [‘cell adhesion molecules (CAMS)’,
‘cytokine-cytokine receptor interaction’, the ‘chemokine signaling
pathway’ and ‘leukocyte transendothelial migration’] had
significant positive associations with 3 lncRNAs (LINC00167,
LINC00173 and LINC00307) (Table IV). Moreover, the 4 pathways
involved a total of 32 genes [including chemokine (C-C motif)
ligand 22 (CCL22), chemokine (C-C motif) receptor 7
(CCR7), cluster of differentiation (CD) 274 molecule
(CD274), CD40 ligand (CD40LG), chemokine (C-X-C
motif) ligand 13, CXCL13; chemokine (C-X-C motif) receptor 5
(CXCR5), intercellular adhesion molecule 1 (ICAM1),
matrix metalloproteinase 9 (MMP9) and vascular cell adhesion
molecule 1 (VCAM1)], and these genes associated positively
with the 4 pathways (Fig. 8B).
Therefore, it was speculated that LINC00167, LINC00173 and
LINC00307 may possess the same association directions with
the 4 pathways and the 32 genes, and are involved in GC progression
via these pathways.
| Table IV.Pathways that positively correlate
with LINC00167, LINC00173 and LINC00307. |
Table IV.
Pathways that positively correlate
with LINC00167, LINC00173 and LINC00307.
|
|
LINC00167 |
LINC00173 |
LINC00307 |
|---|
|
|
|
|
|
|---|
| Pathway | ES | NES | P-value | ES | NES | P-value | ES | NES | P-value |
|---|
| Cell adhesion
molecules | 0.1598 | 1.1790 | 0.0096 | 0.1654 | 1.3800 | 0.0011 | 0.1465 | 0.8646 | 0.0058 |
| Cytokine-cytokine
receptor interaction | 0.2250 | 0.9947 | 0.0451 | 0.2052 | 1.0447 | 0.0357 | 0.1136 | 0.7058 | 0.0484 |
| Chemokine signaling
pathway | 0.2305 | 1.0060 | 0.0429 | 0.1052 | 0.5347 | 0.0469 | −0.1560 | −1.0490 | 0.0335 |
| Leukocyte
transendothelial migration | −0.1690 | −0.7141 | 0.0461 | 0.2331 | 0.1563 | 0.0137 | −0.1860 | −0.7750 | 0.0480 |
Discussion
In the present study, 5 stable modules (blue, green,
red, turquoise and yellow) were identified using WGCNA. In
particular, the green and turquoise modules associated
significantly with histological grade. Subsequently, 12
prognosis-associated lncRNAs (5 lncRNAs in the green module and
seven lncRNAs in the turquoise module) were identified. Moreover,
5-lncRNA, 5-lncRNA and 8-lncRNA optimal combinations were screened
separately from the prognosis-associated lncRNAs in the green,
turquoise and green + turquoise modules, respectively, which were
used to construct risk score systems. Notably, the risk score
system based on the optimal lncRNA combination (including
ITPK1-AS1, KCNQ1DN, LINC00167, LINC00173 and
LINC00307) of the green module had the most significant
predictive effect and was thus identified as the optimal system.
Differential expression analysis indicated that there were 1,105
consensus DE-RNAs in the GSE65801, GSE29998, GSE33335 and GSE27342
datasets. Following the construction of the lncRNA-mRNA network, 4
pathways had significantly positive associations with LINC00167,
LINC00173 and LINC00307. Moreover, the 32 genes involved
in the 4 pathways associated positively with the pathways.
Potassium voltage-gated channel subfamily E
regulatory subunit 2 (KCNE2) is the β subunit of potassium
voltage-gated channel subfamily Q member 1 (KCNQ1) in gastric
parietal cells, and KCNQ1/KCNE2 is activated (accompanied with acid
secretion) by certain pathways (50,51).
Through mediating the expression of KCNQ1, atrial
natriuretic peptide serves a role in the proliferation of the GC
AGS cell line (52). KCNQ1
and insulin-like growth factor 2 mRNA-binding protein 2
polymorphisms may serve as independent predictive factors for
chemotherapeutic response, and glucokinase (hexokinase 4) regulator
polymorphisms may independently predict the survival of patients
with metastatic GC (53). The KCNQ1
protein level was decreased in colorectal cancer samples, and was
associated significantly with the unfavorable overall survival of
patients with colorectal cancer (54). These observations demonstrated that
KCNQ1DN may be involved in the prognosis of GC.
CCL22 functions in the development of GC by
increasing the number of regulatory T cells, and CCL22
levels in sera predict the metastasis and recurrence of GC
(55). CCR7 causes
epithelial-mesenchymal transition by promoting Snail expression,
which results in the migration and invasion of GC cells (56,57). A
somatic mutation in CD274 induces its overexpression by
disturbing miR-570 binding, and subsequently promotes immune
evasion in GC by suppressing the activation and proliferation of T
cells (58). The expression level of
CXCL13 is a promising prognostic marker for patients with GC
following surgical resection, and may be used to predict the
response of these patients to postoperative adjuvant chemotherapy
(59). CD40 contributes to
CXCR5 expression, and the migration and accumulation of
myeloid-derived suppressor cells in GC, indicating that CD40
may promote tumor growth by influencing immune evasion (60,61).
ICAM1 overexpression is induced by leptin via the
Rho/Rho-associated protein kinase pathway, which contributes to
tumor cell migration in patients with GC (62). MMP9 in the blood has been
identified as a novel tumor marker; in particular, the plasma level
of MMP9 is a more effective predictor of GC development and
progression compared with its serum level (63,64).
VCAM1 functions in the perineural invasion (PNI) of GC by
mediating the interaction between tumor cells and neural cells;
therefore, VCAM1 inhibition suggests a promising approach
for the treatment of PNI in patients with GC (65). LINC00167, LINC00173 and
LINC00307 had the same association directions with the 4
pathways and 32 genes (including CCL22, CCR7, CD274, CD40LG,
CXCL13, CXCR5, ICAM1, MMP9 and VCAM1), suggesting that
LINC00167, LINC00173 and LINC00307 may associate
positively with GC through their participation in the 4 pathways,
and by mediating the expression of these genes.
Certain limitations of the present study should be
considered. Bioinformatics analyses were used to obtain these
results, and no experimental research was performed. Platform
differences and data heterogeneities of the datasets may have
influenced the accuracy of the risk score system. Therefore,
further experiments are required to confirm the results.
In conclusion, 12 prognosis-associated lncRNAs were
identified from the green and turquoise modules. In addition, the
optimal risk score system may be used to predict the prognosis of
patients with GC. lncRNAs ITPK1-AS1, KCNQ1DN, LINC00167,
LINC00173 and LINC00307 may serve important roles in the
pathogenesis of GC.
Acknowledgements
Not applicable.
Funding
The present study was supported by the National
Natural Science Foundation of China (grant no. 81772955), the
Natural Science Foundation of Shanghai (grant no. 17ZR1439300) and
the Scientific Research Program of Shanghai Municipal Commission of
Health and Family Planning (grant no. 201640269).
Availability of data and materials
The datasets used during the current study are
available from the corresponding author on reasonable request.
Authors' contributions
ZH and DY performed data analyses and wrote the
manuscript. YT, XZ, ZW, HF and JX contributed significantly in data
analyses and manuscript revision. ZZ and QC conceived and designed
the study. All authors read and approved the final manuscript.
Ethics approval and consent to
participate
In the original article of the datasets, the trials
were approved by the local institutional review boards of all
participating centers, and informed consent was obtained from all
patients.
Patient consent for publication
Not applicable.
Competing interests
The authors declare that they have no competing
interests.
References
|
1
|
Van Cutsem E, Sagaert X, Topal B,
Haustermans K and Prenen H: Gastric cancer. Lancet. 388:2654–2664.
2016. View Article : Google Scholar : PubMed/NCBI
|
|
2
|
Siegel R, Ma J, Zou Z and Jemal A: Cancer
statistics, 2014. CA Cancer J Clin. 64:9–29. 2014. View Article : Google Scholar : PubMed/NCBI
|
|
3
|
Rugge M, Fassan M and Graham DY:
Epidemiology of gastric cancer. Gastric Cancer Springer. 23–34.
2015. View Article : Google Scholar
|
|
4
|
Feng H, Weng X, Wang Z and Zhang D:
Relationship between living, dietary habits and gastric cancer by
case-control study in residents of Zhangzhou City. Strait J Prev
Med. 3:12–14. 2016.(In Chinese).
|
|
5
|
González CA, Sala N and Rokkas T: Gastric
cancer: Epidemiologic aspects. Helicobacter. 18 Suppl 1:S34–S38.
2013. View Article : Google Scholar
|
|
6
|
Orditura M, Galizia G, Sforza V,
Gambardella V, Fabozzi A, Laterza MM, Andreozzi F, Ventriglia J,
Savastano B, Mabilia A, et al: Treatment of gastric cancer. World J
Gastroenterol. 20:1635–1649. 2014. View Article : Google Scholar : PubMed/NCBI
|
|
7
|
ENCODE Project Consortium, ; Birney E,
Stamatoyannopoulos JA, Dutta A, Guigó R, Gingeras TR, Margulies EH,
Weng Z, Snyder M, Dermitzakis ET, et al: Identification and
analysis of functional elements in 1% of the human genome by the
ENCODE pilot project. Nature. 447:799–816. 2007. View Article : Google Scholar : PubMed/NCBI
|
|
8
|
Johnson JM, Edwards S, Shoemaker D and
Schadt EE: Dark matter in the genome: Evidence of widespread
transcription detected by microarray tiling experiments. Trends
Genet. 21:93–102. 2005. View Article : Google Scholar : PubMed/NCBI
|
|
9
|
Fatica A and Bozzoni I: Long non-coding
RNAs: New players in cell differentiation and development. Nat Rev
Genet. 15:7–21. 2014. View
Article : Google Scholar : PubMed/NCBI
|
|
10
|
Mattick JS, Amaral PP, Dinger ME, Mercer
TR and Mehler MF: RNA regulation of epigenetic processes.
Bioessays. 31:51–59. 2009. View Article : Google Scholar : PubMed/NCBI
|
|
11
|
Huarte M, Guttman M, Feldser D, Garber M,
Koziol MJ, Kenzelmann-Broz D, Khalil AM, Zuk O, Amit I, Rabani M,
et al: A large intergenic noncoding RNA induced by p53 mediates
global gene repression in the p53 response. Cell. 142:409–419.
2010. View Article : Google Scholar : PubMed/NCBI
|
|
12
|
Cheetham SW, Gruhl F, Mattick JS and
Dinger ME: Long noncoding RNAs and the genetics of cancer. Br J
Cancer. 108:2419–2425. 2013. View Article : Google Scholar : PubMed/NCBI
|
|
13
|
Gutschner T, Hämmerle M, Eissmann M, Hsu
J, Kim Y, Hung G, Revenko A, Arun G, Stentrup M, Gross M, et al:
The noncoding RNA MALAT1 is a critical regulator of the metastasis
phenotype of lung cancer cells. Cancer Res. 73:1180–1189. 2013.
View Article : Google Scholar : PubMed/NCBI
|
|
14
|
Wang Q, Zhai YY, Dai JH, Li KY, Deng Q and
Han ZG: SAMD9L inactivation promotes cell proliferation via
facilitating G1-S transition in hepatitis B virus-associated
hepatocellular carcinoma. Int J Biol Sci. 10:807–816. 2014.
View Article : Google Scholar : PubMed/NCBI
|
|
15
|
Sun M, Xia R, Jin F, Xu T, Liu Z, De W and
Liu X: Downregulated long noncoding RNA MEG3 is associated with
poor prognosis and promotes cell proliferation in gastric cancer.
Tumour Biol. 35:1065–1073. 2014. View Article : Google Scholar : PubMed/NCBI
|
|
16
|
Peng W, Si S, Zhang Q, Li C, Zhao F, Wang
F, Yu J and Ma R: Long non-coding RNA MEG3 functions as a competing
endogenous RNA to regulate gastric cancer progression. J Exp Clin
Cancer Res. 34:792015. View Article : Google Scholar : PubMed/NCBI
|
|
17
|
Wang CY, Hua L, Yao KH, Chen JT, Zhang JJ
and Hu JH: Long non-coding RNA CCAT2 is up-regulated in gastric
cancer and associated with poor prognosis. Int J Clin Exp Pathol.
8:779–785. 2015.PubMed/NCBI
|
|
18
|
Zhang EB, Kong R, Yin DD, You LH, Sun M,
Han L, Xu TP, Xia R, Yang JS, De W and Chen Jf: Long noncoding RNA
ANRIL indicates a poor prognosis of gastric cancer and promotes
tumor growth by epigenetically silencing of miR-99a/miR-449a.
Oncotarget. 5:2276–2292. 2014. View Article : Google Scholar : PubMed/NCBI
|
|
19
|
Lan WG, Xu DH, Xu C, Ding CL, Ning FL,
Zhou YL, Ma LB, Liu CM and Han X: Silencing of long non-coding RNA
ANRIL inhibits the development of multidrug resistance in gastric
cancer cells. Oncol Rep. 36:263–270. 2016. View Article : Google Scholar : PubMed/NCBI
|
|
20
|
Li L, Zhang L, Zhang Y and Zhou F:
Increased expression of LncRNA BANCR is associated with clinical
progression and poor prognosis in gastric cancer. Biomed
Pharmacother. 72:109–112. 2015. View Article : Google Scholar : PubMed/NCBI
|
|
21
|
Servant N, Roméjon J, Gestraud P, La Rosa
P, Lucotte G, Lair S, Bernard V, Zeitouni B, Coffin F,
Jules-Clément G, et al: Bioinformatics for precision medicine in
oncology: Principles and application to the SHIVA clinical trial.
Front Genet. 5:1522014. View Article : Google Scholar : PubMed/NCBI
|
|
22
|
Ooi CH, Ivanova T, Wu J, Lee M, Tan IB,
Tao J, Ward L, Koo JH, Gopalakrishnan V, Zhu Y, et al: Oncogenic
pathway combinations predict clinical prognosis in gastric cancer.
PLoS Genet. 5:e10006762009. View Article : Google Scholar : PubMed/NCBI
|
|
23
|
Tao J, Deng NT, Ramnarayanan K, Huang B,
Oh HK, Leong SH, Lim SS, Tan IB, Ooi CH, Wu J, et al: CD44-SLC1A2
gene fusions in gastric cancer. Sci Transl Med. 3:77ra302011.
View Article : Google Scholar : PubMed/NCBI
|
|
24
|
Muratani M, Deng N, Ooi WF, Lin SJ, Xing
M, Xu C, Qamra A, Tay ST, Malik S, Wu J, et al: Nanoscale chromatin
profiling of gastric adenocarcinoma reveals cancer-associated
cryptic promoters and somatically acquired regulatory elements. Nat
Commun. 5:43612014. View Article : Google Scholar : PubMed/NCBI
|
|
25
|
Chia NY, Deng N, Das K, Huang D, Hu L, Zhu
Y, Lim KH, Lee MH, Wu J, Sam XX, et al: Regulatory crosstalk
between lineage-survival oncogenes KLF5, GATA4 and GATA6
cooperatively promotes gastric cancer development. Gut. 64:707–719.
2015. View Article : Google Scholar : PubMed/NCBI
|
|
26
|
Lei Z, Tan IB, Das K, Deng N, Zouridis H,
Pattison S, Chua C, Feng Z, Guan YK, Ooi CH, et al: Identification
of molecular subtypes of gastric cancer with different responses to
PI3-kinase inhibitors and 5-fluorouracil. Gastroenterology.
145:554–565. 2013. View Article : Google Scholar : PubMed/NCBI
|
|
27
|
Cristescu R, Lee J, Nebozhyn M, Kim KM,
Ting JC, Wong SS, Liu J, Yue YG, Wang J, Yu K, et al: Molecular
analysis of gastric cancer identifies subtypes associated with
distinct clinical outcomes. Nat Med. 21:449–456. 2015. View Article : Google Scholar : PubMed/NCBI
|
|
28
|
Li H, Yu B, Li J, Su L, Yan M, Zhang J, Li
C, Zhu Z and Liu B: Characterization of differentially expressed
genes involved in pathways associated with gastric cancer. PLoS
One. 10:e01250132015. View Article : Google Scholar : PubMed/NCBI
|
|
29
|
Holbrook JD, Parker JS, Gallagher KT,
Halsey WS, Hughes AM, Weigman VJ, Lebowitz PF and Kumar R: Deep
sequencing of gastric carcinoma reveals somatic mutations relevant
to personalized medicine. J Transl Med. 9:1192011. View Article : Google Scholar : PubMed/NCBI
|
|
30
|
Cheng L, Wang P, Yang S, Yang Y and Zhang
Q, Zhang W, Xiao H, Gao H and Zhang Q: Identification of genes with
a correlation between copy number and expression in gastric cancer.
BMC Med Genomics. 5:142012. View Article : Google Scholar : PubMed/NCBI
|
|
31
|
Cheng L, Yang S, Yang Y, Zhang W, Xiao H,
Gao H, Deng X and Zhang Q: Global gene expression and functional
network analysis of gastric cancer identify extended pathway maps
and GPRC5A as a potential biomarker. Cancer Lett. 326:105–113.
2012. View Article : Google Scholar : PubMed/NCBI
|
|
32
|
Cheng L and Zhang Q, Yang S, Yang Y, Zhang
W, Gao H, Deng X and Zhang Q: A 4-gene panel as a marker at
chromosome 8q in Asian gastric cancer patients. Genomics.
102:323–330. 2013. View Article : Google Scholar : PubMed/NCBI
|
|
33
|
Cui J, Chen Y, Chou WC, Sun L, Chen L, Suo
J, Ni Z, Zhang M, Kong X, Hoffman LL, et al: An integrated
transcriptomic and computational analysis for biomarker
identification in gastric cancer. Nucleic Acids Res. 39:1197–1207.
2011. View Article : Google Scholar : PubMed/NCBI
|
|
34
|
Cui J, Li F, Wang G, Fang X, Puett JD and
Xu Y: Gene-expression signatures can distinguish gastric cancer
grades and stages. PLoS One. 6:e178192011. View Article : Google Scholar : PubMed/NCBI
|
|
35
|
Bolstad BM, Irizarry RA, Astrand M and
Speed TP: A comparison of normalization methods for high density
oligonucleotide array data based on variance and bias.
Bioinformatics. 19:185–193. 2003. View Article : Google Scholar : PubMed/NCBI
|
|
36
|
Irizarry RA, Bolstad BM, Collin F, Cope
LM, Hobbs B and Speed TP: Summaries of Affymetrix GeneChip probe
level data. Nucleic Acids Res. 31:e152003. View Article : Google Scholar : PubMed/NCBI
|
|
37
|
Ritchie ME, Phipson B, Wu D, Hu Y, Law CW,
Shi W and Smyth GK: limma powers differential expression analyses
for RNA-sequencing and microarray studies. Nucleic Acids Res.
43:e472015. View Article : Google Scholar : PubMed/NCBI
|
|
38
|
Larkin MA, Blackshields G, Brown NP,
Chenna R, McGettigan PA, McWilliam H, Valentin F, Wallace IM, Wilm
A, Lopez R, et al: Clustal W and Clustal X version 2.0.
Bioinformatics. 23:2947–2948. 2007. View Article : Google Scholar : PubMed/NCBI
|
|
39
|
Zhou M, Guo M, He D, Wang X, Cui Y, Yang
H, Hao D and Sun J: A potential signature of eight long non-coding
RNAs predicts survival in patients with non-small cell lung cancer.
J Transl Med. 13:2312015. View Article : Google Scholar : PubMed/NCBI
|
|
40
|
Zhou M, Xu W, Yue X, Zhao H, Wang Z, Shi
H, Cheng L and Sun J: Relapse-related long non-coding RNA signature
to improve prognosis prediction of lung adenocarcinoma. Oncotarget.
7:29720–29738. 2016.PubMed/NCBI
|
|
41
|
Sun C, Jiang H, Sun Z, Gui Y and Xia H:
Identification of long non-coding RNAs biomarkers for early
diagnosis of myocardial infarction from the dysregulated
coding-non-coding co-expression network. Oncotarget. 7:73541–73551.
2016. View Article : Google Scholar : PubMed/NCBI
|
|
42
|
Zhai X, Xue Q, Liu Q, Guo Y and Chen Z:
Colon cancer recurrence-associated genes revealed by WGCNA
co-expression network analysis. Mol Med Rep. 16:6499–6505. 2017.
View Article : Google Scholar : PubMed/NCBI
|
|
43
|
Langfelder P and Horvath S: WGCNA: An R
package for weighted correlation network analysis. Bmc
Bioinformatics. 9:5592008. View Article : Google Scholar : PubMed/NCBI
|
|
44
|
Wang P, Wang Y, Hang B, Zou X and Mao JH:
A novel gene expression-based prognostic scoring system to predict
survival in gastric cancer. Oncotarget. 7:55343–55351.
2016.PubMed/NCBI
|
|
45
|
Goeman JJ: L1 penalized estimation in the
Cox proportional hazards model. Biom J. 52:70–84. 2010.PubMed/NCBI
|
|
46
|
Knafl GJ, Dixon JK, O'Malley JP, Grey M,
Deatrick JA, Gallo A and Knafl KA: Scale development based on
likelihood cross-validation. Stat Methods Med Res. 21:599–619.
2012. View Article : Google Scholar : PubMed/NCBI
|
|
47
|
Qi C, Hong L, Cheng Z and Yin Q:
Identification of metastasis-associated genes in colorectal cancer
using metaDE and survival analysis. Oncol Lett. 11:568–574. 2016.
View Article : Google Scholar : PubMed/NCBI
|
|
48
|
Huang J, Deng Q, Wang Q, Li KY, Dai JH, Li
N, Zhu ZD, Zhou B, Liu XY, Liu RF, et al: Exome sequencing of
hepatitis B virus-associated hepatocellular carcinoma. Nat Genet.
44:1117–1121. 2012. View Article : Google Scholar : PubMed/NCBI
|
|
49
|
Tilford CA and Siemers NO: Gene set
enrichment analysis. Methods Mol Biol. 563:99–121. 2009. View Article : Google Scholar : PubMed/NCBI
|
|
50
|
Heitzmann D, Grahammer F, von Hahn T,
Schmitt-Gräff A, Romeo E, Nitschke R, Gerlach U, Lang HJ, Verrey F,
Barhanin J and Warth R: Heteromeric KCNE2/KCNQ1 potassium channels
in the luminal membrane of gastric parietal cells. J Physiol.
561:547–557. 2004. View Article : Google Scholar : PubMed/NCBI
|
|
51
|
Abbott GW and Roepke TK: KCNE2 and gastric
cancer: Bench to bedside. Oncotarget. 7:17286–17287. 2016.
View Article : Google Scholar : PubMed/NCBI
|
|
52
|
Zhang J, Zhao Z, Zu C, Hu H, Shen H, Zhang
M and Wang J: Atrial natriuretic peptide modulates the
proliferation of human gastric cancer cells via KCNQ1 expression.
Oncol Lett. 6:407–414. 2013. View Article : Google Scholar : PubMed/NCBI
|
|
53
|
Liu X, Chen Z, Zhao X, Huang M, Wang C,
Peng W, Yin J, Li J, He G, Li X and Zhu X: Effects of IGF2BP2,
KCNQ1 and GCKR polymorphisms on clinical outcome in metastatic
gastric cancer treated with EOF regimen. Pharmacogenomics.
16:959–970. 2015. View Article : Google Scholar : PubMed/NCBI
|
|
54
|
Than BL, Goos JA, Sarver AL, O'Sullivan
MG, Rod A, Starr TK, Fijneman RJ, Meijer GA, Zhao L, Zhang Y, et
al: The role of KCNQ1 in mouse and human gastrointestinal cancers.
Oncogene. 33:3861–3868. 2014. View Article : Google Scholar : PubMed/NCBI
|
|
55
|
Wei Y, Wang T, Song H, Tian L, Lyu G, Zhao
L and Xue Y: C-C motif chemokine 22 ligand (CCL22) concentrations
in sera of gastric cancer patients are related to peritoneal
metastasis and predict recurrence within one year after radical
gastrectomy. J Surg Res. 211:266–278. 2017. View Article : Google Scholar : PubMed/NCBI
|
|
56
|
Zhang J, Zhou Y and Yang Y: CCR7 pathway
induces epithelial-mesenchymal transition through up-regulation of
Snail signaling in gastric cancer. Med Oncol. 32:4672015.PubMed/NCBI
|
|
57
|
Wang WN, Chen Y, Zhang YD and Hu TH: The
regulatory mechanism of CCR7 gene expression and its involvement in
the metastasis and progression of gastric cancer. Tumour Biol.
34:1865–1871. 2013. View Article : Google Scholar : PubMed/NCBI
|
|
58
|
Wang W, Sun J, Li F, Li R, Gu Y, Liu C,
Yang P, Zhu M, Chen L, Tian W, et al: A frequent somatic mutation
in CD274 3′-UTR leads to protein over-expression in gastric cancer
by disrupting miR-570 binding. Hum Mutat. 33:480–484. 2012.
View Article : Google Scholar : PubMed/NCBI
|
|
59
|
Wei Y, Lin C, Li H, Xu Z, Wang J, Li R,
Liu H, Zhang H, He H and Xu J: CXCL13 expression is prognostic and
predictive for postoperative adjuvant chemotherapy benefit in
patients with gastric cancer. Cancer Immunol Immunother.
67:261–269. 2018. View Article : Google Scholar : PubMed/NCBI
|
|
60
|
Ding Y, Shen J, Zhang G, Chen X, Wu J and
Chen W: CD40 controls CXCR5-induced recruitment of myeloid-derived
suppressor cells to gastric cancer. Oncotarget. 6:38901–38911.
2015. View Article : Google Scholar : PubMed/NCBI
|
|
61
|
Tian WY, Chen WC, Li R and Liu L: Markers
CD40, VEGF, AKT, PI3K, and S100 correlate with tumor stage in
gastric cancer. Onkologie. 36:26–31. 2013.PubMed/NCBI
|
|
62
|
Dong Z, Fu S, Xu X, Yang Y, Du L, Li W,
Kan S, Li Z, Zhang X, Wang L, et al: Leptin-mediated regulation of
ICAM-1 is Rho/ROCK dependent and enhances gastric cancer cell
migration. Br J Cancer. 110:1801–1810. 2014. View Article : Google Scholar : PubMed/NCBI
|
|
63
|
Wu CY, Wu MS, Chiang EP, Chen YJ, Chen CJ,
Chi NH, Shih YT, Chen GH and Lin JT: Plasma matrix
metalloproteinase-9 level is better than serum matrix
metalloproteinase-9 level to predict gastric cancer evolution. Clin
Cancer Res. 13:2054–2060. 2007. View Article : Google Scholar : PubMed/NCBI
|
|
64
|
Chen SW, Zhang Q, Xu ZF, Wang HP, Shi Y,
Xu F, Zhang WJ, Wang P and Li Y: HOXC6 promotes gastric cancer cell
invasion by upregulating the expression of MMP9. Mol Med Rep.
14:3261–3268. 2016. View Article : Google Scholar : PubMed/NCBI
|
|
65
|
Xia Q, Bai QR, Dong M, Sun X, Zhang H, Cui
J, Xi H, Hu XL, Shen Q and Chen L: Interaction between gastric
carcinoma cells and neural cells promotes perineural invasion by a
pathway involving VCAM1. Dig Dis Sci. 60:3283–3292. 2015.
View Article : Google Scholar : PubMed/NCBI
|