Introduction
Renal cell carcinoma (RCC) is the most common and
lethal renal malignant tumor in adults, and in contrast with stable
or declining trends for the majority of malignant tumors, including
lung cancer, prostate cancer, colorectal cancer and breast cancer,
incidence rates of RCC have been indicated to be increased in both
men and women (1,2). Clear cell RCC (ccRCC) accounts for
>85% of RCC cases (1,2). Surgical excision is the standard
treatment for localized ccRCC; however, 30% of ccRCC patients have
metastatic disease at the time of diagnosis (3) and 30% of patients with localized
disease eventually develop metastases (4,5). The
number of available treatment for metastatic ccRCC has increased
over the past decade, particularly, immunotherapy and targeted
therapy have improved the outlook for metastatic ccRCC. However the
5-year survival and mortality rates remain poor (6,7).
The reduced treatment efficacy of metastatic ccRCC
is largely attributed to an incomplete understanding of the
molecular mechanisms that lead to ccRCC metastasis (8), therefore, it is crucial to discover
novel therapeutic targets for metastasic ccRCC. High-throughput
technology and bioinformatics methods have been widely used to
analyze the gene expression data of various cancers, including
hepatocellular carcinoma (9), lung
cancer (10) and ccRCC (11). It has been reported as a promising
method to identify potential biomarkers in tumor diagnosis and
therapeutic targets (12,13). To the best of our knowledge, there is
a limited number of studies that have used TCGA data regarding
ccRCC to investigate the molecular mechanisms that lead to ccRCC
metastasis. In the present study, bioinformatics methods were used
to analyze ccRCC mRNA expression data obtained from The Cancer
Genome Atlas (TCGA) database for ccRCC patients with metastasis and
without metastasis to identify key genes of ccRCC metastasis and to
further explore the molecular mechanisms of ccRCC metastasis.
Materials and methods
Data collection
Expression profiling and clinical records of
patients with ccRCC in TCGA (https://cancergenome.nih.gov/) were obtained from UCSC
Xena (http://xena.ucsc.edu/) (14). The gene expression profiles (dataset
ID:TCGA-KIRC/Xena_Matrices/TCGA-KIRC.htseq_counts.tsv) were
displayed as read counts based on the IlluminaHiSeq platform
(Illumina Inc., San Diego, CA, USA), including 534 ccRCC and 72
healthy kidney tissues samples. Subsequent to removing healthy
kidney tissue samples, the samples of ccRCC were included in the
present study if the following criteria were met: i) Expression
profile and clinical records were available; ii) the mRNAs with low
abundances (i.e., all mRNAs with <50 read counts across all
samples) were removed; iii) the patients could be classified in to
metastasis and non-metastasis groups at the time of diagnosis
according to the American Joint Committee on Cancer
Tumor-Node-Metastasis system (https://cancerstaging.org/). A total of 416 ccRCCs met
the criteria for the the metastasis group and 78 for the
non-metastasis group. Approval by a local ethics committee was not
required as the study adhered to TCGA publication guidelines and
data access policies.
Analysis of differentially expressed
genes (DEGs) for ccRCC with and without metastases
Expression levels of genes were compared between the
metastasis group and the non-metastasis group to identify
differentially expressed genes (DEGs) using the unpaired Student's
t-test, within the DESeq2 3.8 software using R (15). |log2FoldChange|>0.585 and adjusted
P-value <0.0001 were considered as threshold values for the
DEGs.
Kyoto Encyclopedia of Genes and
Genomes (KEGG) and Gene Ontology (GO) enrichment analyses of
DEGs
The R package within the 3.8 clusterProfiler
software (16) was used to analyze
and visualize functional profiles of gene and gene clusters from GO
(17) and KEGG (18). GO and KEGG pathway enrichment
analysis for DEGs was also performed using clusterProfiler package.
A false discovery rate (FDR) of <0.05 was considered for a
significant GO function and KEGG pathway.
Protein-protein interaction (PPI)
To obtain insights into the interactions among DEGs
associated with ccRCC metastasis, a PPI network was constructed
using the Search Tool for the Retrieval of Interacting Genes
(STRING) (19), a database of known
and predicted protein interactions. An interaction with a threshold
combined score ≥0.4 was considered statistically significant. The
PPI network was visualized by Cytoscape 3.6.1 software (http://www.cytoscape.org/) (20).
Hub genes selection and analysis
CytoHubba is a common tool for analyzing PPI
networks (21). The hub genes were
selected using the cytoHubba plugin of Cytoscape software. Any
overlap in the top 50 list of genes, from the four ranking methods,
were defined as hub genes. The four ranking methods include Degree
(22), Maximum Neighborhood
Component (23), Density of Maximum
Neighborhood Component (23) and
Maximal Clique Centrality (21). The
expression levels of the hub genes in the ccRCC tissue were
compared with the expression levels in normal kidney tissue from
TCGA and Genotype-Tissue Expression (GTEx) projects (https://www.genome.gov/gtex/) using the Limma software
(24) in Gene Expression Profiling
Interactive Analysis (GEPIA) (25).
In addition, the overall survival (OS) and recurrence-free survival
(RFS) analyses of the hub genes were performed using the
Kaplan-Meier survival method with log-rank test in GEPIA. GEPIA is
a newly developed interactive web server for analyzing the RNA
sequencing expression data of tumors and normal samples from TCGA
and the GTEx projects. It should be noted that GEPIA does not
provide specific P-values and confidence intervals.
Results
Identification of DEGs associated with
ccRCC metastasis
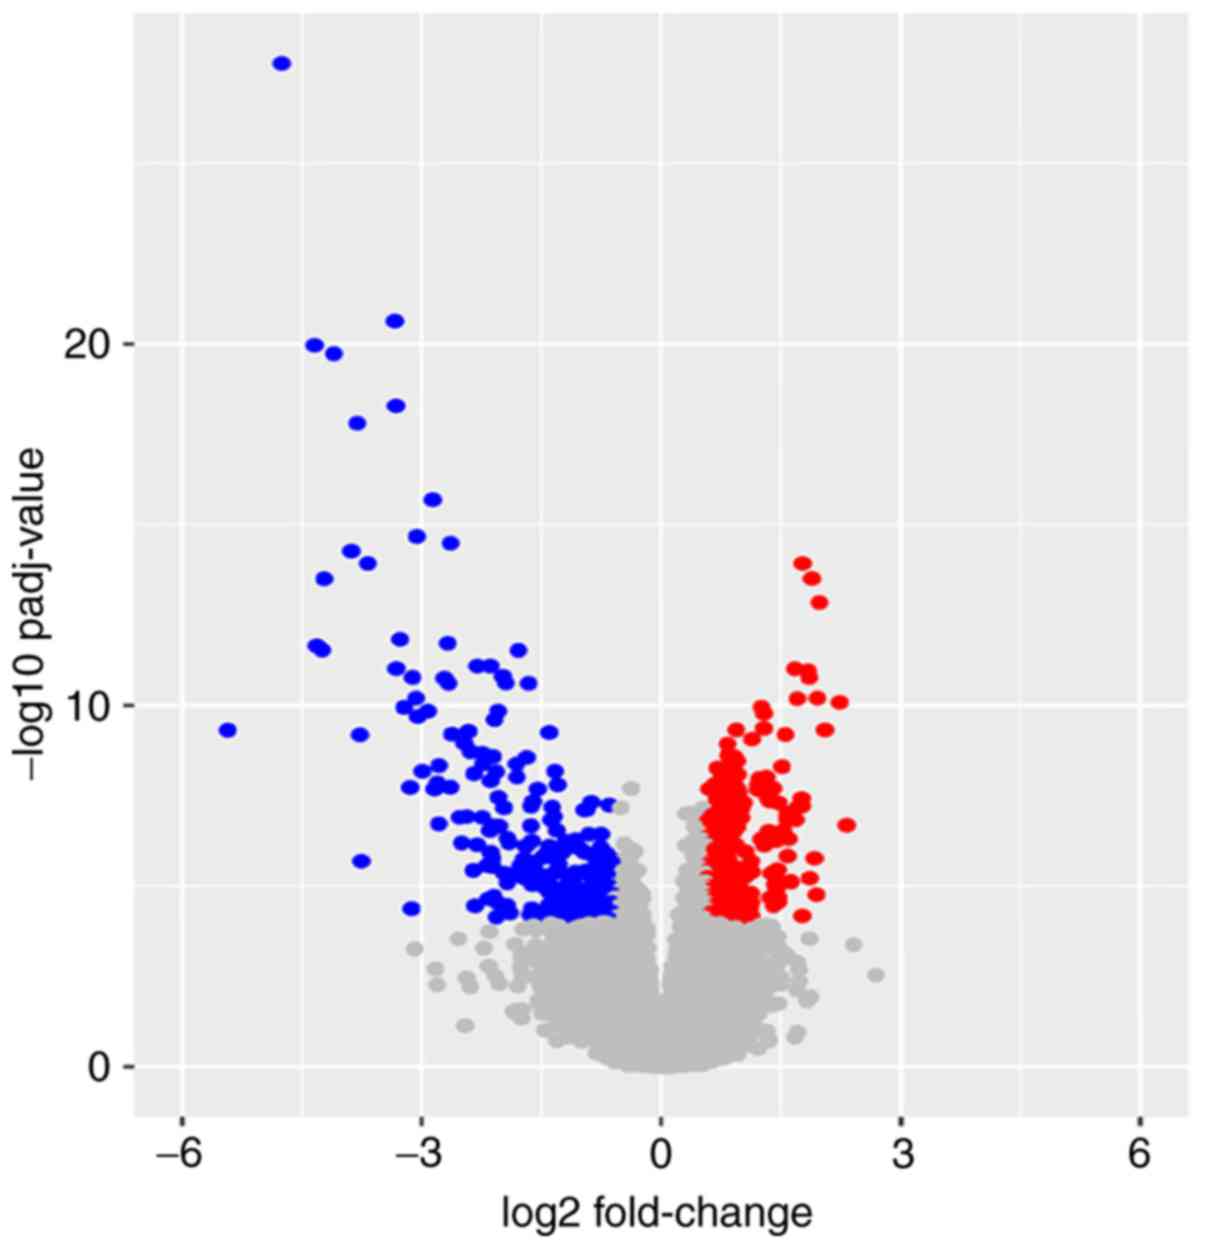
Based on the aforementioned inclusion criteria, 494
ccRCCs in TCGA database were included and divided into the
metastasis group, with 78 patients, and the non-metastasis group,
with 416 patients (Table I). A total
of 472 DEGs, including 247 upregulated DEGs and 225 downregulated
DEGs, were identified in the metastasis group compared with the
non-metastasis group. The results are presented as a volcano plot
(Fig. 1). Red dots indicate high
expression and blue dots indicate low expression. Gray dots
represent the gene expression with the |log2FoldChange|<0.585 or
adjusted P-value ≥0.0001.
 | Table I.Features of clear cell renal cell
carcinoma patients with metastasis (n=78) and without metastasis
(n=416). |
Table I.
Features of clear cell renal cell
carcinoma patients with metastasis (n=78) and without metastasis
(n=416).
|
| Non-metastasis
group | Metastasis group |
|---|
|
|
|
|
|---|
| Factors | n | % | n | % |
|---|
| Sex |
| Male | 272 | 65.38 | 55 | 70.51 |
|
Female | 144 | 34.62 | 23 | 29.49 |
| Age, years |
|
<65 | 253 | 60.82 | 55 | 70.51 |
| ≥65 | 163 | 39.18 | 23 | 29.49 |
| Histological
grade |
| G1 | 10 | 2.40 | 0 | 0.00 |
| G2 | 199 | 47.84 | 10 | 12.82 |
| G3 | 161 | 38.70 | 33 | 42.31 |
| G4 | 39 | 9.38 | 35 | 44.87 |
| Gx/Not
known | 7 | 1.68 | 0 | 0.00 |
| Pathological T
stage |
| T1 | 241 | 57.93 | 4 | 5.13 |
| T2 | 54 | 12.98 | 10 | 12.82 |
| T3 | 118 | 28.37 | 56 | 71.79 |
| T4 | 3 | 0.72 | 8 | 10.26 |
| Pathological N
stage |
| N1 | 11 | 2.64 | 5 | 6.41 |
| N0 | 199 | 47.84 | 37 | 47.44 |
| Nx | 206 | 49.52 | 36 | 46.15 |
KEGG and GO enrichment analyses of
DEGs
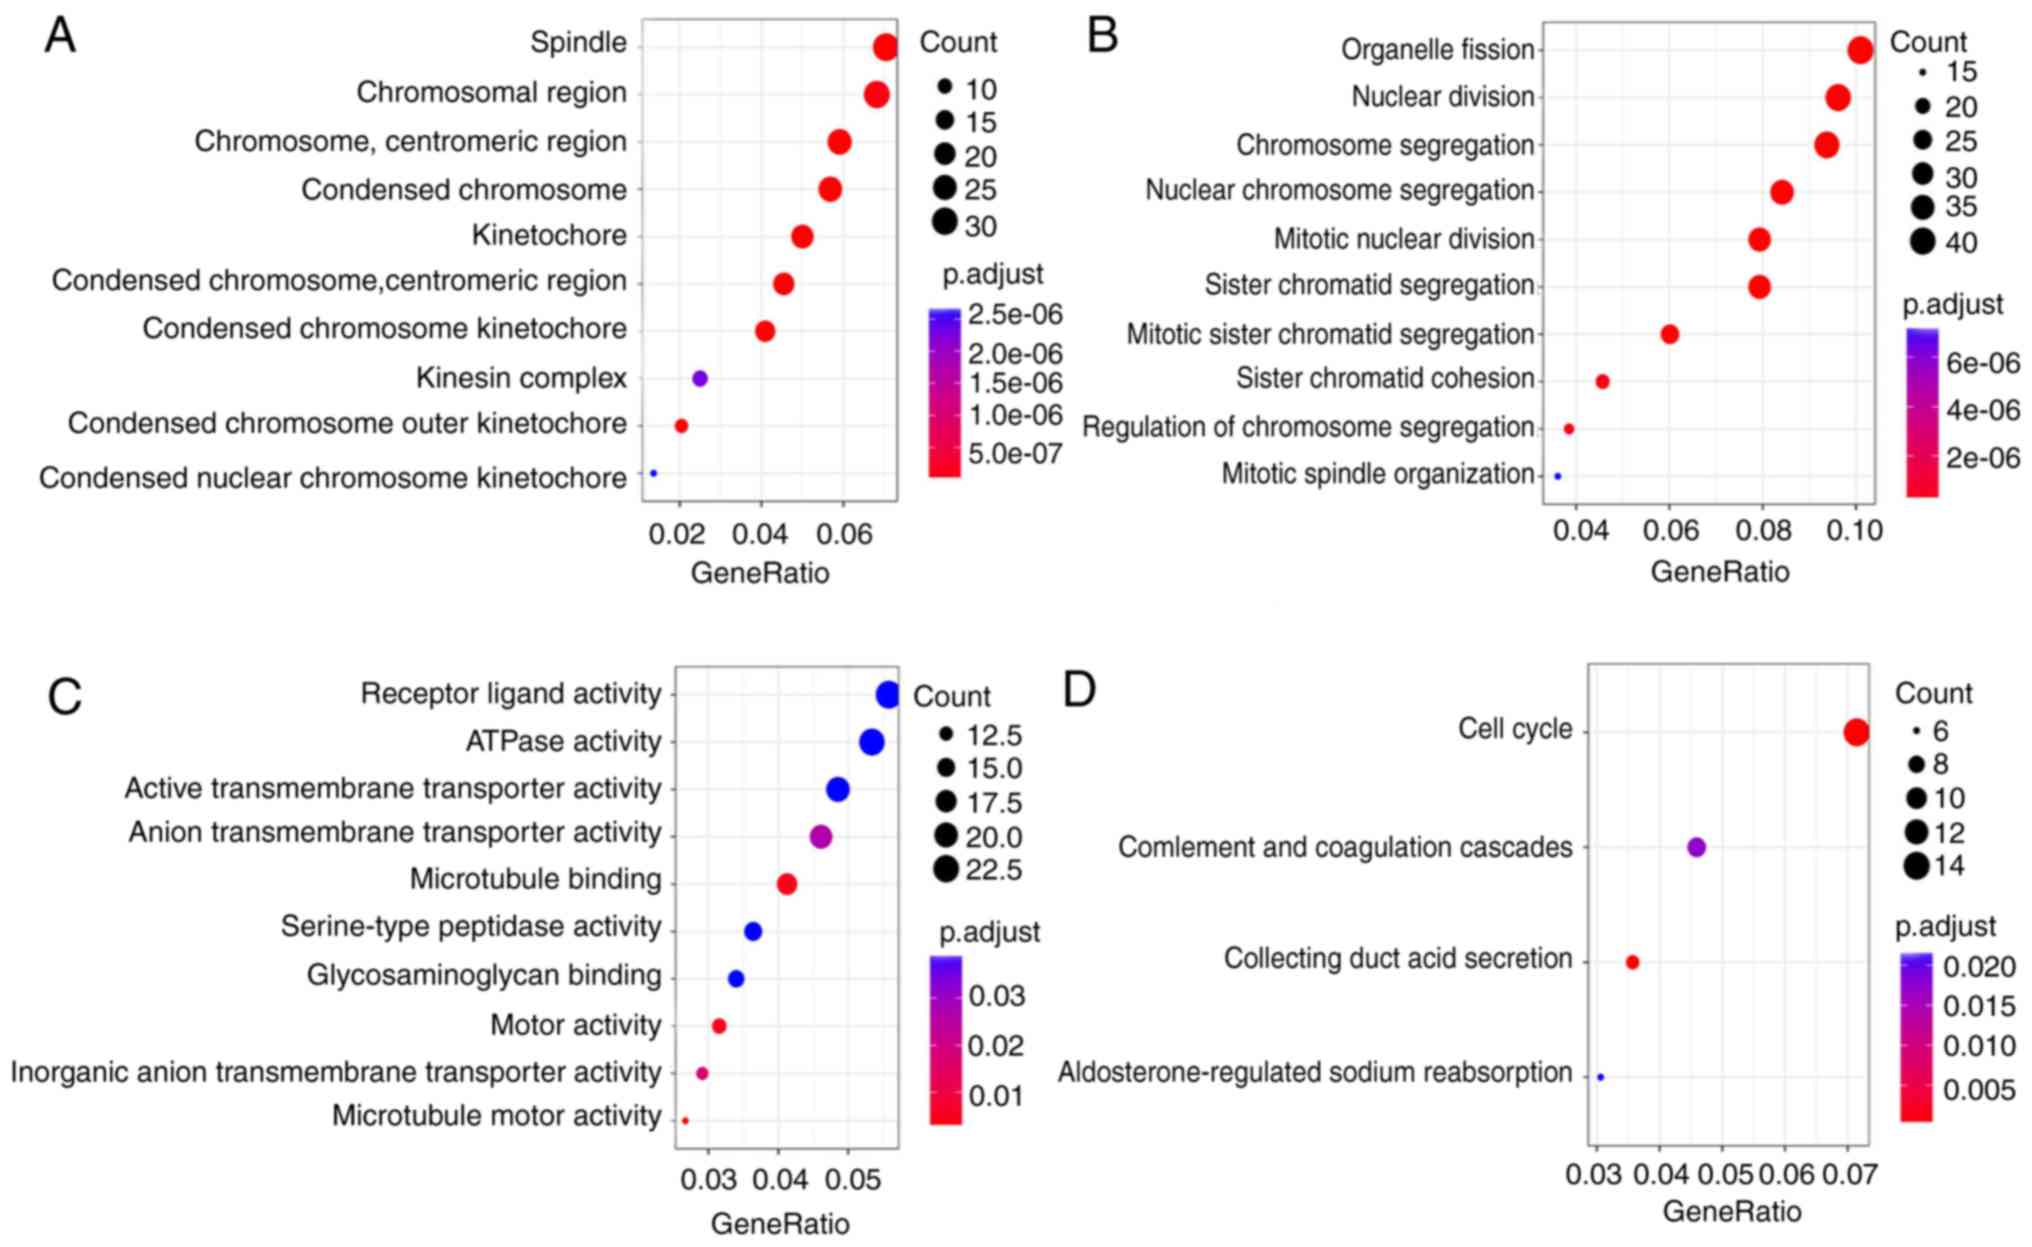
To analyze the biological classification of DEGs,
functional and pathway enrichment analyses were performed using the
clusterProfiler software. GO analysis results (Fig. 2A-C) showed that changes in the
molecular function (MF) of DEGs were significantly enriched in
‘microtubule motor activity’ (GO:0003777), ‘active transmembrane
transporter activity’ (GO:0022804), ‘inorganic anion transmembrane
transporter activity’ (GO:0015103), ‘motor activity’ (GO:0003774)
and ‘microtubule binding’ (GO:0008017). KEGG pathway analysis
(Fig. 2D) revealed that the DEGs
were mainly enriched in the ‘cell cycle’ (hsa04110), ‘collecting
duct acid secretion’ (hsa04966), ‘complement and coagulation
cascades’ (hsa04610) and ‘aldosterone-regulated sodium
reabsorption’ (hsa04960) pathways.
PPI network construction
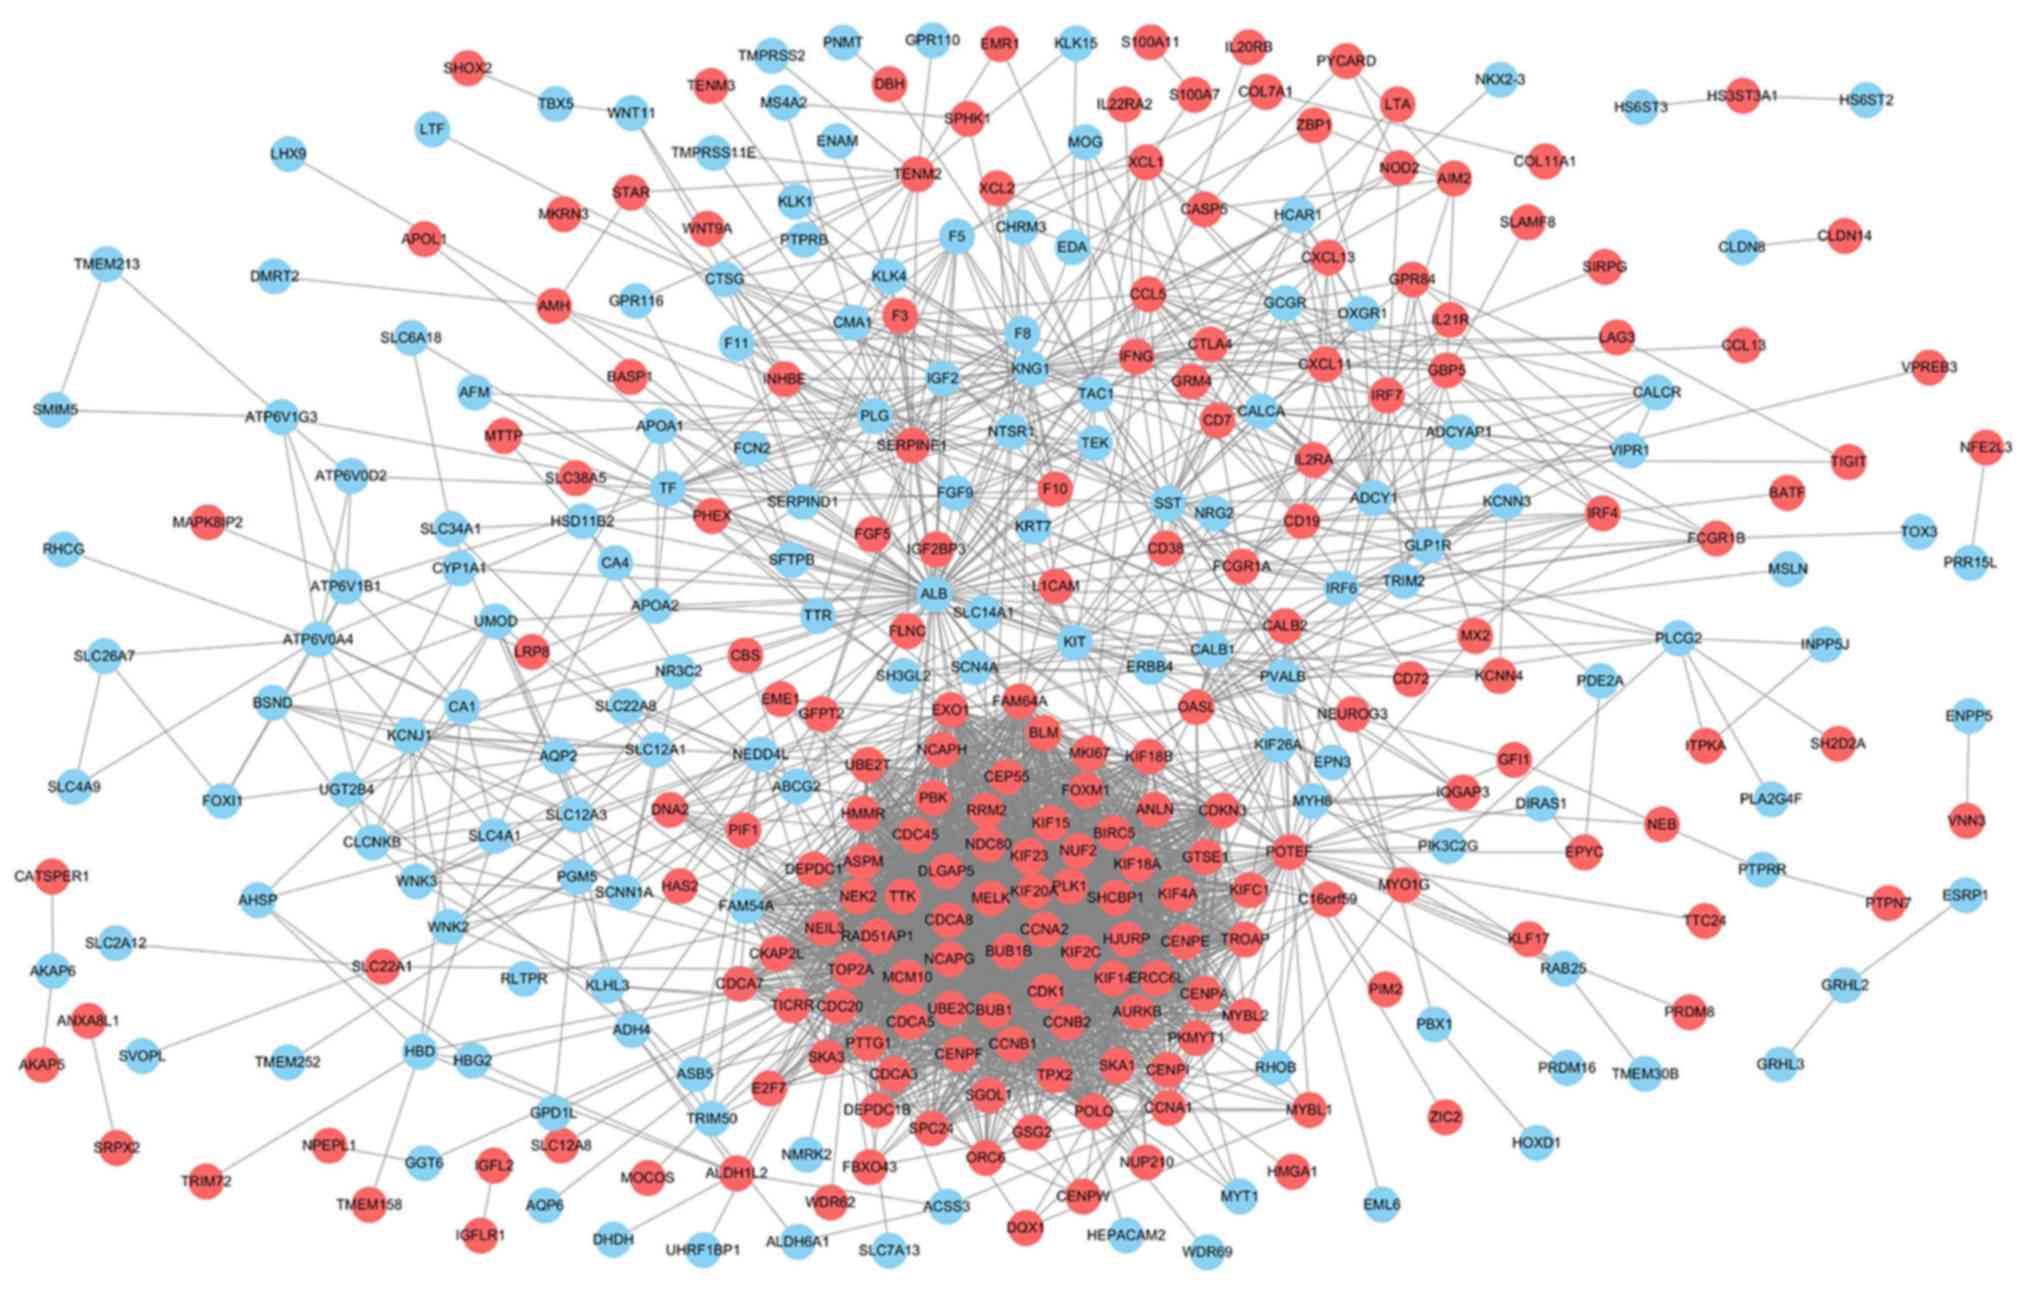
To obtain the interactions between the 472 DEGs in
the metastasis group, a PPI network was constructed using the
STRING database and visualized by cytoscape software. As shown in
Fig. 3, the network included 264
nodes and 2,977 edges. Red nodes indicate upregulated genes and
light blue nodes indicate downregulated genes in the metastasis
group.
Hub gene selection and analysis
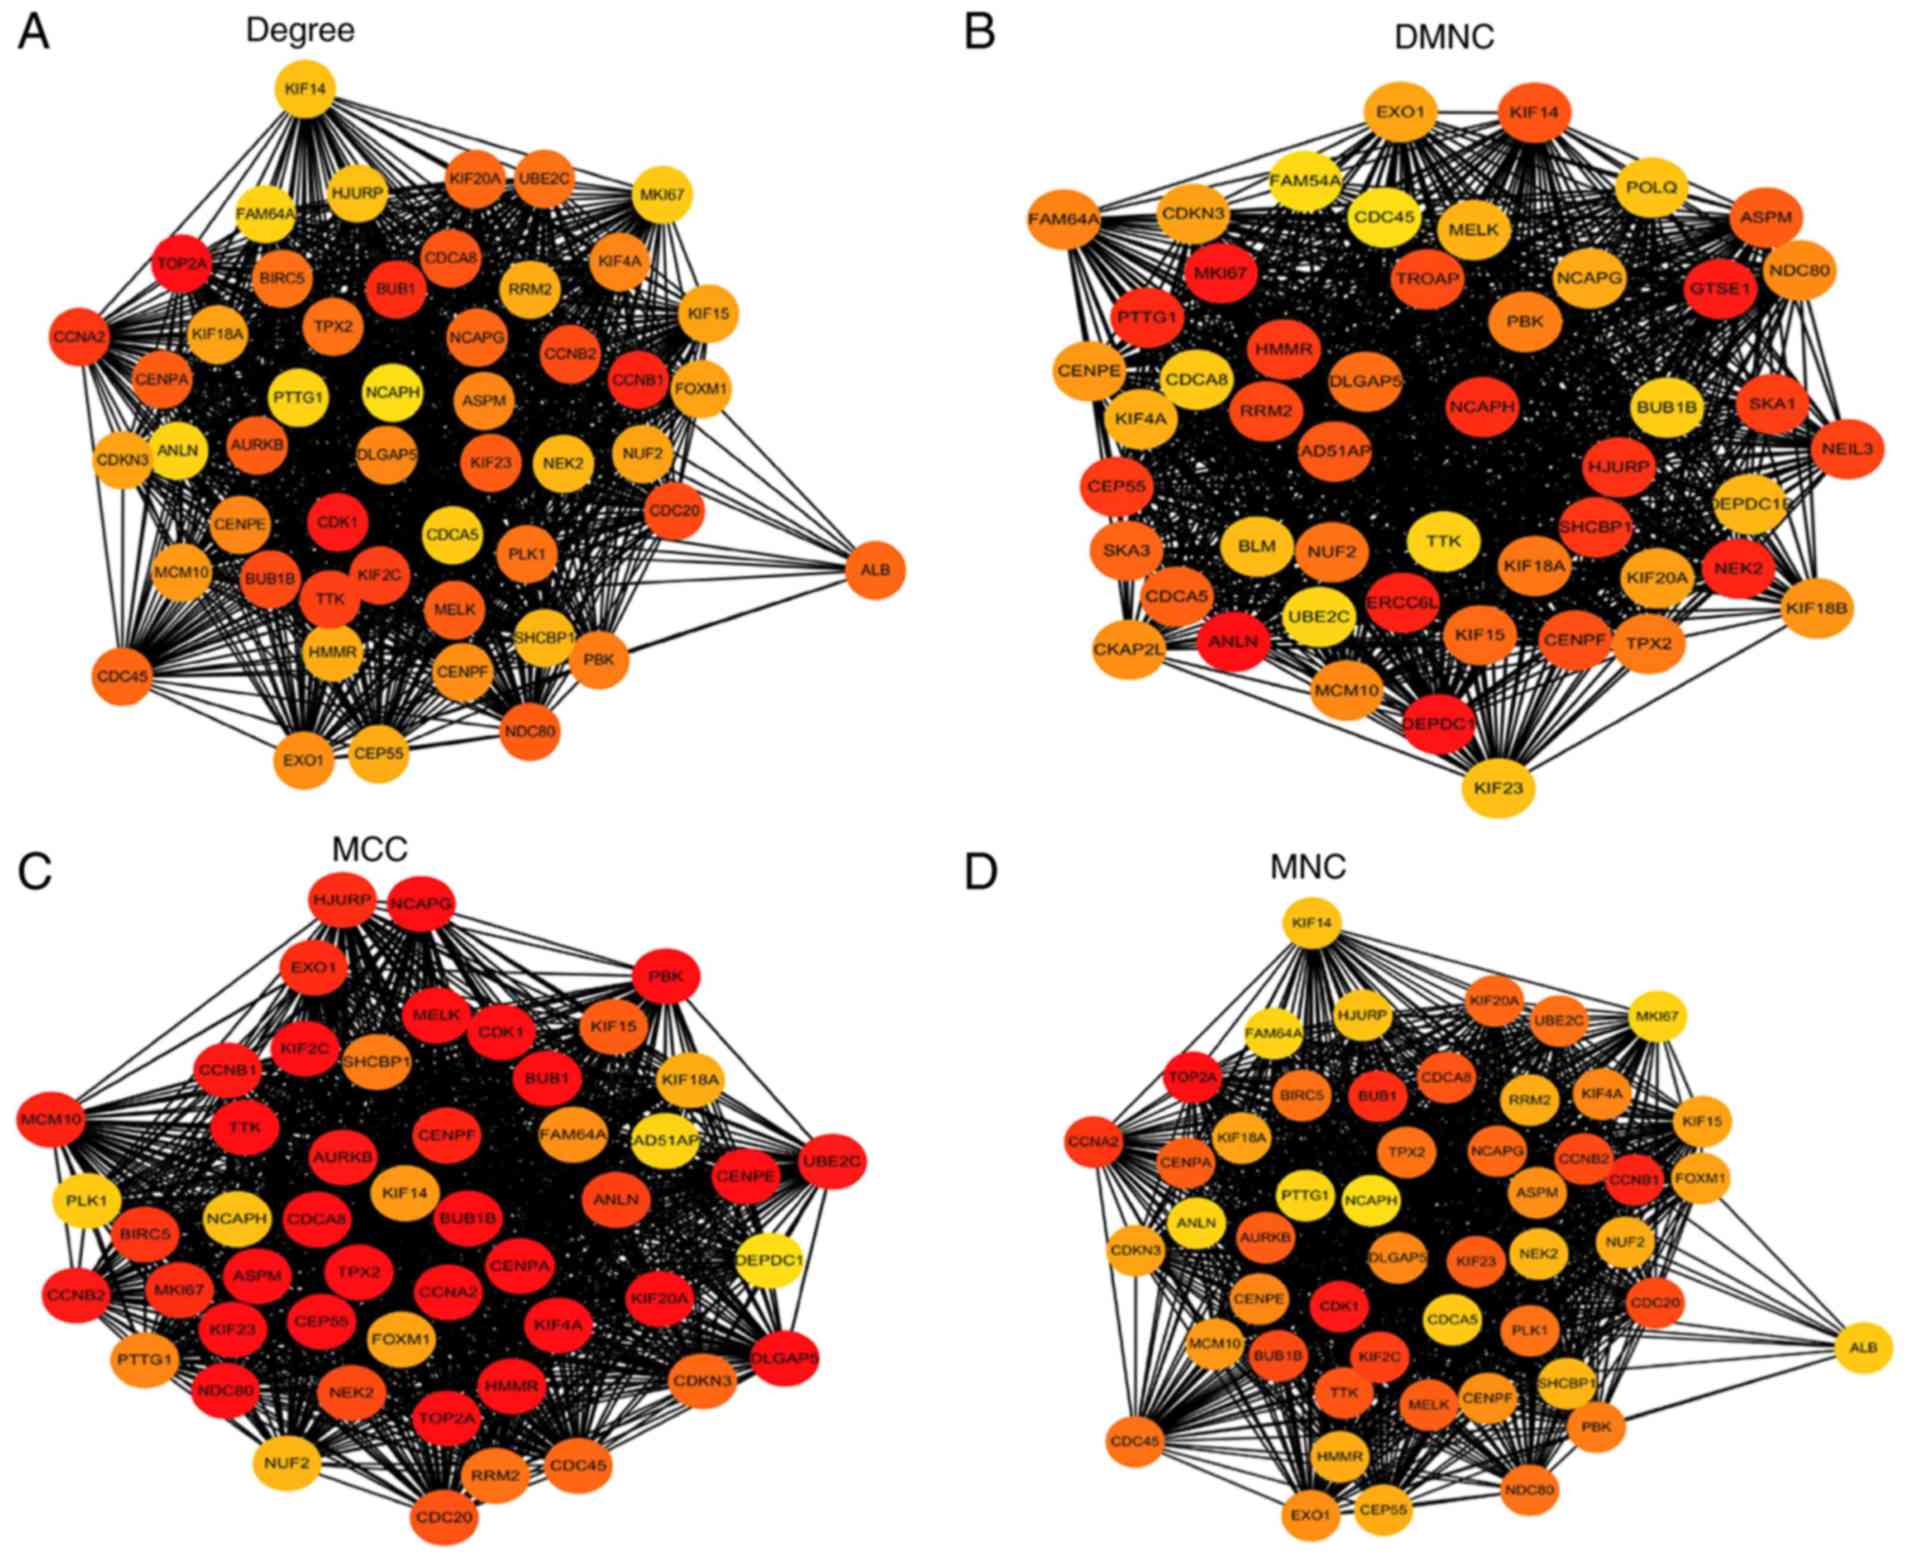
Among the lists of the top 50 genes selected
respectively by the four ranking methods, 35 genes overlapped and
were identified as hub genes (Figs.
4 and 5). All 35 genes were
upregulated in the metastasis group and were subsequently analyzed
using GEPIA. The results of the 35 hub genes analyzed by GEPIA are
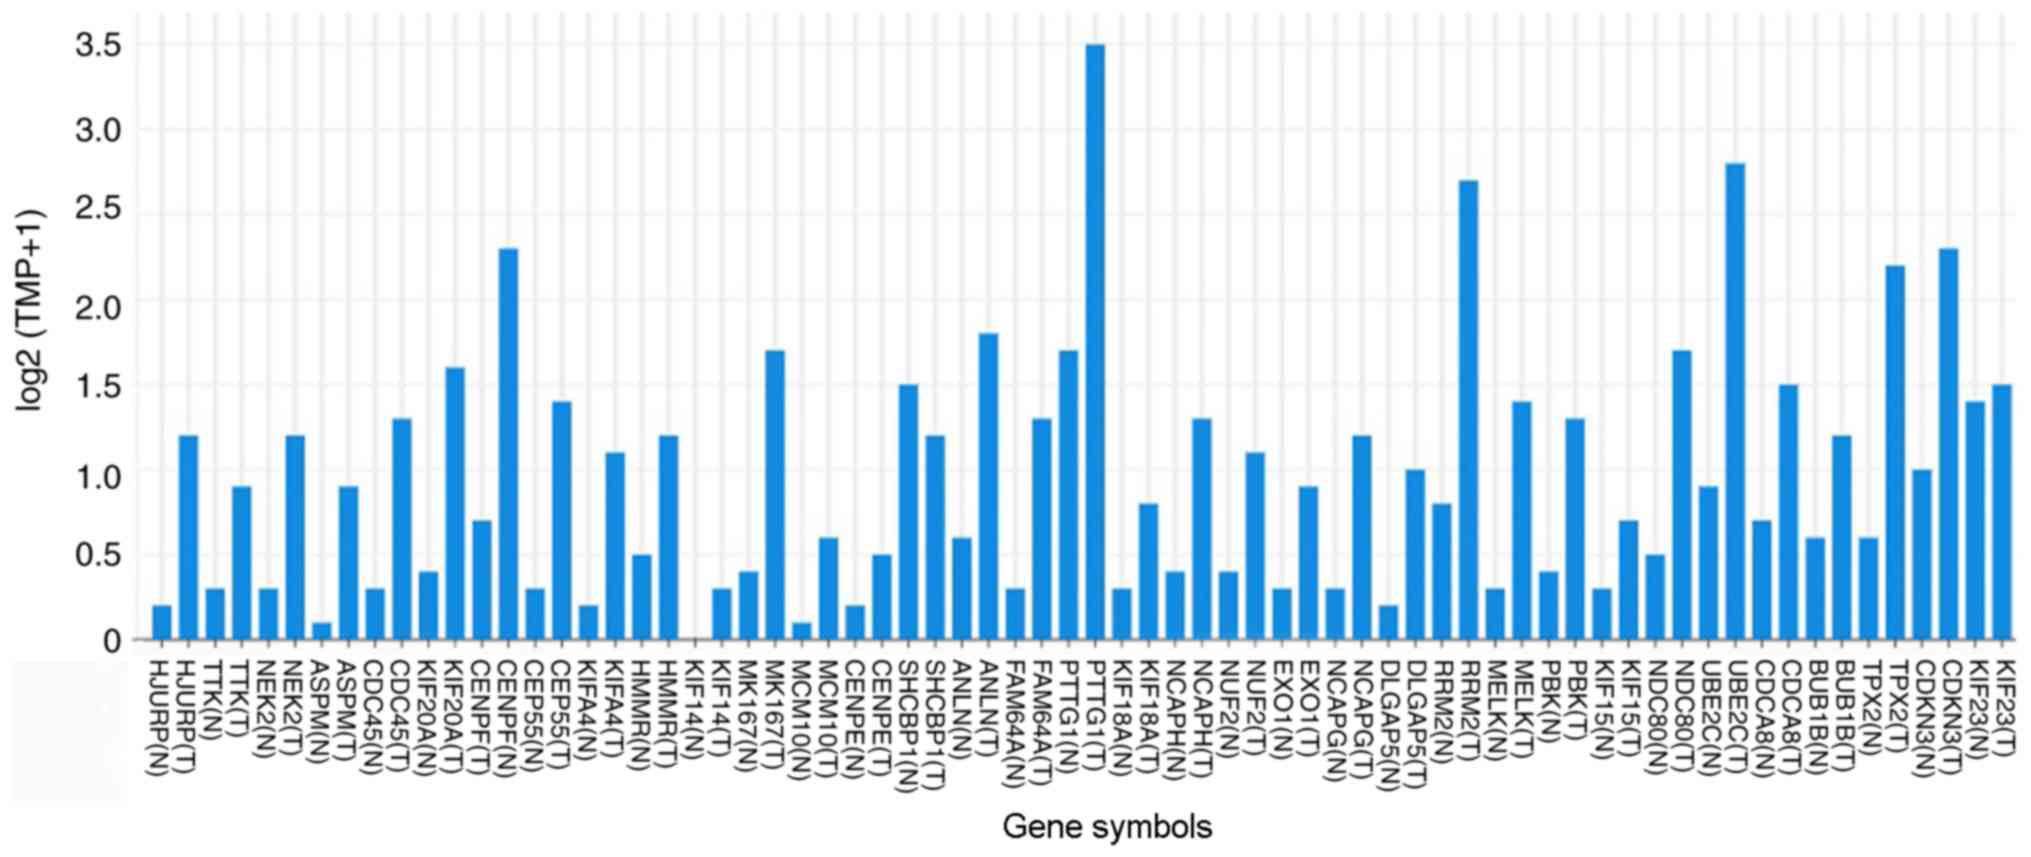
shown in Table II. Based on the
same cutoffs (|log2FC|>0.585 and P<0.0001), 26 of the 35 hub
genes were upregulated in ccRCC tissue compared with normal kidney
tissue from TCGA and GTEx projects (Fig.
6). Subsequently, survival analysis of the hub genes was
performed using a Kaplan-Meier curve in GEPIA. ccRCC patients with
high expression (>median expression value) of some hub genes
(CDKN3, TPX2, BUB1B, CDCA8, UBE2C, NDC80, RRM2, NCAPG, NCAPH,
PTTG1, FAM64A, ANLN, KIF4A, CEP55, CENPF, KIF20A, ASPM and HJURP)
showed worse OS time and RFS time (data not shown; P<0.05).
| Table II.Results of the 35 hub genes using the
Gene Expression Profiling Interactive Analysis software. |
Table II.
Results of the 35 hub genes using the
Gene Expression Profiling Interactive Analysis software.
| Hub gene | Overall survival
associated | Recurrence-free
survival associated | Clear cell renal
cell carcinoma versus normal kidney tissue |
|---|
| KIF23 | √a |
|
|
| CDKN3 | √ | √ | Upregulated |
| TPX2 | √ | √ | Upregulated |
| BUB1B | √ | √ | Upregulated |
| CDCA8 | √ | √ | Upregulated |
| UBE2C | √ | √ | Upregulated |
| NDC80 | √ | √ | Upregulated |
| KIF15 |
|
|
|
| PBK |
|
| Upregulated |
| MELK | √ |
| Upregulated |
| RRM2 | √ | √ | Upregulated |
| DLGAP5 |
|
| Upregulated |
| NCAPG | √ | √ | Upregulated |
| EXO1 |
|
|
|
| NUF2 | √ |
| Upregulated |
| NCAPH | √ | √ | Upregulated |
| KIF18A |
| √ |
|
| PTTG1 | √ | √ | Upregulated |
| FAM64A | √ | √ | Upregulated |
| ANLN | √ | √ | Upregulated |
| SHCBP1 |
|
|
|
| CENPE | √ |
|
|
| MCM10 |
|
|
|
| MKI67 |
|
| Upregulated |
| KIF14 |
| √ |
|
| HMMR |
| √ | Upregulated |
| KIF4A | √ | √ | Upregulated |
| CEP55 | √ | √ | Upregulated |
| CENPF | √ | √ | Upregulated |
| KIF20A | √ | √ | Upregulated |
| CDC45 | √ |
| Upregulated |
| ASPM | √ | √ | Upregulated |
| NEK2 |
| √ | Upregulated |
| TTK |
| √ |
|
| HJURP | √ | √ | Upregulated |
Discussion
Even with strict adherence to the National
Comprehensive Cancer Network guidelines (NCCN
Guidelines®), ~30% of ccRCC recurrences will be missed
(26). According to the guidelines,
patients with ccRCC would benefit from more aggressive treatment
and monitoring management. To find potentially effective
therapeutic targets, there is an urgent requirement to explore the
molecular mechanisms that lead to ccRCC metastasis. The present
study utilized a relatively large sample dataset obtained from
TCGA. These data were analyzed to identify DEGs between ccRCC
patients with metastasis and without metastasis. A total of 472
DEGs, including 247 upregulated genes and 225 downregulated genes,
were identified in the metastasis group compared with the
non-metastasis group. KEGG pathway analysis revealed that the DEGs
were mainly involved in the ‘cell cycle’ (hsa04110), ‘collecting
duct acid secretion’ (hsa04966), ‘complement and coagulation
cascades’ (hsa04610) and ‘aldosterone-regulated sodium
reabsorption’ (hsa04960) pathways. It is well known that the cell
cycle pathway serves an important role in the development of
different cancer types, including ccRCC (27). Askeland et al (28) showed that the cell cycle progression
score can predict metastatic progression of ccRCC following
resection. The present results suggest that the ‘collecting duct
acid secretion’, ‘complement and coagulation cascades’ and
‘aldosterone-regulated sodium reabsorption’ pathways may also be
associated with ccRCC metastasis. GO enrichment analysis revealed
that DEGs were mainly associated with ‘cell transmembrane movement’
and ‘mitotic cell cycle process’. The present results provide
bioinformatics evidence for further research.
The 35 overlapping genes among the top 50 genes in
the PPI network found using four ranking methods were selected. All
35 genes were upregulated in the metastasis group, and 26 genes of
them were upregulated in ccRCC tissues compared with normal kidney
tissues. This result reveals that these genes may serve an
important role in the progression of ccRCC. The expression level of
CDKN3, TPX2, BUB1B, CDCA8, UBE2C, NDC80, RRM2, NCAPG, NCAPH, PTTG1,
FAM64A, ANLN, KIF4A, CEP55, CENPF, KIF20A, ASPM and HJURP was
significantly associated with overall survival and recurrence-free
survival time (P<0.05). These findings may provide valuable
prognostic biomarkers and therapeutic targets for ccRCC; however,
further investigation is required.
Prior to the present study, few studies have
addressed the gaps in the molecular mechanisms that lead to ccRCC
metastases. Ho et al (29)
identified and validated 7 genes that support ccRCC metastases by
comparing gene expression profiles between metastatic tumors and
their patient-matched primary tumor. The 7 genes (DCN, SLIT2, LUM,
LAMA2, ADAMTS12, CEACAM6 and LMO3) were enriched for extracellular
matrix (ECM) genes. Ghatalia et al (30) identified 9 overexpressed kinase genes
(EPHB2, AURKA, GSG2, IKBKE, MELK, CSK, CHEK2, CDC7 and MAP3K8)
(P<0.001) in metastatic ccRCC tumor tissue. In the present
study, the aim was to focus on DEGs between the metastasis group
and the non-metastasis group. However, due to lack of experimental
validation, it is not clear whether these genes are causal or
merely markers. Notably, the metastasis group was not only
characterized by organ metastases, but also by more advanced tumors
(stage T3 72 vs. 28%) and less differentiated tumors (grade 4 45
vs. 9%), when compared with the non-metastasis group, respectively.
These results suggest DEGs between the groups may also be
associated with locally advanced tumors. The main aim of the
present study was to identify potential key genes for ccRCC with
metastasis and without metastasis, considering that advanced ccRCC
is just a relative definition that is likely to change as
treatments improve (31). From a
biological point of view, genes that promote tumor metastasis are
likely to be genes that promote tumor progression. Therefore, it is
reasonable that there were more T3/T4 or G3/G4 patients in the
metastasis group as compared with the non-metastasis group, as the
present study data shows. As few drugs have shown efficacy in the
adjuvant treatment for preventing ccRCC metastasis or recurrence
(32), more studies are required to
identify biomarkers and explore the molecular mechanism of ccRCC
metastasis.
There are a few important limitations to the present
study. One limitation is that there were more patients within the
non-metastatic group (n=416) compared with the metastatic group
(n=78). Another limitation is the difference in the proportion of
patients with T3/T4 or G3/G4 in the two groups. In addition,
stratified differential expression gene analysis based on
histological grade (or pathological T stage), was not performed.
Although a powerful significance level (P<0.0001) was used,
based on bioinformatic analysis, a study with a larger sample size
and experimental validation is required.
In conclusion, the present study identified key DEGs
in primary tumor tissues of ccRCC with metastasis compared with
ccRCC without metastasis. The key genes involved in the metastasis
of ccRCC may provide valuable prognostic biomarkers and therapeutic
targets for ccRCC.
Acknowledgements
Not applicable.
Funding
No funding was received.
Availability of data and materials
All data generated or analyzed during the present
study are included in this published article.
Authors' contributions
XH and ZX designed the study. WW and YL analyzed the
data and wrote the manuscript. ZG and YZ participated in analysis
and interpretation of the data and reviewed the article. XH gave
the final approval for publication. All authors read and approved
the final manuscript.
Ethics approval and consent to
participate
Not applicable.
Patient consent for publication
Not applicable.
Competing interests
The authors declare that they have no competing
interests.
References
|
1
|
Cohen HT and McGovern FJ: Renal-cell
carcinoma. N Engl J Med. 353:2477–2490. 2005. View Article : Google Scholar : PubMed/NCBI
|
|
2
|
Siegel RL, Miller KD and Jemal A: Cancer
statistics, 2016. CA Cancer J Clin. 66:7–30. 2016. View Article : Google Scholar : PubMed/NCBI
|
|
3
|
Clark PE: The role of VHL in clear-cell
renal cell carcinoma and its relation to targeted therapy. Kidney
Int. 76:939–945. 2009. View Article : Google Scholar : PubMed/NCBI
|
|
4
|
Wolff I, May M, Hoschke B, Zigeuner R,
Cindolo L, Hutterer G, Schips L, De Cobelli O, Rocco B, De Nunzio
C, et al: Do we need new high-risk criteria for surgically treated
renal cancer patients to improve the outcome of future clinical
trials in the adjuvant setting? Results of a comprehensive analysis
based on the multicenter CORONA database. Eur J Surg Oncol.
42:744–750. 2016. View Article : Google Scholar : PubMed/NCBI
|
|
5
|
Frank I, Blute ML, Cheville JC, Lohse CM,
Weaver AL and Zincke H: An outcome prediction model for patients
with clear cell renal cell carcinoma treated with radical
nephrectomy based on tumor stage, size, grade and necrosis: The
SSIGN score. J Urol. 168:2395–2400. 2002. View Article : Google Scholar : PubMed/NCBI
|
|
6
|
Pal SK, Williams S, Josephson DY,
Carmichael C, Vogelzang NJ and Quinn DI: Novel therapies for
metastatic renal cell carcinoma: Efforts to expand beyond the
VEGF/mTOR signaling paradigm. Mol Cancer Ther. 11:526–537. 2012.
View Article : Google Scholar : PubMed/NCBI
|
|
7
|
Courtney KD and Choueiri TK: Updates on
novel therapies for metastatic renal cell carcinoma. Ther Adv Med
Oncol. 2:209–219. 2010. View Article : Google Scholar : PubMed/NCBI
|
|
8
|
Hsieh JJ, Purdue MP, Signoretti S, Swanton
C, Albiges L, Schmidinger M, Heng DY, Larkin J and Ficarra: Renal
cell carcinoma. Nat Rev Dis Primers. 3:170092017. View Article : Google Scholar : PubMed/NCBI
|
|
9
|
Lv Y, Wei W, Huang Z, Chen Z, Fang Y, Pan
L, Han X and Xu Z: Long non-coding RNA expression profile can
predict early recurrence in hepatocellular carcinoma after curative
resection. Hepatol Res. 48:1140–1148. 2018. View Article : Google Scholar : PubMed/NCBI
|
|
10
|
Lin Y, Lv Y, Liang R, Yuan C and Zhang J,
He D, Zheng X and Zhang J: Four-miRNA signature as a prognostic
tool for lung adenocarcinoma. Onco Targets Ther. 11:29–36. 2018.
View Article : Google Scholar : PubMed/NCBI
|
|
11
|
Yu L, Xiang L, Feng J, Li B, Zhou Z, Li J,
Lin Y, Lv Y, Zou D, Lei Z and Zhang J: miRNA-21 and miRNA-223
expression signature as a predictor for lymph node metastasis,
distant metastasis and survival in kidney renal clear cell
carcinoma. J Cancer. 9:3651–3659. 2018. View Article : Google Scholar : PubMed/NCBI
|
|
12
|
Idris SF, Ahmad SS, Scott MA, Vassiliou GS
and Hadfield J: The role of high-throughput technologies in
clinical cancer genomics. Expert Rev Mol Diagn. 13:167–181. 2013.
View Article : Google Scholar : PubMed/NCBI
|
|
13
|
Le Gallo M, Lozy F and Bell DW:
Next-generation sequencing. Adv Exp Med Biol. 943:119–148. 2017.
View Article : Google Scholar : PubMed/NCBI
|
|
14
|
Goldman M, Craft B, Kamath A, Brooks AN,
Zhu J and Haussler D: The UCSC Xena platform for cancer genomics
data visualization and interpretation. BioRxiv. May 18–2018.(Epub
ahead of print). doi: https://doi.org/10.1101/326470.
|
|
15
|
Love MI, Huber W and Anders S: Moderated
estimation of fold change and dispersion for RNA-seq data with
DESeq2. Genome Biol. 15:5502014. View Article : Google Scholar : PubMed/NCBI
|
|
16
|
Torto-Alalibo T, Purwantini E, Lomax J,
Setubal JC, Mukhopadhyay B and Tyler BM: Genetic resources for
advanced biofuel production described with the Gene Ontology. Front
Microbiol. 5:5282014. View Article : Google Scholar : PubMed/NCBI
|
|
17
|
Kanehisa M: The KEGG database. Novartis
Found Symp. 247:91–101. 2002. View Article : Google Scholar : PubMed/NCBI
|
|
18
|
Yu G, Wang LG, Han Y and He QY:
ClusterProfiler: An R package for comparing biological themes among
gene clusters. OMICS. 16:284–287. 2012. View Article : Google Scholar : PubMed/NCBI
|
|
19
|
Franceschini A, Szklarczyk D, Frankild S,
Kuhn M, Simonovic M, Roth A, Lin J, Minguez P, Bork P, von Mering C
and Jensen LJ: STRING v9.1: Protein-protein interaction networks,
with increased coverage and integration. Nucleic Acids Res.
41:D808–D815. 2013. View Article : Google Scholar : PubMed/NCBI
|
|
20
|
Shannon P, Markiel A, Ozier O, Baliga NS,
Wang JT, Ramage D, Amin N, Schwikowski B and Ideker T: Cytoscape: A
software environment for integrated models of biomolecular
interaction networks. Genome Res. 13:2498–2504. 2003. View Article : Google Scholar : PubMed/NCBI
|
|
21
|
Chin CH, Chen SH, Wu HH, Ho CW, Ko MT and
Lin CY: CytoHubba: Identifying hub objects and sub-networks from
complex interactome. BMC Syst Biol. 4:S112014. View Article : Google Scholar
|
|
22
|
Jeong H, Mason SP, Barabasi AL and Oltvai
ZN: Lethality and centrality in protein networks. Nature.
411:41–42. 2001. View
Article : Google Scholar : PubMed/NCBI
|
|
23
|
Lin CY, Chin CH, Wu HH, Chen SH, Ho CW and
Ko MT: Hubba: Hub objects analyzer-A framework of interactome hubs
identification for network biology. Nucleic Acids Res.
36:W438–W443. 2008. View Article : Google Scholar : PubMed/NCBI
|
|
24
|
Ritchie ME, Phipson B, Wu D, Hu Y, Law CW,
Shi W and Smyth GK: Limma powers differential expression analyses
for RNA-sequencing and microarray studies. Nucleic Acids Res.
43:e472015. View Article : Google Scholar : PubMed/NCBI
|
|
25
|
Tang Z, Li C, Kang B, Gao G, Li C and
Zhang Z: GEPIA: A web server for cancer and normal gene expression
profiling and interactive analyses. Nucleic Acids Res. 45:W98–W102.
2017. View Article : Google Scholar : PubMed/NCBI
|
|
26
|
Gerlinger M, Horswell S, Larkin J, Rowan
AJ, Salm MP, Varela I, Fisher R, McGranahan N, Matthews N, Santos
CR, et al: Genomic architecture and evolution of clear cell renal
cell carcinomas defined by multiregion sequencing. Nat Genet.
46:225–233. 2014. View
Article : Google Scholar : PubMed/NCBI
|
|
27
|
Champeris Tsaniras S, Kanellakis N,
Symeonidou IE, Nikolopoulou P, Lygerou Z and Taraviras S: Licensing
of DNA replication, cancer, pluripotency and differentiation: An
interlinked world? Semin Cell Dev Biol. 30:174–180. 2014.
View Article : Google Scholar : PubMed/NCBI
|
|
28
|
Askeland EJ, Chehval VA, Askeland RW,
Fosso PG, Sangale Z, Xu N, Rajamani S, Stone S and Brown JA: Cell
cycle progression score predicts metastatic progression of clear
cell renal cell carcinoma after resection. Cancer Biomark.
15:861–867. 2015. View Article : Google Scholar : PubMed/NCBI
|
|
29
|
Ho TH, Serie DJ, Parasramka M, Cheville
JC, Bot BM, Tan W, Wang L, Joseph RW, Hilton T, Leibovich BC, et
al: Differential gene expression profiling of matched primary renal
cell carcinoma and metastases reveals upregulation of extracellular
matrix genes. Ann Oncol. 28:604–610. 2017.PubMed/NCBI
|
|
30
|
Ghatalia P, Yang ES, Lasseigne BN, Ramaker
RC, Cooper SJ, Chen D, Sudarshan S, Wei S, Guru AS, Zhao A, et al:
Kinase gene expression profiling of metastatic clear cell renal
cell carcinoma tissue identifies potential new therapeutic targets.
PLoS One. 11:e01609242016. View Article : Google Scholar : PubMed/NCBI
|
|
31
|
Makhov P, Joshi S, Ghatalia P, Kutikov A,
Uzzo RG and Kolenko VM: Resistance to systemic therapies in clear
cell renal cell carcinoma: Mechanisms and management strategies.
Mol Cancer Ther. 17:1355–1364. 2018. View Article : Google Scholar : PubMed/NCBI
|
|
32
|
Massari F, Di Nunno V, Ciccarese C, Graham
J, Porta C, Comito F, Cubelli M, Iacovelli R and Heng DYC: Adjuvant
therapy in renal cell carcinoma. Cancer Treat Rev. 60:152–157.
2017. View Article : Google Scholar : PubMed/NCBI
|