Introduction
With annually increasing morbidity and mortality
rates, renal cell carcinoma (RCC) accounts for ~90% of all renal
malignancies and represents 2–3% of all human cancer types
(1,2). In the early stages of RCC, patients do
not exhibit specific clinical symptoms, including mass, hematuria
and local pain, and 20–30% of all patients are diagnosed with the
metastatic disease (3). Generally,
radical surgery may achieve positive therapeutic results; however,
metastasis is observed in 20–40% of patients with localized or
locally advanced RCC who undergo early radical surgery (4). Advanced metastatic RCC responds poorly
to simple excision, is insensitive to chemotherapy and is prone to
develop drug resistance, with only 7–10% efficiency for
chemotherapeutic drugs (5).
Therefore, the recommended conventional therapies are primarily
immunotherapy and targeted drug therapy (6). With the progression of molecular
genetics in the study of RCC, there has been rapid development in
molecular targeted therapy, targeting cell receptors,
tumor-associated genes and signaling pathways. Accumulating
clinical evidence demonstrated that targeted drugs may improve the
prognosis of patients with RCC (7,8).
Previously, novel micromolecular-targeted drugs,
including sunitinib, markedly improved the therapeutic prospect of
patients with advanced RCC, contributing to a marked increase in
the survival rate and total remission rate of patients with RCC
(9,10). However, a considerable proportion of
patients with RCC are not able to experience clinical benefits, and
the majority of patients develop drug resistance or even RCC
progression, typically in the first 6–15 months after therapy, due
to the severe limitations of targeted drug resistance on
therapeutic effects (11,12).
Nuclear factor erythroid-2 related factor 2 (Nrf2),
a key transcription factor, activates the endogenous antioxidant
response by regulating cellular antioxidant stress (13). The antioxidant-responsive element
(ARE) is a promoter sequence located in the upstream regulatory
region of certain protective genes, which may be activated by Nrf2
(14). When Nrf2 is activated by
toxic and harmful substances, it translocates to the nucleus and
interacts with ARE to activate Nrf2-ARE target genes, leading to
the regulation of downstream antioxidant proteins, oxidases and
phase II detoxifying enzymes (15).
Nrf2-ARE signaling promotes tumor growth and induces drug
resistance in non-small-cell lung cancer, and inhibition of Nrf2
signaling significantly suppressed colon tumor cell growth
(16,17). Samatiwat et al (18) identified that suppression of
Nrf2-regulated genes via small interfering (si)RNA increased the
sensitivity to 5-fluorouracil and gemcitabine in cholangiocarcinoma
cells. Additionally, Akhdar et al (19) demonstrated that suppression of Nrf2
via a drug inhibitor or siRNA transfection increased the
sensitivity to chemotherapy drugs, including 5-fluorouracil, in
colorectal cancer.
However, the role of Nrf2-ARE signaling in RCC and
its detailed molecular mechanism remain unknown. Therefore, the
present study was conducted to examine how Nrf2-ARE signaling
affects the biological characteristics of RCC and sensitivity to
sunitinib, to provide a novel theoretical basis to better predict
the prognosis of patients with RCC and to select targeted
drugs.
Materials and methods
Study subjects
The protocol in the present study was approved by
the Ethics Committee of The First Affiliated Hospital of Soochow
University, Suzhou, China (approval no. 2013031), and all research
subjects provided written informed consent. All procedures in the
present study strictly complied with the guidelines and principles
of the Declaration of Helsinki. Between January 2010 and January
2012, a total of 108 patients with RCC from The First Affiliated
Hospital of Soochow University (Suzhou China), who received radical
nephrectomy were enrolled in the present study, consisting of 78
males and 30 females aged between 31 and 78 years (mean age:
52.90±14.01 years). All subjects were diagnosed with RCC by
pathological examination following surgery. Adjacent tissues, 4 cm
away from carcinoma tissues were selected for the control group.
The inclusion criteria were as follows: Complete pathology reports
and other associated data, did not receive radiotherapy,
chemotherapy or immunotherapy prior to surgery, did not possess
tumors in other parts of the body, and did not have a previous
history of diseases of the heart, liver, kidney or other systems.
According to pathological type, 81 patients had renal clear cell
carcinoma; eight patients had granular cell basal cell carcinoma;
14 patients had papillary RCC; and five patients had other types of
RCC. Based on the Fuhrman histological classification of RCC, 66
cases were in grade I + II and 42 cases in grade III + IV (20). On the basis of the Tumor Node
Metastasis (TNM) staging system designed by the Union for
International Cancer Control in 2009, 35 cases were in stage I; 29
cases were in stage II; 30 cases were in stage III and 14 cases
were in stage IV; and 29 cases had lymph node metastasis, whereas,
79 cases did not (21).
Immunohistochemistry
Tissue specimens collected from all the patients
with RCC were fixed in 4% paraformaldehyde for 5 min at room
temperature, embedded in paraffin and cut into 3 µm sections. The
sections were deparaffinized in xylene and dehydrated in 100, 90,
70, and 50% alcohol solutions (5 min each at 37°C), followed by
antigen retrieval in a citrate solution of pH 7.2–7.4. The sections
were then blocked in 10% normal donkey serum (Chemicon
International; Thermo Fisher Scientific, Inc., Waltham, MA, USA) in
PBS at 37°C for 30 min. Primary antibodies used were rabbit
monoclonal antibodies for Nrf2 (cat. no., sc-365949, Santa Cruz
Biotechnology, Inc., Dallas, TX, USA), NAD(P)H dehydrogenase
[quinone] 1 (NQO1, cat. no., sc-376023; Santa Cruz Biotechnology,
Inc.) and heme oxygenase-1 (HO-1; cat. no., sc-136960; Santa Cruz
Biotechnology, Inc., Dallas, TX, USA) at 1:100 dilution, which were
incubated with tissue sections at 4°C overnight. Following
incubation with the primary antibodies, the sections were washed
with PBS (0.01 mol/l). The biotinylated secondary antibody (1
mg/ml; cat. no., BA1080; Wuhan Boster Biological Technology Co.,
Ltd., Wuhan, China) was added, followed by a 30-min incubation at
37°C, 10-min diaminobenzidine staining at 37°C, counterstaining
with hematoxylin for 30 sec at 37°C, dehydration with 100, 90, 70,
and 50% alcohol (5 min each at 37°C), clearing and mounting with
neutral gum. The sections were observed under a light microscope
(magnification, ×200). Parameters were calculated using Image-Pro
Plus 6.0 (Media Cybernetics, Inc., Rockville, MD, USA) pathological
image analysis software for statistical analysis.
The positive expression of Nrf2, NQO1 and HO-1 was
determined by a score and a semi-quantitative method in the
cytoplasm (22). Under high
magnification, 10 fields (100 cells/field) were randomly selected
to calculate the average percentage of positive cells in each field
per section as follows: i) 0 for no positive cells; ii) 1 for
<10% positive cells; iii) 2 for 10–50% positive cells; iv) 3 for
50–80% positive cells; and v) 4 for 80–100% positive cells. Based
on the staining characteristics of the majority of positive cells,
the staining intensity was scored as: i) 0 for no intensity; ii) 1
for light yellow; iii) 2 for pale brown; iv) and 3 for sepia. The
score of the average positive cell was multiplied by the score of
staining intensity: 1–3 for negative and 4–12 for positive.
Follow-up
The five-year overall survival (OS) rate was
determined from the date of diagnosis. The follow-up was conducted
via outpatient service, telephone calls or medical records. The OS
rate was defined as the time from the date of first surgery until
mortality or the last follow-up, and the survival time was
calculated monthly.
Cell selection and culture
Human RCC cells (ACHN, Caki-1, 769-P and 786-0) were
purchased from the Cell Resource Center of Shanghai Institute of
Life Science (Shanghai, China) and human kidney tubule epithelia
cells (HK-2) were obtained from The American Type Culture
Collection, Manassas, VA, USA. All cells were cultured in RPMI-1640
culture solution (Gibco; Thermo Fisher Scientific, Inc.),
containing 10% fetal bovine serum (Gibco; Thermo Fisher Scientific,
Inc.), 100 U/ml penicillin and 100 µg/ml streptomycin. All cells
were cultured at 37°C in an incubator with 5% CO2,
followed by passages when cell confluence reached 80–90% and
passaging once every 2–3 days. Cells in the logarithmic phase were
inoculated in 6-well plates at 3×10³ cells/well for
further experiments.
Cell grouping and transfection
The 786-0 cells were divided into three groups; the
mock group (blank group of 786-0 cells), the negative control (NC)
group (786-0 cells transfected with empty plasmid) and the small
hairpin (sh)RNA-Nrf2 group (786-0 cells transfected with shRNA-Nrf2
plasmid). The cells in the logarithmic phase in each group were
inoculated in 6-well plates at 4×10⁵ cells/well and
transfected with Lipofectamine® 3000 (cat no. L3000015;
Invitrogen; Thermo Fisher Scientific, Inc.) according to the
manufacturer's protocol. The shRNA-Nrf2 plasmid and empty plasmid
(200 ng, purchased from OriGene Technologies, Inc., Beijing, China)
were diluted with Opti-Minimum Essential Medium (MEM;
Sigma-Aldrich; Merck KGaA, Darmstadt, Germany). The diluted plasmid
and Lipofectamine® 3000 were added to 100 µl Opti-MEM,
mixed and added to 6-well plates (200 µl/well). After transfection
for 6–8 h, the media was changed and the cells were incubated at
37°C with 5% CO2. Further experiments were conducted at
48 h following transfection.
Cell Counting Kit-8 (CCK-8) assay
The 786-0 cells in the logarithmic phase in each
group were washed with PBS, digested with trypsin and made into a
cell suspension. Subsequently, 100 µl cell suspension was added to
each well and incubated for 12, 24, 48 or 72 h at 37°C in a
CO2 incubator. Each group had three parallel control
wells. A total of 10 µl CCK-8 reagent (cat. no. CK04; Dojindo
Molecular Technologies, Inc., Shanghai, China) was added for 1 h
incubation. The optical density (OD) value at 450 nm was measured
using a microplate reader (Thermo Fisher Scientific, Inc.). Each
experiment was repeated three times to obtain the average OD value.
Additionally, the transfected 786-0 cells had 24, 48 and 72 h
cultures in different concentrations of sunitinib (0.1, 0.2, 0.5,
1.0, 2.0, 5.0 and 10 µmol/l). The cell viability was calculated
using the following equation: OD value of the experimental group/OD
value of the blank group ×100. The cell viability was additionally
used to calculate the half maximal inhibitory concentration
(IC50).
Matrigel™ chamber invasion assay
Following melting at 4°C, Matrigel™ was diluted to a
1:3 ratio with serum-free Dulbecco's modified Eagle's medium (DMEM;
Invitrogen; Thermo Fisher Scientific, Inc.), mixed and added into
each upper chamber and dried at room temperature. Following
digestion with trypsin, 786-0 cells in each group were added to
serum-free DMEM to make cell suspensions at a density of
1×10⁵ cells/ml for 24-h culture. The 786-0 cell
suspension was added to the upper chamber (200 µl per chamber), and
500 µl DMEM containing 10% fetal bovine serum (Hyclone; GE
Healthcare Life Sciences, Logan, UT, USA) was added to 24-well
plates without introducing air bubbles. A Transwell chamber was
placed into each well. Following a 20 h routine culture, the
chamber was removed and washed with PBS. Following culture removal,
the residual Matrigel™ and 786-0 cells in the chamber microporous
membrane were wiped with a cotton swab, followed by a 15-min
fixation at 37°C in 95% alcohol and crystal violet staining for 5
min at 37°C. The average number of 786-0 cells crossing the
membrane was observed under an inverted light microscope
(magnification, ×200).
Scratch assay
Cells in each group were seeded into 6-well plates
at 5×10⁴ cells/well. Following adherence to the surface,
cells were scratched gently with a 2 mm spatula. The cells were
subsequently rinsed with PBS and cultured in serum-free DMEM for 24
h. Scratch wound healing was observed under an inverted light
microscope (×200) and imaged at 0 and 24 h. Image-Pro Plus 6.0
software was used to measure the distance between two scratches.
The scratch-healing rate was calculated as follows: (distance at
1–24 h/distance at 0 h) × 100.
Reverse transcription-quantitative
polymerase chain reaction (RT-qPCR)
Total RNA of the 786-0 cells was extracted with a
TRIzol reagent kit (Qiagen, Inc., Valencia, CA, USA), according to
the manufacturer's protocol. cDNA was synthesized from 200 ng of
total RNA by reverse transcription using a Transcriptor
First-Strand cDNA Synthesis kit (Roche Diagnostics, Basel,
Switzerland). According to the gene sequences of the GenBank
database (https://www.ncbi.nlm.nih.gov/pubmed/), the primers
were designed using Primer Premier 5.0 software (Premier Biosoft
International, Palo Alto, CA, USA; Table
I) and were synthesized by Shanghai Sangon Pharmaceutical Co.,
Ltd., (Shanghai, China). Each 20 µl PCR system consisted of 10 µl
SYBR PremixExTaq (Takara Bio, Inc., Otsu, Japan), 0.8 µl 10 nM
forward primer, 0.8 µl 10 nM reverse primer, 0.4 µl ROX reference
dye II, 2 µl DNA template and 6.0 µl dH2O. The RT-qPCR
was conducted under the following conditions: 40 cycles of 30 sec
predenaturation at 95°C, 5 sec denaturation at 95°C, 30 sec
annealing at 60°C and 30 sec extension at 72°C. GAPDH was used as
an internal reference. The quantification cycle (Cq) for the
relative expression of target gene was calculated using the
relative quantitative 2−ΔΔCq method (23,24).
 | Table I.Primer sequences for quantitative
PCR. |
Table I.
Primer sequences for quantitative
PCR.
| PCR primer
sequences | Forward, 5′-3′ | Reverse, 5′-3′ |
|---|
| Nrf2 |
ACACGGTCCACAGCTCATC |
TGTCAATCAAATCCATGTCCTG |
| NQO1 |
ATGTATGACAAAGGACCCTTCC |
TCCCTTGCAGAGAGTACATGG |
| HO-1 |
AACTTTCAGAAGGGCCAGGT |
CTGGGCTCTCCTTGTTGC |
| GST |
GACTGCTTTCTTCAGGGTTCAAG |
TCTGTGTAATTCATGGCTGATTCC |
| GADPH |
CTGACTTCAACAGCGACACC |
TGCTGTAGCCAAATTCGTTGT |
Western blotting
Total protein of the 786-0 cells was extracted using
the Bicinchoninic Acid Protein Assay kit (cat. no. AR0146; Wuhan
Boster Biological Technology Co., Ltd.) to detect the protein
concentration. The loading buffer was added to the extracted
proteins, following boiling at 95°C for 10 min. A total of 30 µg
proteins was loaded in each well of a 10% polyacrylamide gel. Gel
electrophoresis was run at 80 and 120 V, followed by a wet transfer
at 100 mV for 45–70 min to polyvinylidene difluoride (PVDF)
membranes. Following a 1 h incubation with 5% bovine serum albumin
(Hyclone; GE Healthcare Life Sciences) at room temperature, PVDF
membranes were incubated with primary antibodies against Nrf2 (cat.
no. sc-365949; Santa Cruz Biotechnology, Inc.), NQO1 (cat. no.
sc-376023; Santa Cruz Biotechnology, Inc.), HO-1 (cat. no.
sc-136960; Santa Cruz Biotechnology, Inc.) or glutathione
S-transferase (GST; cat. no. sc-53909; Santa Cruz Biotechnology,
Inc.) at a 1:1,000 dilution and GAPDH (cat. no. 5174; Cell
Signaling Technology, Inc., Danvers, MA, USA) at 1:5,000 dilution
at 4°C overnight, and washed with TBS with Tween-20 (TBST) three
times (5 min/time). The membranes were subsequently incubated with
the HRP-conjugated anti-mouse IgG secondary antibody (cat. no.
sc-51625; 1:3,000 dilution; Santa Cruz Biotechnology, Inc.) at room
temperature for 1 h. The membranes were washed with TBST three
times (5 min/time) and chemiluminescence reagent (ECL Plus; GE
Healthcare) was added to develop using a Bio-Rad Gel Dol EZ imager
(GEL DOC EZ IMAGER; Bio-Rad Laboratories, Inc., Hercules, CA, USA)
with GAPDH as an internal reference. The gray value of each target
band was analyzed using ImageJ 1.43 software (National Institutes
of Health, Bethesda, MD, USA).
Flow cytometry
The 786-0 cells were separated into four groups: The
control group (an untreated control), the sunitinib group [786-0
cells treated with sunitinib (IC50 5.172 µmol/l)], the
NC + sunitinib group (786-0 cells transfected with empty plasmid
and treated with sunitinib) and the shRNA-Nrf2 + sunitinib group
(786-0 cells transfected with shRNA-Nrf2 and treated with
sunitinib). The 786-0 cells in each group in the logarithmic phase
were collected and fixed with absolute alcohol at 4°C overnight.
The cells were washed with PBS and centrifuged for 5 min at 500 × g
at 37°C, following which the supernatant was removed. Cells were
resuspended in 100 µl PBS followed by staining with propidium
iodide (PI; 300 µl) in the Annexin V kit at 4°C and 15 min
incubation at room temperature in the dark. A flow cytometer (BD
Pharmingen; BD Biosciences, San Jose, CA, USA) was used to
determine cell cycle stage and the percentage of cells in each
phase. An Annexin V kit (cat. no. C1063; Beyotime Institute of
Biotechnology, Beijing, China) was used to detect apoptotic cells.
The apoptotic rate was calculated as follows: Early apoptosis rate
[Annexin V-fluorescein isothiocyanate (FITC) positive/PI negative]
+ late apoptosis rate (Annexin V-FITC positive/PI positive). Cell
culture medium in 6-well plates was removed into centrifuge tubes
and digested with 0.25% trypsin. Following trypsinization, the
supernatant was extracted to add into the originally collected
culture medium, and a 5 min centrifugation at 3,600 g at 4°C was
performed to collect the cell precipitate. PBS was added to
resuspend the cell precipitate as a 50–100,000 cell solution. The
resuspended cells were added to a final volume of 300 µl with
Annexin V-FITC and PI, incubated at 4°C in the dark for 30 min, and
detected using a flow cytometer (BD Pharmingen; BD Biosciences)
with a post-ice bath. Cell Quest 3.0 software (Becton-Dickinson and
Company, Franklin Lakes, NJ, USA) was used to analyze the
results.
Gene perturbation analysis
Gene Perturbation Atlas 1.0 (GPA; http://biocc.hrbmu.edu.cn/GPA/) software was used
to evaluate the perturbation of gene interaction subnetworks. For
each perturbed gene, its directly interacting genes and DEGs, at a
distance of two steps, in the protein interaction network were
extracted to construct its initiated subnetwork.
Statistical analysis
Statistical analysis was performed using SPSS 19.0
software (IBM Corp., Armonk, NY, USA). Each experiment was repeated
in triplicate. The measurement data in a normal distribution is
presented as the mean ± standard deviation. Differences between two
groups were compared using the t-test. One-way analysis of variance
(ANOVA) with Tukey's honestly significant difference (HSD) post hoc
test was used to analyze multiple comparisons. The enumeration data
are expressed as a percentage and ration, and were analyzed using
the χ2 test. Survival rate curves were plotted according
to the Kaplan-Meier method and compared by the log-rank test. The
IC50 of 786-0 cells was calculated using GraphPad Prism
6.0 software (GraphPad Software, Inc., La Jolla, CA, USA).
P<0.05 was considered to indicate a statistically significant
difference.
Results
Nrf2, NQO1 and HO-1 protein expression
in RCC
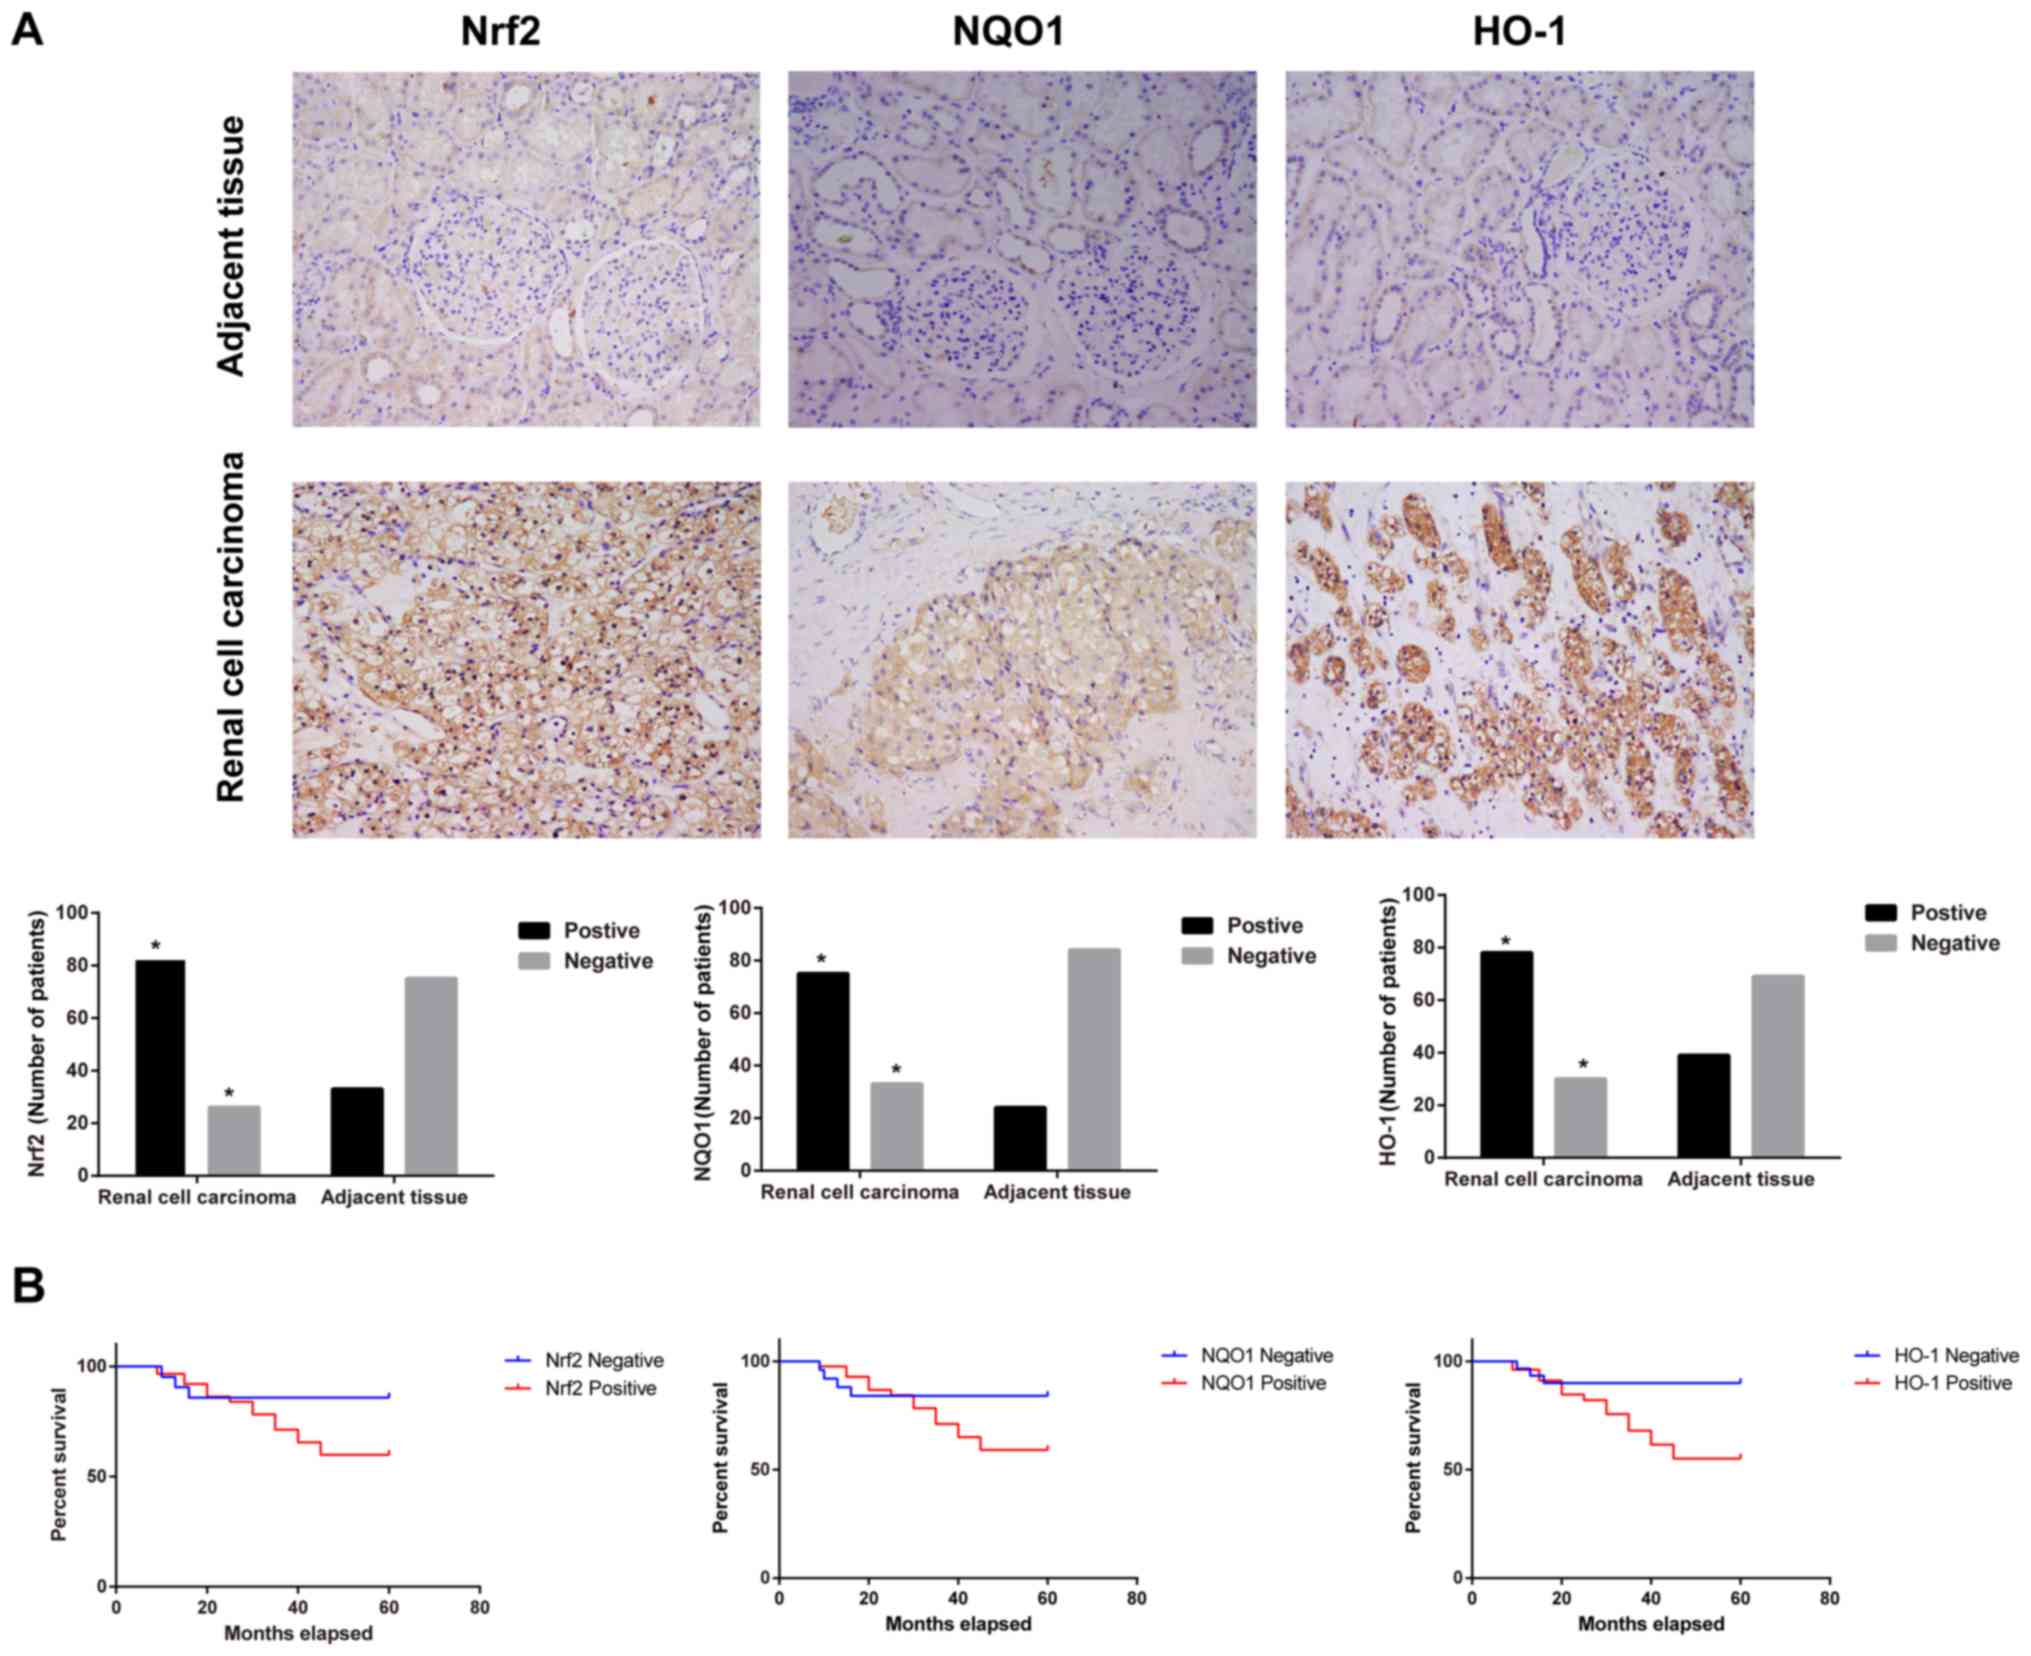
Nrf2 is a critical transcription regulator of a
series of antioxidants and detoxification enzymes that serve
critical roles in regulating the sensitivity of chemotherapeutic
agents (13,25). By uncoupling with Kelch-like
ECH-associated protein 1 (Keap1), Nrf2 initiates the expression of
antioxidant genes, including NQO1 and HO-1 (26,27). The
protein expression of Nrf2, NQO1 and HO-1 was examined in RCC
tissues and adjacent tissues. The results demonstrated that Nrf2,
NQO1 and HO-1 were weakly stained in adjacent tissues, whereas in
RCC tissues they were markedly stained sepia in the cytoplasm
(Fig. 1A). The statistical analysis
demonstrated that the positive rates of Nrf2, NQO1 and HO-1 in
adjacent tissues and RCC tissues was 30.56 vs. 75.93, 22.22 vs.
69.44 and 36.11 vs. 72.22, respectively (data not shown). When the
number of patients with positive staining in RCC tissues was
compared with the adjacent tissues, the expression of Nrf2, NQO1
and HO-1 was significantly increased in RCC tissues (χ2
test; all P<0.05). As presented in Fig. 1B, the Kaplan-Meier survival rate
curve indicated that the patients with negative Nrf2, NQO1 or HO-1
expression had longer OS compared with patients with positive
expression of Nrf2, NQO1 or HO-1, respectively, (log-rank test; all
P<0.05) according to the 5-year follow-ups of patients with
RCC.
Associations of Nrf2-ARE signaling
pathway-associated protein expression and clinicopathological
features in RCC. Table II
demonstrates that the expression levels of Nrf2, NQO1 and HO-1 were
not significantly different according to age, sex or pathological
type (χ2 test; all P>0.05); however, were
significantly different according to TNM stage, Fuhrman
classification and lymph node metastasis (χ2 test; all
P<0.05). Additionally, the positive rates of Nrf2, NQO1 and HO-1
in patients at stage III–IV (TNM staging), at grade III+IV (Fuhrman
classification) and with lymph node metastasis were significantly
higher compared with patients at stage I–II, at grade I+II and
without lymph node metastasis, respectively (χ2 test;
all P<0.05).
| Table II.Correlations of expression levels of
Nrf2, NQO1 and HO-1, and clinicopathological features in renal cell
carcinoma. |
Table II.
Correlations of expression levels of
Nrf2, NQO1 and HO-1, and clinicopathological features in renal cell
carcinoma.
|
|
| Nrf2 |
| NQO1 |
| HO-1 |
|
|---|
|
|
|
|
|
|
|
|
|
|---|
| Variables | n | Positive cases
(%) | P-value | Positive cases
(%) | P-value | Positive cases
(%) | P-value |
|---|
| Sex |
|
| 0.539 |
| 0.339 |
| 0.749 |
|
Male | 78 | 58 (74.36) |
| 51 (87.93) |
| 57 (73.08) |
|
|
Female | 30 | 24 (80.00) |
| 24 (80.00) |
| 21 (70.00) |
|
| Age |
|
| 0.664 |
| 0.907 |
| 0.962 |
|
<50 | 50 | 37 (74.00) |
| 35 (70.00) |
| 36 (72.00) |
|
|
≥50 | 58 | 45 (77.59) |
| 40 (68.97) |
| 42 (72.41) |
|
| Pathological
types |
|
| 0.795 |
| 0.399 |
| 0.804 |
| Clear
cell carcinoma | 81 | 61 (75.31) |
| 58 (71.60) |
| 59 (72.84) |
|
|
Non-clear cell carcinoma | 27 | 21 (77.78) |
| 17 (62.96) |
| 19 (70.37) |
|
| Fuhrman
classification |
|
| 0.018 |
| 0.003 |
| 0.039a |
|
I+II | 66 | 45 (68.18) |
| 39 (59.09) |
| 43 (65.15) |
|
|
III+IV | 42 | 37 (88.10) |
| 36
(85.71)a |
| 35
(83.33)a |
|
| TNM staging |
|
| 0.010 |
| 0.021 |
| 0.022a |
|
I–II | 64 | 43 (67.19) |
| 39 (60.94) |
| 41 (64.06) |
|
|
III–IV | 44 | 39 (88.64) |
| 36
(81.82)a |
| 37
(84.09)a |
|
| Lymph node
metastasis |
|
| <0.001 |
| <0.001 |
|
<0.001a |
|
Positive | 29 | 29 (100.00) |
| 29 (100.00) |
| 28 (96.55) |
|
|
Negative | 79 | 53 (67.09) |
| 46
(58.23)a |
| 50
(63.29)a |
|
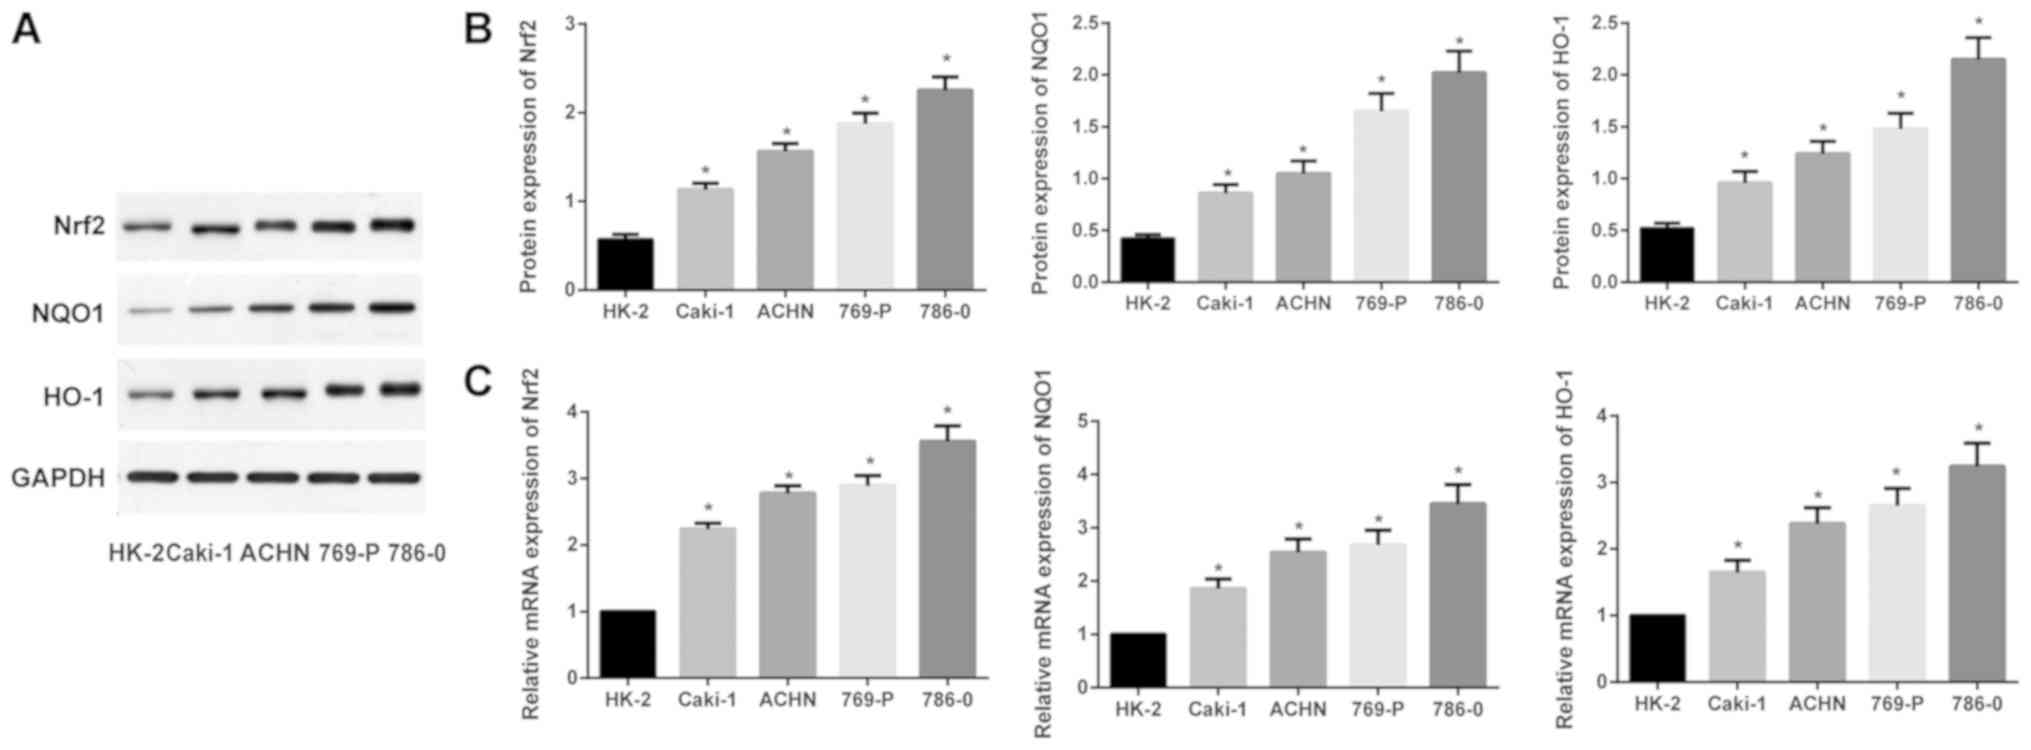
Expression levels of Nrf2, NQO1 and
HO-1 in different RCC cell lines
As presented in Fig.
2, when compared with the human kidney tubule epithelial cell
line HK-2, Nrf2, NQO1 and HO-1 were all significantly upregulated
at the mRNA and protein expression levels in ACHN, Caki-1, 769-P
and 786-0 cells (one-way ANOVA; all P<0.05). The 786-0 cells
exhibited the highest Nrf2, NQO1 and HO-1 mRNA and protein
expression levels, thus the 786-0 cells were selected for further
study.
Expression of mRNAs and proteins
associated with the Nrf2-ARE signaling pathway following
transfection with shRNA-Nrf2
Following transfection with shRNA-Nrf2, western
blotting and RT-qPCR were performed to detect the Nrf2-ARE
signaling-associated proteins Nrf2, NQO1, HO-1 and GST at the mRNA
and protein expression levels. Compared with the mock group, Nrf2,
NQO1, HO-1 and GST were significantly decreased at the mRNA and
protein expression levels in the shRNA-Nrf2 group (Tukey's HSD post
hoc test; all P<0.05). As presented in Fig. 3, Nrf2 was significantly downregulated
in the shRNA-Nrf2 group compared with the mock group (Tukey's HSD
post hoc test; P<0.05); however, no observable difference was
identified between the mock group and the NC group (Tukey's HSD
post hoc test; P>0.05). The mRNA and protein expression levels
of Nrf2, NQO1, HO-1 and GST were not significantly different
between the mock group and the NC group (Tukey's HSD post hoc test;
all P>0.05; Fig. 3).
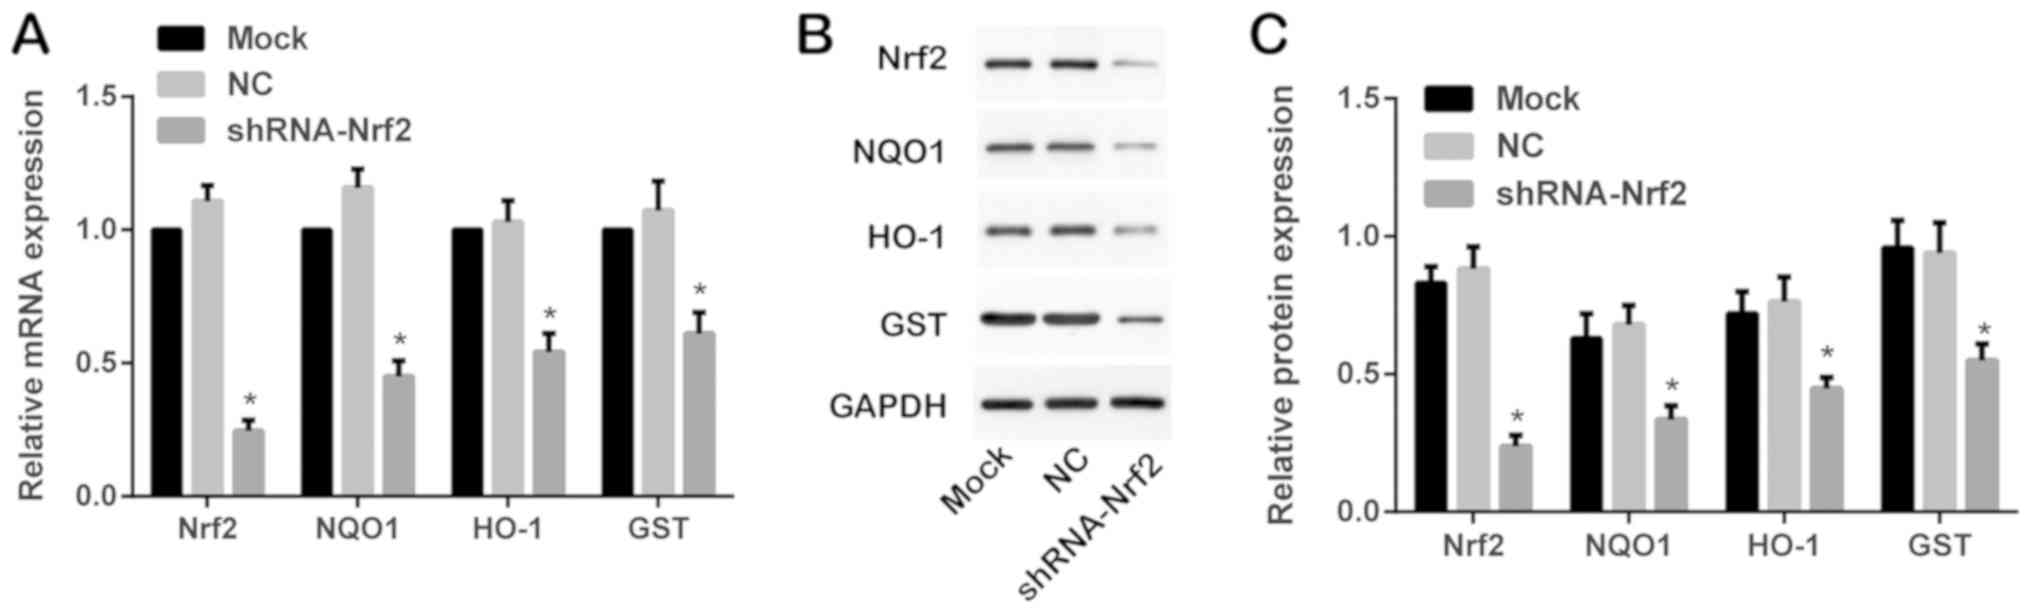 | Figure 3.Expression of Nrf2-ARE-associated
proteins and mRNAs in each group as detected by western blotting
and RT-qPCR. (A) Expression of Nrf2, NQO1, HO-1 and GST mRNAs in
each group as detected by RT-qPCR. (B) Expression of Nrf2, NQO1,
HO-1 and GST proteins in each group as detected by western
blotting. (C) Relative expression of Nrf2, NQO1, HO-1 and GST
proteins in each group as detected by western blotting and
subsequent densitometry analysis. *P<0.05 vs. respective mock
group. Nrf2, nuclear factor erythroid-2 related factor 2; ARE,
antioxidant-responsive element; NQO1, NAD(P)H dehydrogenase
[quinone] 1; HO-1, heme oxygenase-1; GST, glutathione
S-transferase; RT-qPCR, reverse transcription-quantitative
polymerase chain reaction. |
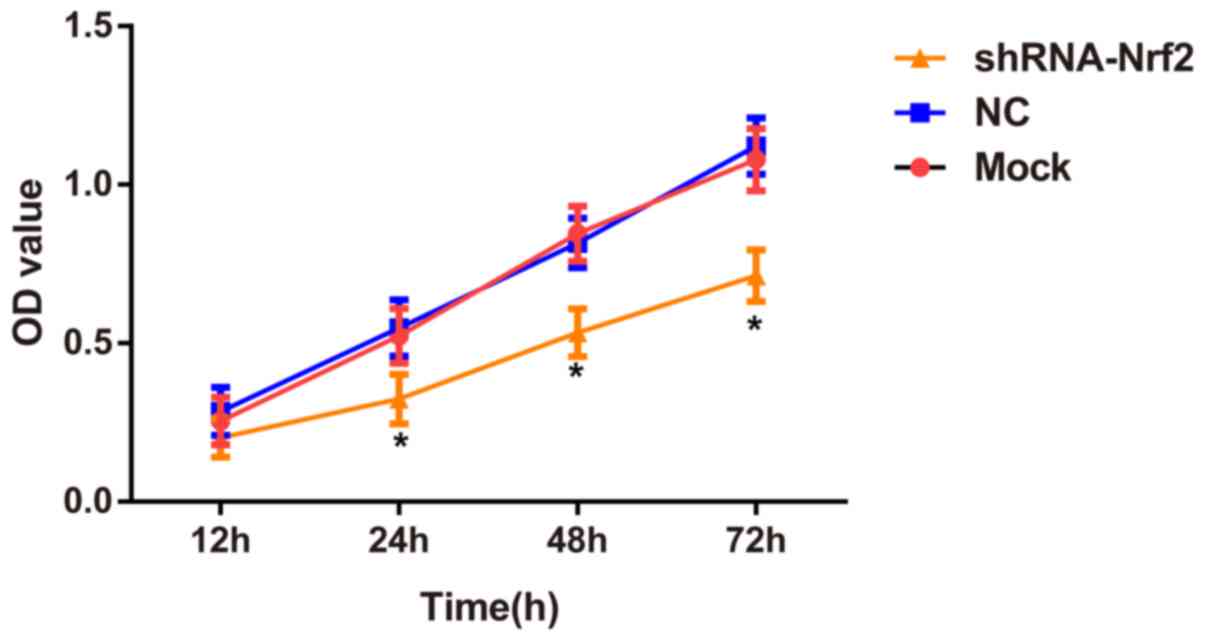
Effects of shRNA-Nrf2 transfection on
the viability of 786-0 cells
The CCK-8 assay demonstrated no significant
differences in cell viabilities (24, 48 and 72 h) between the mock
group and the NC group (Tukey's HSD post hoc test; all P>0.05).
However, the cell viabilities of 786-0 cells at 24, 48 and 72 h
were significantly decreased in the shRNA-Nrf2 group compared with
the mock group (Tukey's HSD post hoc test; all P<0.05 Fig. 4).
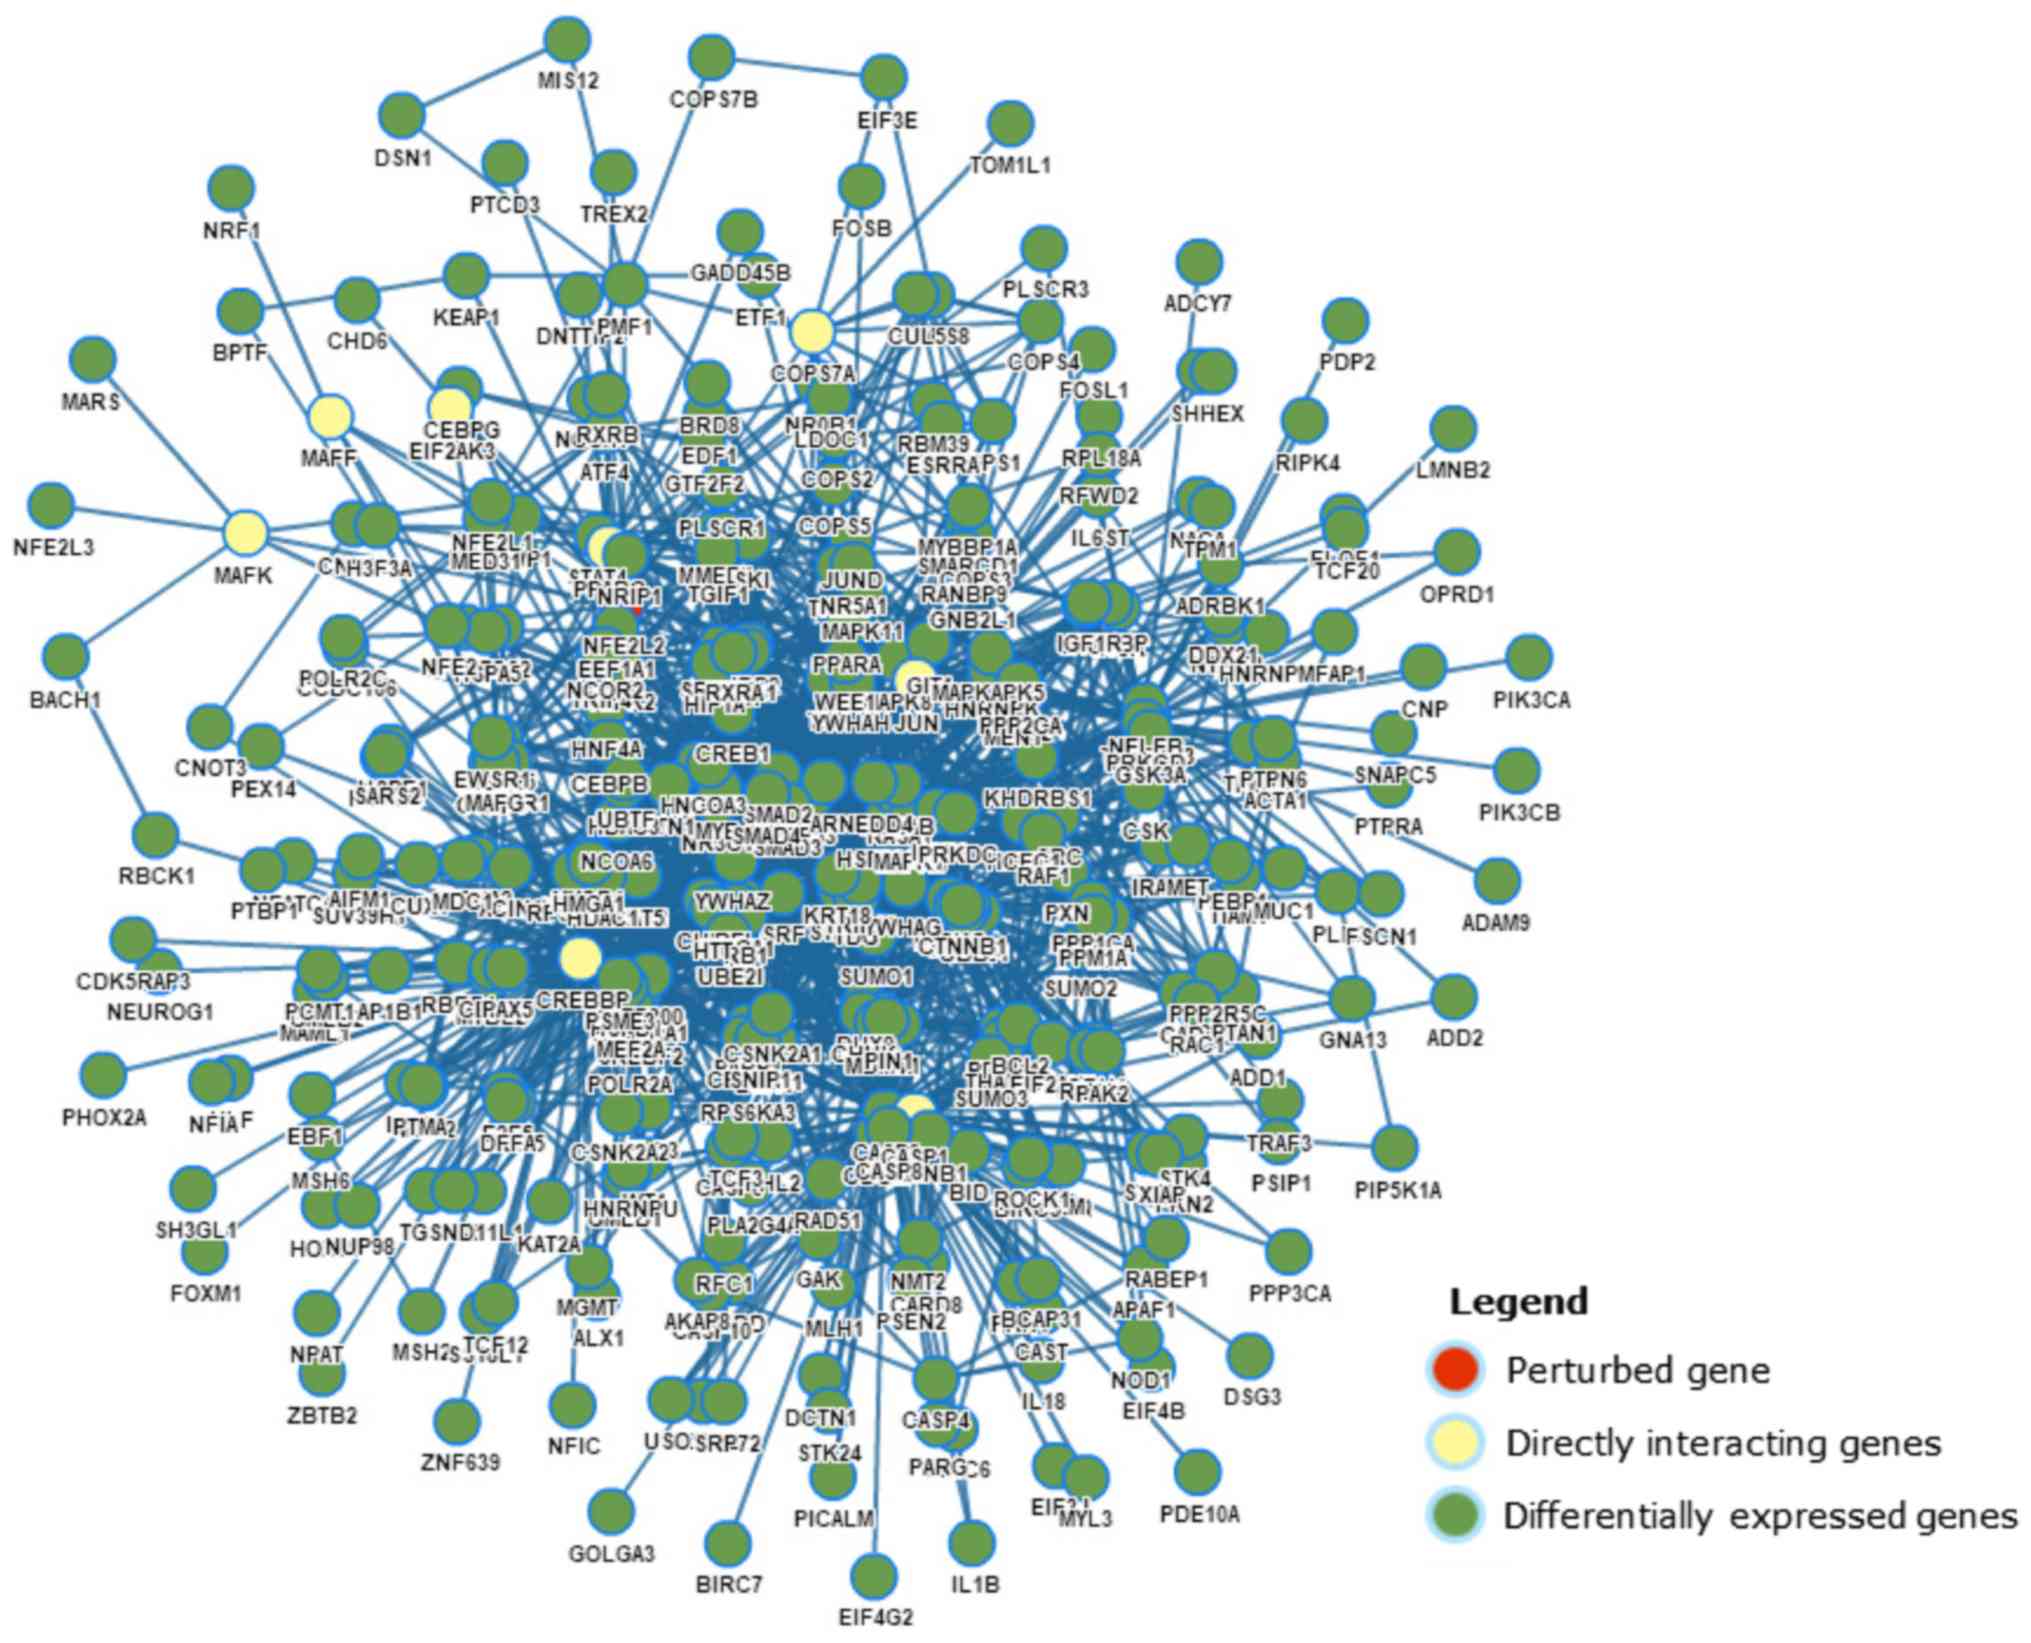
Transcriptome analysis results of Nrf2
knockdown
GPA software was used to evaluate the perturbation
of gene interaction subnetworks (Fig.
5). In the perturbation of Nrf2 in the human lung cancer cell
line A549 (GPA ID: GPAHSA000454), the downregulation of Nrf2
markedly decreased the expression of glutathione pathway genes,
antioxidant enzymes and multidrug resistance proteins.
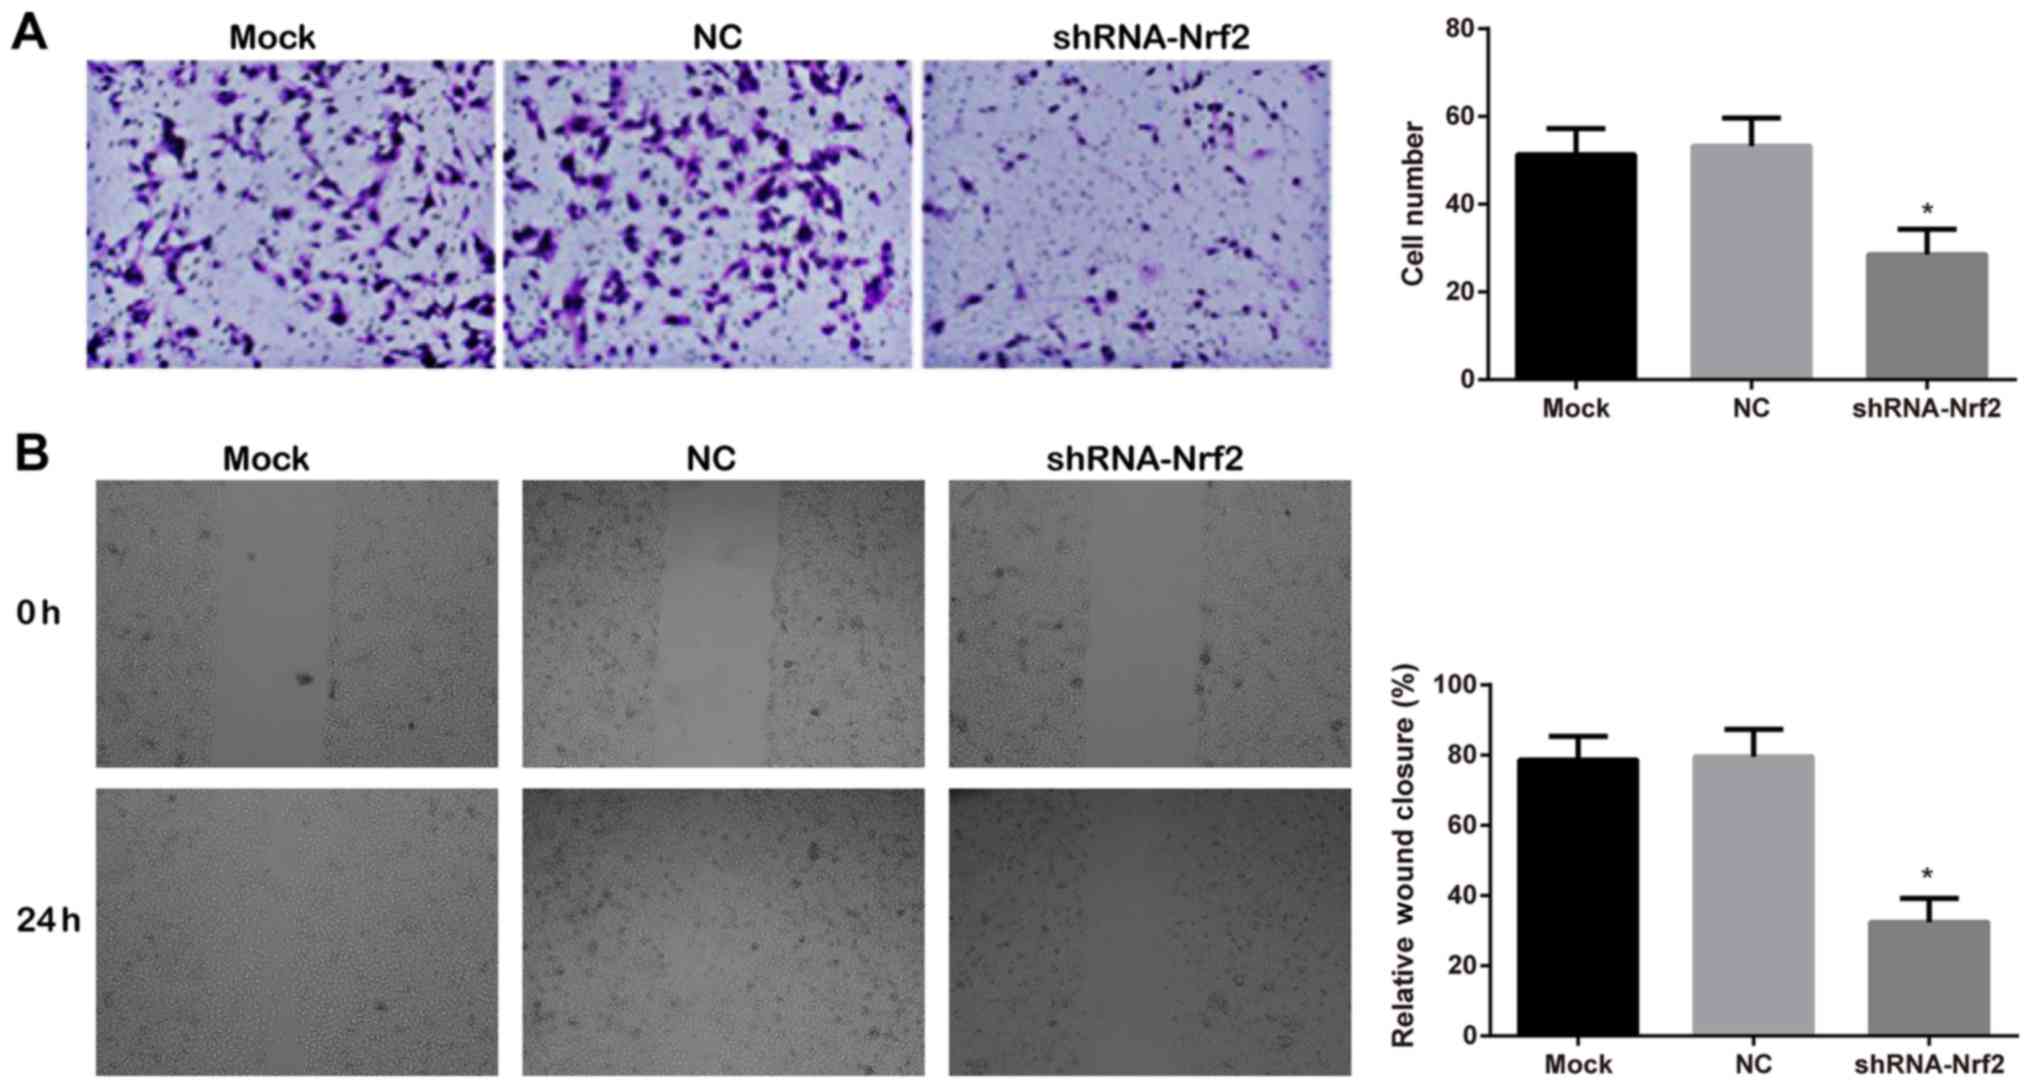
Effects of shRNA-Nrf2 transfection on
the invasive and migratory abilities of 786-0 cells
The invasive ability of 786-0 cells, assessed by a
Matrigel™ chamber invasion assay (Fig.
6A), demonstrated that a large number of cells migrated in the
mock group and NC group, whereas, significantly less cell migration
was observed in the shRNA-Nrf2 group (Tukey's HSD post hoc test;
both P<0.05). The mock group and NC group demonstrated no
significant difference (Tukey's HSD post hoc test; P>0.05). The
scratch wound healing at 0 and 24 h, detected by a scratch assay
(Fig. 6B), demonstrated that
compared with the mock group and the NC group, the relative wound
closure rate was significantly decreased in the shRNA-Nrf2 group
(Tukey's HSD post hoc test; all P<0.05). The differences between
the mock group and NC group were not statistically significant
(Tukey's HSD post hoc test; P>0.05).
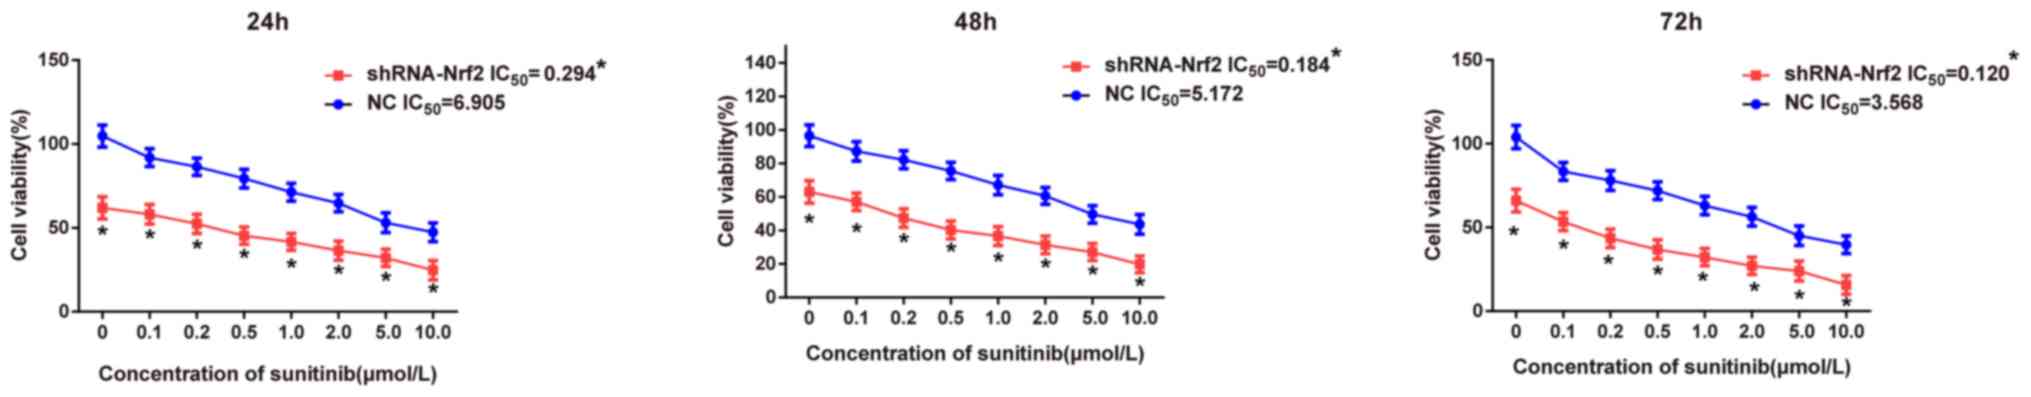
Comparison of sensitivities to
targeted drug sunitinib following transfection with shRNA-Nrf2
Following transfection with shRNA-Nrf2, a CCK-8
assay was performed to detect the effects of the targeted drug
sunitinib at different concentrations on the proliferation of 786-0
cells at different time points in each group. The CCK-8 assay
results (Fig. 7) demonstrated that
the cell viability significantly decreased in the shRNA-Nrf2 group
compared with the NC group under the same concentration of
sunitinib at 24 h (t-test; all P<0.05), and similar results were
additionally observed at 48 and 72 h (t-test; all P<0.05),
suggesting that sunitinib may inhibit cell growth in a dose
dependent manner. The stronger inhibitory effect of sunitinib in
the shRNA-Nrf2 group suggested that inhibition of Nrf2 expression
increased the sensitivity to the targeted drug sunitinib. The
IC50 of 786-0 cells at different time points was
calculated in each group using GraphPad Prism 6.0 software. The
IC50 values of sunitinib on 786-0 cells in the NC group
were all significantly increased compared with those in the
shRNA-Nrf2 group at 24, 48 and 72 h (t-test; all P<0.05). The
above results demonstrated that 786-0 cells in the shRNA-Nrf2 group
exhibited higher sensitivity to sunitinib.
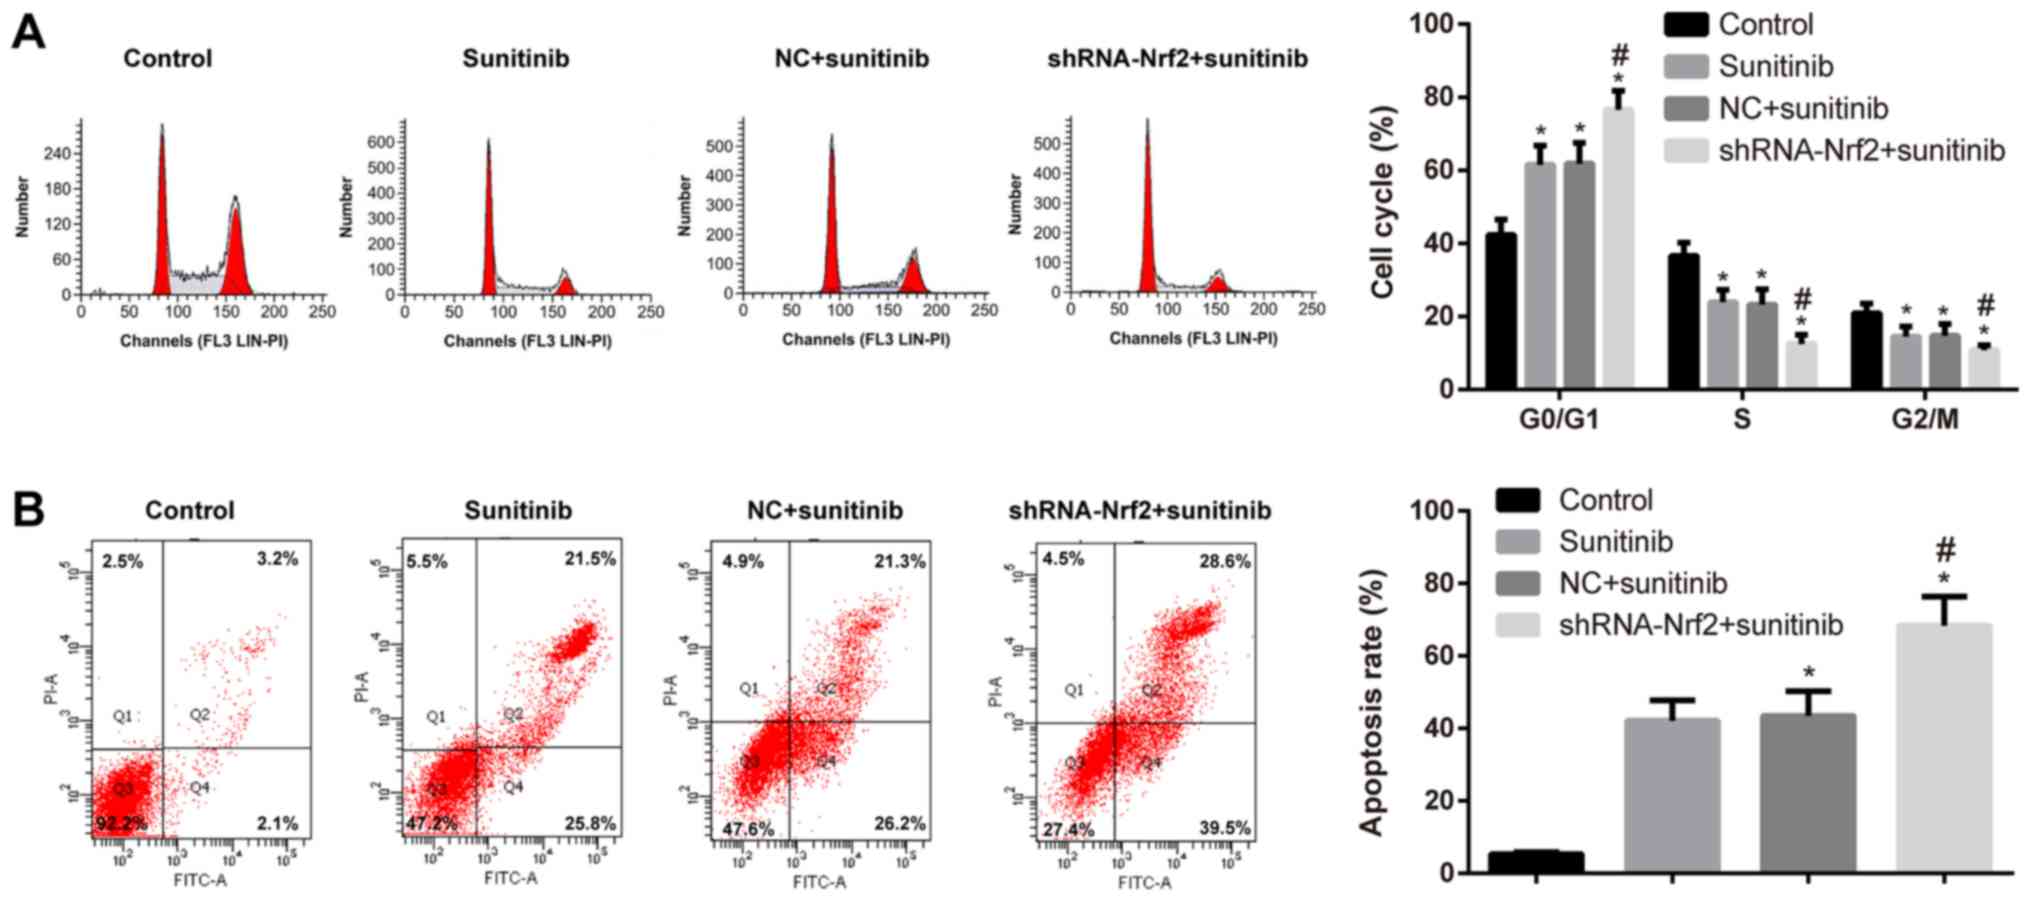
Effects of shRNA-Nrf2 transfection on
the cell cycle and apoptosis of 786-0 cells
The IC50 of 786-0 cells at 48 h was 5.172
µmol/l, which was an effective concentration for altering the cell
viability in the transfected cells in each group. Flow cytometry
demonstrated that the ratio of cells in the G0/G1 phase was
increased in the sunitinib group; however, the ratio of cells in
the S and G2/M phases was decreased compared with the control group
(Tukey's HSD post hoc test; all P<0.05). When compared with the
sunitinib group, the ratio of cells in the G0/G1 phase was
significantly increased, whereas, the ratio of cells in the S and
G2/M phases was significantly decreased in the shRNA-Nrf2 +
sunitinib group (Tukey's HSD post hoc test; all P<0.05). The
differences between the sunitinib group and the NC + sunitinib
group were not statistically significant (Tukey's HSD post hoc
test; P>0.05; Fig. 8A). Higher
rates of cell apoptosis were observed in the sunitinib group
compared with the control group (Tukey's HSD post hoc test;
P<0.05). Similarly, compared with the sunitinib group, the cell
apoptosis rate was significantly increased in the shRNA-Nrf2 +
sunitinib group (Tukey's HSD post hoc test; all P<0.05). No
significant difference in cell apoptosis was observed between the
sunitinib group and the NC + sunitinib group (Tukey's HSD post hoc
test; P>0.05; Fig. 8B).
Discussion
Nrf2 regulates and encodes antioxidant proteins
through interactions with the ARE, one of the most important
endogenous antioxidant stress pathways identified (28,29). The
ARE regulates downstream antioxidant enzymes, including NQO1, HO-1,
superoxide dismutase (SOD), various GST isozymes, and catalase
(30). In the present study, the
protein expression levels of Nrf2, NQO1 and HO-1 in RCC tissues
were not only markedly higher compared with adjacent non-cancerous
tissues, they were additionally associated with TNM stage, Fuhrman
classification and lymph node metastasis in RCC, which is in
agreement with the expression of Nrf2 signaling pathway components
in other carcinomas, suggesting that Nrf2 is highly expressed in
tumors (31,32). Multiple previous studies have
demonstrated the carcinogenic effects of Nrf2. For example, Yoo
et al (33) identified Nrf2
accumulation in gastric carcinoma tissues compared with normal
gastric tissues. Additionally, in colonic carcinoma tissues, Nrf2
and NQO1 were upregulated (33,34).
Specifically, the higher the Nrf2 expression was, the higher the
Duke stage or the worse the prognosis was (34,35).
Similarly, Nrf2 was positively expressed in human lung carcinoma,
which was associated with worse prognosis (36). Therefore, Nrf2 and downstream target
genes may possess vital roles in the occurrence, development and
metastasis of RCC.
In the present study, it was identified that
inhibition of Nrf2 expression not only suppressed the viability,
invasion and migration of 786-0 cells; however, additionally
downregulated NQO1, HO-1 and GST at the mRNA and protein expression
levels. Kim et al (37)
observed that the loss of E-cadherin may activate Nrf2,
consequently promoting tumor growth and metastasis. In
hepatocellular carcinoma, Nrf2 is able to upregulate the oncogene
apoptosis regulator Bcl-2, and interference with Nrf2 expression
leads to the apoptosis of cancer cells (38). In addition, the Nrf2-mediated
antioxidant effect is primarily achieved by increasing glutathione
biosynthesis and inducing phase II detoxifying enzymes, including
GST, NAD(P)H dehydrogenase, NQO1, SOD, HO-1 and γ-glutamylcysteine
ligase (39,40). As one of the most important
antioxidants in cells, glutathione functions via the reductive
thiol on its cysteine, which may be reduced following oxidation
(41). When cells are exposed to
carcinogenic substances or oxidative stress stimulation, a
carcinogen or an electrophile interacts with a cysteine of Keapl,
the negative regulator of Nrf2, which causes the disruption of the
Keap1 complex (42). This leads to
decreased or even absent Keap1-dependent ubiquitination of Nrf2,
release of Nrf2 from Keap1 inhibition, and the novel synthesized
Nrf2 translocates to the nucleus (42). Nuclear accumulation of Nrf2 and
binding to AREs in tumor cells results in increased glutathione
levels, leading to upregulation of associated detoxifying enzymes
and drug efflux pump genes, metabolic disorder of tumor cells and
faster proliferation (43,44), further suggesting that Nrf2 serves as
an oncogene to promote the migration and invasion of tumor cells,
possibly via an increase in the tumor resistance to oxidative
stress.
In the present study, it was additionally observed
that inhibition of Nrf2 expression significantly increased the
sensitivity of 786-0 cells to sunitinib at different
concentrations, and shRNA-Nrf2 arrested 786-0 cells at G0/G1 phase
to promote the apoptosis of RCC cells. Zhong et al (45) observed that silencing Nrf2 using
siRNA enhanced the sensitivity of MCF-7 breast cancer cells to
doxorubicin, paclitaxel and other chemotherapeutic agents. Kim
et al (46) identified that
in lung cancer cells, the Nrf2-HO-1 signal transduction pathway was
closely correlated with the resistance of cancer cells to
cisplatin, and inhibiting the expression or activity of HO-1
enhanced the sensitivity of A549 cells to cisplatin. Arlt et
al (47) demonstrated that
inhibition of Nrf2 activity in pancreatic cancer enhanced the
sensitivity of anticancer drugs by suppressing tumor cell
apoptosis. Therefore, inhibiting Nrf2 may be a novel and effective
strategy to improve the sensitivity of cells to anticancer drugs
(48). However, Nrf2 regulates
certain genes involved in the phosphatidyl-inositol 3-kinase
(PI3K)-protein kinase B (AKT) pathway (49,50), and
the PI3K-AKT pathway is able to regulate biological processes,
including cell proliferation, differentiation and apoptosis, in
addition to being involved in oncogenesis, cancer progression and
drug resistance in different cancer types (51–53).
Notably, the PI3K-AKT pathway serves a crucial role in sunitinib
resistance and is considered a potential drug target in renal
cancer and other cancer types (54,55),
suggesting that Nrf2 may contribute to sunitinib resistance by
activating the PI3K-AKT pathway.
Sunitinib, a small-molecular multi-target anticancer
drug, is able to block vascular endothelial growth factor,
platelet-derived growth factor receptor α and β, reticulocyte,
c-kit and other receptors, allowing it to serve as an
anti-tumorigenic and anti-angiogenic reagent (56,57).
Yang et al (58) observed
that sunitinib enhanced the apoptosis of medulloblastoma by
inhibiting the signal transducer and activator of transcription and
PI3K-AKT signaling pathways. Furthermore, particulate matter with
an aerodynamic diameter of <2.5 µm induced reactive oxygen
species (ROS) generation, triggered the translocation of Nrf2 to
the nucleus and increased HO-1 expression by mediating PI3K/AKT
phosphorylation in A549 cells (59).
At present, the primary mechanism of a number of anticancer drugs
to induce cell apoptosis is the generation of ROS, suggesting that
the Nrf2-ARE signaling pathway may regulate ROS production in tumor
cells or the PI3K-AKT signaling pathway to affect the sensitivity
of RCC cells to sunitinib (60), a
possibility which warrants further experimentation. One of the
limitations of the present study was the small sample, therefore
further experiments are required with a larger sample size.
In conclusion, the Nrf2-ARE signaling pathway was
activated in RCC, and inhibition of Nrf2-ARE signaling enhanced
tumor resistance to oxidative stress, which not only suppressed the
proliferation and metastasis of RCC cells; however, additionally
increased the sensitivity of RCC cells to the targeted drug
sunitinib. The present findings provide a theoretical basis from
which novel mechanisms of resistance to targeted drug and novel
molecular targets may be identified to enhance drug sensitivity in
patients with RCC.
Acknowledgements
Not applicable.
Funding
The present study was supported by funding from
Natural Science Foundation of Guangdong Province, China (grant no.
2015A030310460) and National Science Foundation of China (grant no.
81371387).
Availability of data and materials
The datasets used and/or analyzed during the current
study are available from the corresponding author on reasonable
request.
Authors' contributions
LY and YL were involved in the design of the study
and performed the majority of the analyses. SJ drafted the
manuscript. SJ, XZ and YX conceived and coordinated the study. All
authors read and approved the final manuscript.
Ethics approval and consent to
participate
The present study protocol was approved by the
Ethics Committee of The First Affiliated Hospital of Soochow
University, Suzhou, China (approval no. 2013031), and all research
subjects provided written informed consent. All procedures in the
present study strictly complied with the guidelines and principles
of the Declaration of Helsinki.
Patient consent for publication
The present study was granted an exemption by the
Ethics Committee of The First Affiliated Hospital of Soochow
University, as the patients cannot be traced.
Competing interests
The authors declare that they have no competing
interests.
References
|
1
|
Lipworth L, Tarone RE and McLaughlin JK:
The epidemiology of renal cell carcinoma. J Urol. 176:2353–2358.
2006. View Article : Google Scholar : PubMed/NCBI
|
|
2
|
Zheng B, Zhu H, Gu D, Pan X, Qian L, Xue
B, Yang D, Zhou J and Shan Y: MiRNA-30a-mediated autophagy
inhibition sensitizes renal cell carcinoma cells to sorafenib.
Biochem Biophys Res Commun. 459:234–239. 2015. View Article : Google Scholar : PubMed/NCBI
|
|
3
|
Gupta K, Miller JD, Li JZ, Russell MW and
Charbonneau C: Epidemiologic and socioeconomic burden of metastatic
renal cell carcinoma (mRCC): A literature review. Cancer Treat Rev.
34:193–205. 2008. View Article : Google Scholar : PubMed/NCBI
|
|
4
|
Breau RH and Blute ML: Surgery for renal
cell carcinoma metastases. Curr Opin Urol. 20:375–381. 2010.
View Article : Google Scholar : PubMed/NCBI
|
|
5
|
Bukowski RM: Systemic therapy for
metastatic renal cell carcinoma in treatment naive patients: A
risk-based approach. Expert Opin Pharmacother. 11:2351–2362. 2010.
View Article : Google Scholar : PubMed/NCBI
|
|
6
|
Motzer RJ, Jonasch E, Agarwal N, Beard C,
Bhayani S, Bolger GB, Chang SS, Choueiri TK, Costello BA, Derweesh
IH, et al: Kidney cancer, version 3.2015. J Natl Compr Canc Netw.
13:151–159. 2015. View Article : Google Scholar : PubMed/NCBI
|
|
7
|
Achermann C, Stenner F and Rothschild SI:
Treatment, outcome and prognostic factors in renal cell carcinoma-A
single center study (2000–2010). J Cancer. 7:921–927. 2016.
View Article : Google Scholar : PubMed/NCBI
|
|
8
|
Sonpavde G, Choueiri TK, Escudier B,
Ficarra V, Hutson TE, Mulders PF, Patard JJ, Rini BI, Staehler M,
Sternberg CN and Stief CG: Sequencing of agents for metastatic
renal cell carcinoma: Can we customize therapy? Eur Urol.
61:307–316. 2012. View Article : Google Scholar : PubMed/NCBI
|
|
9
|
M Eel D: Utilization of sunitinib for
renal cell cancer: An egyptian university hospital experience.
Asian Pac J Cancer Prev. 17:3161–3166. 2016.PubMed/NCBI
|
|
10
|
Zheng WX, Yan F, Xue Q, Wu GJ, Qin WJ,
Wang FL, Qin J, Tian CJ and Yuan JL: Heme oxygenase-1 is a
predictive biomarker for therapeutic targeting of advanced clear
cell renal cell carcinoma treated with sorafenib or sunitinib. Onco
Targets Ther. 8:2081–2088. 2015.PubMed/NCBI
|
|
11
|
Rini BI and Atkins MB: Resistance to
targeted therapy in renal-cell carcinoma. Lancet Oncol.
10:992–1000. 2009. View Article : Google Scholar : PubMed/NCBI
|
|
12
|
Buczek M, Escudier B, Bartnik E, Szczylik
C and Czarnecka A: Resistance to tyrosine kinase inhibitors in
clear cell renal cell carcinoma: From the patient's bed to
molecular mechanisms. Biochim Biophys Acta. 1845:31–41.
2014.PubMed/NCBI
|
|
13
|
Jaramillo MC and Zhang DD: The emerging
role of the Nrf2-Keap1 signaling pathway in cancer. Genes Dev.
27:2179–2191. 2013. View Article : Google Scholar : PubMed/NCBI
|
|
14
|
Magesh S, Chen Y and Hu L: Small molecule
modulators of Keap1-Nrf2-ARE pathway as potential preventive and
therapeutic agents. Med Res Rev. 32:687–726. 2012. View Article : Google Scholar : PubMed/NCBI
|
|
15
|
Calkins MJ, Johnson DA, Townsend JA,
Vargas MR, Dowell JA, Williamson TP, Kraft AD, Lee JM, Li J and
Johnson J: The Nrf2/ARE pathway as a potential therapeutic target
in neurodegenerative disease. Antioxid Redox Signal. 11:497–508.
2009. View Article : Google Scholar : PubMed/NCBI
|
|
16
|
Ji L, Li H, Gao P, Shang G, Zhang DD,
Zhang N and Jiang T: Nrf2 pathway regulates
multidrug-resistance-associated protein 1 in small cell lung
cancer. PLoS One. 8:e634042013. View Article : Google Scholar : PubMed/NCBI
|
|
17
|
Kim TH, Hur EG, Kang SJ, Kim JA, Thapa D,
Lee YM, Ku SK, Jung Y and Kwak M: NRF2 blockade suppresses colon
tumor angiogenesis by inhibiting hypoxia-induced activation of
HIF-1α. Cancer Res. 71:2260–2275. 2011. View Article : Google Scholar : PubMed/NCBI
|
|
18
|
Samatiwat P, Prawan A, Senggunprai L and
Kukongviriyapan V: Repression of Nrf2 enhances antitumor effect of
5-fluorouracil and gemcitabine on cholangiocarcinoma cells. Naunyn
Schmiedebergs Arch Pharmacol. 388:601–612. 2015. View Article : Google Scholar : PubMed/NCBI
|
|
19
|
Akhdar H, Loyer P, Rauch C, Corlu A,
Guillouzo A and Morel F: Involvement of Nrf2 activation in
resistance to 5-fluorouracil in human colon cancer HT-29 cells. Eur
J Cancer. 45:2219–2227. 2009. View Article : Google Scholar : PubMed/NCBI
|
|
20
|
Muglia VF and Prando A: Renal cell
carcinoma: Histological classification and correlation with imaging
findings. Radiol Bras. 48:166–174. 2015. View Article : Google Scholar : PubMed/NCBI
|
|
21
|
Moch H, Artibani W, Delahunt B, Ficarra V,
Knuechel R, Montorsi F, Patard JJ, Stief CG, Sulser T and Wild PJ:
Reassessing the current UICC/AJCC TNM staging for renal cell
carcinoma. Eur Urol. 56:636–643. 2009. View Article : Google Scholar : PubMed/NCBI
|
|
22
|
Tan EY, Campo L, Han C, Turley H, Pezzella
F, Gatter KC, Harris AL and Fox SB: BNIP3 as a progression marker
in primary human breast cancer; opposing functions in in situ
versus invasive cancer. Clin Cancer Res. 13:467–474. 2007.
View Article : Google Scholar : PubMed/NCBI
|
|
23
|
Ooi A, Dykema K, Ansari A, Petillo D,
Snider J, Kahnoski R, Anema J, Craig D, Carpten J, Teh BT and Furge
KA: CUL3 and NRF2 mutations confer an NRF2 activation phenotype in
a sporadic form of papillary renal cell carcinoma. Cancer Res.
73:2044–2051. 2013. View Article : Google Scholar : PubMed/NCBI
|
|
24
|
Livak KJ and Schmittgen TD: Analysis of
relative gene expression data using real-time quantitative PCR and
the 2(−Delta Delta C(T)) method. Methods. 25:402–408. 2001.
View Article : Google Scholar : PubMed/NCBI
|
|
25
|
Gu S, Lai Y, Chen H, Liu Y and Zhang Z:
miR-155 mediates arsenic trioxide resistance by activating Nrf2 and
suppressing apoptosis in lung cancer cells. Sci Rep. 7:121552017.
View Article : Google Scholar : PubMed/NCBI
|
|
26
|
Lu MC, Ji JA, Jiang ZY and You QD: The
Keap1-Nrf2-ARE pathway as a potential preventive and therapeutic
target: An update. Med Res Rev. 36:924–963. 2016. View Article : Google Scholar : PubMed/NCBI
|
|
27
|
Liu D, Duan X, Dong D, Bai C, Li X, Sun G
and Li B: Activation of the Nrf2 pathway by inorganic arsenic in
human hepatocytes and the role of transcriptional repressor Bach1.
Oxid Med Cell Longev. 2013:9845462013. View Article : Google Scholar : PubMed/NCBI
|
|
28
|
Deng C, Tao R, Yu SZ and Jin H: Inhibition
of 6-hydroxydopamine-induced endoplasmic reticulum stress by
sulforaphane through the activation of Nrf2 nuclear translocation.
Mol Med Rep. 6:215–219. 2012.PubMed/NCBI
|
|
29
|
Ildefonso CJ, Jaime H, Brown EE, Iwata RL,
Ahmed CM, Massengill MT, Biswal MR, Boye SE, Hauswirth WW, Ash JD,
et al: Targeting the Nrf2 signaling pathway in the retina with a
gene-delivered secretable and cell-penetrating peptide. Invest
Ophthalmol Vis Sci. 57:372–386. 2016. View Article : Google Scholar : PubMed/NCBI
|
|
30
|
Wan Hasan WN, Kwak MK, Makpol S, Wan Ngah
WZ and Mohd Yusof YA: Piper betle induces phase I & II genes
through Nrf2/ARE signaling pathway in mouse embryonic fibroblasts
derived from wild type and Nrf2 knockout cells. BMC Complement
Altern Med. 14:722014. View Article : Google Scholar : PubMed/NCBI
|
|
31
|
Hayes JD and McMahon M: NRF2 and KEAP1
mutations: Permanent activation of an adaptive response in cancer.
Trends Biochem Sci. 34:176–188. 2009. View Article : Google Scholar : PubMed/NCBI
|
|
32
|
Geismann C, Arlt A, Sebens S and Schäfer
H: Cytoprotection ‘gone astray’: Nrf2 and its role in cancer. Onco
Targets Ther. 7:1497–1518. 2014.PubMed/NCBI
|
|
33
|
Yoo NJ, Kim YR and Lee SH: Expression of
NRF2, a cytoprotective protein, in gastric carcinomas. APMIS.
118:613–614. 2010.PubMed/NCBI
|
|
34
|
Ji L, Wei Y, Jiang T and Wang S:
Correlation of Nrf2, NQO1, MRP1, cmyc and p53 in colorectal cancer
and their relationships to clinicopathologic features and survival.
Int J Clin Exp Pathol. 7:1124–1131. 2014.PubMed/NCBI
|
|
35
|
Wang J, Zhang M, Zhang L, Cai H, Zhou S,
Zhang J and Wang Y: Correlation of Nrf2, HO-1, and MRP3 in
gallbladder cancer and their relationships to clinicopathologic
features and survival. J Surg Res. 164:e99–e105. 2010. View Article : Google Scholar : PubMed/NCBI
|
|
36
|
Solis LM, Behrens C, Dong W, Suraokar M,
Ozburn NC, Moran CA, Corvalan AH, Biswal S, Swisher SG, Bekele BN,
et al: Nrf2 and Keap1 abnormalities in non-small cell lung
carcinoma and association with clinicopathologic features. Clin
Cancer Res. 16:3743–3753. 2010. View Article : Google Scholar : PubMed/NCBI
|
|
37
|
Kim WD, Kim YW, Cho IJ, Lee CH and Kim SG:
E-cadherin inhibits nuclear accumulation of Nrf2: Implications for
chemoresistance of cancer cells. J Cell Sci. 125:1284–1295. 2012.
View Article : Google Scholar : PubMed/NCBI
|
|
38
|
Niture SK and Jaiswal AK: Nrf2 protein
up-regulates antiapoptotic protein Bcl-2 and prevents cellular
apoptosis. J Biol Chem. 287:9873–9886. 2012. View Article : Google Scholar : PubMed/NCBI
|
|
39
|
Rotblat B, Melino G and Knight RA: NRF2
and p53: Januses in cancer? Oncotarget. 3:1272–1283. 2012.
View Article : Google Scholar : PubMed/NCBI
|
|
40
|
Zhang M, An C, Gao Y, Leak RK, Chen J and
Zhang F: Emerging roles of Nrf2 and phase II antioxidant enzymes in
neuroprotection. Prog Neurobiol. 100:30–47. 2013. View Article : Google Scholar : PubMed/NCBI
|
|
41
|
Aborode FA, Raab A, Voigt M, Costa LM,
Krupp EM and Feldmann J: The importance of glutathione and
phytochelatins on the selenite and arsenate detoxification in
Arabidopsis thaliana. J Environ Sci (China). 49:150–161. 2016.
View Article : Google Scholar : PubMed/NCBI
|
|
42
|
Niture SK, Kaspar JW, Shen J and Jaiswal
AK: Nrf2 signaling and cell survival. Toxicol Appl Pharmacol.
244:37–42. 2010. View Article : Google Scholar : PubMed/NCBI
|
|
43
|
DeNicola GM, Karreth FA, Humpton TJ,
Gopinathan A, Wei C, Frese K, Mangal D, Yu KH, Yeo CJ, Calhoun ES,
et al: Oncogene-induced Nrf2 transcription promotes ROS
detoxification and tumorigenesis. Nature. 475:106–109. 2011.
View Article : Google Scholar : PubMed/NCBI
|
|
44
|
Mitsuishi Y, Taguchi K, Kawatani Y,
Gopinathan A, Wei C, Frese K, Mangal D, Yu KH, Yeo CJ and Calhoun
ES: Nrf2 redirects glucose and glutamine into anabolic pathways in
metabolic reprogramming. Cancer Cell. 22:66–79. 2012. View Article : Google Scholar : PubMed/NCBI
|
|
45
|
Zhong Y, Zhang F, Sun Z, Zhou W, Li ZY,
You QD, Guo QL and Hu R: Drug resistance associates with activation
of Nrf2 in MCF-7/DOX cells, and wogonin reverses it by
down-regulating Nrf2-mediated cellular defense response. Mol
Carcinog. 52:824–834. 2013.PubMed/NCBI
|
|
46
|
Kim HR, Kim S, Kim EJ, Park JH, Yang SH,
Jeong ET, Park C, Youn MJ, So HS and Park R: Suppression of
Nrf2-driven heme oxygenase-1 enhances the chemosensitivity of lung
cancer A549 cells toward cisplatin. Lung Cancer. 60:47–56. 2008.
View Article : Google Scholar : PubMed/NCBI
|
|
47
|
Arlt A, Sebens S, Krebs S, Geismann C,
Grossmann M, Kruse ML, Schreiber S and Schäfer H: Inhibition of the
Nrf2 transcription factor by the alkaloid trigonelline renders
pancreatic cancer cells more susceptible to apoptosis through
decreased proteasomal gene expression and proteasome activity.
Oncogene. 32:4825–4835. 2013. View Article : Google Scholar : PubMed/NCBI
|
|
48
|
Li QK, Singh A, Biswal S, Askin F and
Gabrielson E: KEAP1 gene mutations and NRF2 activation are common
in pulmonary papillary adenocarcinoma. J Hum Genet. 56:230–234.
2011. View Article : Google Scholar : PubMed/NCBI
|
|
49
|
Lim JH, Kim KM, Kim SW, Hwang O and Choi
HJ: Bromocriptine activates NQO1 via Nrf2-PI3K/Akt signaling: Novel
cytoprotective mechanism against oxidative damage. Pharmacol Res.
57:325–331. 2008. View Article : Google Scholar : PubMed/NCBI
|
|
50
|
Zhang Y, Guan L, Wang X, Wen T, Xing J and
Zhao J: Protection of chlorophyllin against oxidative damage by
inducing HO-1 and NQO1 expression mediated by PI3K/Akt and Nrf2.
Free Radic Res. 42:362–371. 2008. View Article : Google Scholar : PubMed/NCBI
|
|
51
|
Mayer IA and Arteaga CL: The PI3K/AKT
pathway as a target for cancer treatment. Annu Rev Med. 67:11–28.
2016. View Article : Google Scholar : PubMed/NCBI
|
|
52
|
Chang F, Lee JT, Navolanic PM, Steelman
LS, Shelton JG, Blalock WL, Franklin RA and McCubrey JA:
Involvement of PI3K/Akt pathway in cell cycle progression,
apoptosis, and neoplastic transformation: A target for cancer
chemotherapy. Leukemia. 17:590–603. 2003. View Article : Google Scholar : PubMed/NCBI
|
|
53
|
West KA, Castillo SS and Dennis PA:
Activation of the PI3K/Akt pathway and chemotherapeutic resistance.
Drug Resist Updat. 5:234–248. 2002. View Article : Google Scholar : PubMed/NCBI
|
|
54
|
Makhov PB, Golovine K, Kutikov A, Teper E,
Canter DJ, Simhan J, Uzzo RG and Kolenko VM: Modulation of Akt/mTOR
signaling overcomes sunitinib resistance in renal and prostate
cancer cells. Mol Cancer Ther. 11:1510–1517. 2012. View Article : Google Scholar : PubMed/NCBI
|
|
55
|
Chen YL, Ge GJ, Qi C, Wang H, Wang HL, Li
LY, Li GH and Xia LQ: A five-gene signature may predict sunitinib
sensitivity and serve as prognostic biomarkers for renal cell
carcinoma. J Cell Physiol. 233:6649–6660. 2018. View Article : Google Scholar : PubMed/NCBI
|
|
56
|
Imbulgoda A, Heng DY and Kollmannsberger
C: Sunitinib in the treatment of advanced solid tumors. Recent
Results Cancer Res. 201:165–184. 2014. View Article : Google Scholar : PubMed/NCBI
|
|
57
|
Grassi P, Verzoni E, Porcu L, Iacovelli R,
de Braud F and Procopio G: Sites of disease as predictors of
outcome in metastatic renal cell carcinoma patients treated with
first-line sunitinib or sorafenib. Ther Adv Urol. 7:59–68. 2015.
View Article : Google Scholar : PubMed/NCBI
|
|
58
|
Yang F, Jove V, Xin H, Hedvat M, Van Meter
TE and Yu H: Sunitinib induces apoptosis and growth arrest of
medulloblastoma tumor cells by inhibiting STAT3 and AKT signaling
pathways. Mol Cancer Res. 8:35–45. 2010. View Article : Google Scholar : PubMed/NCBI
|
|
59
|
Deng X, Rui W, Zhang F and Ding W: PM2.5
induces Nrf2-mediated defense mechanisms against oxidative stress
by activating PIK3/AKT signaling pathway in human lung alveolar
epithelial A549 cells. Cell Biol Toxicol. 29:143–157. 2013.
View Article : Google Scholar : PubMed/NCBI
|
|
60
|
Singh A, Boldin-Adamsky S, Thimmulappa RK,
Rath SK, Ashush H, Coulter J, Blackford A, Goodman SN, Bunz F,
Watson WH, et al: RNAi-mediated silencing of nuclear factor
erythroid-2-related factor 2 gene expression in non-small cell lung
cancer inhibits tumor growth and increases efficacy of
chemotherapy. Cancer Res. 68:7975–7984. 2008. View Article : Google Scholar : PubMed/NCBI
|