Introduction
Hepatocellular carcinoma (HCC) accounts for 70–90%
of primary liver cancer, as estimated in 2012 (1), with >500,000 patients worldwide
being diagnosed with hepatocellular carcinoma, as estimated in 2011
(2). Liver cancer has been predicted
to be the sixth most commonly diagnosed type of cancer and the
fourth leading cause of cancer-associated mortality worldwide in
2018, with ~841,000 new cases and 782,000 cases of
cancer-associated mortality annually (3). Apart from surgery, multiple treatment
options are available for HCC treatment, including resection,
ablation, transplantation, chemoembolization and systemic targeted
agents, such as sorafenib (4).
However, resistance to chemotherapeutic drugs, cancer recurrence
and early metastasis remain major obstacles in clinical treatment
(5). Therefore, improved
understanding of the molecular mechanisms in HCC is required.
Ornithine transcarbamylase (OTC) is a liver and
intestinal mucosa-located, intramitochondrial, rate-limiting enzyme
in the urea cycle. It catalyzes the reaction that converts
ornithine and carbamoyl phosphate into citrulline, which is the
second step of the urea cycle, to detoxify the ammonia produced
from amino acid catabolism (6).
Defects in the urea cycle can lead to high blood ammonia
concentration, which can cause several physiological disorders,
including anorexia, cerebral edema, coma, seizure, delayed growth
and development, intellectual disabilities and even loss of life
(7,8). Several studies have suggested that
accumulated ammonia resulting from OTC deficiency causes chronic
liver damage, which is a potential risk factor of HCC (9–11).
Furthermore, increased liver fibrosis in OTC-knockout Het mice
compared with their wild-type littermates has been confirmed
(12). However, studies on the
effect of OTC in HCC are limited.
The present study aimed to identify whether OTC
serves a role in HCC progression, and to investigate its biological
function. The present study revealed that OTC downregulation is a
characteristic molecular alteration and a reliable prognostic
factor for the survival of patients with HCC. Notably, the present
study demonstrated anti-growth effects of OTC in HCC cells for the
first time. The present study suggested that OTC may be
investigated as a novel HCC therapeutic.
Materials and methods
Plasmids and antibodies
Small interfering RNAs (siRNAs) targeting OTC
(siOTC-1 and siOTC-2) and negative control (siCont) were purchased
from Guangzhou RiboBio Co., Ltd. (Guangzhou, China). The
pCMV6-XL4-OTC expression plasmid and the empty vector pCMV6-XL4
were obtained from OriGene Technologies, Inc. (Rockville, MD, USA).
The antibody for OTC was purchased from Sigma-Aldrich (Merck KGaA,
Darmstadt, Germany; cat. no. #AV41766) and the antibody for GAPDH
was from Santa Cruz Biotechnology, Inc. (Dallas, TX, USA; cat. no.
sc-365062).
Cell culture
Human liver cancer cell lines SK-Hep-1, HepG2,
PLC/PRF/5 and Huh-7 were obtained from the American Type Culture
Collection (Manassas, VA, USA). The immortalized hepatocyte MIHA
cell line was obtained from Professor Ben C. B. Ko (The Hong Kong
Polytechnic University, Hong Kong, SAR, China). Primary human
hepatocytes (PHHs) were purchased from ScienCell Research
Laboratories, Inc. (San Diego, CA, USA). The liver cancer and MIHA
cells were cultured in Dulbecco's modified Eagle's medium
supplemented with 10% fetal bovine serum (Gibco; Thermo Fisher
Scientific, Inc., Waltham, MA, USA). The PHHs were cultured in
hepatocyte medium (ScienCell Research Laboratories, Inc.). All
cells were maintained in a humidified atmosphere at 37°C in 5%
CO2.
Cell transfection
All siRNAs and plasmids were transfected into cells
using Lipofectamine® 3000 (Invitrogen; Thermo Fisher
Scientific, Inc.), according to the manufacturer's protocol.
Specifically, cells were seeded into 6-well-plates the day before
transfection and were grown to 70–90% confluency prior to
transfection. For OTC knockdown analysis, 0.1 nmol siOTC-1 or
siOTC-2, or siCont (final concentration, 50 µM) and Opti-MEM
(Gibco; Thermo Fisher Scientific, Inc.) were mixed and incubated
for 10 min, and subsequently added to SK-Hep-1 and Huh-7 cells. For
OTC overexpression analysis, 2 µg plasmids (pCMV6-XL4-OTC or
pCMV6-XL4), Opti-MEM (Gibco; Thermo Fisher Scientific, Inc.) and
Lipofectamine® 3000 were mixed and incubated for 10 min,
and then added to SK-Hep-1 and Huh-7 cells. After 6 h of
incubation, the supernatant was replaced with fresh medium. The
transfection efficiency was monitored by western blot analysis
after 3 days of transfection. The bromodeoxyuridine assays were
conducted 3 days after transfection. For the colony formation
assay, colonies were stained 12 days after transfection. For the
proliferation assay, cell numbers were counted daily between the
second and fifth day after transfection.
Tissue specimens
A total of 42 pairs of primary HCC and matched
adjacent histologically normal liver tissue samples were collected
from newly-diagnosed patients with HCC at the First Affiliated
Hospital of Chongqing Medical University (Chongqing, China) between
December 2016 and December 2017. Of these patients, 36 (85.7%) were
male and six (14.4%) were female. Patient ages ranged between 22
and 77 years (56.88±13.404 years). A total of 10 parameters that
may be prognostic in HCC were assessed by statistical analyses and
summarized in Table I. The following
inclusion criteria were used: i) Patient had received no
radiotherapy or chemotherapy prior to surgery; and ii) patient
exhibited pathologically defined primary tumors according to the
International Union Against Cancer guidelines (13). Histological grading was performed
according to the Edmondson-Steiner criteria (14). Following surgical resection, tumor
diameter was measured and the samples were immediately snap frozen
in liquid nitrogen and stored at −80°C. Relevant clinical data were
collected retrospectively. Additionally, paraffin-embedded sections
of 15 paired samples from patients with HCC, which were not
included in the aforementioned group of patients, were obtained for
immunohistochemical analysis from the Pathology Department of First
Affiliated Hospital, Chongqing Medical University. Of the 15
patients, 10 (66.7%) were male and 5 (33.3%) were female. Patient
ages ranged between 39 and 73 years (mean ± standard deviation,
62.67±9.401 years). Written informed consent was obtained from each
patient recruited to the study, which was approved by the Clinical
Research Ethics Committee of Chongqing Medical University.
 | Table I.Patient clinicopathological features
and tumor OTC expression. |
Table I.
Patient clinicopathological features
and tumor OTC expression.
|
|
| OTC
expressiona |
|
|---|
| Characteristic | n | Low | High | P-value |
|---|
| Sex |
|
|
| 1.00 |
|
Female | 6 | 4 | 2 |
|
| Male | 36 | 26 | 10 |
|
| Age, years (mean ±
SD) |
| 55.5±14.6 | 60.4±11.3 | 0.29 |
| ALT, IU/l |
|
|
| 0.33 |
|
≤40 | 23 | 15 | 8 |
|
|
>40 | 19 | 15 | 4 |
|
| CEA, ng/ml |
|
|
| 0.39 |
| ≤5 | 35 | 26 | 9 |
|
|
>5 | 7 | 4 | 3 |
|
| AFP, ng/ml |
|
|
| 0.14 |
|
≤20 | 24 | 15 | 9 |
|
|
>20 | 18 | 15 | 3 |
|
| Tumor diameter,
cm |
|
|
| 0.01b |
| ≤3 | 7 | 2 | 5 |
|
|
>3 | 35 | 28 | 7 |
|
| Multiple
tumors |
|
|
| 0.39 |
| No | 35 | 26 | 9 |
|
|
Yes | 7 | 4 | 3 |
|
| Tumor grade |
|
|
| 0.02b |
| 1 | 8 | 3 | 5 |
|
| 2 | 27 | 20 | 7 |
|
| 3 | 7 | 7 | 0 |
|
| Vascular
invasion |
|
|
| 0.32 |
| No | 26 | 17 | 9 |
|
|
Yes | 16 | 13 | 3 |
|
| Cirrhosis |
|
|
| 0.72 |
| No | 12 | 8 | 4 |
|
|
Yes | 30 | 22 | 8 |
|
Datasets
Gene expression profiles were downloaded using R
version 3.2.4 software (R Foundation for Statistical Computing,
Vienna, Austria) from the Gene Expression Omnibus database (dataset
accession no. GSE14520) (15).
RNA-sequencing and detailed clinicopathological data for patients
with HCC were obtained from The Cancer Genome Atlas (TCGA; project
ID: TCGA-LIHC; http://portal.gdc.cancer.gov/projects/TCGA-LIHC).
The data from TCGA were log10 transformed and analyzed
using SPSS version 19.0 software (IBM Corporation, Chicago, IL,
USA).
Reverse transcription-quantitative
polymerase chain reaction (RT-qPCR)
Total RNA of all cell lines and liver tissues
collected in the present study was extracted using TRIzol reagent
(Tiangen Biotech Co., Ltd., Beijing, China). cDNA was synthesized
from 1 µg total RNA using an FastQuant RT kit (Tiangen Biotech Co.,
Ltd.), according to the manufacturer's protocol. qPCR was conducted
using a CFX Connect Real-Time system (Bio-Rad Laboratories, Inc.,
Hercules, CA, USA). Thermocycling conditions were as follows:
Initial denaturation at 95°C for 2 min, and 20 sec denaturing at
94°C, 20 sec annealing at 60°C and 20 sec extension at 72°C for 35
cycles, followed by 0.5°C every 5 sec from 65 to 95°C for melting
curve analysis. FastStart Universal SYBR Green Master Mix (Roche
Diagnostics, Indianapolis, IN, USA) was used. The sequences of
primers were as follows: OTC forward, 5′-TGGCTGATTACCTCACGCTC-3′
and reverse, 5′-TTCTTCTGGCTTTCTGGGCAA-3′; β-actin forward,
5′-CTCTTCCAGCCTTCCTTCCT-3′ and reverse, 5′-AGCACTGTGTTGGCGTACAG-3′.
The experiments were performed 3 times. The relative OTC mRNA
expression levels were determined with β-actin as an endogenous
control, using the 2−ΔΔCq method (16).
Western blot analysis
The cells were harvested and lysed with
radioimmunoprecipitation assay lysis buffer supplemented with a
protease inhibitor cocktail (Roche Diagnostics). Protein
quantification was conducted using the BCA assay (Pierce; Thermo
Fisher Scientific, Inc.). Total proteins (30 µg/lane) were
separated using 10% SDS-PAGE and transferred to polyvinylidene
difluoride membranes (GE Healthcare Life Sciences, Little Chalfont,
UK). The membranes were blocked with 5% skimmed milk for 1 h at
room temperature, and incubated with OTC primary antibody (1:1,000
dilution) or GAPDH (1:5,000 dilution) primary antibody at 4°C
overnight. They were subsequently incubated with horseradish
peroxidase-conjugated anti-rabbit (1:3,000 dilution; cat. no.
NA934; GE Healthcare Life Sciences) or anti-mouse IgG secondary
antibodies (1:5,000 dilution; cat. no. sc-2005; Santa Cruz
Biotechnology, Inc.) at room temperature for 2 h. The blots were
developed with ECL western blotting analysis reagents (Merck KGaA)
and the signal intensities were quantified using ImageJ version 1.4
software (National Institutes of Health, Bethesda, MD, USA).
Immunohistochemistry (IHC)
Immunohistochemistry (IHC) was performed on
paraffin-embedded sections. Sections (5-µm) of 15 paired samples
from patients with HCC were obtained from the Pathology Department
of First Affiliated Hospital, Chongqing Medical University. The
tissue sections were dewaxed with xylene, rehydrated through an
ethanol gradient into water and microwave-heated in sodium citrate
buffer (10 mM, pH 6.0) for antigen retrieval. Endogenous peroxidase
activity was quenched with 3% H2O2, and the
sections were then incubated with 10% normal goat nonimmune serum
(Fuzhou Maixin Biotech Co., Ltd., Fuzhou, China) for 30 min at room
temperature to block the nonspecific antibody binding.
Subsequently, the slides were incubated with OTC antibody at a 1:50
dilution at 4°C overnight. The following day, the sections were
incubated with biotinylated secondary antibody (undiluted; cat. no.
KIT-9710; Fuzhou Maixin Biotech Co., Ltd.) and combined with
horseradish peroxidase-labeled streptavidin. DAB staining was used
for detecting immunoreactivity (Dako; Agilent Technologies, Inc.,
Santa Clara, CA, USA). Counterstaining was performed using
hematoxylin for 2 min at room temperature. Negative control
sections were prepared without primary antibody to determine the
specificity of the staining. The scoring of OTC was carried out by
two independent pathologists using a light microscope, according to
the proportion of tumor cells with positive staining (negative,
none; weak, <10%; moderate, 10–50%; strong, >50%), as
previously described (17). No and
weak staining were defined as OTC negative, and moderate and strong
staining were defined as OTC positive. Images were captured using
an Olympus microscope equipped with a Olympus DP71 digital camera
(magnification, ×200; Olympus Corporation, Tokyo, Japan).
Proliferation and bromodeoxyuridine
assays
Cell proliferation in response to OTC silencing or
overexpression was determined by a trypan blue exclusion assay
(Thermo Fisher Scientific, Inc.). DNA synthesis was examined using
a Click-iT® EdU Imaging kit (Invitrogen; Thermo Fisher
Scientific, Inc.), according to the manufacturer's protocols.
Colony-formation assay
Cells transfected with plasmids (pCMV6-XL4-OTC and
pCMV6-XL4) and siRNAs (siOTC-1, siOTC-2 and siCont) were re-seeded
in 12-well plates and incubated at 37°C for 12 days, with the
medium being changed every 3 days. Images and metrics of newly
formed colonies were obtained by using IncuCyte® (model:
CCL-170T-8; Essen Bioscience, Ann Arbor, MI, USA). Each experiment
was repeated independently 3 times.
Statistical analysis
The difference between two groups was assessed using
two-tailed Student's t-test. OTC expression in HCC and adjacent
non-tumor liver tissue samples was compared using paired two-tailed
Student's t-test. Differences in OTC positive rates between HCC and
adjacent non-tumor liver tissues, as examined by IHC, were
evaluated by Fisher's exact test. One-way analysis of variance
followed by Dunnet's post hoc test was performed for comparisons
among multiple groups. Associations between OTC expression and
clinicopathological parameters were evaluated using a nonparametric
χ2 test. The survival rate analysis was performed using
the Kaplan-Meier method and equivalences of the survival curves
were tested using log-rank statistics. All statistical analyses
were performed using SPSS version 19.0 software. Differences were
considered statistically significant when P<0.05.
Results
OTC expression is significantly
downregulated in HCC
Data from 225 HCC tumor and 220 non-tumor tissue
samples from the Gene Expression Omnibus database of the National
Center for Biotechnology Information (dataset accession no.
GSE14520; http://www.ncbi.nlm.nih.gov/geo/) (15) were used for analysis. The results
revealed a significantly decreased OTC expression in the HCC tumor
specimens compared with that in the non-tumor samples (P<0.0001;
Fig. 1A). To verify the
downregulation of OTC in HCC, its expression in PHHs, immortalized
MIHA hepatocytes and liver cancer cells (Huh-7, HepG2, Hep3B,
PLC/PRF/5 and SK-Hep-1) was determined using RT-qPCR and western
blot analyses. The RT-qPCR analysis revealed that OTC mRNA
expression was significantly lower in the liver cancer cells
compared with that in PHHs (Fig.
1B). In addition, the OTC protein levels were lower in the
liver cancer cell lines compared with those in PHHs, as detected by
western blotting (Fig. 1C). Similar
to HCC cells, MIHA cells exhibited lower OTC expression compared
with PHH cells. As numerous genes identified to be dysregulated
were associated with cell immortalization and transformation
(18,19), it is possible that immortalization
contributed to the downregulation of OTC in MIHA cells.
 | Figure 1.OTC expression is significantly
downregulated in HCC. (A) The relative level of OTC mRNA in HCC T
and N samples. The microarray data were obtained from the Gene
Expression Omnibus database (dataset GSE14520). The central line
represents the mean and the error bars indicate the standard
deviation. The average relative OTC mRNA levels were compared using
a two-tailed unpaired Student's t-test. ***P<0.0001. OTC (B)
mRNA and (C) protein expression in PHHs, 5 liver cancer cell lines
and the immortalized liver MIHA cells. GAPDH was used as a loading
control for the western blot analysis and β-actin was used as a
reference gene for in the reverse transcription-quantitative
polymerase chain reactions. The data are presented as the mean ±
standard deviation of 3 independent experiments. ***P<0.001. (D)
Representative immunohistochemistry images of OTC expression in HCC
T (top panel) and adjacent N (bottom panel) samples (original
magnification, ×400). Upper left, low expression; upper right,
negative staining; lower left, strongly positive expression; lower
right, moderate levels of staining. Quantitative analysis of OTC
(E) mRNA and (F) protein levels in 42 paired clinical HCC tissue
samples. The central line represents the mean and the error bars
indicate the standard deviation. Two-tailed paired Student's t-test
was used to compare the groups. *P<0.05; **P<0.01 and
***P<0.001. (G) Western blot analysis of OTC (39 kDa) in 18
paired clinical HCC T and adjacent N samples. GAPDH was used as a
loading control. OTC, ornithine transcarbamylase; HCC,
hepatocellular carcinoma; T, tumor tissue; N, non-tumor tissue;
PHH, primary human hepatocyte |
Subsequently, OTC protein expression was
investigated in 15 HCC tissue samples obtained from the Pathology
Department of First Affiliated Hospital, Chongqing Medical
University and their respective adjacent non-tumor liver samples
via IHC (Fig. 1D). The findings
revealed that, in the 15 cases examined, all the adjacent non-tumor
liver tissues exhibited positive (strong or moderate) OTC
expression. However, positive expression was detected in only 4 of
the 15 HCC tissues (26.7%) (Table
SI). The levels of OTC were further examined in 42 pairs of
clinical HCC specimens by RT-qPCR and western blotting. The results
indicated that OTC mRNA was downregulated on average in the HCC
tissues compared with their adjacent non-tumor samples (P=0.0006;
Fig. 1E). Western blot analysis
indicated that 30/42 HCC tissues (71.4%) exhibited lower OTC
expression compared with adjacent non-tumor tissues. Of these 30
HCC tissues, 14 exhibited undetectable OTC protein expression. The
average OTC protein level in the 42 HCC tissues was significantly
lower compared with the average OTC protein level in the 42
adjacent non-tumor samples, as semi-quantified by ImageJ software.
(P=0.0404; Fig. 1F and G). Taken
together, the present results suggest that OTC expression is
suppressed in HCC tissues and cells.
The association between OTC expression
and clinicopathological parameters
The association between OTC expression and the
clinicopathological features of the patients with HCC was examined
in the 42 cases included in this study. The patients were
classified into two groups based on the OTC protein level (cases
where the protein level in the tumor tissue relative to the
adjacent non-tumor tissue sample was <1.0 were classified as
low-expression; the rest were classified as high-expression). The
findings revealed low expression in 30 of the 42 cases (71.4%) and
high expression in 12 cases (28.6%) (Table I). Pearson's χ2 test
revealed that lower tumor OTC levels were associated with a larger
tumor size (P=0.01) and higher grade (P=0.02). No significant
association was observed between OTC levels and patient age or sex,
or other clinical parameters, including cirrhosis, vascular
invasion, multiple tumors and the serological predictor of liver
damage, alanine aminotransferase. In addition, the tumor OTC levels
were evaluated according to the tumor stage in data obtained from
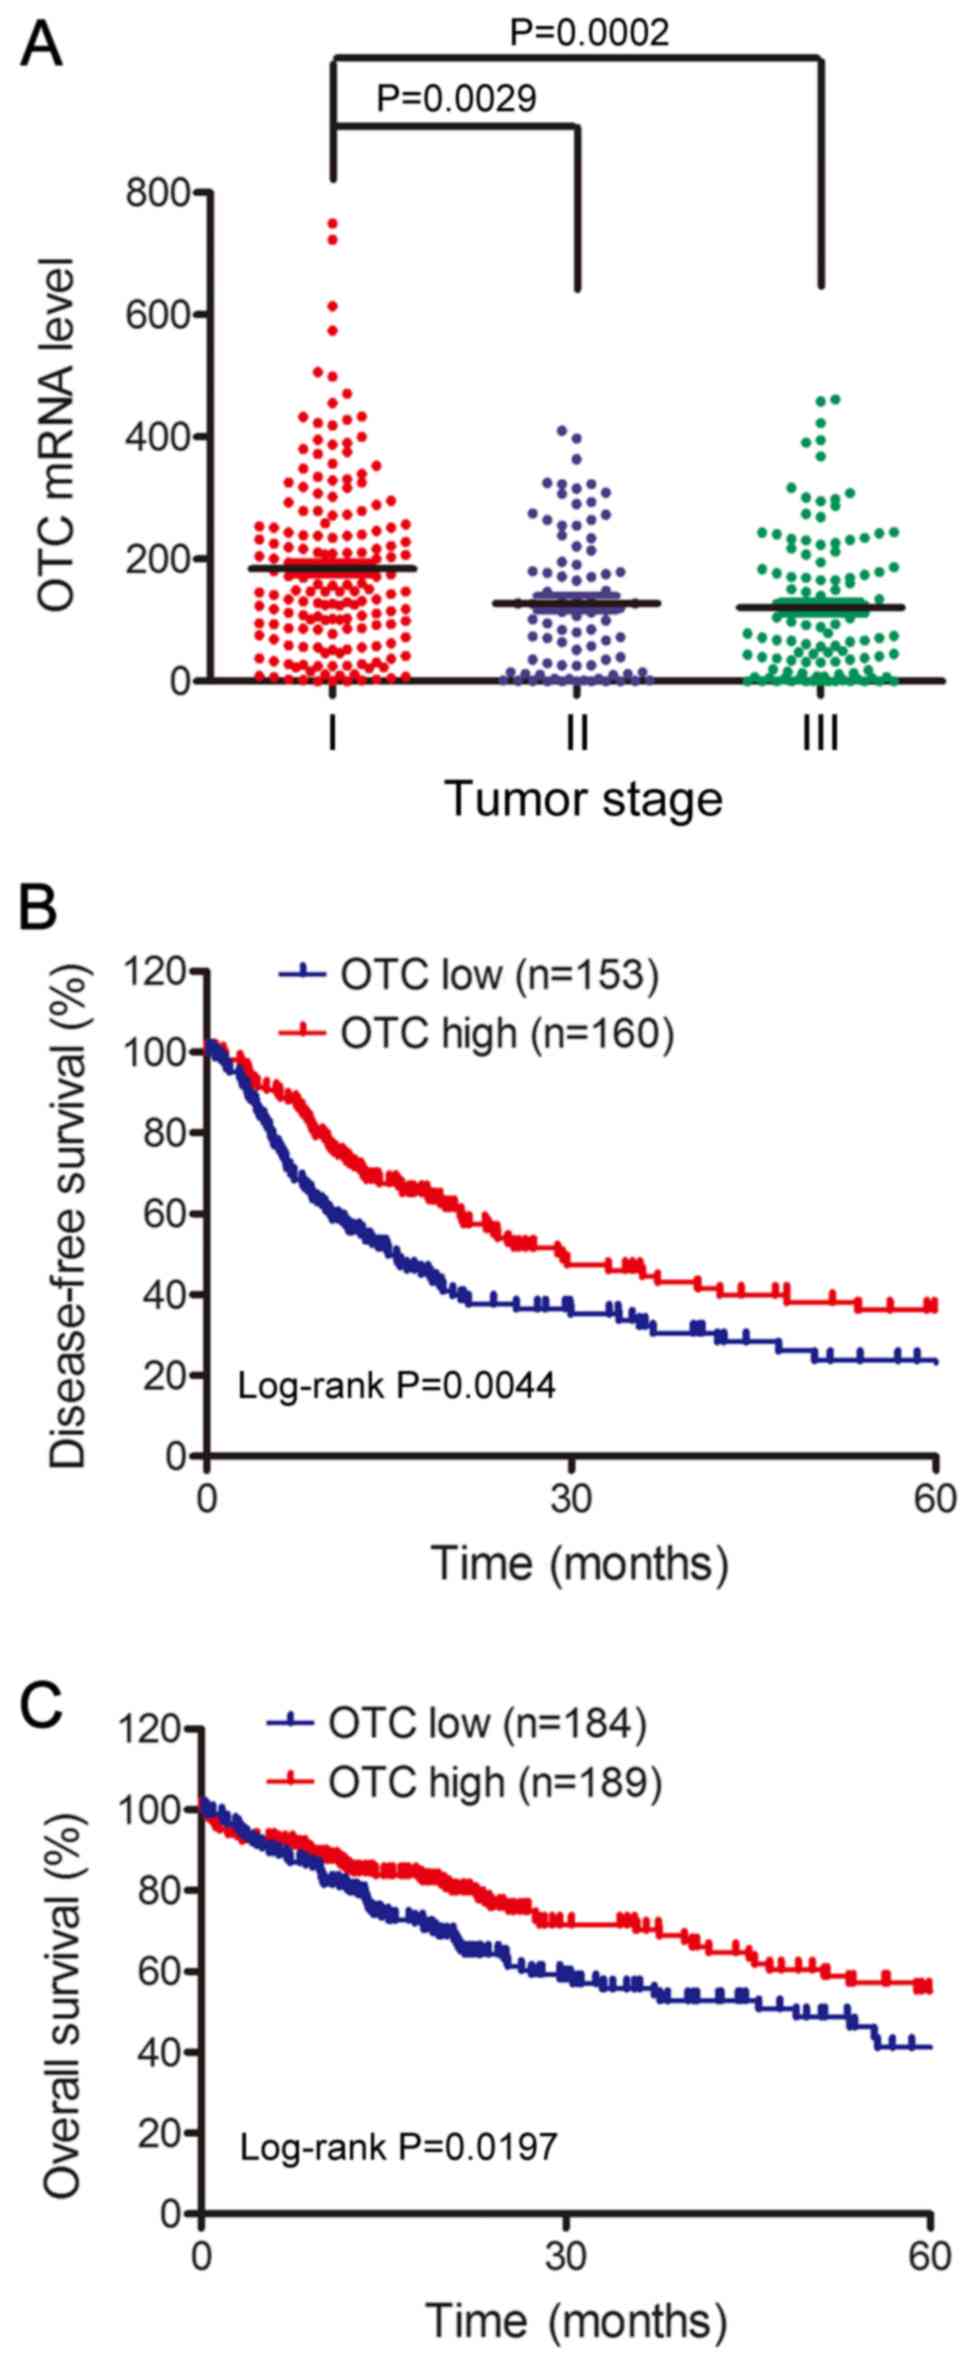
the TCGA database (http://gdc.cancer.gov/). As demonstrated in Fig. 2A, the OTC mRNA levels in patients
with early stage tumors (stage I) was higher than those with stage
II (P=0.0029) or III (P=0.0002) tumors. To further confirm that low
OTC levels indicate poor HCC prognosis, the 5-year overall survival
times of 373 HCC cases and disease-free survival times of 313 cases
from TCGA database were analyzed using the Kaplan-Meier method.
Patients with low OTC expression exhibited significantly shorter
disease-free survival (P=0.0044; Fig.
2B) and 5-year overall survival rates (P=0.0197; Fig. 2C) compared with those with high
expression. Together, these results demonstrate that low OTC levels
are associated with tumor progression and poor survival rates,
making this factor a potential novel biomarker for patients with
HCC.
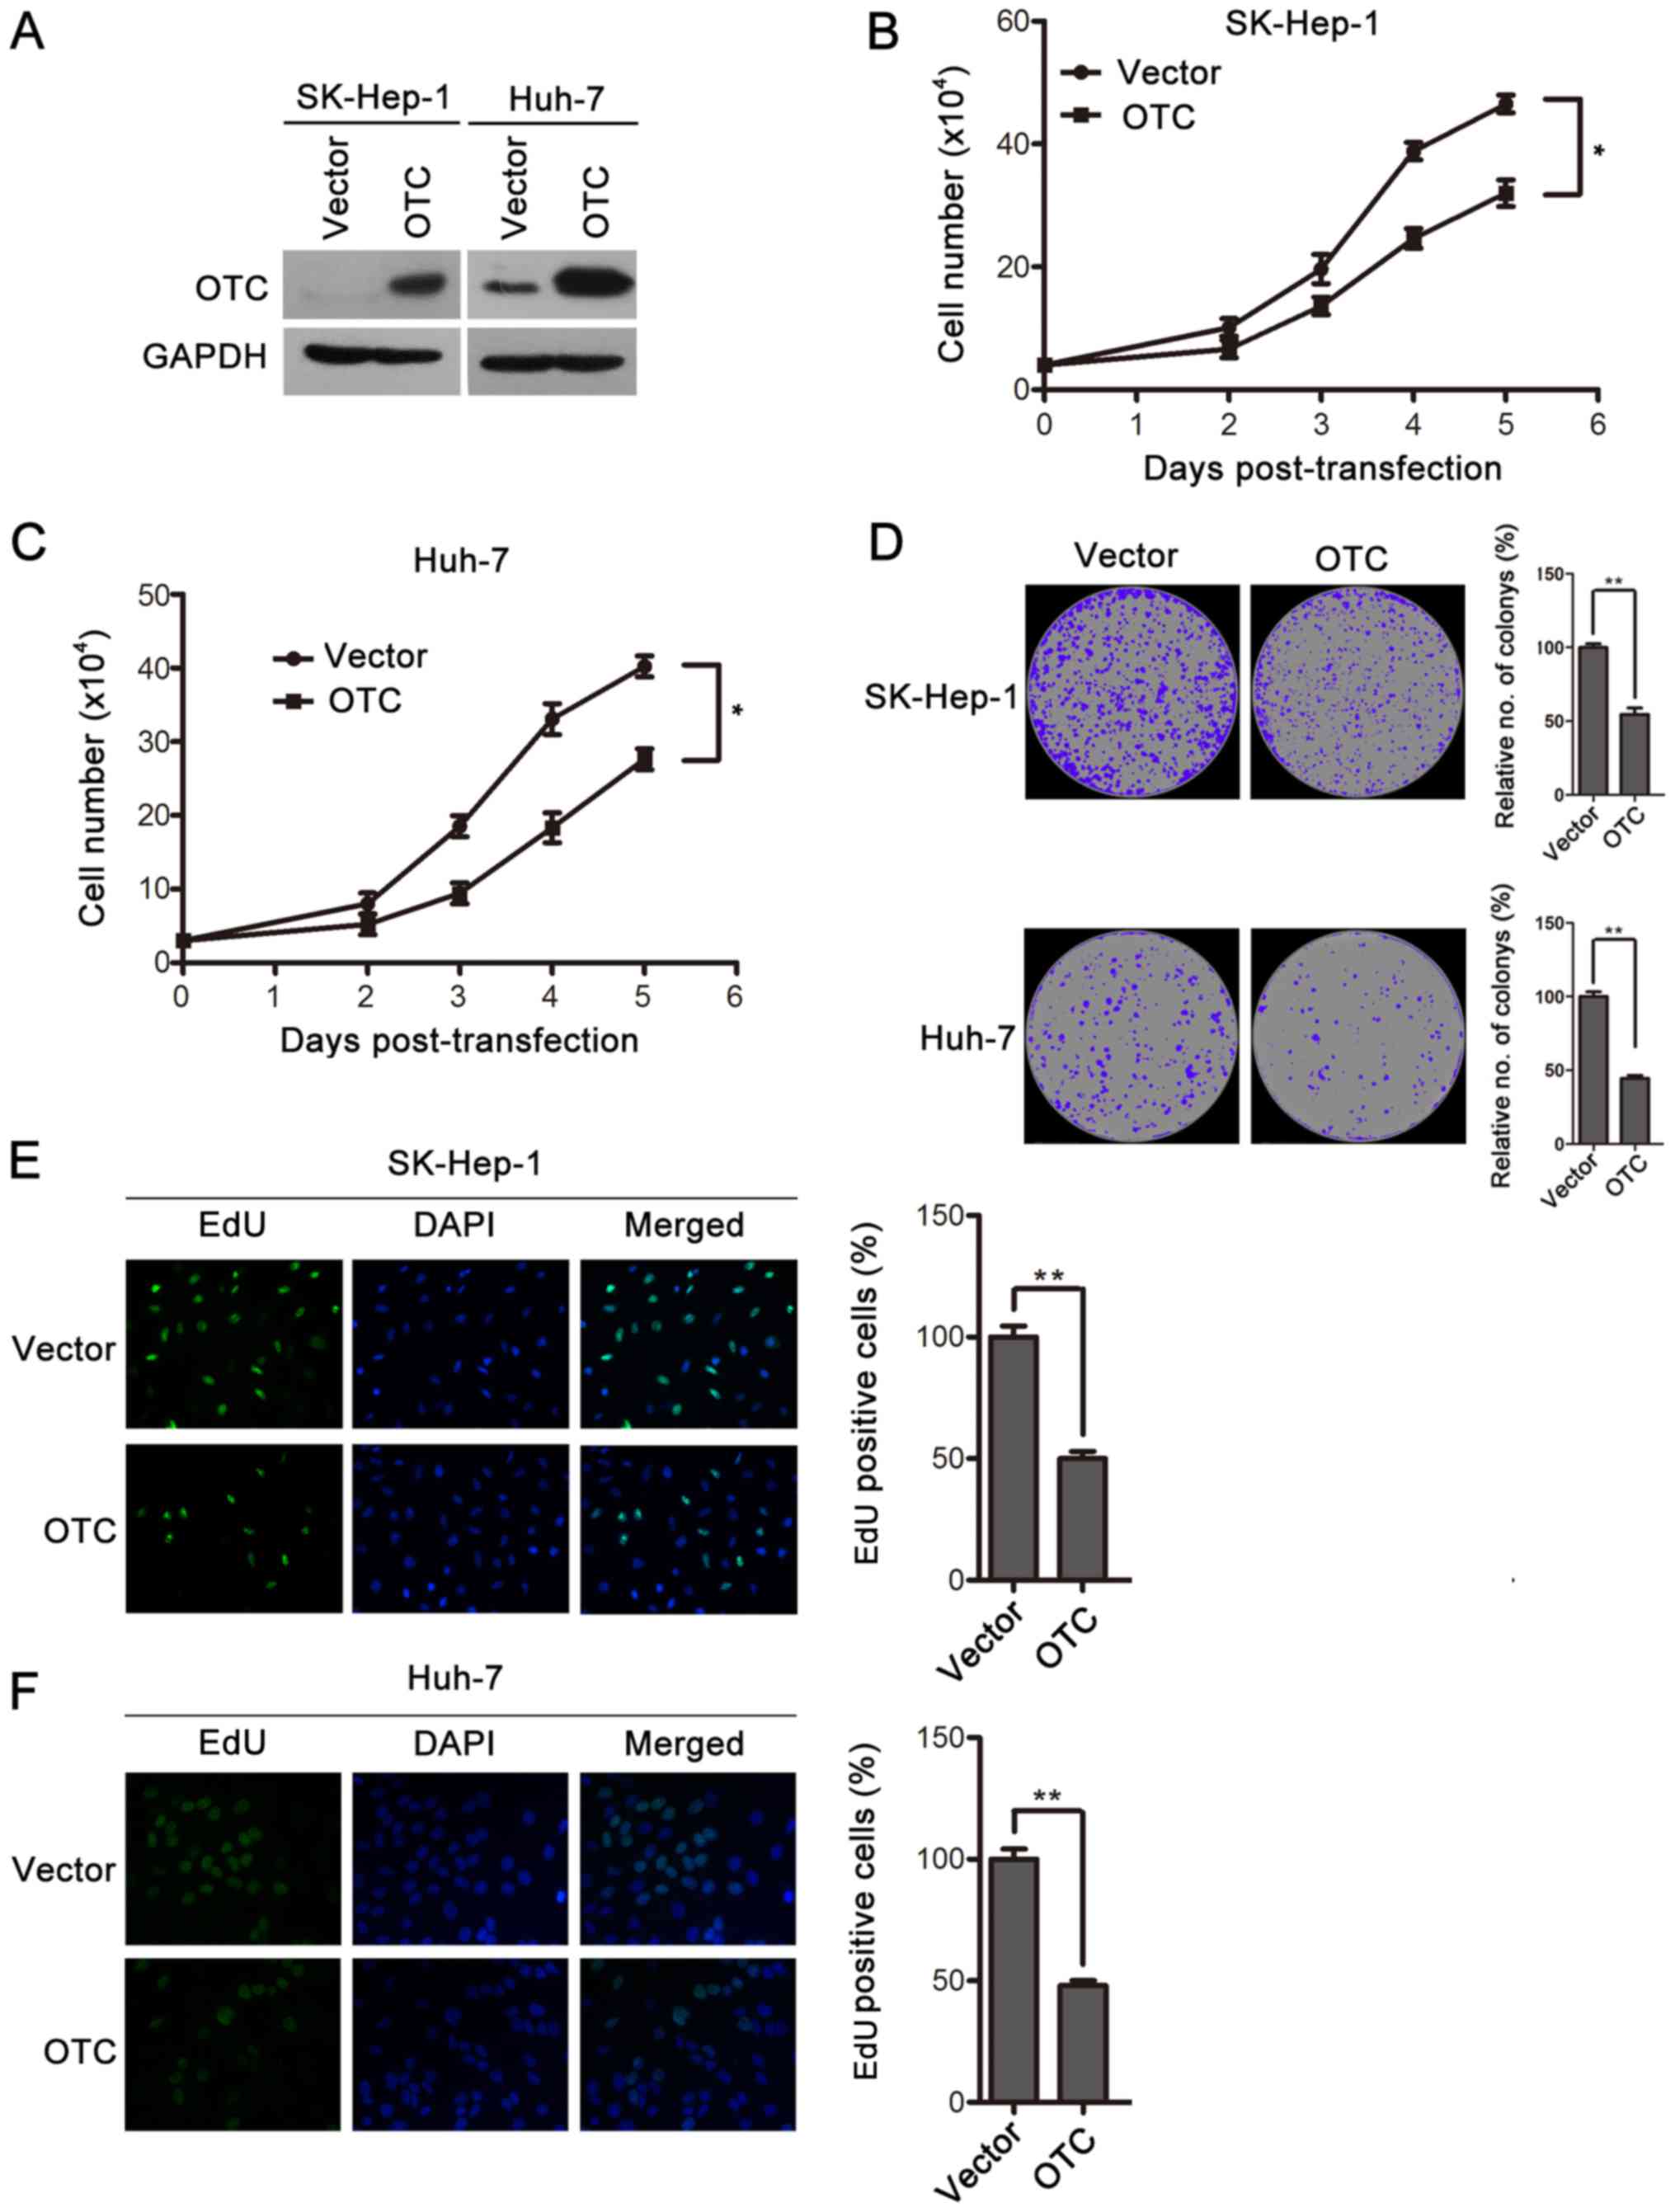
OTC overexpression inhibits HCC cell
proliferation
To explore the functional role of OTC in HCC, OTC
was overexpressed in Huh-7 and SK-Hep-1 cells by transient
transfection and verified by western blotting (Fig. 3A). The effects of OTC overexpression
on the cells were assessed by cell proliferation and
colony-formation assays. The upregulation of OTC significantly
decreased the proliferation rates of Huh-7 and SK-Hep-1 cells
(Fig. 3B and C). Furthermore,
decreased numbers and sizes of SK-Hep-1 and Huh-7 cell colonies
were observed in the OTC overexpression groups compared with the
control groups, which were transfected with vector plasmid
(Fig. 3D). Finally, OTC
overexpression led to an inhibition of DNA synthesis, as revealed
by EdU staining (Fig. 3E and F).
Collectively, these results demonstrate that OTC overexpression
serves an inhibitory role in cell proliferation and
colony-formation in HCC cells.
OTC silencing facilitates HCC cell
proliferation
To further evaluate the biological effects of OTC on
HCC cells, an RNA interference experiment was performed on Huh-7
and SK-Hep-1 cells. Targeting siRNAs (siOTC-1 and siOTC-2)
suppressed OTC expression, as determined by western blotting
(Fig. 4A). OTC downregulation
significantly enhanced cell proliferation in the two cell lines
(Fig. 4B and C), and resulted in
enhanced colony-formation ability (Fig.
4D). In addition, elevated DNA synthesis was observed in
OTC-knockdown cells (Fig. 4E and F).
Together, these data support that OTC downregulation promotes HCC
cell proliferation and colony formation.
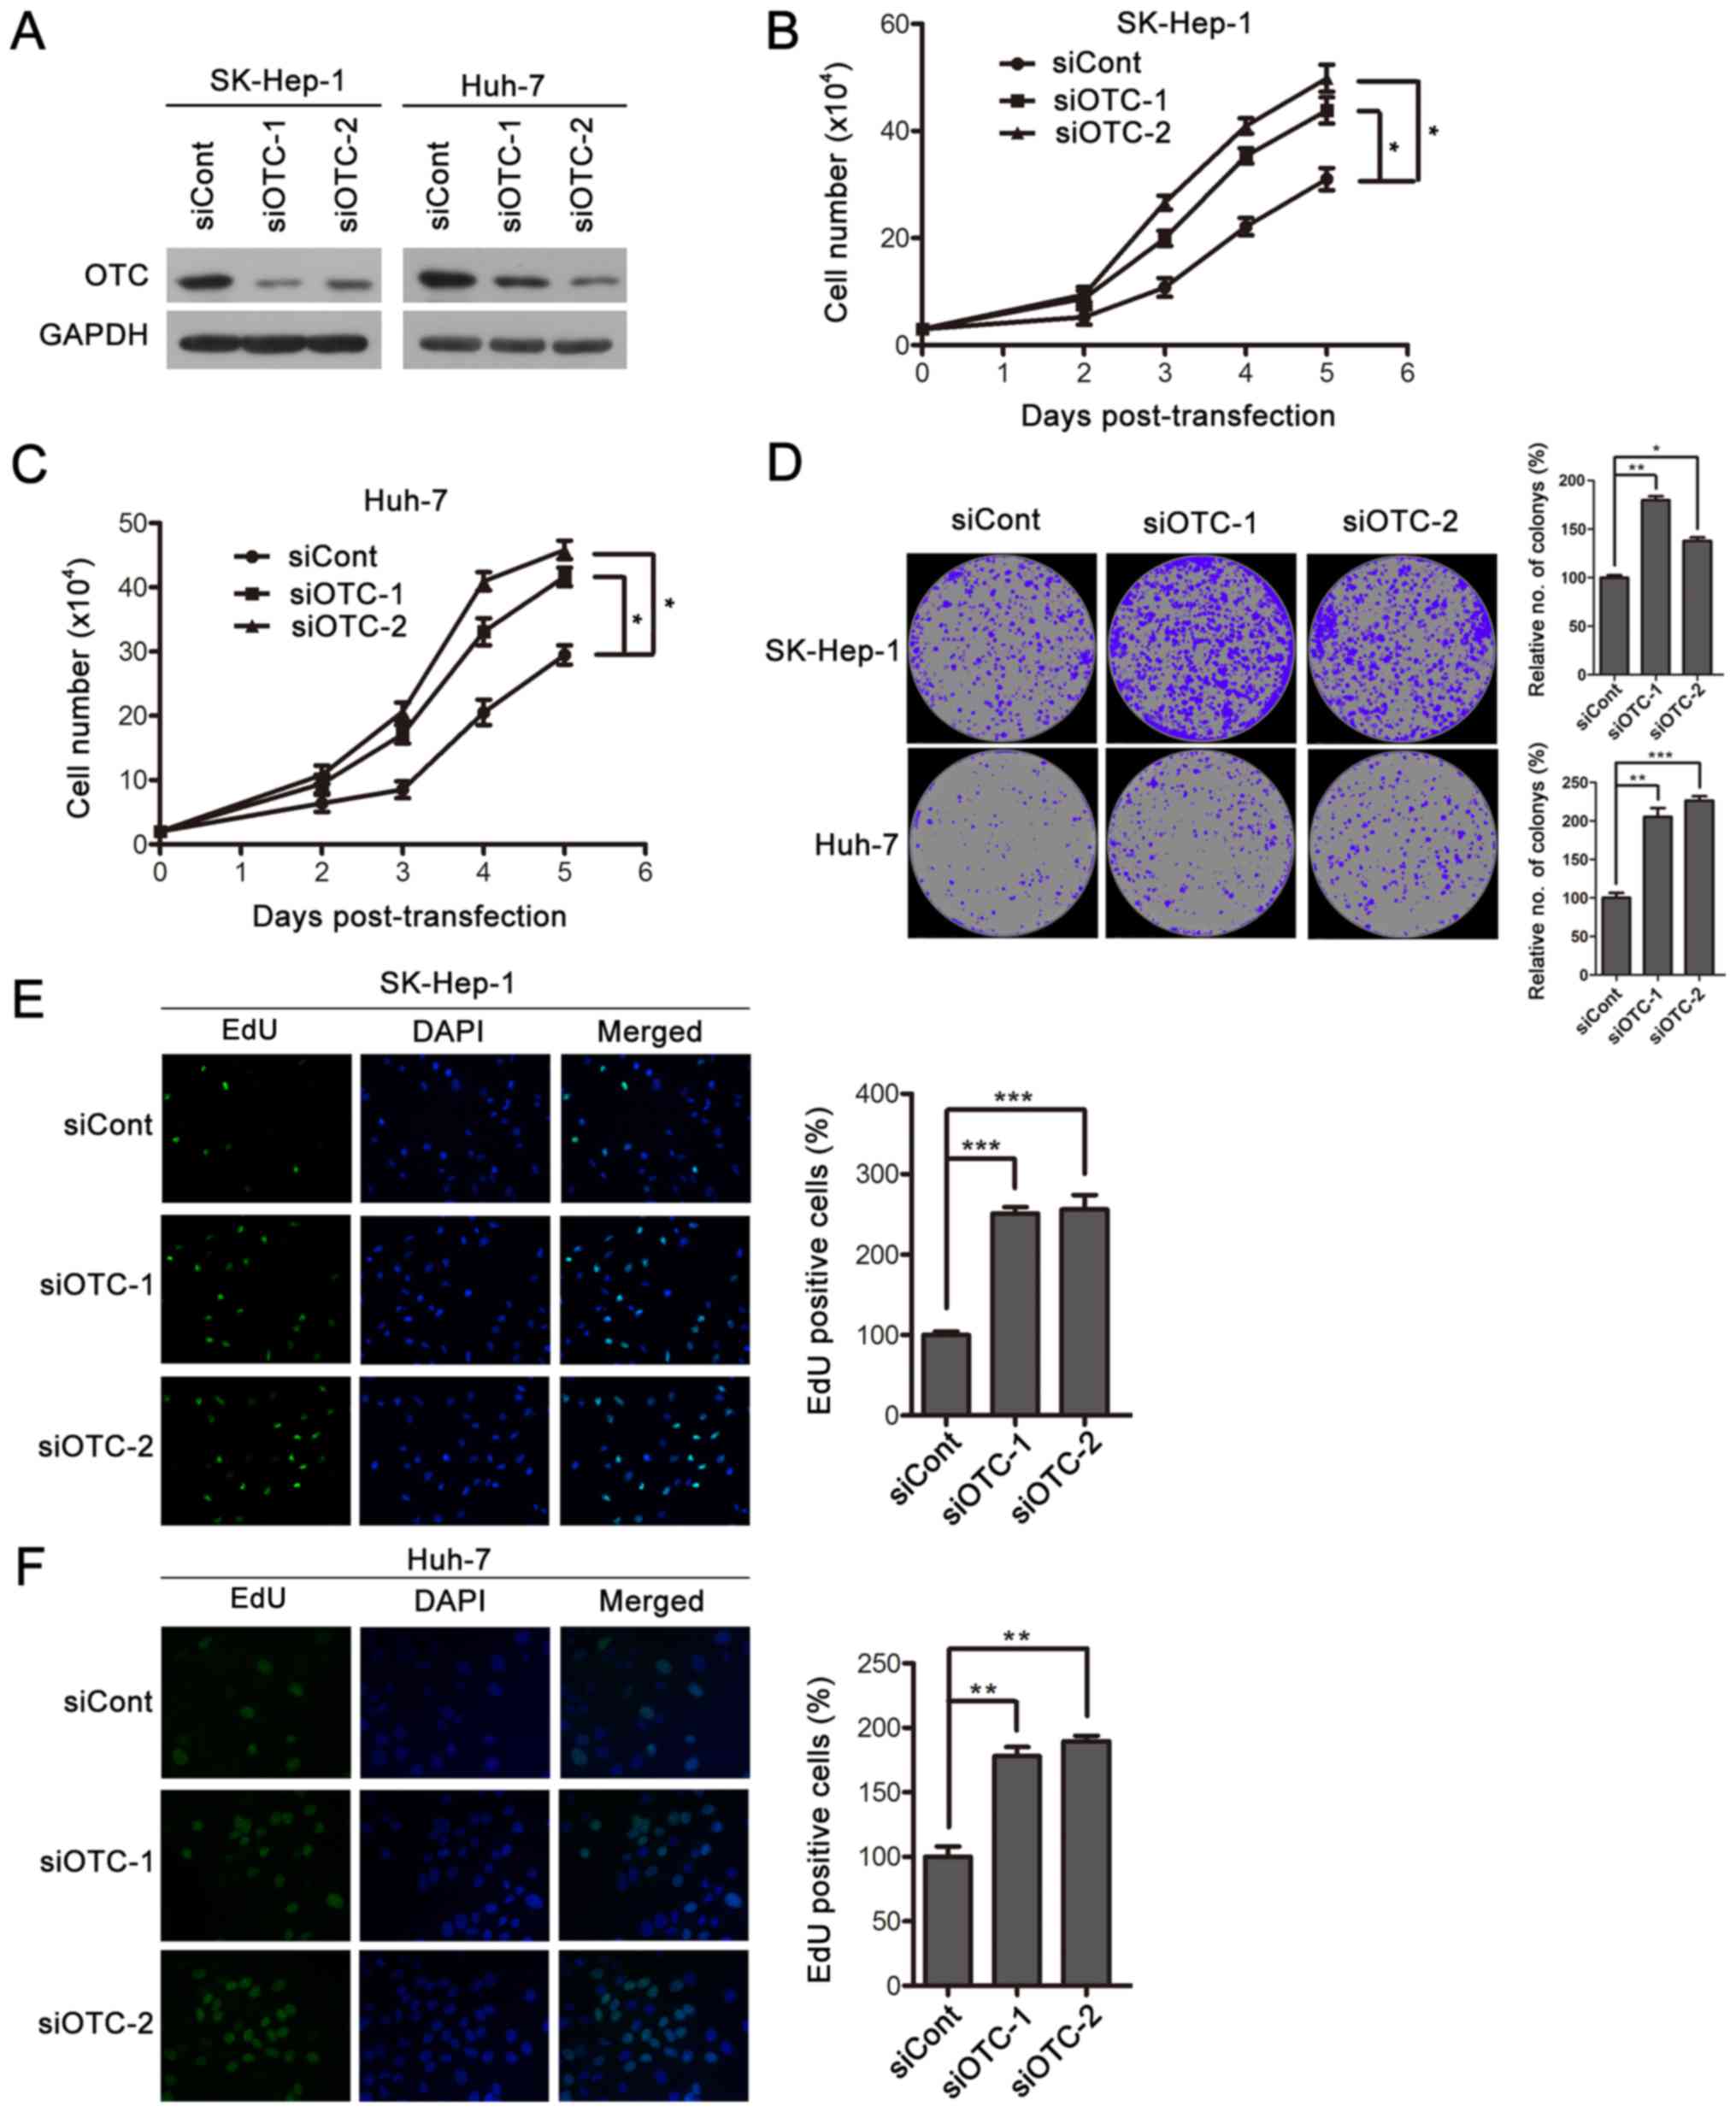 | Figure 4.OTC silencing facilitates HCC cell
proliferation. (A) The efficiency of OTC gene silencing was
evaluated by western blotting. siRNAs siOTC-1, siOTC-2 or siCont
were transfected into HCC SK-Hep-1 and Huh-7 cells. The cells were
harvested 3 days after transfection. OTC silencing resulted in
enhanced proliferation of (B) SK-Hep-1 and (C) Huh-7 cells. The
cells were counted at the indicated time points following
transfection using a trypan blue exclusion assay. The data are
presented as the mean ± standard deviation of 3 independent
experiments and the groups were compared using two-way analysis of
variance. *P<0.05. (D) OTC downregulation led to enhanced colony
formation. Transfected SK-Hep-1 and Huh-7 cells were cultured for
12 days, images were captured, and newly formed colonies in each
well were counted and expressed as a percentage relative to the
control group. The data are presented as the mean ± standard
deviation of 3 independent experiments. *P<0.05, **P<0.01 and
***P<0.001. DNA synthesis was determined in (E) SK-Hep-1 and (F)
Huh-7 cells 3 days after transfection. Original magnification,
×400. The quantification of EdU-positive cells was conducted
macroscopically and expressed as a percentage relative to the
control cells. The data are presented as the mean ± standard
deviation of 3 independent experiments. *P<0.05, **P<0.01 and
***P<0.001. OTC, ornithine transcarbamylase; HCC, hepatocellular
carcinoma; siRNA, small interfering RNA; siOTC, siRNA targeting
OTC; siCont, scrambled siRNA control. |
Discussion
OTC, a key enzyme in the urea cycle, has been well
documented in ammonia metabolism (20). However, few studies have focused on
the role of OTC in HCC. A previous study demonstrated that OTC
deficiency could increase the risk of developing HCC, suggesting
that OTC may be associated with HCC progression. Another study
revealed that OTC depletion could increase the probability of liver
fibrosis in a mouse model, and since ~90% of HCC develops from
liver fibrosis, this suggests that OTC is indirectly linked to HCC
progression (11,12). However, direct evidence on the role
of OTC in HCC progression is lacking. In the present study, the
functional role of OTC in HCC was investigated. Based on the
database analyses, OTC expression levels were revealed to be
downregulated in HCC. This was further verified in liver cancer
cell lines and 42 paired clinical HCC tissue samples. In agreement
with the present findings, Liu et al (21) noticed that OTC mRNA levels are
downregulated in HCC Huh-7 and LH86 cell lines. To further
elucidate the role of OTC in HCC, associations between OTC
expression and the clinicopathological features of the patients
were investigated. The results demonstrated that low OTC expression
was associated with larger tumor size and advanced grade.
Furthermore, low tumor OTC expression indicated poor prognosis for
patients with HCC.
The enzyme activity of OTC is inhibited by
acetylation at lysine 88, highlighting the important role of a
deacetylase in the regulation of its function (6). Furthermore, the mitochondrial
NAD-dependent protein deacetylase sirtuin-3 (SIRT3) has been
identified as a regulator of OTC deacetylation (22). Notably, a previous study determined
that SIRT3 is downregulated in HCC cells, possibly protecting them
from apoptosis (23). Combined with
the present observations that OTC functions as a tumor suppressor,
it was hypothesized that the acetylation of OTC in HCC cells is
increased by the downregulation of SIRT3, leading to the
suppression of its activity. This may explain the finding that OTC
RNA interference promoted cell proliferation, whereas
overexpression had the opposite effect in the present study.
It is worth noting that decreased OTC levels may
impair the normal urea cycle, resulting in the accumulation of
ammonia and a hyperammonemic state. High concentrations of ammonia
in cells are toxic and induce cell apoptosis (24–27).
This is contradictory to the observation that low OTC promoted HCC
cell proliferation. In the present study, no clinical symptoms of
hyperammonemia nor marked elevations of blood ammonia levels were
observed in the patients with HCC. As glutamine metabolism is the
main source of ammonia, it is hypothesized that HCC cells may
utilize glutamine mainly through the transamination pathway without
resulting in ammonia production. This non-canonical pathway of
glutamine utilization is also observed in human pancreatic ductal
adenocarcinoma cells, and it is required for tumor growth (28). The implicated interactions between
the transamination and amino acid metabolism pathways in HCC cells
may be involved in the development of HCC mediated by downregulated
OTC. Additionally, studies have reported that OTC may influence
liver regeneration though participating in certain unidentified
signaling pathways, independent of its known enzyme activity
(29). Further investigations are
required to explain whether the effect of OTC on HCC cells relies
on the protein itself or its catalytic properties and possible
targets.
In summary, the present study revealed a new
function of OTC in HCC tumorigenesis and progression. The decreased
OTC levels may contribute to the HCC development of this disease,
making it a potential target for therapy. Further studies are
required to uncover the underlying mechanism involving OTC in the
inhibition of HCC development.
Supplementary Material
Supporting Data
Acknowledgements
Not applicable.
Funding
This study was supported by the National Natural
Science Foundation of China (grant no. 81672012 to JC), the
Chongqing Natural Science Foundation (grant no. cstc2016jcyjA0183
to JC) and the Scientific Research Project of Graduate Students of
Chongqing Medical University (grant no. BJRC201726).
Availability of data and materials
All data generated or analyzed during this study are
included in this published article.
Authors' contributions
JC was involved in the study design, data curating,
project administration and resource management. JC and LH
participated in the data analysis, funding acquisition, and
manuscript writing, editing and reviewing. LH, FR, NT, ZZ and JR
took part in specimen collection and acquisition of
clinicopathological data. FR, NT, ZZ and JR performed the analysis
and interpretation of clinicopathological data. LH, XC, HZ and QY
performed the experiments. JC, LH, HZ and SC were involved in the
analysis of online datasets. All authors read and approved the
final manuscript.
Ethics approval and consent to
participate
The Clinical Research Ethics Committee of the
Chongqing Medical University approved the study (approval no.
2017019). Written informed consent was obtained from all
participants for use of their tissue samples.
Patient consent for publication
Not applicable.
Competing interests
The authors declare that there are no competing
interests.
References
|
1
|
Torre LA, Bray F, Siegel RL, Ferlay J,
Lortet-Tieulent J and Jemal A: Global cancer statistics, 2012. CA
Cancer J Clin. 65:87–108. 2015. View Article : Google Scholar : PubMed/NCBI
|
|
2
|
El-Serag HB: Hepatocellular carcinoma. N
Engl J Med. 365:1118–1127. 2011. View Article : Google Scholar : PubMed/NCBI
|
|
3
|
Bray F, Ferlay J, Soerjomataram I, Siegel
RL, Torre LA and Jemal A: Global cancer statistics 2018: GLOBOCAN
estimates of incidence and mortality worldwide for 36 cancers in
185 countries. CA Cancer J Clin. 68:394–424. 2018. View Article : Google Scholar : PubMed/NCBI
|
|
4
|
Forner A, Reig ME, de Lope CR and Bruix J:
Current strategy for staging and treatment: The BCLC update and
future prospects. Semin Liver Dis. 30:61–74. 2010. View Article : Google Scholar : PubMed/NCBI
|
|
5
|
Raza A and Sood GK: Hepatocellular
carcinoma review: Current treatment, and evidence-based medicine.
World J Gastroenterol. 20:4115–4127. 2014. View Article : Google Scholar : PubMed/NCBI
|
|
6
|
Yu W, Lin Y, Yao J, Huang W, Lei Q, Xiong
Y, Zhao S and Guan KL: Lysine 88 acetylation negatively regulates
ornithine carbamoyltransferase activity in response to nutrient
signals. J Biol Chem. 284:13669–13675. 2009. View Article : Google Scholar : PubMed/NCBI
|
|
7
|
Auron A and Brophy PD: Hyperammonemia in
review: Pathophysiology, diagnosis, and treatment. Pediatr Nephrol.
27:207–222. 2012. View Article : Google Scholar : PubMed/NCBI
|
|
8
|
Helman G, Pacheco-Colón I and Gropman AL:
The urea cycle disorders. Semin Neurol. 34:341–349. 2014.
View Article : Google Scholar : PubMed/NCBI
|
|
9
|
Capistrano-Estrada S, Marsden DL, Nyhan
WL, Newbury RO, Krous HF and Tuchman M: Histopathological findings
in a male with late-onset ornithine transcarbamylase deficiency.
Pediatr Pathol. 14:235–243. 1994. View Article : Google Scholar : PubMed/NCBI
|
|
10
|
El-Serag HB and Mason AC: Rising incidence
of hepatocellular carcinoma in the United States. N Engl J Med.
340:745–750. 1999. View Article : Google Scholar : PubMed/NCBI
|
|
11
|
Wilson JM, Shchelochkov OA, Gallagher RC
and Batshaw ML: Hepatocellular carcinoma in a research subject with
ornithine transcarbamylase deficiency. Mol Genet Metab.
105:263–265. 2012. View Article : Google Scholar : PubMed/NCBI
|
|
12
|
Wang L, Bell P, Morizono H, He Z, Pumbo E,
Yu H, White J, Batshaw ML and Wilson JM: AAV gene therapy corrects
OTC deficiency and prevents liver fibrosis in aged OTC-knock out
heterozygous mice. Mol Genet Metab. 120:299–305. 2017. View Article : Google Scholar : PubMed/NCBI
|
|
13
|
Cuccurullo V and Mansi L: AJCC cancer
staging handbook: From the AJCC cancer staging manual (7th
edition). Eur J Nucl Med Mol Imaging. 38:408. 2011. View Article : Google Scholar
|
|
14
|
Edmondson HA and Steiner PE: Primary
carcinoma of the liver: A study of 100 cases among 48,900
necropsies. Cancer. 7:462–503. 1954. View Article : Google Scholar : PubMed/NCBI
|
|
15
|
Dang H, Takai A, Forgues M, Pomyen Y, Mou
H, Xue W, Ray D, Ha KCH, Morris QD, Hughes TR and Wang XW:
Oncogenic activation of the RNA binding protein NELFE and MYC
signaling in hepatocellular carcinoma. Cancer Cell. 32:101–114 e08.
2017. View Article : Google Scholar : PubMed/NCBI
|
|
16
|
Livak KJ and Schmittgen TD: Analysis of
relative gene expression data using real-time quantitative PCR and
the 2(-Delta Delta C(T)) method. Methods. 25:402–408. 2001.
View Article : Google Scholar : PubMed/NCBI
|
|
17
|
Chen J, Zhang B, Wong N, Lo AW, To KF,
Chan AW, Ng MH, Ho CY, Cheng SH, Lai PB, et al: Sirtuin 1 is
upregulated in a subset of hepatocellular carcinomas where it is
essential for telomere maintenance and tumor cell growth. Cancer
Res. 71:4138–4149. 2011. View Article : Google Scholar : PubMed/NCBI
|
|
18
|
Tommasi S, Zheng A, Weninger A, Bates SE,
Li XA, Wu X, Hollstein M and Besaratinia A: Mammalian cells acquire
epigenetic hallmarks of human cancer during immortalization.
Nucleic Acids Res. 41:182–195. 2013. View Article : Google Scholar : PubMed/NCBI
|
|
19
|
Ramboer E, De Craene B, De Kock J,
Vanhaecke T, Berx G, Rogiers V and Vinken M: Strategies for
immortalization of primary hepatocytes. J Hepatol. 61:925–943.
2014. View Article : Google Scholar : PubMed/NCBI
|
|
20
|
Mori M, Miura S, Morita T, Takiguchi M and
Tatibana M: Ornithine transcarbamylase in liver mitochondria. Mol
Cell Biochem. 49:97–111. 1982. View Article : Google Scholar : PubMed/NCBI
|
|
21
|
Liu H, Dong H, Robertson K and Liu C: DNA
methylation suppresses expression of the urea cycle enzyme
carbamoyl phosphate synthetase 1 (CPS1) in human hepatocellular
carcinoma. Am J Pathol. 178:652–661. 2011. View Article : Google Scholar : PubMed/NCBI
|
|
22
|
Hallows WC, Yu W, Smith BC, Devries MK,
Ellinger JJ, Someya S, Shortreed MR, Prolla T, Markley JL, Smith
LM, et al: Sirt3 promotes the urea cycle and fatty acid oxidation
during dietary restriction. Mol Cell. 41:139–149. 2011. View Article : Google Scholar : PubMed/NCBI
|
|
23
|
Song CL, Tang H, Ran LK, Ko BC, Zhang ZZ,
Chen X, Ren JH, Tao NN, Li WY, Huang AL and Chen J: Sirtuin 3
inhibits hepatocellular carcinoma growth through the glycogen
synthase kinase-3β/BCL2-associated X protein-dependent apoptotic
pathway. Oncogene. 35:631–641. 2016. View Article : Google Scholar : PubMed/NCBI
|
|
24
|
Liu Q, Ding MH, Zhang R, Chen HX, Zhou XX,
Xu HF, Chen H and Peng KL: Study on mechanism of thyroid
cytotoxicity of ammonium perchlorate. Zhonghua Lao Dong Wei Sheng
Zhi Ye Bing Za Zhi. 31:418–421. 2013.(In Chinese). PubMed/NCBI
|
|
25
|
Luo C, Shen G, Liu N, Gong F, Wei X, Yao
S, Liu D, Teng X, Ye N, Zhang N, et al: Ammonia drives dendritic
cells into dysfunction. J Immunol. 193:1080–1089. 2014. View Article : Google Scholar : PubMed/NCBI
|
|
26
|
Wang Q, Wang Y, Yu Z, Li D, Jia B, Li J,
Guan K, Zhou Y, Chen Y and Kan Q: Ammonia-induced energy disorders
interfere with bilirubin metabolism in hepatocytes. Arch Biochem
Biophys. 555-556:16–22. 2014. View Article : Google Scholar : PubMed/NCBI
|
|
27
|
Xu Y, Wang N, Ding Y, Wang C, Yu Y, Liu S,
Wang X and Li Z: Ammonium chloride enhances cisplatin cytotoxicity
through DNA double-strand breaks in human cervical cancer cells.
Oncol Rep. 30:1195–1200. 2013. View Article : Google Scholar : PubMed/NCBI
|
|
28
|
Son J, Lyssiotis CA, Ying H, Wang X, Hua
S, Ligorio M, Perera RM, Ferrone CR, Mullarky E, Shyh-Chang N, et
al: Glutamine supports pancreatic cancer growth through a
KRAS-regulated metabolic pathway. Nature. 496:101–105. 2013.
View Article : Google Scholar : PubMed/NCBI
|
|
29
|
Díaz-Muñoz M and Hernández-Muñoz R:
Molecular and biochemical features of the mitochondrial enzyme
ornithine transcarbamylase: A possible new role as a signaling
factor. Curr Med Chem. 17:2253–2260. 2010. View Article : Google Scholar : PubMed/NCBI
|