Introduction
Ovarian cancer has the highest morbidity and
mortality of all malignant diseases affecting the female
reproductive system. Worldwide, >140,200 fatalities occur due to
ovarian cancer each year (1).
Conventional treatments for ovarian cancer are cytoreductive
surgery and platinum-based chemotherapy; however, the overall
survival rate of patients with ovarian cancer has not greatly
improved over the past 40 years (2,3).
Although first-line chemotherapy regimens, including platinum
combined with paclitaxel, are effective in certain patients for
first time treatment, 75% of patients relapse following treatment
(4). At present, patient response to
chemotherapy is difficult to predict and so it is important to
identify an effective predictive biomarker for chemotherapeutic
resistance (5).
In previous years, leptin has become a focus of
research due to its association with cancer and obesity (6,7). Leptin,
also known as obesity hormone, is a hormone-like cytokine secreted
by fat cells (8,9). It serves a vital role in maintaining
the dynamic balance between energy and weight by affecting appetite
and energy consumption, which in turn directly modulates fat
storage and metabolism (10).
Furthermore, leptin promotes the proliferation of various cells and
tissues and serves an important role in regulating energy
metabolism, immune response, trauma repair and angiogenesis
(11,12). It has previously been reported that
leptin is highly expressed in a number of tissues, including
malignant esophageal tumors (13),
pancreatic cancer (14) and rectal
carcinoma (15), and is increased in
the serum of women with various gynecological malignancies,
including ovarian cancer (16).
Leptin has been reported to be involved in regulating the diverse
malignant phenotypes of ovarian cancer by participating in the
hypothalamus pituitary gonadal axis and in multiple signaling
pathways (17,18); however, the mechanisms of
chemoresistance in ovarian cancer remain to be elucidated.
In this study, the Kaplan-Meier (KM) Plotter
database was analyzed and it was identified that the overall
survival rate of patients with epithelial ovarian cancer treated
with platinum plus paclitaxel/docetaxel chemotherapy was increased
in the low leptin expression group compared with the high leptin
expression group. In addition, the effect of leptin on the
chemosensitivity of ovarian cancer cells was demonstrated and the
underlying mechanism was investigated. In conclusion the results of
the present study suggest that leptin may be used as a selection
index or prognostic biomarker for chemoresistance in patients with
ovarian cancer.
Materials and methods
Drugs and protein
Chemotherapeutic drugs (Cisplatin, DDP; Paclitaxel,
PTX; Docetaxel, TXT; Gemcitabine, GCB; Topotecan, TPT; all from
AMQUAR) were dissolved in DMSO (Gibco; Thermo Fisher Scientific,
Inc.) and stored at −80°C. Recombinant Human Leptin (Bio-Techne)
was reconstituted at 1 mg/ml in sterile 20 mM Tris-HCl (pH 8.0) and
stored at −80°C.
Cell culture
Human epithelial ovarian cancer cell lines HO8910PM,
OVCAR8, ES-2, SKOV-3 and IGROV-1 were obtained from the Cell Bank
of the Chinese Academy of Sciences and OV-MZ-15 was stored in the
State Key Laboratory of Oncogenes and Related Genes, Shanghai
Cancer Institute. Cells cultured in RPMI-1640 medium (Beijing
Solarbio Science & Technology Co., Ltd.) containing 10% fetal
bovine serum (FBS; Gibco; Thermo Fisher Scientific, Inc.) and 1%
penicillin-streptomycin (Gibco; Thermo Fisher Scientific, Inc.).
All cells were incubated at 37°C in an atmosphere containing 5%
CO2.
Drug sensitivity test
Briefly, ovarian cancer cells were seeded at
1×10⁴ cells/ml in 96-well plates and cultured for 12 h
in RPMI-1640 medium. Cells were subsequently incubated with Cell
Counting Kit-8 (CCK-8; Dojindo Molecular Technologies, Inc.)
reagents for 1 h and the initial optical density (OD) value (day 0)
was measured at 450 nm using the Infinite M1000 PRO (Tecan Group,
Ltd.). Cells were then treated with increasing concentrations of
the chemotherapeutic drugs DDP, PTX, TXT, GCB and TPT (AMQUAR)
diluted in complete medium and were placed in the incubator for 48
h The OD value was measured again 48 h later (day 2). The OD values
were used to draw an IC50 curve using the GraphPad
Prism5 software (GraphPad Software, Inc.). In further experiments,
differences in the IC50 curve were compared between the
negative control group (pre-incubated with complete medium for 30
min) and the test group (pre-incubated with 40 nM exogenous leptin
recombinant protein for 30 min).
Flow cytometry
To assess the cell cycle, blank cells (termed WT)
were seeded in 6-well plates until they reached 70% confluence and
were divided into six groups; three negative control groups (NC-1,
NC-2 and NC-3) and three test groups (TG-1, TG-2 and TG-3). After
12 h, cells in the NC and TG groups were treated as follows. First,
200 µl RPMI 1640 containing 10% FBS was added to two groups of
cancer cells to serve as control groups and 200 µl 40 nM exogenous
recombinant leptin protein to two other groups to give the test
groups. After pre-incubation for 30 min, 1 ml training solution
(RPMI-1640 medium containing 10% FBS) was added to the NC-1 (WT)
group, 1 ml PTX was added to the NC-2 (WT + PTX) group and 1 ml TXT
was added to the NC-3 (WT + TXT) group. Similarly, 1 ml of culture
without leptin was added to the TG-1 (WT + leptin) group, 1 ml PTX
was added to the TG-2 (WT + leptin + PTX) group and 1 ml TXT was
added to the TG-3 (WT + leptin + TXT) group for 8 or 16 h.
Following treatment, HO8910PM and OV-MZ-15 cells were harvested,
fixed in ethanol for 2 min at room temperature, washed twice with
PBS and stained with PI solution containing PI and RNAse for 30 min
at room temperature in the dark, Cells were subsequently counted
using a flow cytometer (BD FACSCalibur2; BD Biosciences) and
analyzed using FlowJo_V10 software (Becton, Dickinson and
Company).
Chromatin immunoprecipitation
(CH-IP)
The transcription factor CCAAT/enhancer-binding
protein alpha (CEBPA) was predicted by ALGGEN-PROMO (http://alggen.lsi.upc.es/) and JASPAR (http://jaspar.genereg.net) websites. The 3,000 bp
nucleic acid sequence of the leptin upstream promoter region was
obtained from the UCSC database (http://genome.ucsc.edu/) and 10 pairs of primers were
designed (Sangon Biotech Co., Ltd.) for the CH-IP experiment. WT
cells were fixed with 4% formaldehyde for 10 min at room
temperature and chromosomes were extracted using a CH-IP Assay kit
(Thermo Fisher Scientific, Inc.). In the extracted liquid,
immunoglobulin G (Abcam) was added to the NC groups, CEBPA-antibody
(Abcam) was added to the TGs, and RNA polymerase II antibody
(Thermo Fisher Scientific, Inc.) was added as the positive control
group. Purified and enriched DNA- fragments were obtained following
precipitation and cleaned of immune complexes. Ultimately, the DNA
fragments of above cells were analyzed by polymerase chain reaction
(PCR). The procedure used for PCR was as follows: Pre-denaturation
at 95°C for 5 min, denaturation at 95°C for 30 sec, annealing at
60°C for 30 sec, extension at 72°C for 35 cycles, and extension at
72°C for 10 min.
Luciferase reporter assay
A total of 4 luciferase plasmids (Promega
Corporation), leptin primordial plasmid-1/2, leptin mutant
plasmid-1/2 and a CEBPA overexpression plasmid without luciferase
were constructed. At the beginning of the experiment,
CEBPA-overexpressing plasmids were transfected into target cells
using leptin primordial/mutant plasmids and a Roche X-tremeGENE HP
DNA Transfection Reagent kit (Roche Diagnostics GmbH). At 48 h
later, cells were stained using the Dual-Glo Luciferase Assay
System (cat. no. E2920; Promega Corporation) and the fluorescence
intensity was measured using SpectraMax M5 (Molecular Devices LLC).
Firefly luciferase activity was normalized to Renilla luciferase
activity.
Gene set enrichment analysis
(GSEA)
A total of 69 cases of EOC patients treated with PTX
were selected from the U133A Chip dataset from the TCGA database
and were divided into the high expression (23 cases) and low
expression groups (23 cases) according to leptin expression. GSEA
was performed using gsea-3.0, downloaded from the GSEA database
(http://software.broadinstitute.org/gsea/index.jsp)
with the built-in standard datasets.
Other sources of data
The database NCBI (https://www.ncbi.nlm.nih.gov/pubmed/), GENE CARDS
(http://www.genecards.org), CBioPortal (http://www.cbioportal.org) and Oncomine Main
(https://www.oncomine.org/resource/main.html) were used
for basic information acquisition. The Kaplan-Meier estimator
(http://kmplot.com/analysis/index.php?p=service&cancer=ovar)
was used to estimate survival. The website ALGGEN-PROMO (http://alggen.lsi.upc.es) and JASPAR (http://jaspar.genereg.net) were used to predict
transcriptional factors. The database Gene Set Enrichment Analysis
(GSEA; http://software.broadinstitute.org/gsea/index.jsp) was
used to analysis the enrichment gene set.
Statistical analysis
All experiments were repeated three times. Data are
presented as the means ± standard deviation. Statistical analysis
was performed using GraphPad PRISM (version 5.0; GraphPad Software,
Inc.) Differences between groups were assessed using analysis of
variance with the Dunnett's least significant difference post-hoc
tests. α=0.05 and P<0.05 was considered to indicate a
statistically significant difference.
Results
Leptin is associated with a poor
prognosis in patients treated with platinum combined with
PTX/TXT
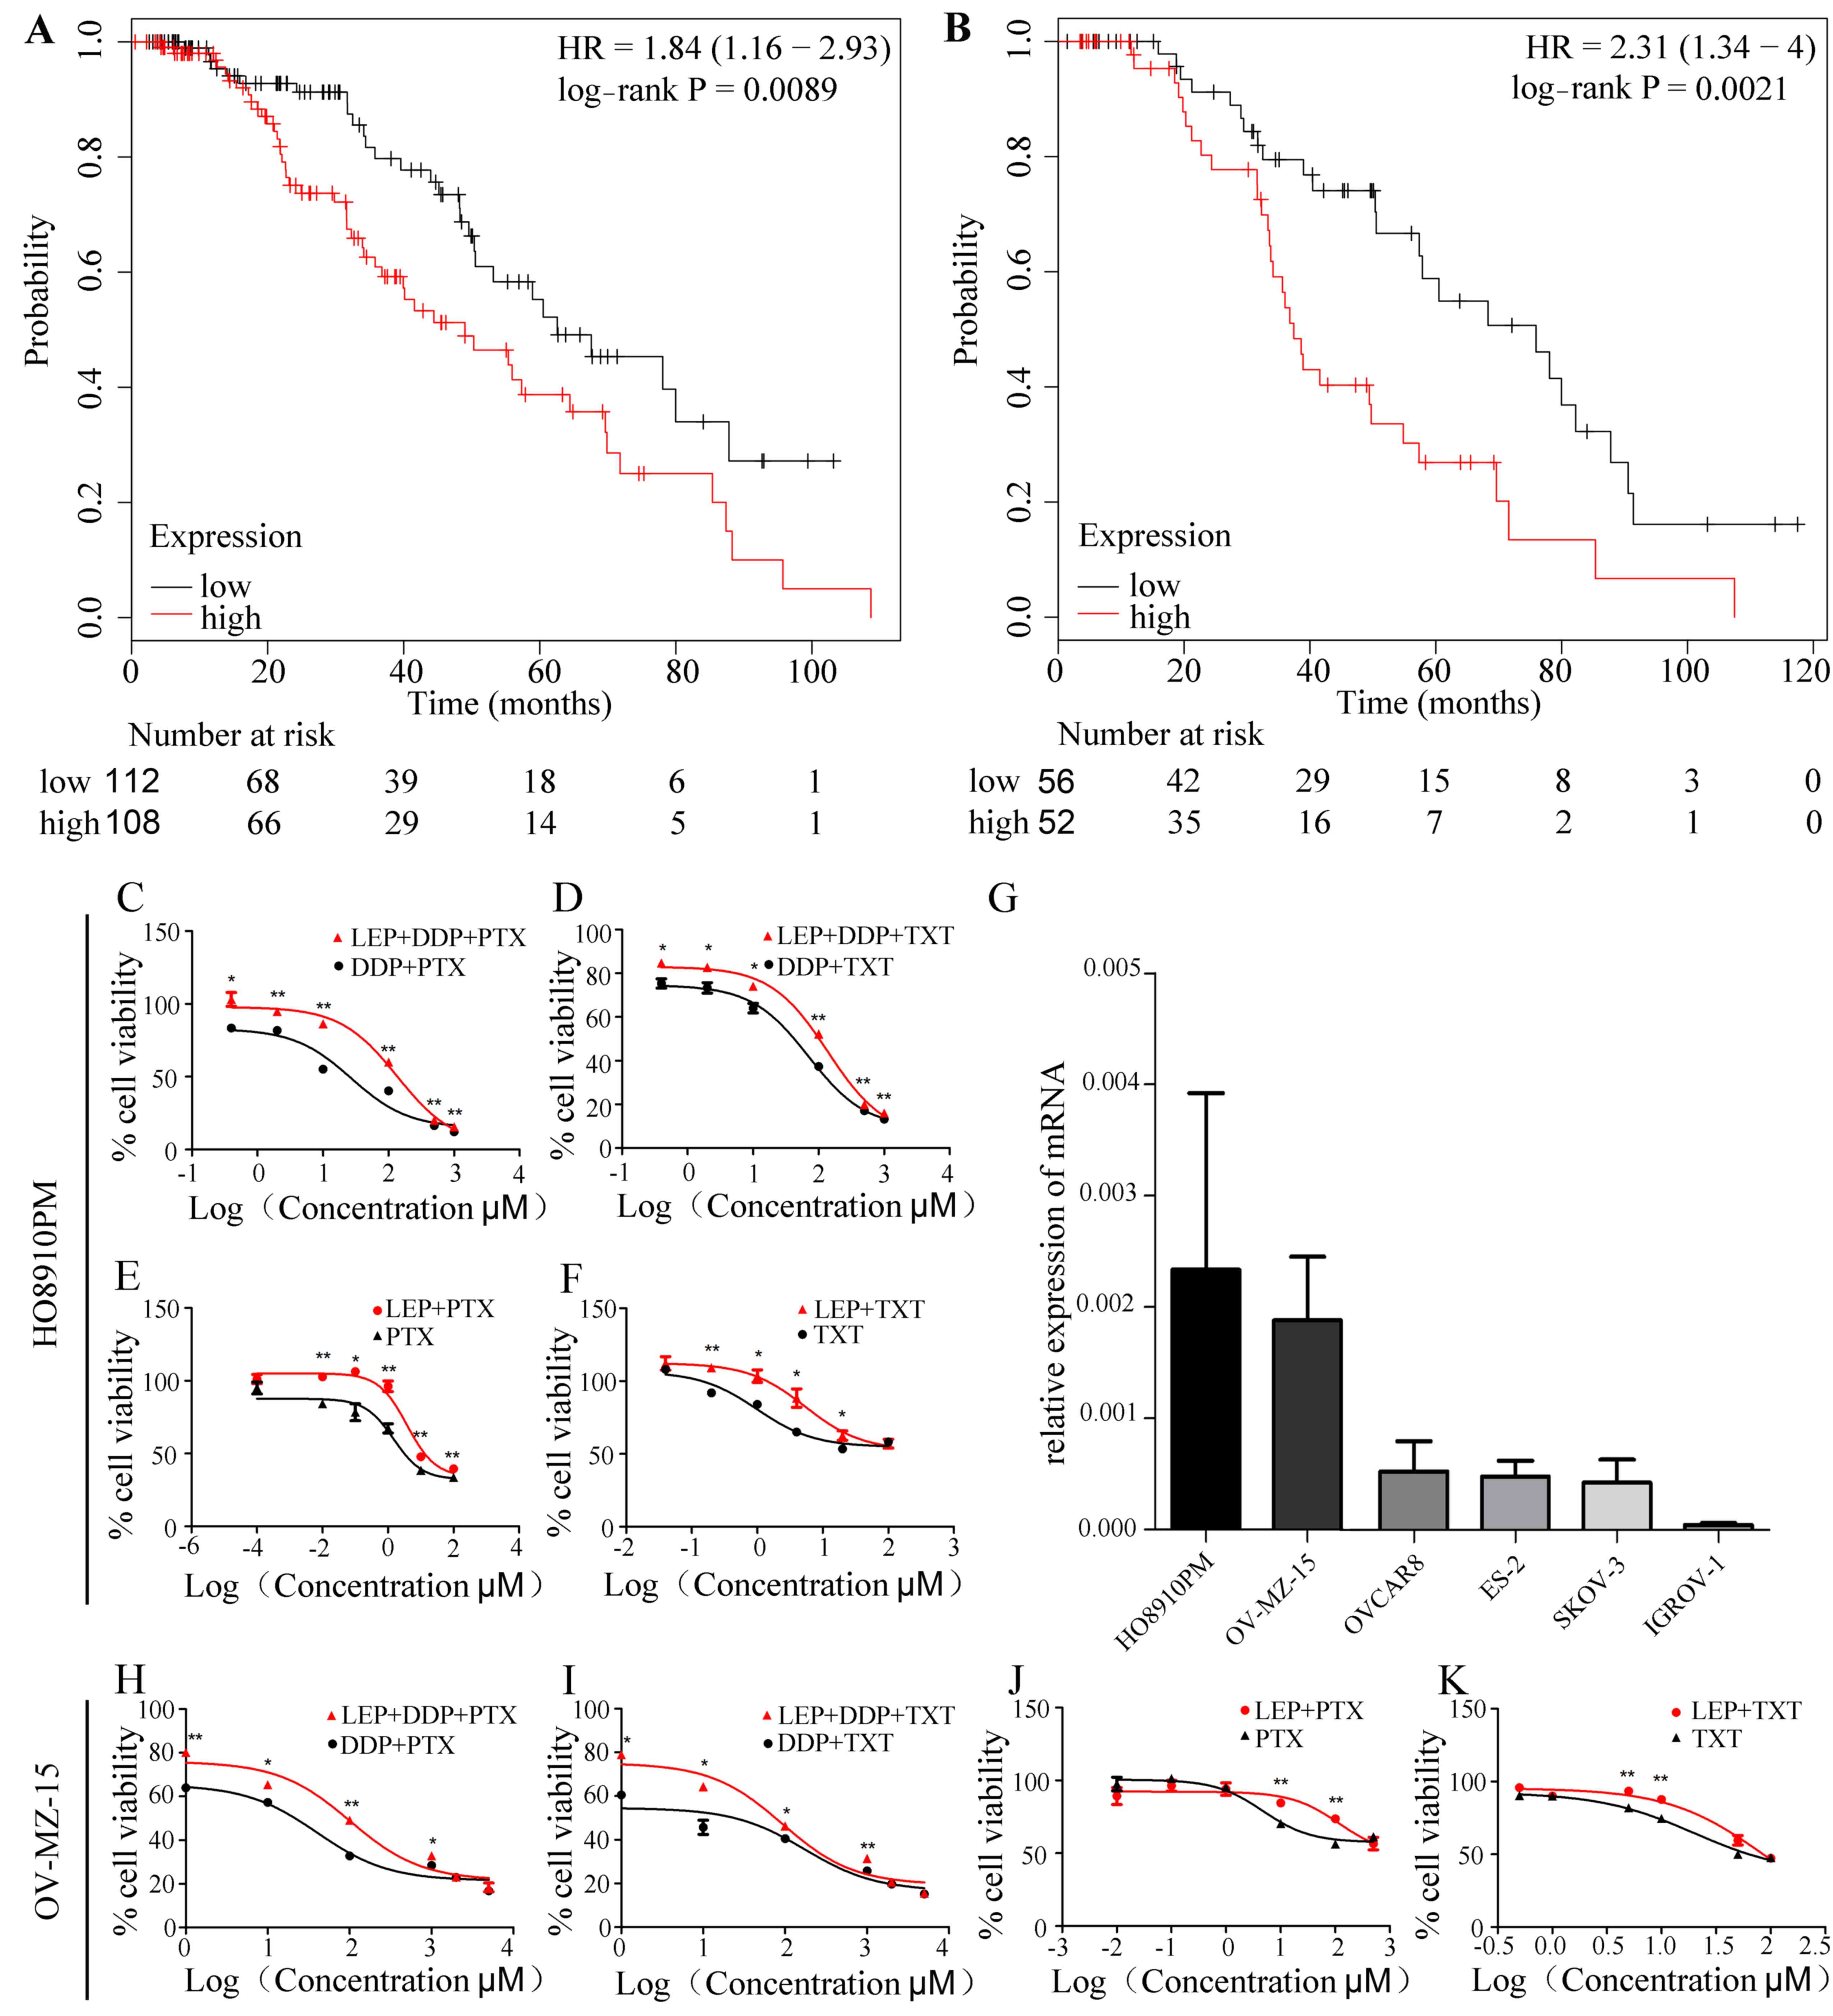
Using the Kaplan-Meier method, the overall survival
rate of 1,656 ovarian cancer patients treated using different
chemotherapy regimens was analyzed, with the median leptin
expression as the boundary. The results indicated that the overall
survival rate was significantly decreased in the leptin high
expression group (n=108) compared with the low expression group
(n=112) in. (n=220; P=0.0089; Fig.
1A and Table I). Similar results
were observed in patients treated with platinum added TXT (n=108;
P=0.0021; Fig. 1B, Table I).
 | Table I.The effect of leptin in epithelial
ovarian cancer overall survival rate under different chemotherapy
regimens. |
Table I.
The effect of leptin in epithelial
ovarian cancer overall survival rate under different chemotherapy
regimens.
| Drugs | N | High expression of
leptin | Low expression of
leptin | Log rank P |
|---|
| Paclitaxel |
220 | 108 | 112 | 0.0089 |
| Docetaxel |
108 | 52 | 56 | 0.0021 |
| Topotecan |
119 | 56 | 63 | 0.98 |
| Gemcitabine |
135 | 66 | 69 | 0.082 |
| Platin | 1,409 | 711 | 698 | 0.58 |
No significant differences in overall survival rate
were observed between the high expression and low expression groups
in patients who received platinum in chemotherapy combined with TPT
or GCB (P=0.98; P=0.082; Table
I).
Leptin increases the chemoresistance
of ovarian cancer cells to PTX/TXT
Primarily, the expression level of leptin was
compared between six ovarian cancer cell lines (HO8910PM, OV-MZ-15,
OVCAR8, ES-2, SKOV-3 and IGROV-1) using RT-qPCR. The results
demonstrated that the expression of leptin was highest in the two
cell lines HO8910PM and OV-MZ-15. In this study, to better simulate
the situation in vivo, these two strains were selected for
in vitro assays (Fig. 1G).
CCK-8 was used to analyze cell viability following treatment with
five different chemotherapeutic drugs and to determine the
determined IC50 values (Table II).
| Table II.The IC50 values and
corresponding concentrations of commonly used chemotherapeutic
agents in ovarian cancer cells. |
Table II.
The IC50 values and
corresponding concentrations of commonly used chemotherapeutic
agents in ovarian cancer cells.
|
| HO8910PM | OV-MZ-15 |
|---|
|
|
|
|
|---|
| Drugs | Concentration
gradient |
IC50 | Unit | Concentration
gradient |
IC50 | Unit |
|---|
| Paclitaxel | 0.001, 0.01, 0.1,
1, 10, 100 |
6.963 | nM | 0.01, 0.1, 1, 10,
100, 500 | 2.315 | nM |
| Docetaxel | 0.04, 0.2, 1, 4,
20, 100 |
2.569 | nM | 0.5, 1, 5, 10, 50,
100 | 3.001 | nM |
| Cisplatin | 0.4, 2, 10, 100,
500, 1000 | 82.66 | uM | 1, 10, 100, 1000,
2000, 5000 | 23.02 | uM |
| Gemcitabine | 1, 2, 4, 10, 20,
40 | 12.882 | nM | 20, 50, 100, 500,
1000, 2000 | 151.2 | nM |
| Topotecan | 0.01, 0.1, 5, 100,
1000, 2000 | 20.62 | uM | 10, 20, 200, 800,
3200, 6400 | 174.0 | nM |
Cells were next treated with exogenous leptin for 30
min followed by DDP+PTX/TXT for 48 h. The data demonstrated that
the survival rate of the two cell lines was significantly increased
in the TG compared with the NC group (P<0.05; Fig. 1C, D, H and I). The results
demonstrated that the addition of leptin reduced the
chemosensitivity of ovarian cancer cells to DDP and PTX/TXT
treatment, which is in agreement with the database analysis.
In order to further investigate which drug is
directly influenced by leptin in combination chemotherapy, the
cells were cultured for 48 h with DDP (TG1) or PTX/TXT alone (TG2
and TG-3) under the same condition used previously. The results
revealed that there were no significant differences in cell
activity in the TG1 groups (leptin + DDP) compared with NC-1
(P>0.05, data not shown). On the contrary cell activity was
significantly increased in TG2 (leptin + PTX) and TG3 (leptin +
TXT) compared with NC-2 and NC-3, respectively (P<0.05; Fig. 1E, F, J and K). These results suggest
that high leptin expression may contribute to the chemoresistance
of ovarian cancer cells treated with PTX/TXT.
Leptin reverses the inhibitory effect
of PTX/TXT on the G2/M phase of ovarian cancer cells
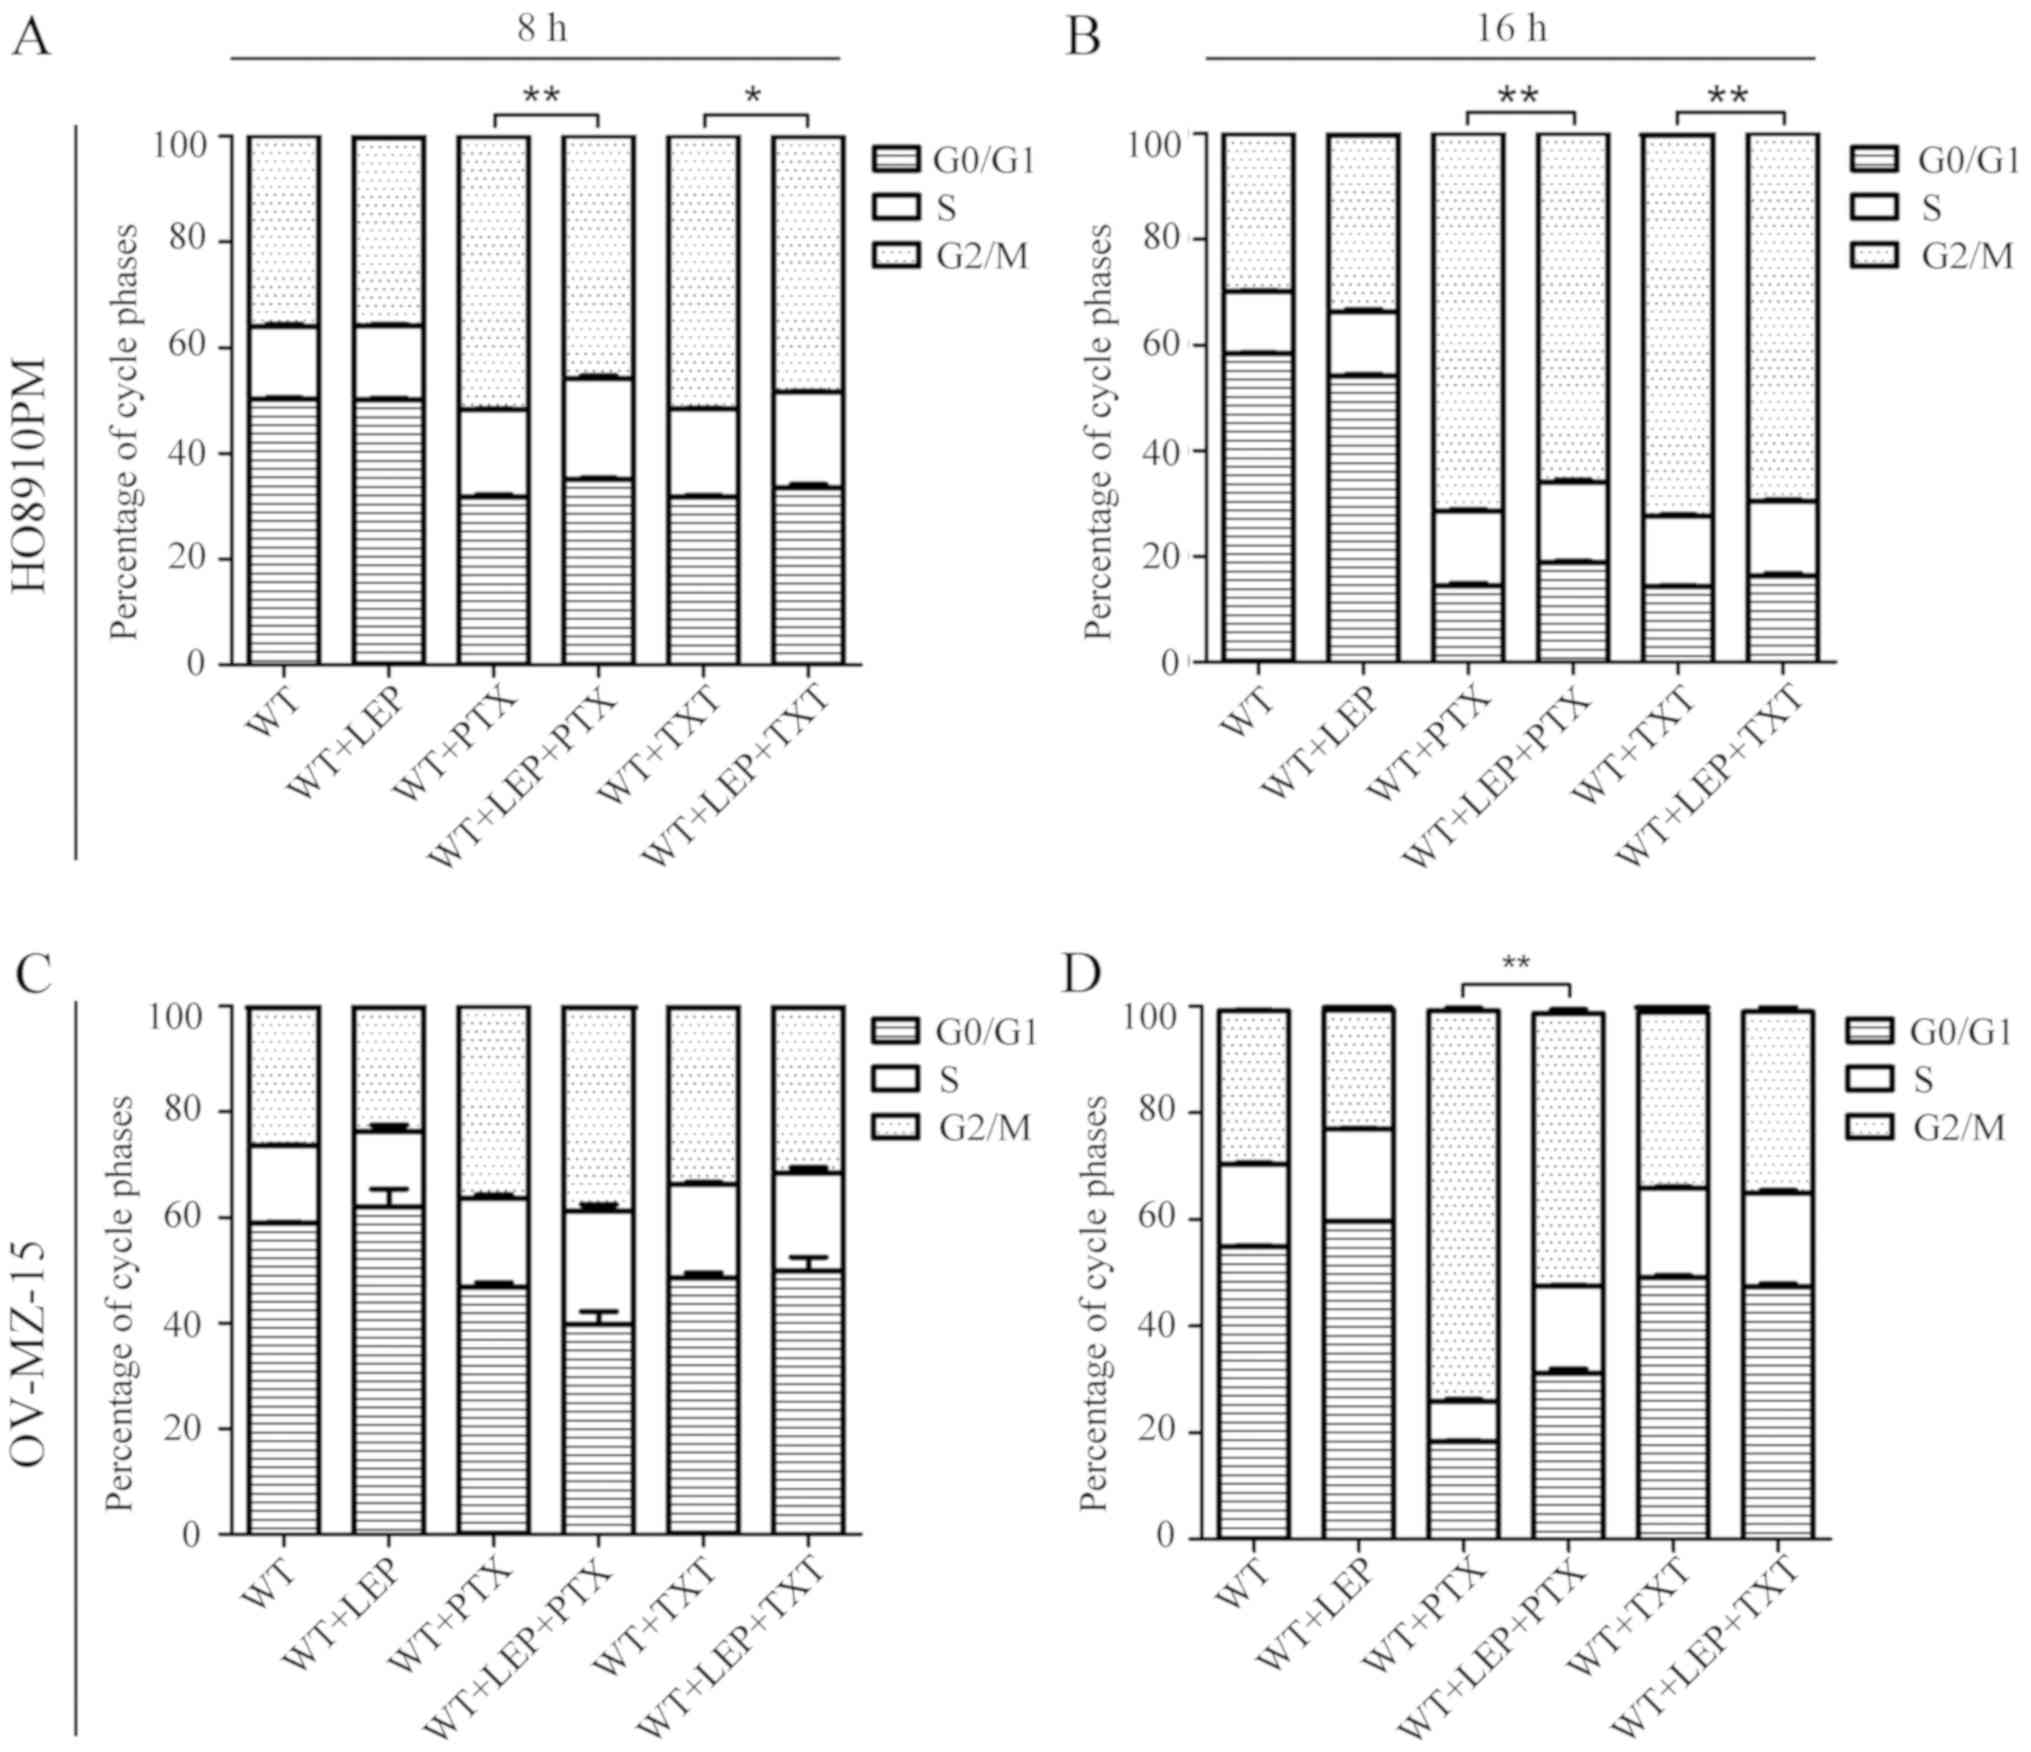
To further investigate the effect of leptin on the
reduction of PTX/TXT sensitivity in ovarian cancer cells, changes
in the cell cycle were measured using a flow cytometer under
several conditions. Compared with NC-1, the proportion of cells in
the G2/M phase was increased significantly in the NC-2 group at 3,
6 and 18 h (P<0.05, Δn >10%; Fig.
2). PTX and TXT were also demonstrated to block cell division
of ovarian cancer cells in G2/M phase. No significant differences
in cell cycle distribution were observed in the NC-1 and TG-1
groups, suggesting that leptin did not directly affect the cell
cycle. As expected, the proportion of cells in G2/M phase was
decreased in TG-2 cells compared with the NC-2 group. Similar
results were also observed when comparing TG-3 and NC-3. In the
present study, leptin clearly reversed the inhibitory effects of
PTX/TXT on the G2/M phase proportion of ovarian cancer cells, which
suggested that it may reduce the sensitivity of ovarian cancer
cells to PDX/TXT treatment.
CEBPA binds the upstream promoter
region of leptin to initiate leptin transcription in ovarian cancer
cells
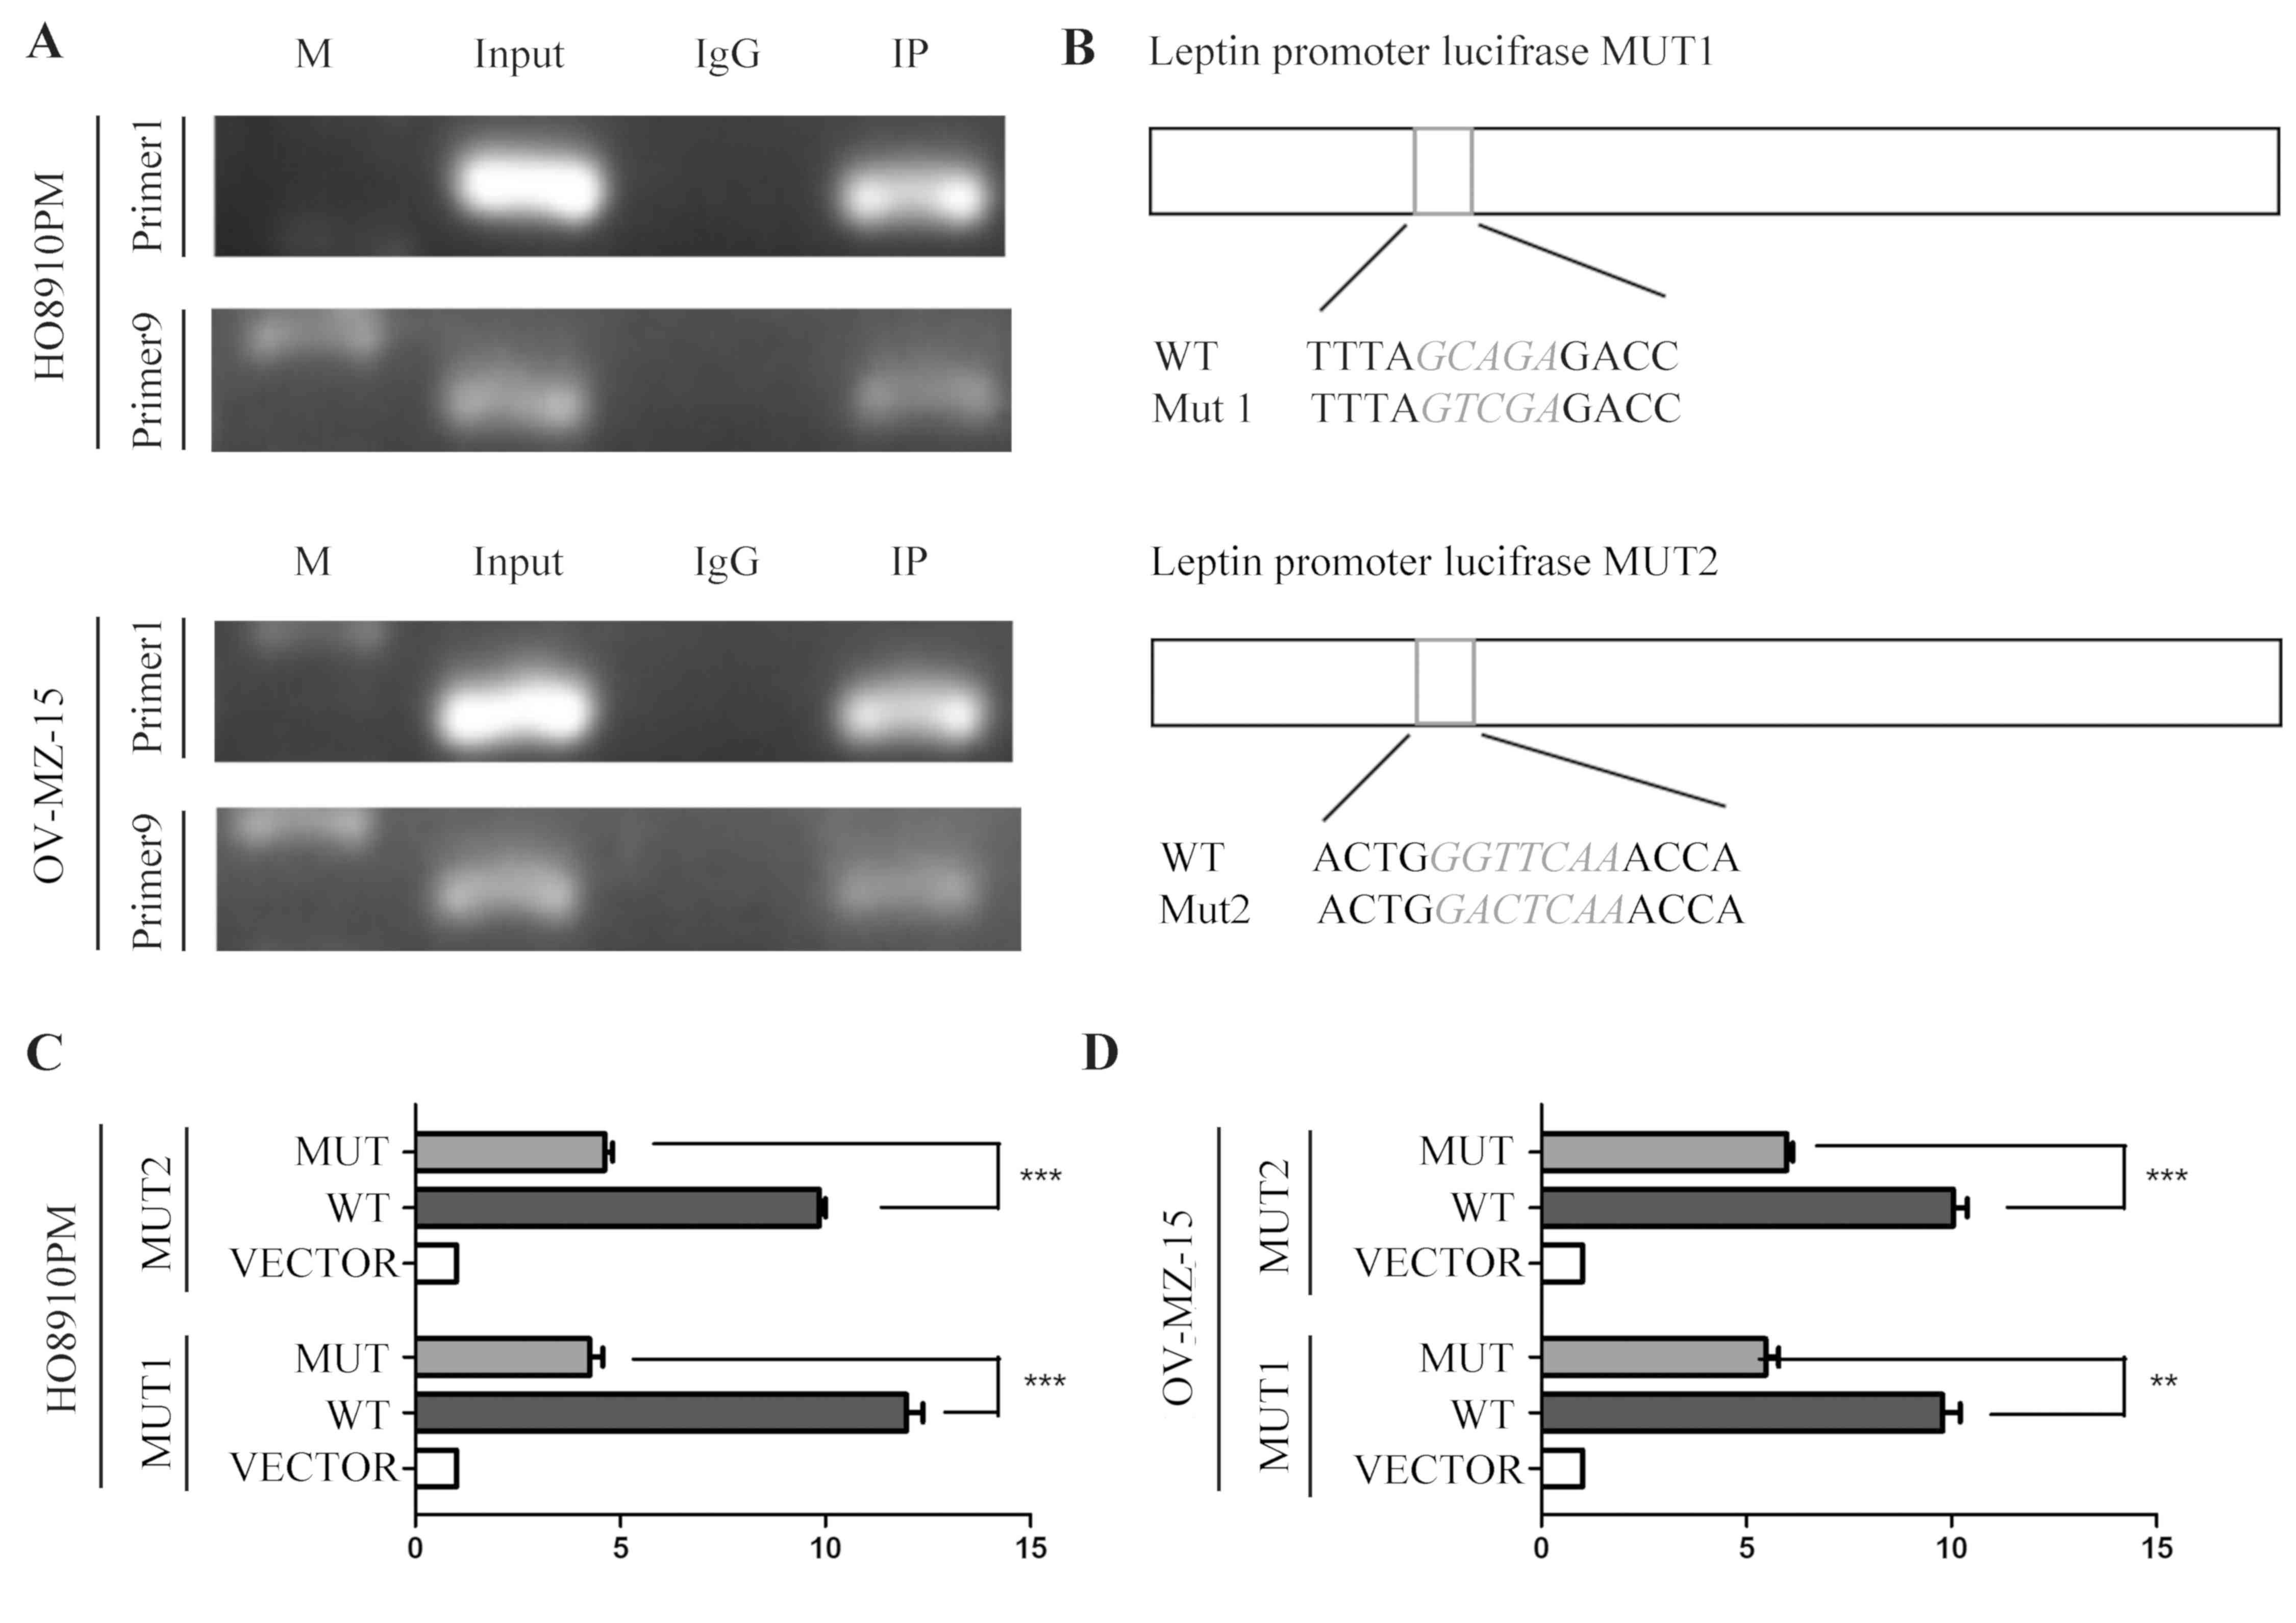
To investigate the potential molecular mechanism of
leptin in the development of epithelial ovarian cancer, potential
leptin transcription factors were first investigated using the
ALGGEN-PROMO and JASPAR websites. The results identified a number
of possible transcription factors, including Jun Proto-Oncogene,
Activating Transcription Factor 2, CCAAT/Enhancer Binding Protein
β, Zinc Finger E-Box Binding Homeobox 1 and CEBPA. CEBPA, a
transcription factor related to fat production, attracted the
attention of the authors of the present study. To verify the
database results, a 0–3,000 bp nucleic acid sequence was searched
for in the leptin upstream promoter region using the gene promoter
analysis database and 10 pairs of primers were designed for a CH-IP
assay (Table III). The CH-IP
results demonstrated that there are at least two sites in the
leptin promoter region to which CEBPA can bind (primer 1 and primer
9, the range from 301 bp to 655 bp and from 2,742 bp to 3,000 bp on
ORF) (Fig. 3A).
| Table III.Additional: Primer sequences in for
chromatin immunoprecipitation. |
Table III.
Additional: Primer sequences in for
chromatin immunoprecipitation.
| Primers | Sequences |
|---|
| Primer 1 |
|
|
Forward |
CTATTTGCTGCCTTGAATTATTCCTCCTC TCC |
|
Reverse |
ATCAACTGCAGGGCAGGGA |
| Primer 2 |
|
|
Forward |
TCCATCAACCTCAGGAACCGAGCTCC |
|
Reverse |
TTCCCAATATCTTGTCTTCCGTTCTTCCC CAGTC |
| Primer 3 |
|
|
Forward |
GACTTGGAGTTTTCTATGACTGGGGAAG AACGGA |
|
Reverse |
ACAAGCCCCCTCTATCACCACTGATAAT
ATGCTTCAG |
| Primer 4 |
|
|
Forward |
ATTTCCAGCATCCACTGAAGCATATTATC AGTG |
|
Reverse |
CTCTATTAGCTACTTGTTACCTGAATAAT
ACACCAAATGTTTGTGC |
| Primer 5 |
|
|
Forward |
CTGTTGCACAAACATTTGGTGTATTATTC
AGGTAACAAG |
|
Reverse |
GAATAGGAGTCAACTTGCCCAAAGTCA AACAG |
| Primer 6 |
|
|
Forward |
TCCTGACTCTGTCATGGACCTGTTTG |
|
Reverse |
CAATGATCCATGCTAAGTATATGTGCATG AGCC |
| Primer 7 |
|
|
Forward |
TGCCATCTCCAGAACCGTCA |
|
Reverse |
GGGCTCCCTGGAAGAAGTGT |
| Primer 8 |
|
|
Forward |
TGTTATGCTCTCTCCCGCCA |
|
Reverse |
GGGCCTTTACCACTTGCTTCC |
| Primer 9 |
|
|
Forward |
TGCTAGTGGGATTCAGGCTCC |
|
Reverse |
CTGTGAGGCCAGGGTGTGA |
| Primer 10 |
|
|
Forward |
TGTCCATTTGATCACACCCTGGC |
|
Reverse |
TTTCCTTCCCAGGATGGGCTTCTT |
In the next experiment, CH-IP results were confirmed
using a luciferase reporter gene assay. Luciferase activity was
detected with or without a fixed-point mutation of leptin following
transfecting the cells with a CEBPA-overexpressing plasmid
(Mut1/Mut2; Fig. 3B). Activity
values were distinctly decreased in the mutant group compared with
the wild-type group (HO8910PM-MUT1, P=0.000114696; HO8910PM-MUT2,
P=2.646E-05; OV-MZ-15-MUT1, P=0.001271496; OV-MZ-15-MUT2,
P=0.000403456; Fig. 3C and D). This
phenomenon suggests that CEBPA-overexpression specifically
increased the expression of leptin at the DNA level. Therefore it
was hypothesized that the transcriptional factor CEBPA positively
regulates the expression of leptin.
High leptin expression leads to
significant enrichment of multiple hallmarks in cancer gene
sets
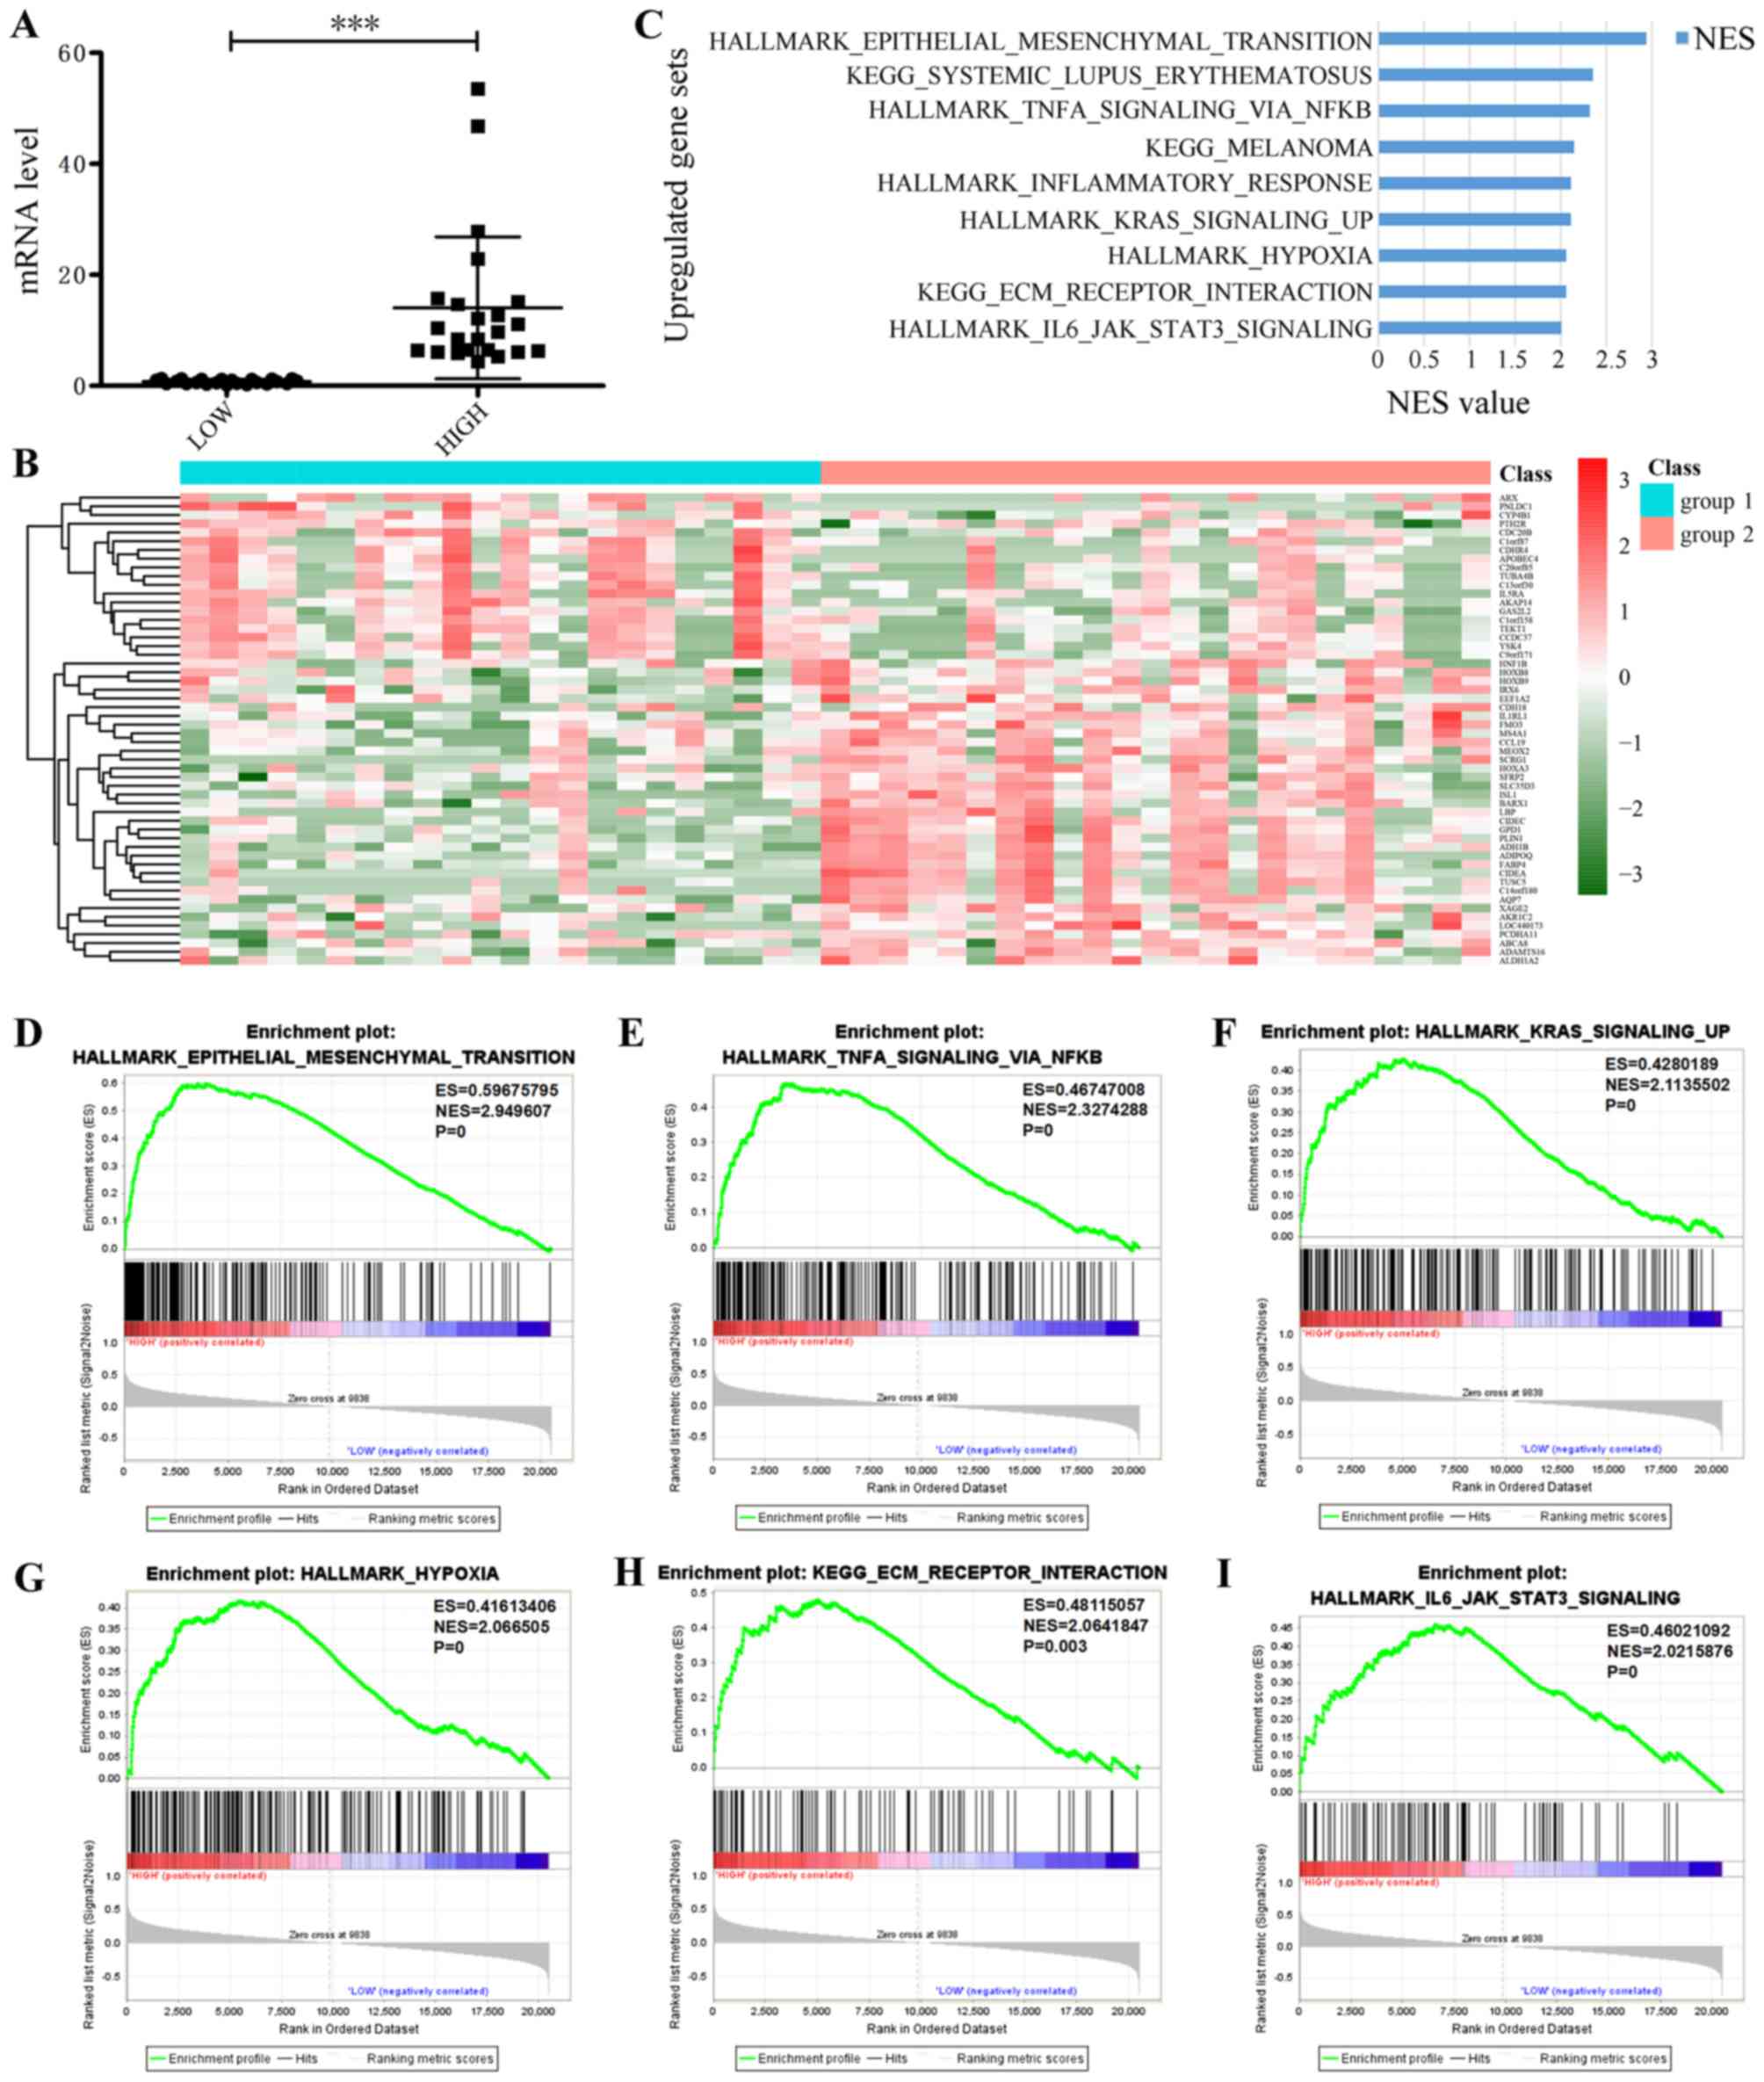
To determine how leptin enhances the
chemotherapeutic resistance of epithelial ovarian cancer to
PTX/TXT, 309 cases from the TCGA database of patients with
epithelial ovarian cancer and complete clinical data were sorted by
leptin expression, and in-depth analyses of 69 patients undergoing
platinum-combined PTX chemotherapy regimens was conducted. These
patients were arranged by leptin expression, from high to low: The
33% of cases with the lowest expression were termed the low
expression group and the highest 33% of cases were termed the high
expression group (P<0.001; Fig.
4A). A heatmap revealed that when leptin expression is
increased, 20 genes are downregulated and 35 are upregulated
(Fig. 4B). The following GSEA
analysis demonstrated a clear enrichment in tumor marker genes and
KEGG gene set in the high expression group (Fig. 4C; Table
IV), including the hallmark Epithelial-to-Mesenchymal
transition (EMT; Fig. 4D),
TNFα-signaling-, via NFκB (Fig. 4E),
Kras-signaling-up (Fig. 4F),
HALLMARK_HYPOXIA (Fig. 4G),
KEGG-ECM-RECEPTOR-INTERACTION (Fig.
4H) and HALLMARK- IL6-JAK-STAT3-SIGNALING (Fig. 4I). Among these, the highest scoring
gene set was EMT, which serves an important role in phenotypic
change during normal cell canceration and leads to chemotherapy
resistance in cancer cells.
| Table IV.Enrichment gene sets in the high
leptin expression group. |
Table IV.
Enrichment gene sets in the high
leptin expression group.
| Gene set | NES | q-value | P-value |
|---|
|
HALLMARK_EPITHELIAL_MESENCHYMAL_TRANSITION | 2.950 | 0 | 0 |
|
KEGG_SYSTEMIC_LUPUS_ERYTHEMATOSUS | 2.355 | 0 | 0 |
|
HALLMARK_TNFA_SIGNALING_VIA_NFKB | 2.327 | 0 | 0 |
| KEGG_MELANOMA | 2.158 | 0 | 0 |
|
HALLMARK_INFLAMMATORY_RESPONSE | 2.118 | 0 | 0 |
|
HALLMARK_KRAS_SIGNALING_UP | 2.114 | 0 | 0 |
|
HALLMARK_HYPOXIA | 2.067 | 0 | 0 |
|
KEGG_ECM_RECEPTOR_INTERACTION | 2.064 | 0.002 | 0.003 |
|
HALLMARK_IL6_JAK_STAT3_SIGNALING | 2.022 | 0 | 0 |
|
HALLMARK_ALLOGRAFT_REJECTION | 1.998 | 0 | 0 |
|
HALLMARK_IL2_STAT5_SIGNALING | 1.921 | 0.000 | 0.001 |
|
KEGG_CYTOKINE_CYTOKINE_RECEPTOR_INTERACTION | 1.913 | 0.013 | 0.031 |
|
HALLMARK_PANCREAS_β_CELLS | 1.904 | 0.000 | 0.004 |
|
KEGG_REGULATION_OF_ACTIN_CYTOSKELETON | 1.896 | 0.014 | 0.042 |
|
HALLMARK_APICAL_JUNCTION | 1.896 | 0.001 | 0.005 |
|
HALLMARK_ANGIOGENESIS | 1.858 | 0.001 | 0.006 |
|
HALLMARK_CHOLESTEROL_HOMEOSTASIS | 1.828 | 0.001 | 0.007 |
|
HALLMARK_MYOGENESIS | 1.823 | 0.001 | 0.007 |
|
HALLMARK_ADIPOGENESIS | 1.754 | 0.001 | 0.012 |
|
HALLMARK_GLYCOLYSIS | 1.753 | 0.001 | 0.012 |
|
HALLMARK_MTORC1_SIGNALING | 1.751 | 0.001 | 0.012 |
|
HALLMARK_TGF_β_SIGNALING | 1.742 | 0.002 | 0.015 |
|
HALLMARK_UV_RESPONSE_DN | 1.716 | 0.002 | 0.022 |
|
HALLMARK_P53_PATHWAY | 1.664 | 0.004 | 0.038 |
|
HALLMARK_XENOBIOTIC_METABOLISM | 1.628 | 0.004 | 0.047 |
|
HALLMARK_APOPTOSIS | 1.624 | 0.004 | 0.047 |
Discussion
Drug resistance has been persistent in the treatment
of human diseases for a number of years and is primarily
responsible for antineoplastic drugs failing to kill tumor cells
during cancer treatment (19).
Ovarian cancer has one of the highest mortality rates among
malignancies due to its typically late diagnosis, high recurrence
rate and chemotherapeutic resistance (20). Therefore, chemosensitivity and drug
resistance analyses are essential for selecting appropriate
chemotherapeutic regimens and in survival assessments for patients
with epithelial ovarian cancer (21).
There are multiple reasons why chemotherapeutic
resistance in ovarian cancer is not yet well understood, as well as
chemoresistance: i) The existence of multidrug resistance efflux
pumps that accelerate drug metabolism (22); ii) changes in cell surface
receptors/carriers that result in decreased drug influx (23); iii) drug-mediated DNA repair that
enhances the antagonism of most chemotherapeutic drugs (24); and iv) lipid metabolism-related genes
that are involved in the EMT of cancer cells and mediate a
reduction in drug sensitivity (25).
Cuello et al (26) analyzed 83 consensus driver genes and
143 lipid metabolism-associated genes in 681 patients with
high-grade serous ovarian cancer, obtained from the ICGC database,
using gene chip and reverse protein chip clustering analyses. This
study demonstrated that certain genes associated with obesity and
lipid metabolism disorder may have significant effects on the
prognosis of patients with ovarian cancer. It was also reported
that at the same clinical stage of ovarian cancer, compared with
non-obese patients, the clinical prognosis of obese patients is
considerably poorer.
Leptin is a secretory protein that is synthesized
mainly in white adipocytes. In addition to controlling the energy
metabolism and weight balance of an organism, leptin has multiple
endocrine functions and participates not only in the regulation of
immune and inflammatory responses, hematopoiesis, angiogenesis,
reproduction, bone formation and wound healing, but also in cancer
development through regulating diverse malignant phenotypes in
cancer cells (10–16). Previous studies have reported that
the high expression of leptin and its receptor impacts the
proliferation, migration and invasion of ovarian cancer cells by
activating the JAK/STAT, MAPK, PI3K/AKT and RhoA/ROCK signaling
pathways (27,28).
Based on the KM Plotter database, it was confirmed
that the overall survival rate of patients with high leptin
expression was decreased compared with patients with low leptin
expression, following treatment with platinum plus PTX/TXT. These
results are consistent with previous reports by Cuello et al
(26). However, similar results were
not recorded for cases of DDP combined with GCB or TPT, for which
the present study hypothesized that other mechanisms underlie the
activity of chemotherapeutics.
DDP is known to directly damage DNA structure and
affect its function. GCB is a cell cycle-specific drug that acts
primarily in the S phase and prevents cells entering the S phase
from G1. Additionally, TPT can hinder the re-linking of single
strands of broken DNA and cause damage to double-stranded DNA.
However, the mechanism by which PTX/TXT kills tumor cells relies on
block cell division in the G2/M phase through the inhibition of
microtubule depolymerization. CCK-8 assays demonstrated that the
addition of an exogenous recombinant leptin protein decreased the
cytotoxicity of PTX/TXT towards ovarian cancer cells. Furthermore,
flow cytometry demonstrated that the addition of leptin to cells
treated with PTX/TXT significantly reduced the proportion in the
G2/M phase. Therefore, it was hypothesized that high levels of
leptin may reduce the sensitivity of ovarian cancer cells to
PTX/TXT treatment via blocking the effect exerted by PTX/TXT on
microtubules. Leptin expression levels may be a good predictor of
chemoresistance when guiding treatment and/or evaluating prognosis
in patients with ovarian cancer receiving platinum plus PTX/TXT
chemotherapy.
The mechanism of chemotherapeutic resistance in
ovarian cancer is very complex. To investigate potential mechanisms
by which high leptin expression reduces ovarian cancer cell
sensitivity to PTX/TXT treatment, 69 cases were identified in which
patients with ovarian cancer underwent PTX chemotherapy and
analyzed leptin mRNA expression data using GSEA analysis. It was
demonstrated that 26 gene sets were significantly enriched in the
high leptin expression group. Among the enriched sets, the highest
scoring was the EMT gene set. EMT is a biological process in which
polarized epithelial cells transform into mesenchymal cells. This
process is not only common in cancer initiating cells, which
enhances their invasive and migratory abilities, but is also
closely associated multiple drug resistance in human tumors
(29–31). Therefore, it was hypothesized that
high leptin expression may also lead to PTX resistance through the
activation of EMT in ovarian cancer cells. The authors are
interested in investigating their correlations and the underlying
mechanisms in their future work.
In addition, using the ALGGEN and JASPAR websites,
it was predicted that CEBPA may be a transcription factor for
leptin. CHIP and luciferase reporter assays confirmed that CEBPA
can bind the upstream promoter region of leptin to initiate gene
transcription. CEBPA is a CCAAT protein binding enhancer that acts
as a transcription factor and regulates the expression of genes
associated with the tumor cell cycle and homeostasis. It was
previously reported that CEBPA may be a lipid-generating gene and
that its expression increases synchronously with that of leptin
patients with ovarian cancer, therefore impacting on their
prognosis (32,33).
In conclusion, the present study demonstrated that
the transcription factor CEBPA activates leptin gene transcription
by binding to its upstream promoter region. High levels of leptin
may reduce the cytotoxic effect of PTX/TXT in ovarian cancer cells
by activating EMT. Therefore, leptin has potential as a
chemotherapeutic resistance predictor and/or as a novel therapeutic
target in patients with epithelial ovarian cancer undergoing
platinum plus PTX/TXT chemotherapy.
Acknowledgments
The authors would like to thank Dr Qin Yang, Dr
Li-Peng Hu and Dr Miao Dai (Shanghai Cancer Institute, Renji
Hospital, Shanghai Jiao Tong University School of Medicine) for
their technical and material support.
Funding
The present study was supported by the National
Natural Science Foundation of China (grant nos. 81472445 and
81672587 to RZ), the Scientific and Technological Innovation Act
Program of Shanghai Science and Technology Commission (grant no.
14411973100 to RZ), the Scientific and Technological Innovation Act
Program of Fengxian Science and Technology Commission (grant no.
20160908 to HL), and the National Natural Science Foundation of
China (grant no. 81571401 to LQY).
Availability of data and materials
The datasets used and/or analyzed during the current
study are available from the corresponding author on reasonable
request.
Authors' contributions
FG performed all the experiments and was a major
contributor in writing the manuscript. HZ analyzed the prediction.
LY, SJ, HL, XX and CZ participated in the design of the experiments
and the revision of the manuscript. RZ contibuted the most to the
study design, and PJ participated in the design and guidance of the
project. All authors read and approved the final manuscript.
Ethics approval and consent to
participate
Not applicable
Patient consent for publication
Not applicable.
Competing interests
The authors declare that they have no competing
interests.
References
|
1
|
Torre LA, Bray F, Siegel RL, Ferlay J,
Lortet-Tieulent J and Jemal A: Global cancer statistics, 2012. CA
Cancer J Clin. 65:87–108. 2015. View Article : Google Scholar : PubMed/NCBI
|
|
2
|
Leung CS, Yeung TL, Yip KP, Wong KK, Ho
SY, Mangala LS, Sood AK, Lopez-Berestein G, Sheng J, Wong ST, et
al: Cancer-associated fibroblasts regulate endothelial adhesion
protein LPP to promote ovarian cancer chemoresistance. J Clin
Invest. 128:589–606. 2018. View
Article : Google Scholar : PubMed/NCBI
|
|
3
|
Siegel RL, Miller KD and Jemal A: Cancer
statistics, 2016. CA Cancer J Clin. 66:7–30. 2016. View Article : Google Scholar : PubMed/NCBI
|
|
4
|
Dasari S and Tchounwou PB: Cisplatin in
cancer therapy: Molecular mechanisms of action. Eur J Pharmacol.
740:364–378. 2014. View Article : Google Scholar : PubMed/NCBI
|
|
5
|
Batista ML Jr, Olivan M, Alcantara PS,
Sandoval R, Peres SB, Neves RX, Silverio R, Maximiano LF, Otoch JP
and Seelaender M: Adipose tissue-derived factors as potential
biomarkers in cachectic cancer patients. Cytokine. 61:532–539.
2013. View Article : Google Scholar : PubMed/NCBI
|
|
6
|
Andò S, Barone I, Giordano C, Bonofiglio D
and Catalano S: The multifaceted mechanism of leptin signaling
within tumor microenvironment in driving breast cancer growth and
progression. Front Oncol. 4:3402014.PubMed/NCBI
|
|
7
|
Chang CC, Wu MJ, Yang JY, Camarillo IG and
Chang CJ: Leptin-STAT3-G9a signaling promotes obesity-mediated
breast cancer progression. Cancer Res. 75:2375–2386. 2015.
View Article : Google Scholar : PubMed/NCBI
|
|
8
|
Visintin I, Feng Z, Longton G, Ward DC,
Alvero AB, Lai Y, Tenthorey J, Leiser A, Flores-Saaib R, Yu H, et
al: Diagnostic markers for early detection of ovarian cancer. Clin
Cancer Res. 14:1065–1072. 2008. View Article : Google Scholar : PubMed/NCBI
|
|
9
|
Serin IS, Tanriverdi F, Yilmaz MO, Ozcelik
B and Unluhizarci K: Serum insulin-like growth factor (IGF)-I, IGF
binding protein (IGFBP)-3, leptin concentrations and insulin
resistance in benign and malignant epithelial ovarian tumors in
postmenopausal women. Gynecol Endocrinol. 24:117–121. 2008.
View Article : Google Scholar : PubMed/NCBI
|
|
10
|
La Cava A and Matarese G: The weight of
leptin in immunity. Nat Rev Immunol. 4:371–379. 2004. View Article : Google Scholar : PubMed/NCBI
|
|
11
|
Zhou W, Guo S and Gonzalez-Perez RR:
Leptin pro-angiogenic signature in breast cancer is linked to IL-1
signalling. Br J Cancer. 104:128–137. 2011. View Article : Google Scholar : PubMed/NCBI
|
|
12
|
Vernooy JHJ, Ubags ND, Brusselle GG,
Tavernier J, Suratt BT, Joos GF, Wouters EF and Bracke KR: Leptin
as regulator of pulmonary immune responses: Involvement in
respiratory diseases. Pulm Pharmacol Ther. 26:464–472. 2013.
View Article : Google Scholar : PubMed/NCBI
|
|
13
|
Geng Y, Wang J, Wang R, Wang K, Xu Y, Song
G, Wu C and Yin Y: Leptin and HER-2 are associated with gastric
cancer progression and prognosis of patients. Biomed Pharmacother.
66:419–424. 2012. View Article : Google Scholar : PubMed/NCBI
|
|
14
|
Harbuzariu A, Rampoldi A, Daley-Brown DS,
Candelaria P, Harmon TL, Lipsey CC, Beech DJ, Quarshie A, Ilies GO
and Gonzalez-Perez RR: Leptin-Notch signaling axis is involved in
pancreatic cancer progression. Oncotarget. 8:7740–7752. 2017.
View Article : Google Scholar : PubMed/NCBI
|
|
15
|
Beales ILP, Garcia-Morales C, Ogunwobi OO
and Mutungi G: Adiponectin inhibits leptin-induced oncogenic
signalling in oesophageal cancer cells by activation of PTP1B. Mol
Cell Endocrinol. 382:150–158. 2014. View Article : Google Scholar : PubMed/NCBI
|
|
16
|
Jin JH, Kim HJ, Kim CY, Kim YH, Ju W and
Kim SC: Association of plasma adiponectin and leptin levels with
the development and progression of ovarian cancer. Obstet Gynecol
Sci. 59:279–285. 2016. View Article : Google Scholar : PubMed/NCBI
|
|
17
|
Housa D, Housová J, Vernerová Z and
Haluzík M: Adipocytokines and cancer. Physiol Res. 55:233–244.
2006.PubMed/NCBI
|
|
18
|
Trisolini C, Albrizio M, Roscino MT,
Pantaleo M, Rizzo A and Sciorsci RL: Leptin and queen ovary: New
insights about ovulation. Res Vet Sci. 94:707–710. 2013. View Article : Google Scholar : PubMed/NCBI
|
|
19
|
Yu Y, Gaillard S, Phillip JM, Huang TC,
Pinto SM, Tessarollo NG, Zhang Z, Pandey A, Wirtz D, Ayhan A, et
al: Inhibition of spleen tyrosine kinase potentiates
paclitaxel-induced cytotoxicity in ovarian cancer cells by
stabilizing microtubules. Cancer Cell. 28:82–96. 2015. View Article : Google Scholar : PubMed/NCBI
|
|
20
|
Khan IU, Khan RU, Asif H, Alamgeer, Khalid
SH, Asghar S, Saleem M, Shah KU, Shah SU, Rizvi SAA and Shahzad Y:
Co-delivery strategies to overcome multidrug resistance in ovarian
cancer. Int J Pharm. 533:111–124. 2017. View Article : Google Scholar : PubMed/NCBI
|
|
21
|
Monk BJ, Herzog TJ and Tewari KS:
Evolution of chemosensitivity and resistance assays as predictors
of clinical outcomes in epithelial ovarian cancer patients. Curr
Pharm Des. 22:4717–4728. 2016. View Article : Google Scholar : PubMed/NCBI
|
|
22
|
Fletcher JI, Haber M, Henderson MJ and
Norris MD: ABC transporters in cancer: More than just drug efflux
pumps. Nat Rev Cancer. 10:147–156. 2010. View Article : Google Scholar : PubMed/NCBI
|
|
23
|
Iyer AK, Singh A, Ganta S and Amiji MM:
Role of integrated cancer nanomedicine in overcoming drug
resistance. Adv Drug Deliver Rev. 65:1784–1802. 2013. View Article : Google Scholar
|
|
24
|
Jabr-Milane LS, van Vlerken LE, Yadav S
and Amiji MM: Multi-functional nanocarriers to overcome tumor drug
resistance. Cancer Treat Rev. 34:592–602. 2008. View Article : Google Scholar : PubMed/NCBI
|
|
25
|
Mahmood K, Zia KM, Zuber M, Salman M and
Anjum MN: Recent developments in curcumin and curcumin based
polymeric materials for biomedical applications: A review. Int J
Biol Macromol. 81:877–890. 2015. View Article : Google Scholar : PubMed/NCBI
|
|
26
|
Cuello MA, Kato S and Liberona F: The
impact on high-grade serous ovarian cancer of obesity and lipid
metabolism-related gene expression patterns: The underestimated
driving force affecting prognosis. J Cell Mol Med. 22:1805–1815.
2018. View Article : Google Scholar : PubMed/NCBI
|
|
27
|
Otero M, Lago R, Lago F, Reino JJ and
Gualillo O: Signalling pathway involved in nitric oxide synthase
type II activation in chondrocytes: Synergistic effect of leptin
with interleukin-1. Arthritis Res Ther. 7:R581–R591. 2005.
View Article : Google Scholar : PubMed/NCBI
|
|
28
|
Vuolteenaho K, Koskinen A, Kukkonen M,
Nieminen R, Päivärinta U, Moilanen T and Moilanen E: Leptin
enhances synthesis of proinflammatory mediators in human
osteoarthritic cartilage-mediator role of NO in leptin-induced
PGE2, IL-6, and IL-8 production. Mediators Inflamm.
2009:3458382009. View Article : Google Scholar : PubMed/NCBI
|
|
29
|
Liang SQ, Marti TM, Dorn P, Froment L,
Hall SR, Berezowska S, Kocher G, Schmid RA and Peng RW: Blocking
the epithelial-to-mesenchymal transition pathway abrogates
resistance to anti-folate chemotherapy in lung cancer. Cell Death
Dis. 6:e18242015. View Article : Google Scholar : PubMed/NCBI
|
|
30
|
Mitra A, Mishra L and Li S: EMT, CTCs and
CSCs in tumor relapse and drug-resistance. Oncotarget.
6:10697–10711. 2015. View Article : Google Scholar : PubMed/NCBI
|
|
31
|
Sánchez-Tilló E, Fanlo L, Siles L,
Montes-Moreno S, Moros A, Chiva-Blanch G, Estruch R, Martinez A,
Colomer D, Győrffy B, et al: The EMT activator ZEB1 promotes tumor
growth and determines differential response to chemotherapy in
mantle cell lymphoma. Cell Death Differ. 21:247–257. 2014.
View Article : Google Scholar : PubMed/NCBI
|
|
32
|
Kim E, Lim S, Kim M, Yoo S and Kim Y:
Phyllodulcin, a natural sweetener, regulates obesity-related
metabolic changes and fat browning-related genes of subcutaneous
white adipose tissue in high-fat diet-induced obese mice.
Nutrients. 9(pii): E10492017. View Article : Google Scholar : PubMed/NCBI
|
|
33
|
Konopka B, Szafron LM, Kwiatkowska E,
Podgorska A, Zolocinska A, Pienkowska-Grela B, Dansonka-Mieszkowska
A, Balcerak A, Lukasik M, Stachurska A, et al: The significance of
c.690G>T polymorphism (rs34529039) and expression of the CEBPA
gene in ovarian cancer outcome. Oncotarget. 7:67412–67424. 2016.
View Article : Google Scholar : PubMed/NCBI
|