Introduction
Breast cancer is the most commonly diagnosed cancer
in women and the leading cause of cancer-associated mortality
worldwide. In 2018, ~41,400 patients succumbed to this malignancy
in the United States. Estimations highlight that ~268,670 new cases
may be diagnosed every year (1).
Triple-negative breast cancer (TNBC) represents 10–20% of all
breast cancer cases and is defined by a lack of estrogen receptor
(ER) and progesterone receptors (PR) expression and the absence of
amplification or overexpression of human epidermal growth factor
receptor 2 (HER2) (2). In addition,
TNBC is associated with a higher risk of distant and early
recurrence and more aggressive metastases in the viscera and
central nervous system, particularly in the lungs and brain
(3). Due to the lack of specific
targeted therapies in TNBC, endocrine or anti-HER2 therapies
display no benefits, and chemotherapy is the only established
therapeutic option available in clinical practice (3–6). It is
therefore crucial to identify and develop specific molecular
targets for the development of effective treatment of TNBC.
With the development of genomic technologies, a
large volume of molecular information including Gene Expression
Omnibus (GEO) and The Cancer Genome Atlas (TCGA), represent a
remarkable opportunity to analyze the gene expression data for the
discovery of novel targets (7).
Furthermore, co-expression analysis has emerged as a powerful
technique for multigene analysis in large-scale data. Gene
co-expression analysis is used to associate genes of unknown
function with biological processes, in order to prioritize
candidate disease genes or to differentiate transcriptional
regulatory programs (8). In
comparison with the traditional one-dimensional molecular biology
methods, the weighted correlation network analysis (WGCNA) is a
method that can highlight the modules of highly correlated genes
and describe the characteristics of the biological system more
accurately and effectively (9,10). This
method has been successfully used to identify targeted modules and
hub genes in cancer research. For example, Chen et al
(11) and Wan et al (12) identified novel biomarkers for human
clear renal cell carcinoma and uveal melanoma, respectively, via
WGCNA. In addition, Clarke et al (13) used WGCNA to analyze a breast cancer
dataset and identified certain modules associated with different
molecular subtypes. In the present study, WGCNA has highlighted
numerous biologically significant results in cancer study, and to
the best of our knowledge, it was applied for the first time to the
study of TNBC. WGCNA represents an R package for weighted
correlation network analysis, including network construction,
module detection, gene selection, topological property calculation
and visualization (14). In the
present study, WGCNA was used to construct a TNBC gene
co-expression network. Firstly, the initial phase of the WGCNA
method allowed identification of co-expression modules. Secondly, a
survival analysis for modules identified in the first step was
performed. Thirdly, a functional enrichment analysis was achieved
on the modules of interest. The identified hub genes may therefore
be beneficial to assess the malignancy and prognosis of TNBC.
Materials and methods
Search strategy
In the present study, mRNA expression data and
clinical trait information of patients with breast cancer were
downloaded from the GEO database using the keywords ‘breast cancer’
in NCBI (http://www.ncbi.nlm.nih.gov/geo/) and TCGA database
(https://cancergenome.nih.gov/, last
updated July 2017). The search strategy of the study was designed
as follows: The type of study was ‘expression profiling by array’,
and the entry type was ‘datasets’. The sample size of the selected
datasets was ≥100. The organism was homo sapiens. The
database searching was independently carried out by two
researchers.
Data preprocessing
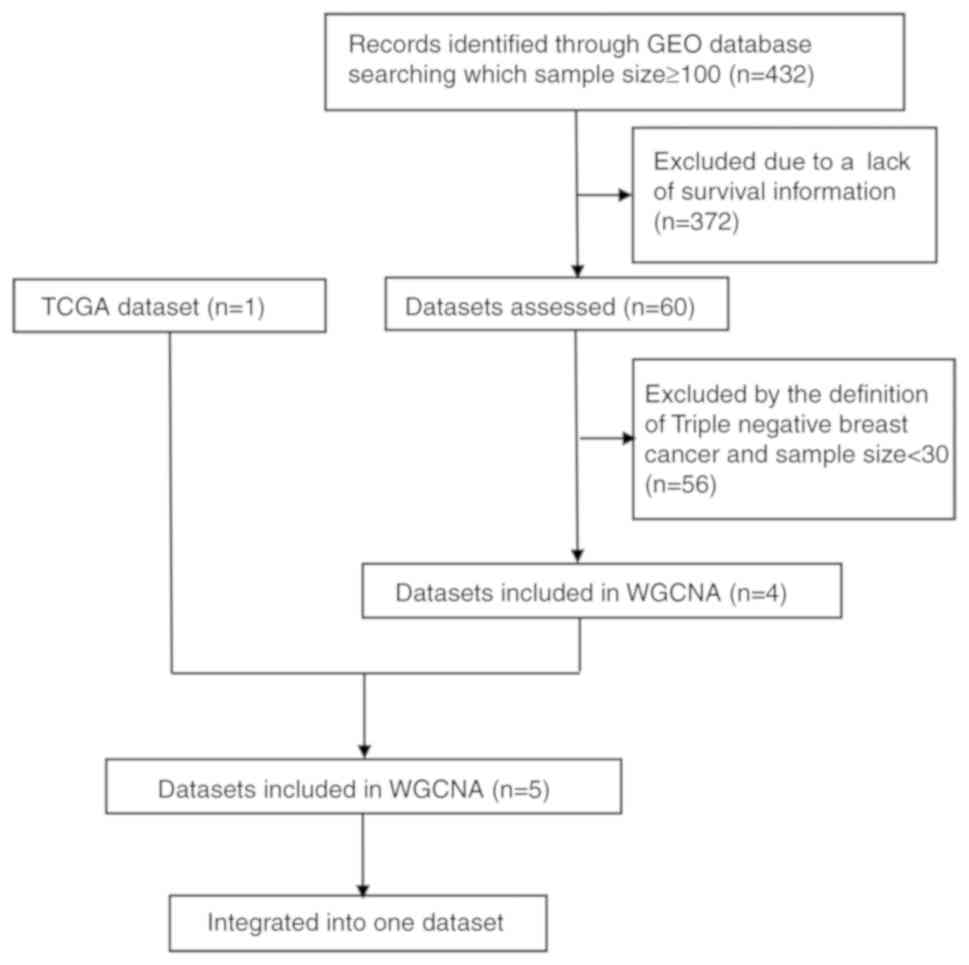
Four microarray datasets (GSE16446, GSE25055,
GSE25065 and GSE58812) that contained survival outcomes and
clinical information of ER, PR and HER2 were selected from the GEO
database. Data of samples from patients with TNBC were obtained
from the TCGA database (Fig. 1).
Table I presents the clinical
characteristics of the patients with TNBC included in these five
datasets. In addition, four endpoints were integrated and defined
as relapse-free survival (RFS), which represented survival
outcomes. The mRNA expression value of each gene considered in the
present study represented the mean of the gene expression values
extracted from the five datasets. The mRNA gene expression from the
five datasets were normalized and merged by gene name; however,
each gene that was not present in all datasets was excluded from
the study. In order to ensure the quality of the expression data,
genes were excluded if ≥10% of the samples were missing expression
data. Subsequently, the variance of each mRNA gene expression value
was calculated and the genes with variance ranked in the top 50%
were selected. Eventually, a final dataset containing 459 patients
with TNBC and mRNA expression of 5,782 genes was compiled. Table II presents the baseline clinical
characteristics of the final dataset.
 | Table I.Clinical characteristics of patients
with TNBC. |
Table I.
Clinical characteristics of patients
with TNBC.
| Dataset | Patients, n | Survival
endpoints | Event (0/1) |
|---|
| TCGA | 83 | RFS | 69/14 |
| GSE58812 | 107 | MFS | 76/31 |
| GSE25065 | 64 | DRFS | 37/27 |
| GSE25055 | 114 | DRFS | 77/37 |
| GSE16446 | 45 | DMFS | 32/13 |
| Table II.Clinical characteristics of patients
with TNBC. |
Table II.
Clinical characteristics of patients
with TNBC.
| Variables | Patients, n
(%) |
|---|
| Age, years |
|
≤50 | 208 (45.3) |
|
>50 | 251 (54.7) |
| Stage |
| I | 23 (7.8) |
| II | 162 (55.1) |
|
III | 108 (36.7) |
| IV | 1 (0.4) |
| Lymph Node |
| N0 | 148 (42.0) |
| N1 | 135 (38.4) |
| N2 | 40 (11.4) |
| N3 | 29 (8.2) |
| T stage |
| T1 | 44 (12.6) |
| T2 | 199 (56.9) |
| T3 | 67 (19.1) |
| T4 | 40 (11.4) |
| Metastasis |
|
Yes | 116 (99.1) |
| No | 1 (0.9) |
| OSa, months | 41.97
(21.16,70.83) |
| RFSa, months | 31.87
(17.80,57.36) |
Construction of the WGCNA
The WGCNA was carried out by using the R WGCNA
package (15). The goodSamplesGenes
function in the R WGCNA package was used to check the gene
expression data of all TNBC samples for excessive missing values
and identification of outlier microarray samples. The samples were
clustered with hierarchical clustering analysis by using the hclust
function to check if there were any outliers. A correlation matrix
was created by using a similarity measure to summarize the
association between all genes. In addition, to identify specific
modules, WGCNA uses a soft-thresholding procedure to avoid the
selection of an arbitrary cut-off. The β value represented a
soft-thresholding parameter that could emphasize strong
correlations between genes and penalize weak correlations to ensure
a scale-free network (14). The
cutreeDynamic function was used for adaptive branch pruning of
hierarchical clustering dendrograms and the dynamicTreeCut package
was adopted to generate co-expression modules. Subsequently, to
further analyze the module, the dissimilarity of the module
eigengenes (ME) was calculated using the moduleEigengenes function
in the R WGCNA package, which was defined as the first principal
component of a given module and considered to be representative of
the gene expression profiles in a module. A cut-off line for the
module dendrogram was selected and the module was merged.
Eventually, the adjacency was converted into a topological overlap
matrix (TOM), and modules were subjected to hierarchical cluster
analysis according to the TOM-based dissimilarity measure.
To assess the potential associations between modules
and clinical variables, approaches based on WGCNA to identify
modules associated with to the progression of TNBC were used.
Firstly, the gene significance (GS) was defined as the log10
transformation of the corresponding P-value (GS=lgP) of the
correlation between gene expression and pathological stage.
Secondly, each ME considered as the major component in the
principal component analysis was chosen and represented the mean
measure for the overall co-expression network. Ultimately, the
correlation between MEs and the clinical characteristics was
calculated to identify the relevant module (16–18).
Statistical analysis
For survival analysis, MEs and gene expression
values were divided into low and high expression groups by using
the Cutoff Finder (http://molpath.charite.de/cutoff/index.jsp) (19). The hazard ratio (HR) was determined
via a Cox regression model, and survival curves were plotted from
Kaplan-Meier estimations. P<0.05 was considered to indicate a
statistically significant difference.
Gene Ontology (GO) and Kyoto Encyclopedia of Genes
and Genomes (KEGG) pathways enrichment analyses for the identified
modules were performed using Cytoscape software (version 3.5.1;
http://cytoscape.org/) with the ClueGO plug-in
(version 2.5.0; http://apps.cytoscape.org/apps/cluego) (20). The ClueGO plug-in generates grouped
GO annotation and KEGG pathways, and integrates the terms to create
a functionally organized GO/pathway term network by using κ
statistics to determine the association strength between the terms
(21). In the present study, the
statistical test used by the ClueGO plug-in for the enrichment was
based on two-sided hypergeometric tests with a Benjamini-Hochberg
adjustment. GO terms and KEGG pathways with P<0.05 were
considered as significantly different, and a κ score threshold ≥0.4
was used to functionally divide these pathways into different
groups.
Identification of hub genes in the
co-expression module
WGCNA is used to find hub genes in the module of
interest, which is highly interconnected with other genes that have
higher biological relevance compared with the whole network. The
absolute value of Pearson's correlation between gene expression and
MEs was used to identify the importance of a gene in the module,
which is known as the module membership (MM). In the present study,
hub genes were selected for MM>0.55 in the specific module. In
addition, the modules of interest were constructed using Cytoscape
and defined as hub genes for a connectivity degree ≥15 in the
co-expression network. The common hub genes with the higher MM and
connectivity degree were considered as ‘real’ hub genes in the
module of interest.
Results
Construction of the WGCNA
A total of 459 TNBC samples were used as input for
the hierarchical clustering analysis that was performed with the
function hclust to cluster the samples to see if there were any
clear outliers. Three samples (GSM149983, GSM1419985 and GSM411317)
were removed as outliers. The co-expression network was constructed
from the expression values of 5,782 genes in 456 TNBC samples with
the WGCNA package. Prior to further studying the TNBC samples, an
analysis of network topology was performed for various
soft-thresholding powers to obtain the relatively balanced scale
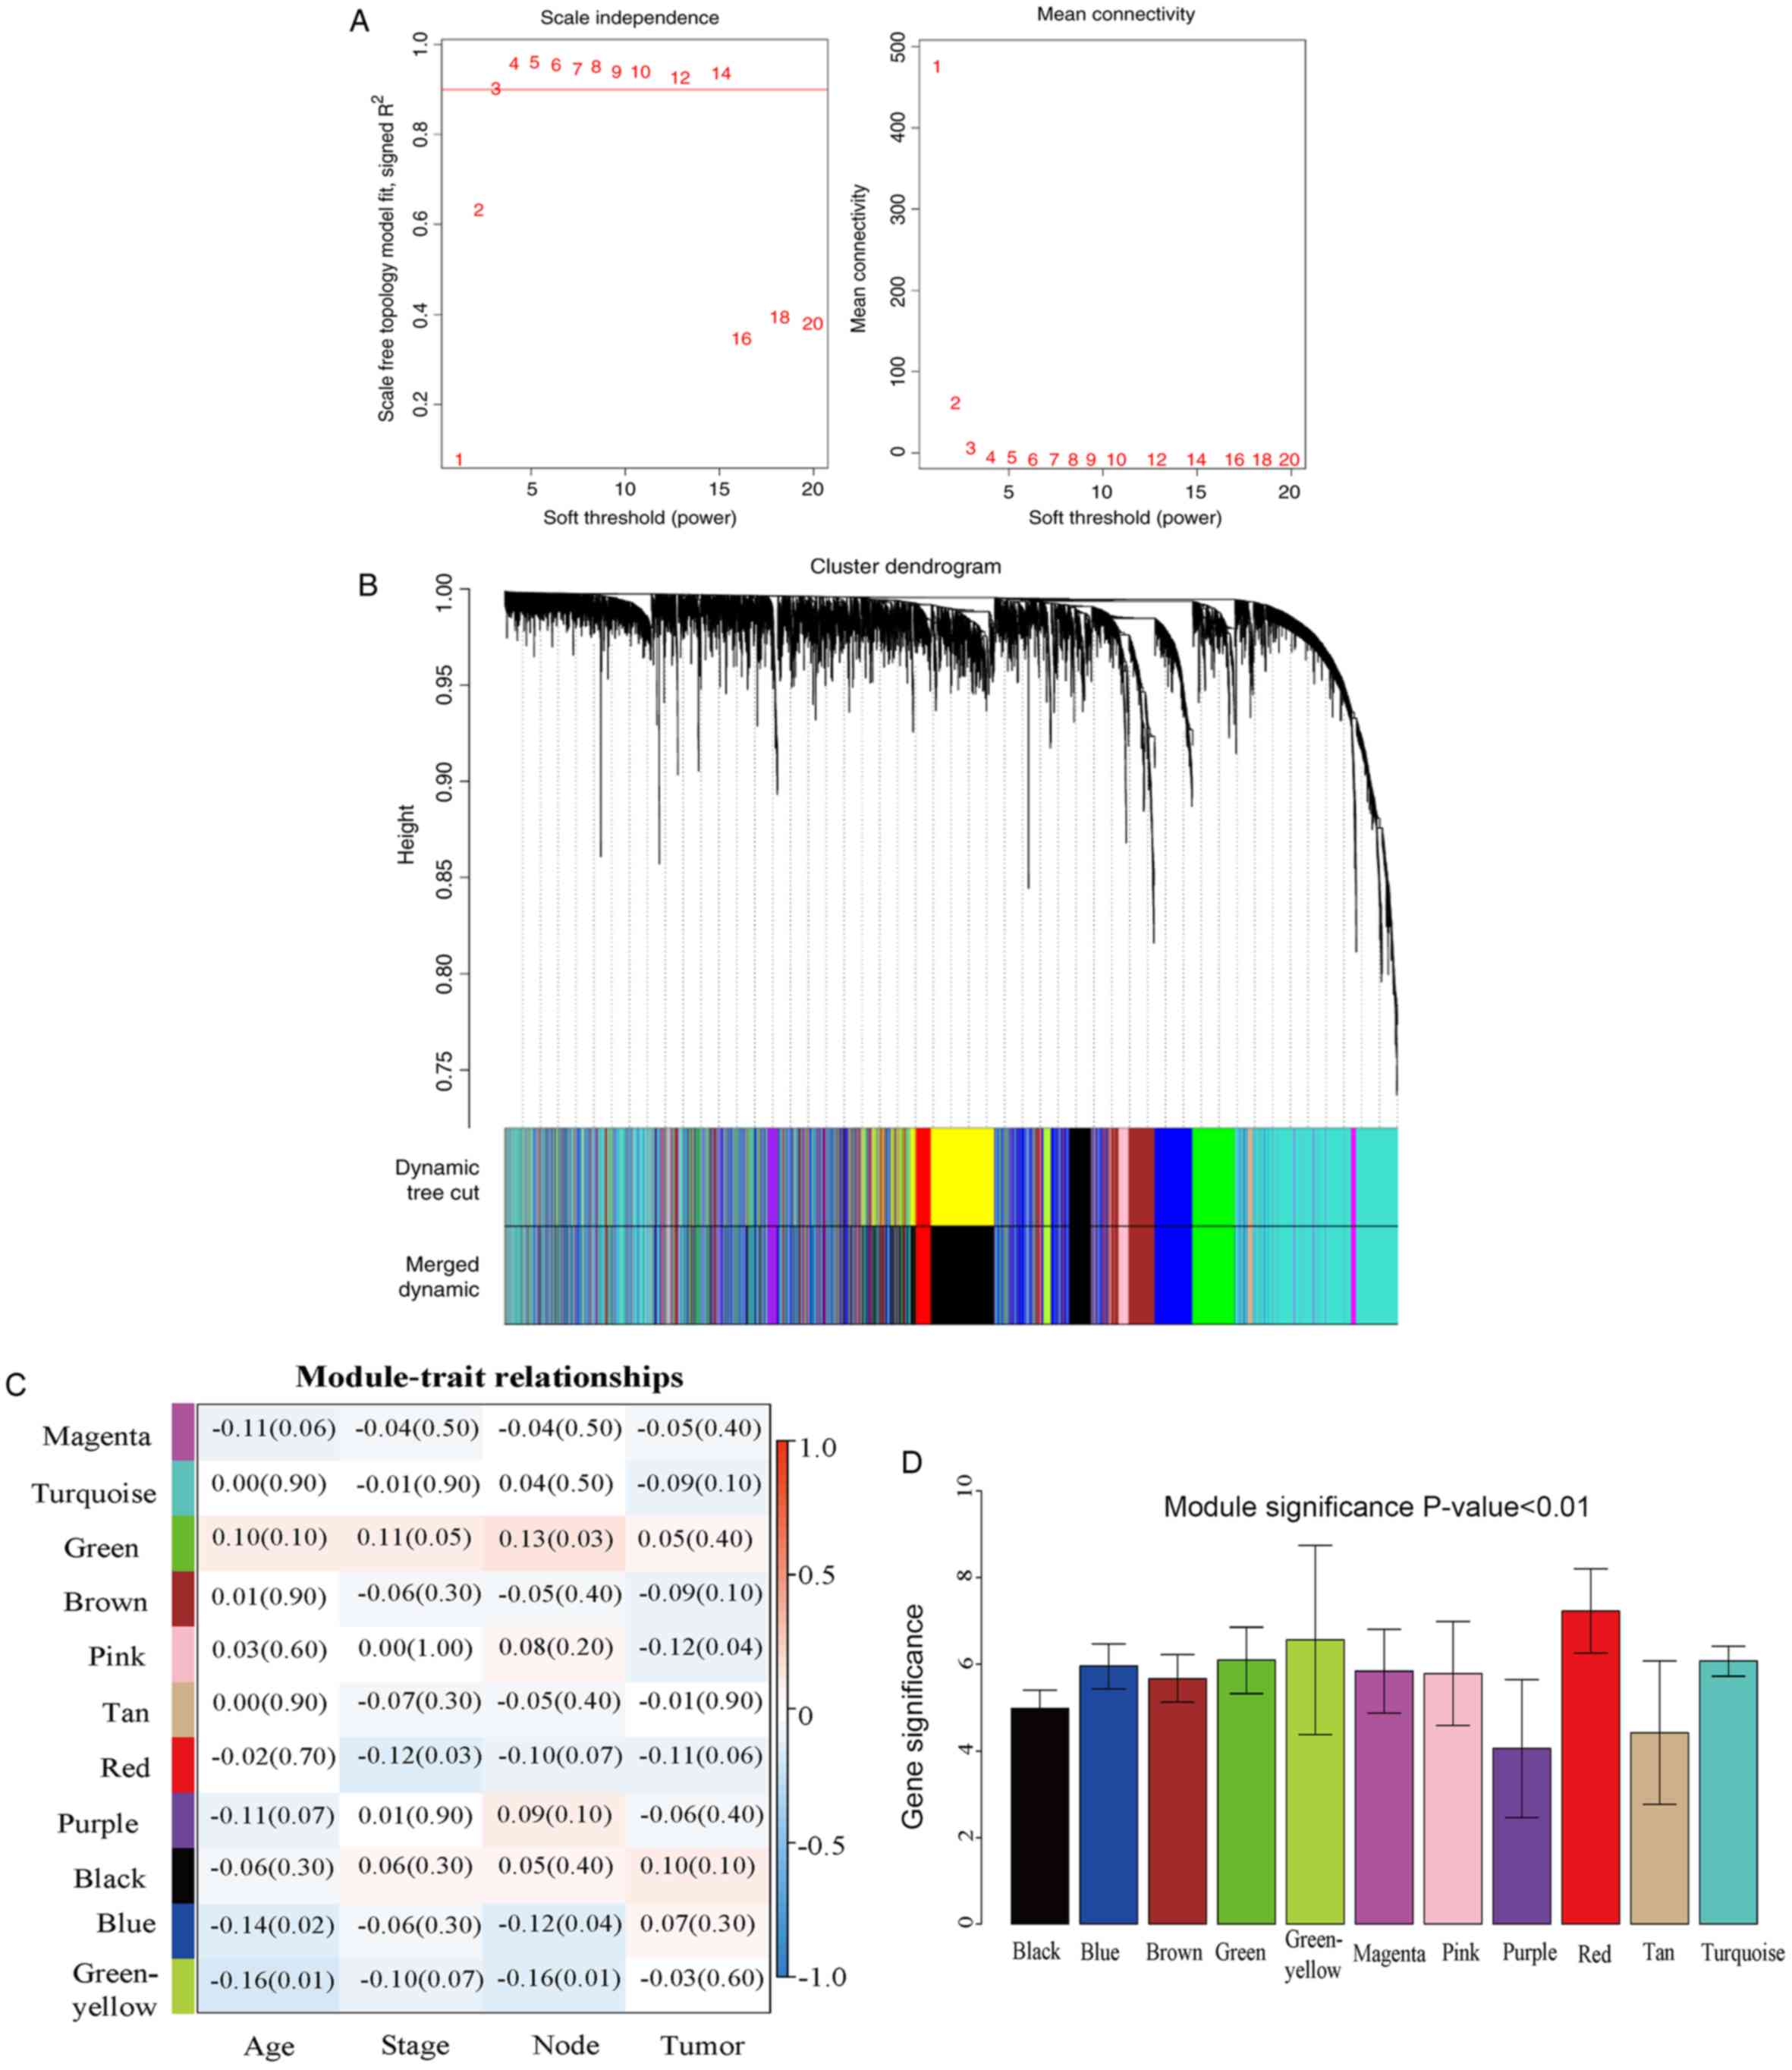
independence and mean connectivity. As presented in Fig. 2A, power 3, which is the lowest power
for which the scale-free topology fit index reached 0.90, was
selected to ensure a scale-free network and to produce a
hierarchical clustering dendrogram. The dynamic tree cut function
was used to prune the branches in hierarchical clustering
dendrograms that determined the generation of the co-expression
modules. Then, the MEs were calculated by the moduleEigengenes
function to quantify the co-expression similarity of the modules
and the clustered modules were merged based on the similarity. A
total of 11 distinct co-expression modules (ranging in size from
38–2,251 genes), were identified. These co-expression modules are
represented by different colors in Fig.
2B.
Identification of module associations
with clinical characteristics of patients with TNBC
To determine the modules that were significantly
associated with clinical characteristics, 294 TNBC samples with
clinical variables were included to calculate the module-trait
association (Fig. 2C). GS were also
determined to evaluate the correlation between gene expression and
pathological stage (Fig. 2D).
Results of the module-trait association revealed a weak correlation
between the red module and the pathological stage (r=−0.12, P=0.03)
in which GS was the most significant. In addition, to identify
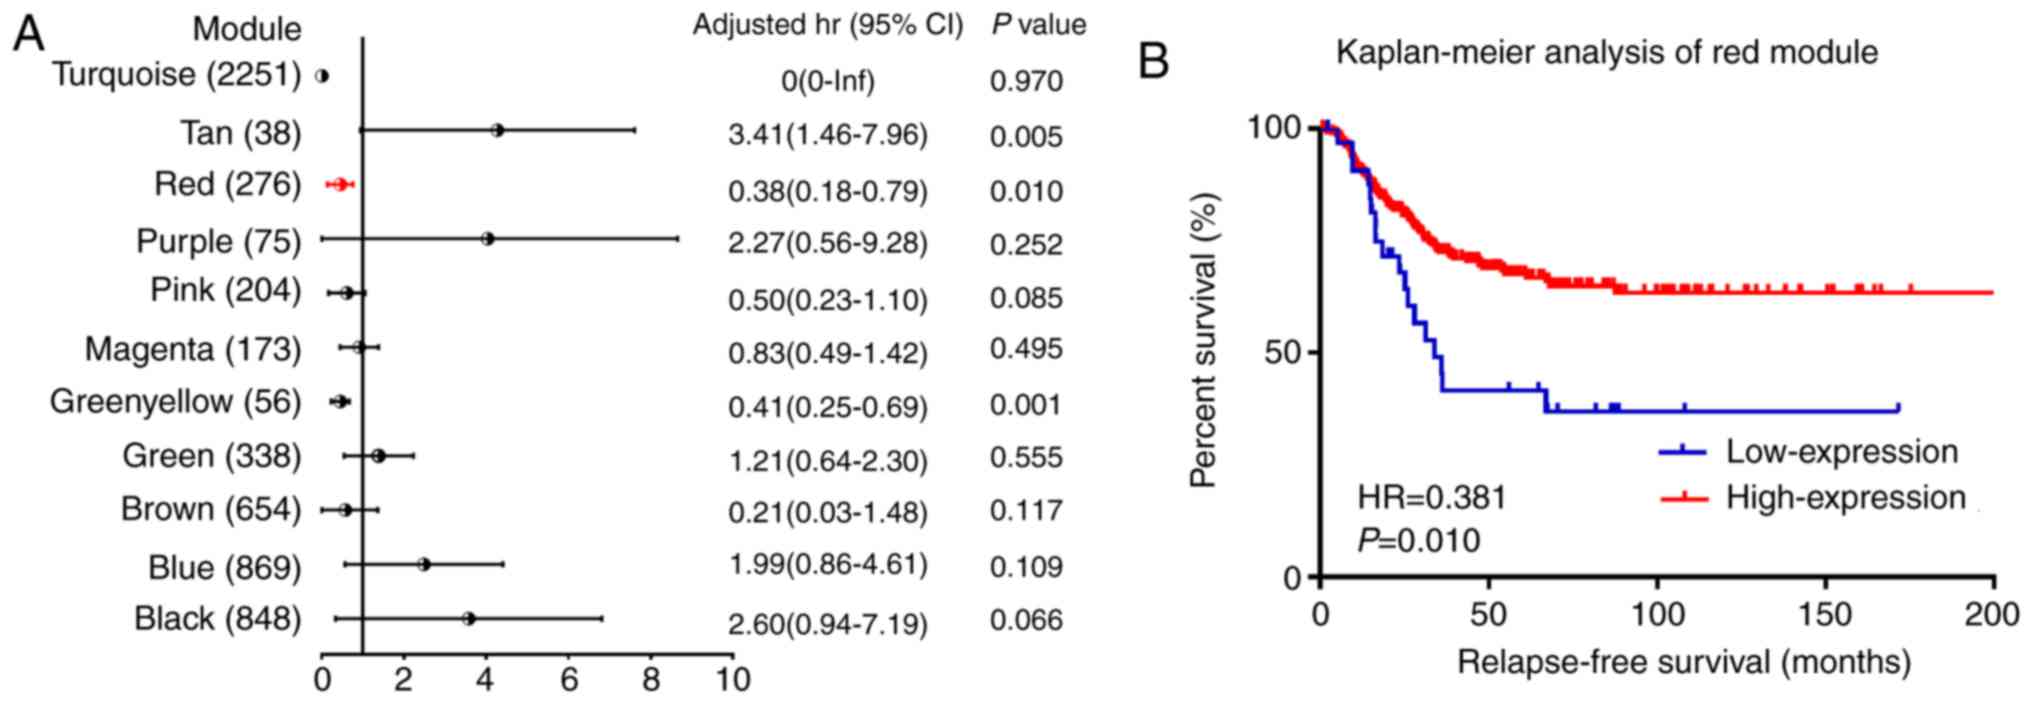
associations between the co-expression modules and RFS endpoints,
Cox regression was used to calculate the HRs and P-values for each
ME. Following the survival analysis, 3 co-expression modules
(green-yellow, red and tan colors) were significantly associated
with the RFS in multivariate analysis (Fig. 3A). As presented in Fig. 3B, the increased mRNA expression of
the red module was associated with good outcome for RFS, which was
consistent with the correlation observed between pathological stage
and ME. Furthermore, based on patients' status of relapse and
non-relapse, each module was divided into two groups, and MEs were
compared within these two groups with the Mann-Whitney U test. The
results in Table III demonstrated
that MEs in the red module were significantly different between the
two groups of relapse and non-relapse patients with TNBC. These
results allowed the selection of the red module as the module of
interest, which was further studied in subsequent analyses.
| Table III.Comparison between non-relapse and
relapse occurrence in patients with TNBC by Mann-Whitney U
test. |
Table III.
Comparison between non-relapse and
relapse occurrence in patients with TNBC by Mann-Whitney U
test.
| Module | Ngene | Non-relapse | Relapse | Z score | P-value |
|---|
| ME black | 848 | −0.008
(−0.03,0.02) | −0.003
(−0.03,0.04) | −1.579 | 0.114 |
| ME blue | 869 | 0.006
(−0.03,0.03) | 0.001
(−0.03,0.03) | −0.241 | 0.810 |
| ME brown | 654 | −0.003
(−0.04,0.03) | −0.001
(−0.03,0.03) | −0.297 | 0.766 |
| ME green | 338 | −0.018
(−0.03,0.01) | −0.018
(−0.03,0.03) | −0.434 | 0.665 |
| ME green
yellow | 56 | −0.008
(−0.03,0.03) |
−0.011(−0.03,0.02) | −0.800 | 0.424 |
| ME magenta | 173 | 0.002
(−0.03,0.04) | −0.001
(−0.04,0.02) | −1.099 | 0.272 |
| ME pink | 204 | −0.009
(−0.03,0.02) | −0.007
(−0.03,0.02) | −0.021 | 0.984 |
| ME purple | 75 | −0.001
(−0.03,0.03) | −0.002
(−0.03,0.02) | −0.565 | 0.572 |
| ME red | 276 | 0.007
(−0.02,0.03) | 0.000
(−0.03,0.02) | −2.393 | 0.017 |
| ME tan | 38 | −0.005
(−0.03,0.03) | −0.002
(−0.03,0.03) | −1.049 | 0.294 |
| ME turquoise | 2251 | −0.008
(−0.04,0.03) | −0.012
(−0.04,0.03) | −0.450 | 0.653 |
Enrichment analysis of the key
modules
GO and KEGG enrichment were performed in the red
module using ClueGO. Following GO analysis of the red module, 40 GO
terms were significantly enriched and were divided into 16 groups
(Table IV), which reflected the
biological processes. The top 10 enriched GO terms were defined as
follows: ‘mRNA processing’, ‘regulation of mitotic nuclear
division’, ‘cellular response to topologically incorrect protein’,
‘interaction with symbiont’, ‘golgi vesicle transport’, ‘mitotic
cytokinesis’, ‘regulation of target of rapamycin (TOR) signaling’,
‘transcription elongation from RNA polymerase II promoter’,
‘organelle localization by membrane tethering’ and ‘histone lysine
methylation’ Following KEGG analysis, 3 KEGG pathways were
significantly identified, including the Hedgehog (Hh) signaling
pathway (KEGG: 04340), the gonadotropin-releasing hormone (GnRH)
signaling pathway (KEGG: 04912) and the thyroid hormone signaling
pathway (KEGG: 04919).
| Table IV.Biological processes for genes in the
module red. |
Table IV.
Biological processes for genes in the
module red.
| Term ID | P-value | Benjamini-Hochberg
adjustment | Term name | Gene names |
|---|
| GO:0006397 | <0.01 | <0.01 | mRNA
processing | A1CF, CCNT1, CDK13,
CTR9, GEMIN7, GTF2H1, HNRNPA3, HNRNPH1, LUC7L3, NOVA2, PAPOLA,
PPWD1, PRKACA, PTCD2, RBM15B, RBM25, RBM39, RBM7, RBMX2, SON, SPEN,
WBP4, YTHDC1 |
| GO:0000910 | <0.01 | 0.01 | Cytokinesis | ANK3, APC, CUL3,
PDCD6IP, PKN2, RASA1, SETD2, SON |
| GO:0008360 | <0.01 | 0.01 | Regulation of cell
shape | CSNK1G1, CSNK1G3,
F2, FGD6, KIF3A,PHIP, RASA1, TTBK2 |
| GO:0006888 | <0.01 | 0.01 | ER to Golgi
vesicle-mediated transport | ACTR10, ANK3,
ARFGAP1, COPB1, CUL3, F2, SEC23IP, SEC24B, USO1 |
| GO:0007088 | <0.01 | 0.01 | Regulation of
mitotic nuclear division | APC, ATRX, BTC,
CDK13, CHMP2B, CUL3, PHIP, SLF2 |
| GO:0051702 | <0.01 | 0.01 | Interaction with
symbiont | CCNT1, CHD1, EP300,
F2, REST |
| GO:0016482 | <0.01 | 0.01 | Cytosolic
transport | DNAJC13, DOPEY1,
EEA1, GCC2, MON2, PIKFYVE, RAB21 |
| GO:0140056 | <0.01 | 0.01 | Organelle
localization by membrane tethering | AKAP9, B9D1, EXOC5,
HAUS3, PRKACA, TTBK2, USO1 |
| GO:0035967 | <0.01 | 0.01 | Cellular response
to topologically incorrect protein | ARFGAP1, ATF6,
CUL3, DZIP3, EDEM3, EP300, GSK3A |
| GO:0006368 | <0.01 | 0.02 | Transcription
elongation from RNA polymerase II promoter | CCNT1, CDK13, CTR9,
GTF2A1, GTF2H1, SETD2 |
| GO:0032006 | 0.01 | 0.02 | Regulation of TOR
signaling | ARNTL, CRYBA1,
GSK3A, HTR6, MTM1 |
| GO:0051651 | 0.01 | 0.02 | Maintenance of
location in cell | AKAP9, ANK3, MORC3,
PDIA2, SYNE2 |
| GO:0009791 | 0.02 | 0.02 | Post-embryonic
development | ACADM, ATRX, IREB2,
MORC3, PLEKHA1 |
| GO:0007030 | 0.03 | 0.03 | Golgi
organization | AKAP9, GCC2,
SEC23IP, USO1, VAMP4 |
| GO:0034968 | 0.03 | 0.03 | Histone lysine
methylation | ATRX, BCOR, CTR9,
KDM6A, SETD2 |
| GO:0003231 | 0.03 | 0.03 | Cardiac ventricle
development | C5orf42, GSK3A,
MDM2, PTCD2, TNNI1 |
Hub gene identification in the
interested module
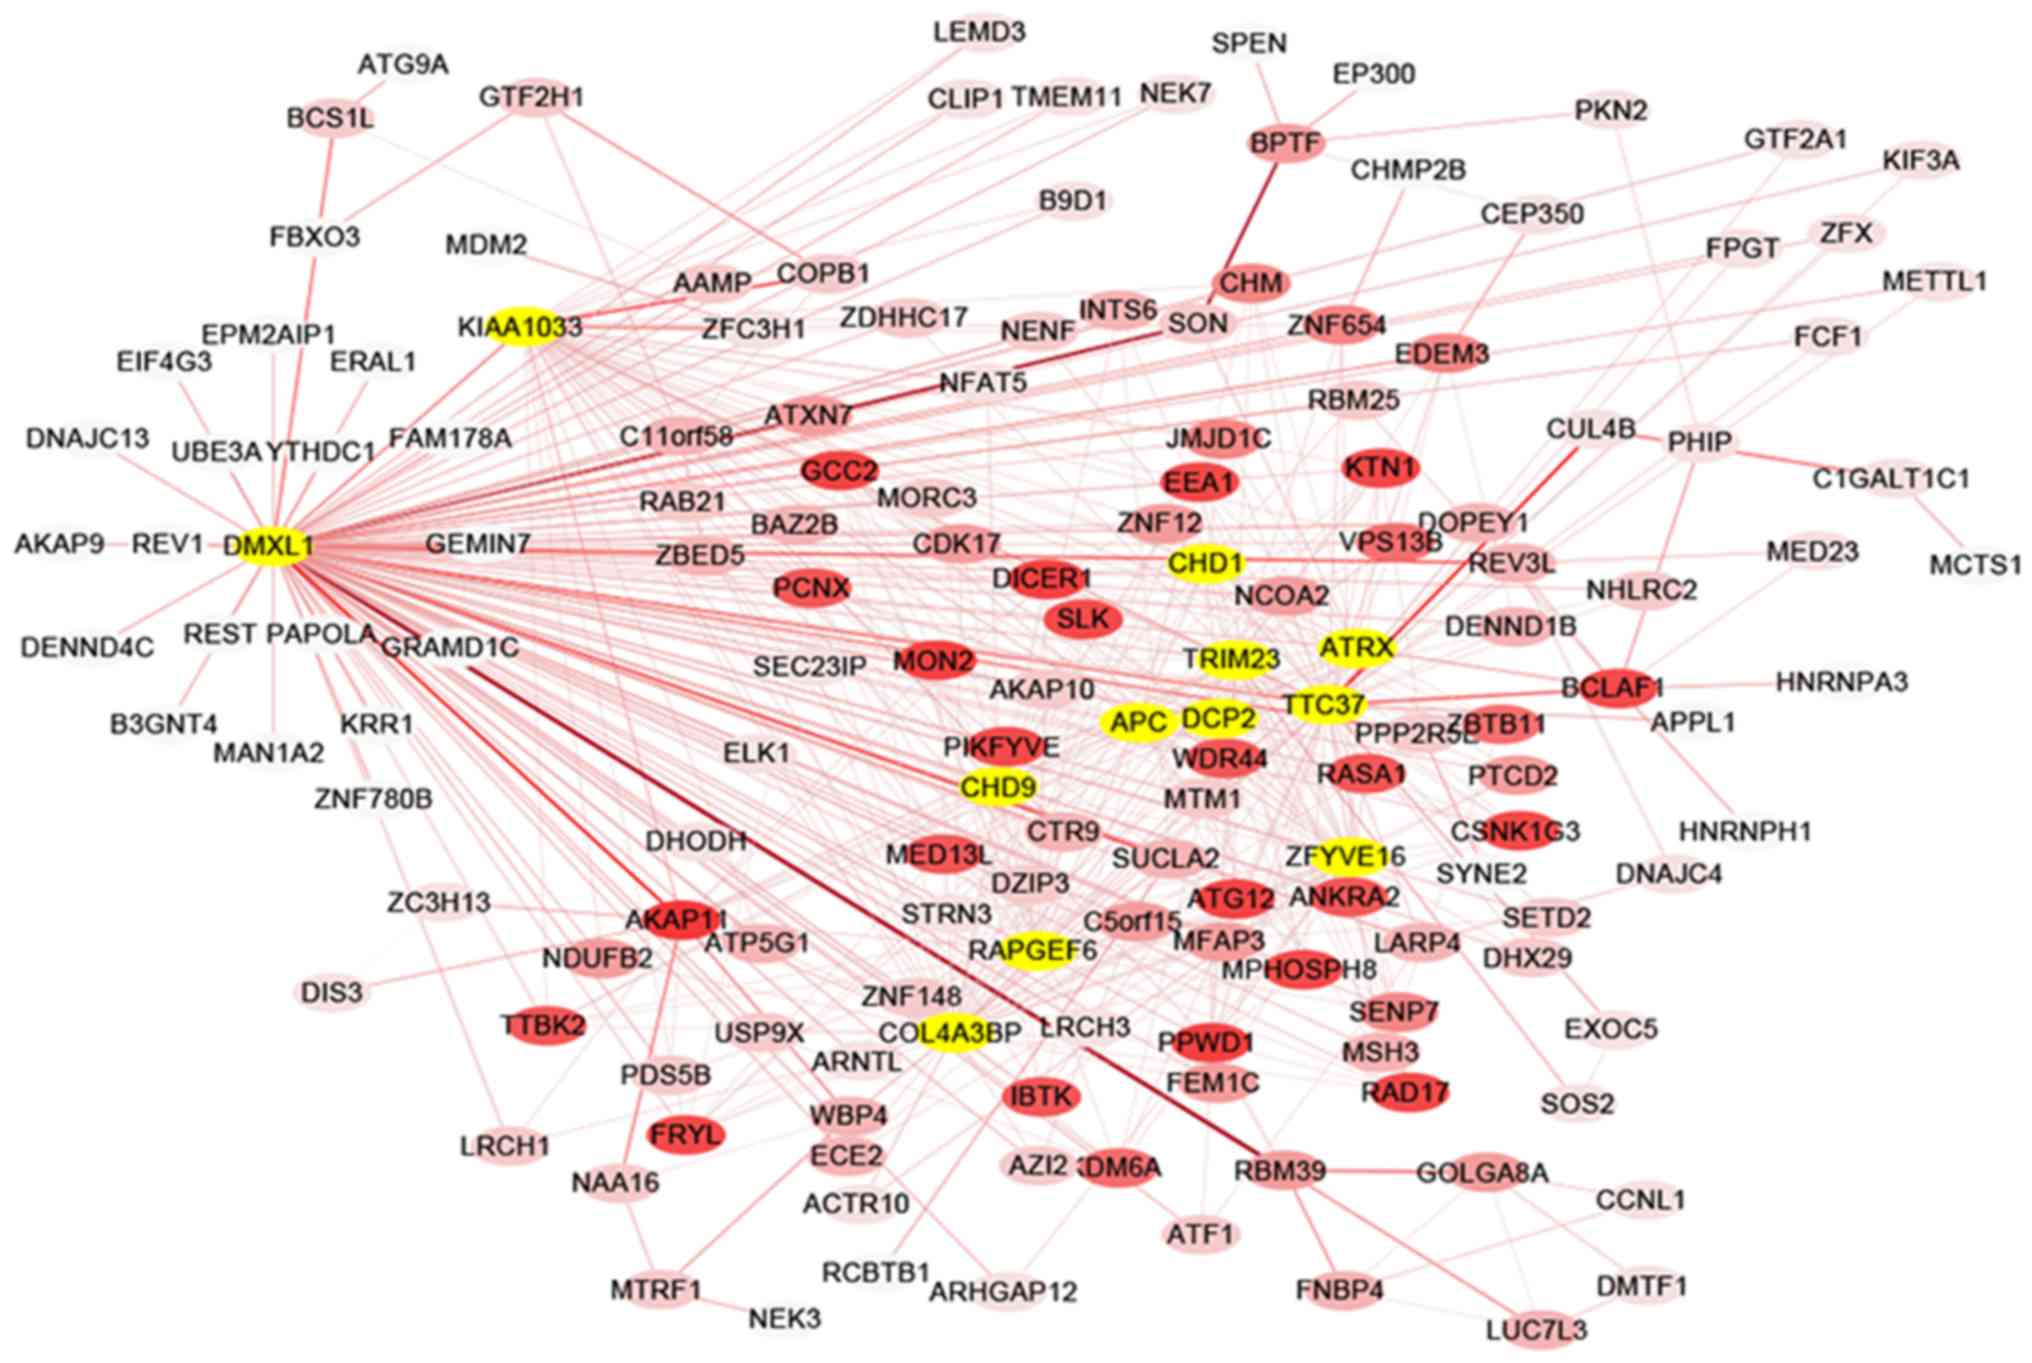
The co-expression network of selected hub genes from
all genes in the red module were constructed with Cytoscape
(Fig. 4). Following the measure of
the absolute value of Pearson's correlation (MM>0.55), 26 genes
with higher connectivity were identified. Amongst these genes,
those that were connected with >15 nodes were selected in the
red module. A total of 12 common genes were eventually defined as
hub genes and comprised WNT signaling pathway regulator (APC), α
thalassemia/mental retardation syndrome X-linked (ATRX),
chromodomain helicase DNA binding protein 1 (CHD1) and 9 (CHD9),
collagen type IV α 3 binding protein (COL4A3BP), decapping mRNA 2
(DCP2), Dmx like 1 (DMXL1), WASH complex subunit 4 (KIAA1033), Rap
guanine nucleotide exchange factor 6 (RAPGEF6), tripartite motif
containing 23 (TRIM23), tetratricopeptide repeat domain 37 (TTC37)
and zinc finger FYVE-type containing 16 (ZFYVE16).
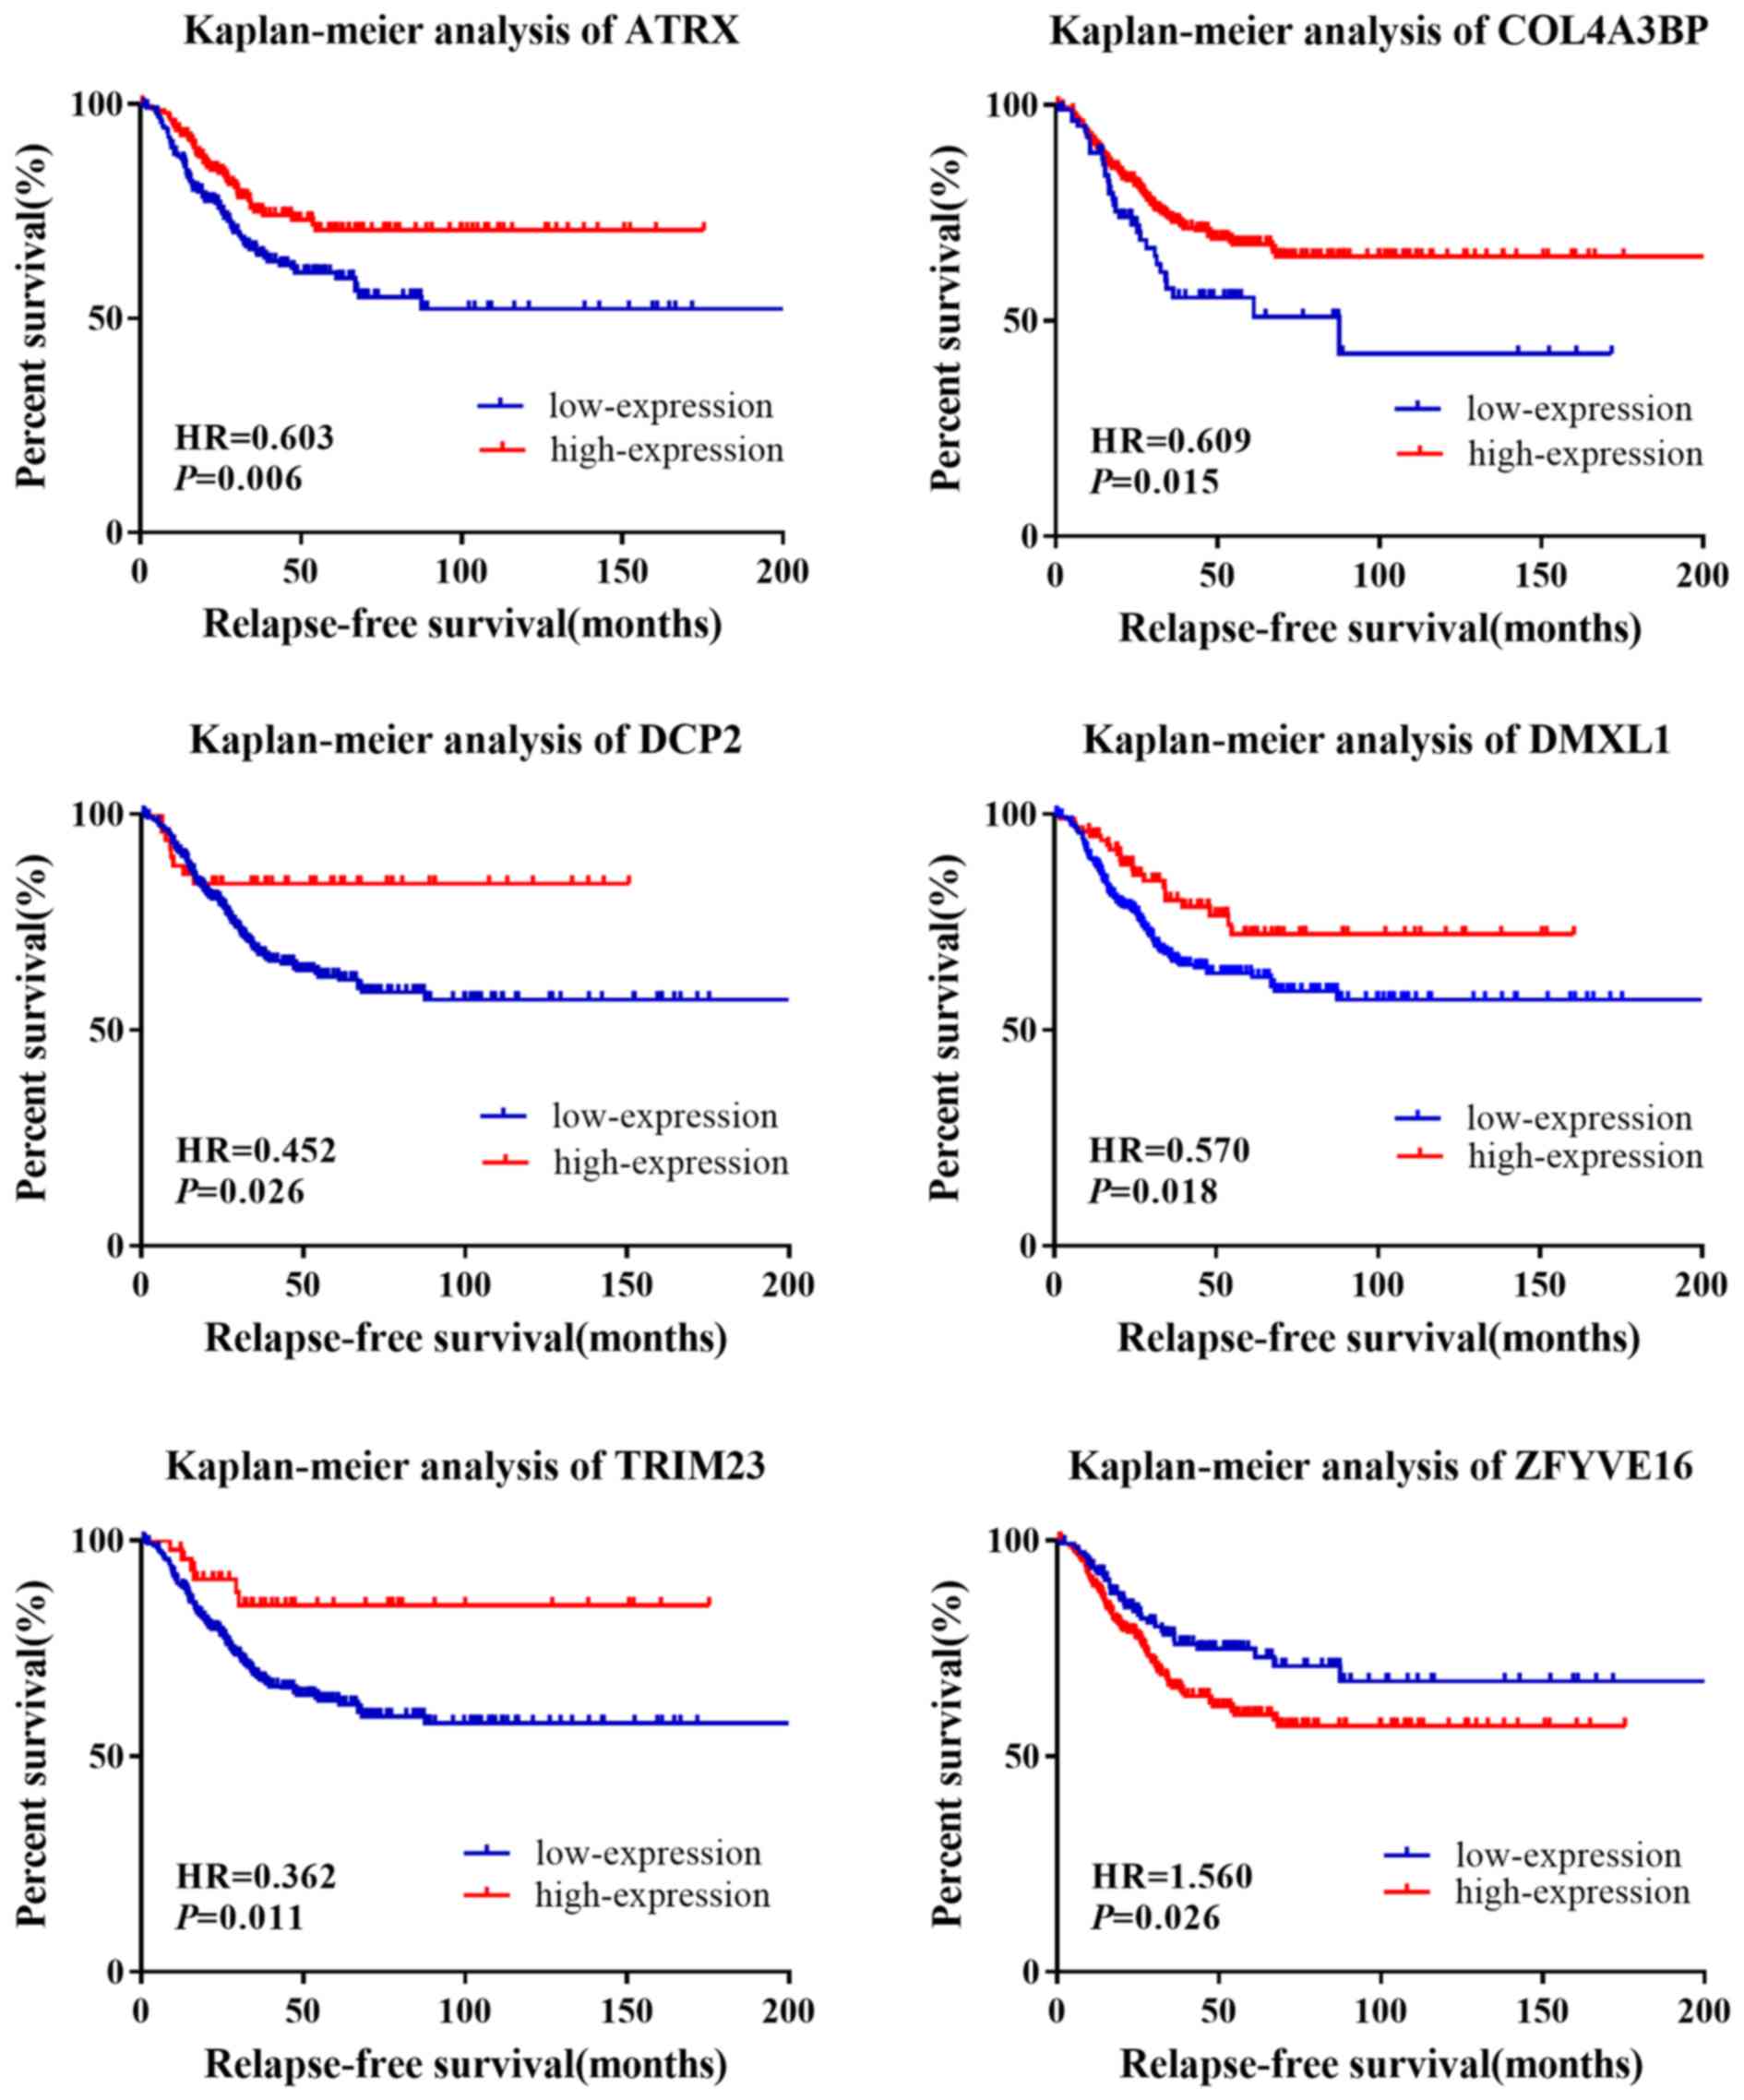
The HRs and P-values were calculated for the 12
genes in the survival analysis (Table
V). Following the univariate survival analysis, ATRX, COL4A3BP,
DCP2, DMXL1, TRIM23 and ZFYVE16 were found to be significantly
associated with RFS in patients with TNBC (Fig. 5). The pathological stage variable in
the multivariate survival analysis was adjusted and the result
showed that ATRX, CHD9 and TRIM23 were significantly associated
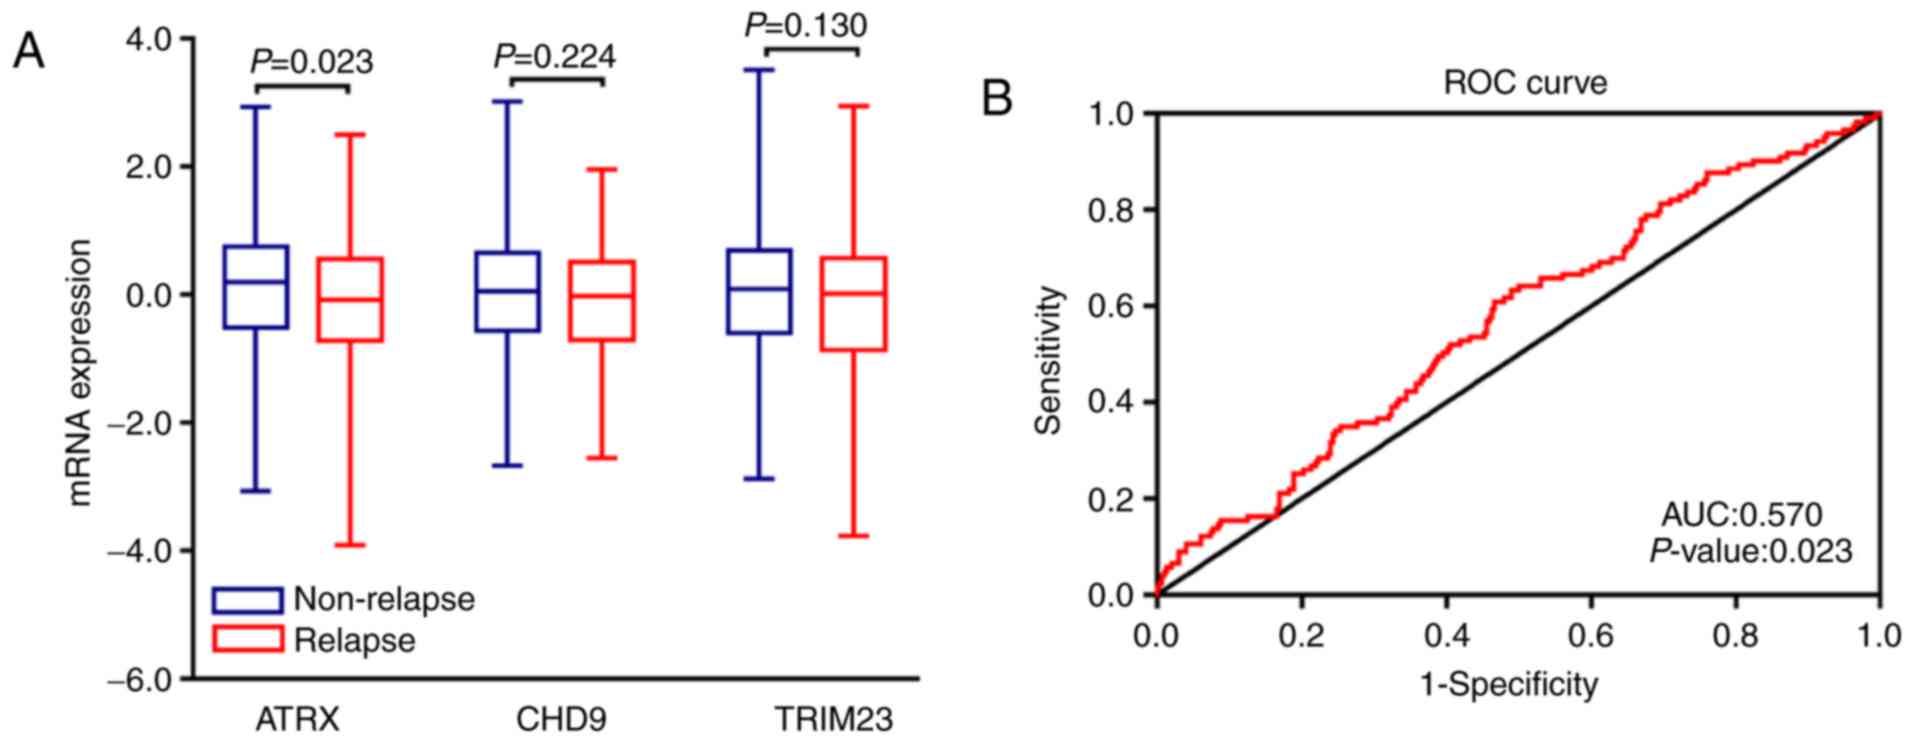
with RFS in patients with TNBC. To validate these three genes, 413
TNBC samples were divided into two groups based on the occurrence
history of tumor relapse in patients with TNBC. The independent
sample Mann-Whitney U test was performed between two groups. The
results suggested that the mRNA expression of ATRX could be used to
distinguish the relapse from non-relapse in patients with TNBC
(Fig. 6A). In addition, the ROC
curve analysis further validated that ATRX may distinguish relapse
from non-relapse in patients with TNBC (P=0.023; AUC=0.570;
Fig. 6B). Patients with lower mRNA
expression of ATRX presented significantly shorter overall survival
time, suggesting that ATRX may be considered as a prognosis
biomarker of TNBC.
| Table V.Survival analysis of hub genes for
RFS in patients with TNBC. |
Table V.
Survival analysis of hub genes for
RFS in patients with TNBC.
|
| Univariate analysis
(413a) | Multivariate
analysis (294b) |
|
|---|
|
|
|
|
|
|---|
| Gene | HR | P-value | 95% CI | HR | P-value | 95% CI | Cutoff value |
|---|
| APC | 1.236 | 0.266 | 0.851–1.797 | 1.064 | 0.800 | 0.658–1.721 | −0.289 |
| ATRX | 0.603 | 0.007 | 0.417–0.870 | 0.601 | 0.033 | 0.376–0.960 | 0.180 |
| CHD1 | 0.643 | 0.120 | 0.368–1.122 | 0.727 | 0.394 | 0.349–1.514 | 0.949 |
| CHD9 | 0.547 | 0.057 | 0.294–1.017 | 0.373 | 0.033 | 0.151–0.925 | 1.077 |
| COL4A3BP | 0.609 | 0.015 | 0.406–0.911 | 0.803 | 0.432 | 0.464–1.389 | −0.725 |
| DCP2 | 0.451 | 0.030 | 0.220–0.924 | 0.471 | 0.060 | 0.215–1.032 | 1.209 |
| DMXL1 | 0.570 | 0.019 | 0.356–0.912 | 0.608 | 0.094 | 0.339–1.089 | 0.728 |
| KIAA1033 | 0.793 | 0.203 | 0.554–1.134 | 0.900 | 0.650 | 0.572–1.417 | −0.930 |
| RAPGEF6 | 0.687 | 0.063 | 0.462–1.021 | 0.653 | 0.093 | 0.397–1.073 | 0.328 |
| TRIM23 | 0.361 | 0.015 | 0.159–0.821 | 0.294 | 0.038 | 0.092–0.934 | 1.187 |
| TTC37 | 0.725 | 0.100 | 0.494–1.064 | 0.654 | 0.100 | 0.395–1.085 | 0.418 |
| ZFYVE16 | 1.562 | 0.027 | 1.051–2.322 | 1.309 | 0.304 | 0.783–2.188 | −0.290 |
Discussion
In the present study, 11 co-expression modules were
constructed based on the expression levels of 5,782 genes obtained
from 456 patients with TNBC using the WGCNA method. WGCNA is a
powerful method used to investigate biological mechanisms and
identify genes in large-scale cancer gene expression datasets. The
WGCNA method uses a soft threshold to weight the correlation
between genes to determine the degree of association between them,
which makes the co-expression network more consistent with
biological network characteristics, and it provides results with
high reliability and biological significance (22,23). To
the best of our knowledge, the analysis of TNBC mRNA expression
using WGCNA has not yet been investigated. Results of survival
analysis and WGCNA from the present study may therefore be
considered as relevant for prognosis in TNBC.
With regards to the GO enrichment analysis, results
demonstrated that the red module was associated with the biological
processes involved in the regulation of intracellular signal
activities, including the ‘regulation of TOR signaling’ and
‘histone lysine methylation’. It has been reported that the
phosphoinositide 3-kinase (PI3K)/protein kinase B/mechanistic
(m)TOR pathway is essential in cell proliferation, metabolism,
proliferation, differentiation, survival and angiogenesis, and in
TNBC (24–27). As a key downstream component of the
PI3K pathway, mTOR is a crucial regulator of tumor formation and
progression. Crown et al (28) reported that targeting mTOR pathway
inhibits tumor growth. mTOR inhibitors are being evaluated in
patients with TNBC in clinical characteristics. In addition,
histone lysine methylation is associated with nucleosome remodeling
and gene expression regulation and is therefore considered as the
key epigenetic process (29–31). Increasing evidence suggests that
aberrant regulation of gene expression via histone methylation has
emerged as an important mechanism for cancer initiation and
progression (30,32,33).
With regards to the KEGG pathway analysis, results
demonstrated that the Hh signaling was the most significantly
identified pathway. The Hh pathway serves a key role in embryonic
development and regulates stem cell renewal and tissue homeostasis
(34). It has been reported that
dysregulated Hh signaling leads to increased aggressiveness of TNBC
tumors, and that activation of Hh pathway enhances proliferation,
invasion and migration of TNBC cells (35–37).
Furthermore, the present study demonstrated that GnRH signaling was
significantly identified in the red module. Effective therapies for
patients with hormone-receptor-positive or HER2-positive breast
cancer are available; however, treatments for TNBC are lacking
(38). The present study
demonstrated that the GnRH, also known as luteinizing
hormone-releasing hormone (LHRH), and its receptor may be involved
in the negative regulation of cell proliferation in malignant
tumors. Previous studies have reported that LHRH receptors are
expressed in a significant proportion of TNBC, and are successfully
targeted by cytotoxic LHRH analogs in vivo (38–42).
Subsequently, further clinical trials using LHRH agonists in
patients with TNBC may be considered in the future.
Hub genes, defined as highly connected genes in
co-expression modules (14) are
considered to serve important roles in the underlying mechanisms of
malignancy, for example, uveal melanoma, colon cancer and human
osteosarcoma (17,43). In the present study, 12 hub genes
were identified in the red module, including APC, ATRX, CHD1, CHD9,
COL4A3BP, DCP2, DMXL1, KIAA1033, RAPGEF6, TRIM23, TTC37 and
ZFYVE16. Notably, ATRX was significantly associated with RFS in
TNBC samples, and Mann-Whitney U test demonstrated that ATRX mRNA
expression may distinguish relapse from non-relapse occurrence in
patients with TNBC. It has been reported that ATRX can modulate
numerous cellular processes including transcription, DNA repair and
mitotic recombination (44). In
addition, an alternative lengthening of telomeres (ALT), one role
of which is to maintain telomere lengths, has been detected in
breast cancer (45), which suggests
that ATRX may be a suppressor of ALT (46,47).
Furthermore, the loss of ATRX expression is associated with a poor
prognosis and rapid tumor progression in melanoma, leiomyosarcomas
and pancreatic neuroendocrine tumors (48–50).
This may be of interest in the development of ALT-specific targets
for TNBC treatment.
In conclusion, the present study attempted to
explore potential molecular mechanisms in TNBC by using
bioinformatics analyses. The red module identified has been
associated with prognosis in TNBC, and functional analyses
demonstrated that regulation of TOR signaling, histone lysine
methylation and Hh signaling pathway may facilitate relapse and
metastasis in patients with TNBC. In addition, the hub genes that
were identified, including ATRX, may be considered as potential
targets in TNBC. However, as the present study is mainly based on
the analysis of five publicly available datasets, further detailed
experimental research is required to confirm the results.
Acknowledgements
Not applicable.
Funding
No funding was received.
Availability of data and materials
The datasets analyzed during the current study are
available in The Cancer Genome Atlas (cancergenome.nih.gov/) and the Gene Expression
Ominibus database (ncbi.nlm.nih.gov/gds/).
Authors' contributions
YS and JJ designed the study and presented the
results for group discussions. QC and LL collected the public
datasets and preprocessed the data. QC, BX and LL provided methods
and finished the description of the results for the manuscript. BX
and LL programmed R codes and organized the manuscript. YS and JJ
were responsible for the supervision and direction of all of the
work. All authors have read and approved the final manuscript.
Ethics approval and consent to
participate
Not applicable.
Patient consent for publication
Not applicable.
Competing interests
The authors declare that they have no competing
interests.
References
|
1
|
Siegel RL, Miller KD and Jemal A: Cancer
statistics, 2018. CA Cancer J Clin. 68:7–30. 2018. View Article : Google Scholar : PubMed/NCBI
|
|
2
|
Kumar P and Aggarwal R: An overview of
triple-negative breast cancer. Arch Gynecol Obstet. 293:247–269.
2016. View Article : Google Scholar : PubMed/NCBI
|
|
3
|
Foulkes WD, Smith IE and Reis-Filho JS:
Triple-negative breast cancer. N Engl J Med. 363:1938–1948. 2010.
View Article : Google Scholar : PubMed/NCBI
|
|
4
|
Aysola K, Desai A, Welch C, Xu J, Qin Y,
Reddy V, Matthews R, Owens C, Okoli J, Beech DJ, et al: Triple
negative breast cancer-an overview. Hereditary Genet 2013. (Suppl
2):0012013.
|
|
5
|
Saha P and Nanda R: Concepts and targets
in triple-negative breast cancer: Recent results and clinical
implications. Ther Adv Med Oncol. 8:351–359. 2016. View Article : Google Scholar : PubMed/NCBI
|
|
6
|
Xu YL, Yao R, Li J, Zhou YD, Mao F, Pan B
and Sun Q: FOXC1 overexpression is a marker of poor response to
anthracycline-based adjuvant chemotherapy in sporadic
triple-negative breast cancer. Cancer Chemother Pharmacol.
79:1205–1213. 2017. View Article : Google Scholar : PubMed/NCBI
|
|
7
|
Horvath S, Zhang B, Carlson M, Lu KV, Zhu
S, Felciano RM, Laurance MF, Zhao W, Qi S, Chen Z, et al: Analysis
of oncogenic signaling networks in glioblastoma identifies ASPM as
a novel molecular target. Proc Natl Acad Sci USA. 103:17402–17407.
2006. View Article : Google Scholar : PubMed/NCBI
|
|
8
|
Wang L, Tang H, Thayanithy V, Subramanian
S, Oberg AL, Cunningham JM, Cerhan JR, Steer CJ and Thibodeau SN:
Gene networks and microRNAs implicated in aggressive prostate
cancer. Cancer Res. 69:9490–9497. 2009. View Article : Google Scholar : PubMed/NCBI
|
|
9
|
Zhang B and Horvath S: A general framework
for weighted gene co-expression network analysis. Stat Appl Genet
Mol Biol. 4:Article172005. View Article : Google Scholar : PubMed/NCBI
|
|
10
|
Zhao W, Langfelder P, Fuller T, Dong J, Li
A and Hovarth S: Weighted gene coexpression network analysis: State
of the art. J Biopharm Stat. 20:281–300. 2010. View Article : Google Scholar : PubMed/NCBI
|
|
11
|
Chen L, Yuan L, Wang Y, Wang G, Zhu Y, Cao
R, Qian G, Xie C, Liu X, Xiao Y and Wang X: Co-expression network
analysis identified FCER1G in association with progression and
prognosis in human clear cell renal cell carcinoma. Int J Biol Sci.
13:1361–1372. 2017. View Article : Google Scholar : PubMed/NCBI
|
|
12
|
Wan Q, Tang J, Han Y and Wang D:
Co-expression modules construction by WGCNA and identify potential
prognostic markers of uveal melanoma. Exp Eye Res. 166:13–20. 2018.
View Article : Google Scholar : PubMed/NCBI
|
|
13
|
Clarke C, Madden SF, Doolan P, Aherne ST,
Joyce H, O'Driscoll L, Gallagher WM, Hennessy BT, Moriarty M, Crown
J, et al: Correlating transcriptional networks to breast cancer
survival: A large-scale coexpression analysis. Carcinogenesis.
34:2300–2308. 2013. View Article : Google Scholar : PubMed/NCBI
|
|
14
|
Langfelder P and Horvath S: WGCNA: An R
package for weighted correlation network analysis. BMC
Bioinformatics. 9:5592008. View Article : Google Scholar : PubMed/NCBI
|
|
15
|
Langfelder P and Horvath S: WGNCA: an R
package for weighted correlation network analysis. BMC Genetics.
9:5592008.
|
|
16
|
Chen F, Zhu HH, Zhou LF, Li J, Zhao LY, Wu
SS, Wang J, Liu W and Chen Z: Genes related to the very early stage
of ConA-induced fulminant hepatitis: A gene-chip-based study in a
mouse model. BMC Genomics. 11:2402010. View Article : Google Scholar : PubMed/NCBI
|
|
17
|
Liu X, Hu AX, Zhao JL and Chen FL:
Identification of key gene modules for in human osteosarcoma by
co-expression analysis weighted gene co-expression network analysis
(WGCNA). J Cell Biochem. 118:3953–3959. 2017. View Article : Google Scholar : PubMed/NCBI
|
|
18
|
Yuan L, Chen L, Qian K, Wang G, Lu M, Qian
G, Cao X, Jiang W, Xiao Y and Wang X: A novel correlation between
ATP5A1 gene expression and progression of human clear cell renal
cell carcinoma identified by co-expression analysis. Oncol Rep.
39:525–536. 2018.PubMed/NCBI
|
|
19
|
Budczies J, Klauschen F, Sinn BV, Győrffy
B, Schmitt WD, Darb-Esfahani S and Denkert C: Cutoff finder: A
comprehensive and straightforward web application enabling rapid
biomarker cutoff optimization. PLoS One. 7:e518622012. View Article : Google Scholar : PubMed/NCBI
|
|
20
|
Lotia S, Montojo J, Dong Y, Bader GD and
Pico AR: Cytoscape app store. Bioinformatics. 29:1350–1351. 2013.
View Article : Google Scholar : PubMed/NCBI
|
|
21
|
Bindea G, Mlecnik B, Hackl H, Charoentong
P, Tosolini M, Kirilovsky A, Fridman WH, Pagès F, Trajanoski Z and
Galon J: ClueGO: A Cytoscape plug-in to decipher functionally
grouped gene ontology and pathway annotation networks.
Bioinformatics. 25:1091–1093. 2009. View Article : Google Scholar : PubMed/NCBI
|
|
22
|
Lu X, Deng Y, Huang L, Feng B and Liao B:
A co-expression modules based gene selection for cancer
recognition. J Theor Biol. 362:75–82. 2014. View Article : Google Scholar : PubMed/NCBI
|
|
23
|
Deng SP, Zhu L and Huang DS: Mining the
bladder cancer-associated genes by an integrated strategy for the
construction and analysis of differential co-expression networks.
BMC Genomics. 16 (Suppl 3):S42015. View Article : Google Scholar : PubMed/NCBI
|
|
24
|
Montero JC, Esparís-Ogando A, Re-Louhau
MF, Seoane S, Abad M, Calero R, Ocaña A and Pandiella A: Active
kinase profiling, genetic and pharmacological data define mTOR as
an important common target in triple-negative breast cancer.
Oncogene. 33:148–156. 2014. View Article : Google Scholar : PubMed/NCBI
|
|
25
|
Pelicano H, Zhang W, Liu J, Hammoudi N,
Dai J, Xu RH, Pusztai L and Huang P: Mitochondrial dysfunction in
some triple-negative breast cancer cell lines: Role of mTOR pathway
and therapeutic potential. Breast Cancer Res. 16:4342014.
View Article : Google Scholar : PubMed/NCBI
|
|
26
|
Hatem R, El Botty R, Chateau-Joubert S,
Servely JL, Labiod D, de Plater L, Assayag F, Coussy F, Callens C,
Vacher S, et al: Targeting mTOR pathway inhibits tumor growth in
different molecular subtypes of triple-negative breast cancers.
Oncotarget. 7:48206–48219. 2016. View Article : Google Scholar : PubMed/NCBI
|
|
27
|
Massihnia D, Galvano A, Fanale D, Perez A,
Castiglia M, Incorvaia L, Listì A, Rizzo S, Cicero G, Bazan V, et
al: Triple negative breast cancer: Shedding light onto the role of
pi3k/akt/mtor pathway. Oncotarget. 7:60712–60722. 2016. View Article : Google Scholar : PubMed/NCBI
|
|
28
|
Crown J, O'Shaughnessy J and Gullo G:
Emerging targeted therapies in triple-negative breast cancer. Ann
Oncol. 23 (Suppl 6):vi56–65. 2012. View Article : Google Scholar : PubMed/NCBI
|
|
29
|
Paolicchi E, Crea F, Farrar WL, Green JE
and Danesi R: Histone lysine demethylases in breast cancer. Crit
Rev Oncol Hematol. 86:97–103. 2013. View Article : Google Scholar : PubMed/NCBI
|
|
30
|
McGrath J and Trojer P: Targeting histone
lysine methylation in cancer. Pharmacol Ther. 150:1–22. 2015.
View Article : Google Scholar : PubMed/NCBI
|
|
31
|
Li LX, Zhou JX, Calvet JP, Godwin AK,
Jensen RA and Li X: Lysine methyltransferase SMYD2 promotes triple
negative breast cancer progression. Cell Death Dis. 9:3262018.
View Article : Google Scholar : PubMed/NCBI
|
|
32
|
Copeland RA: Molecular pathways: Protein
methyltransferases in cancer. Clin Cancer Res. 19:6344–6350. 2013.
View Article : Google Scholar : PubMed/NCBI
|
|
33
|
McCabe MT, Mohammad HP, Barbash O and
Kruger RG: Targeting histone methylation in cancer. Cancer J.
23:292–301. 2017. View Article : Google Scholar : PubMed/NCBI
|
|
34
|
Habib JG and O'Shaughnessy JA: The
hedgehog pathway in triple-negative breast cancer. Cancer Med.
5:2989–3006. 2016. View
Article : Google Scholar : PubMed/NCBI
|
|
35
|
O'Toole SA, Beith JM, Millar EK, West R,
McLean A, Cazet A, Swarbrick A and Oakes SR: Therapeutic targets in
triple negative breast cancer. J Clin Pathol. 66:530–542. 2013.
View Article : Google Scholar : PubMed/NCBI
|
|
36
|
Jamdade VS, Sethi N, Mundhe NA, Kumar P,
Lahkar M and Sinha N: Therapeutic targets of triple negative breast
cancer: A review. Br J Pharmacol. 172:4228–4237. 2015. View Article : Google Scholar : PubMed/NCBI
|
|
37
|
Di Mauro C, Rosa R, D'Amato V, Ciciola P,
Servetto A, Marciano R, Orsini RC, Formisano L, De Falco S,
Cicatiello V, et al: Hedgehog signalling pathway orchestrates
angiogenesis in triple-negative breast cancers. Br J Cancer.
116:1425–1435. 2017. View Article : Google Scholar : PubMed/NCBI
|
|
38
|
Seitz S, Buchholz S, Schally AV, Weber F,
Klinkhammer-Schalke M, Inwald EC, Perez R, Rick FG, Szalontay L,
Hohla F, et al: Triple negative breast cancers express receptors
for LHRH and are potential therapeutic targets for cytotoxic
LHRH-analogs, AEZS 108 and AEZS 125. BMC Cancer. 14:8472014.
View Article : Google Scholar : PubMed/NCBI
|
|
39
|
Buchholz S, Seitz S, Schally AV, Engel JB,
Rick FG, Szalontay L, Hohla F, Krishan A, Papadia A, Gaiser T, et
al: Triple-negative breast cancers express receptors for
luteinizing hormone-releasing hormone (LHRH) and respond to LHRH
antagonist cetrorelix with growth inhibition. Int J Oncol.
35:789–796. 2009.PubMed/NCBI
|
|
40
|
Föst C, Duwe F, Hellriegel M, Schweyer S,
Emons G and Gründker C: Targeted chemotherapy for triple-negative
breast cancers via LHRH receptor. Oncol Rep. 25:1481–1487.
2011.PubMed/NCBI
|
|
41
|
Buchholz S, Seitz S, Engel JB, Montero A,
Ortmann O, Perez R, Block NL and Schally AV: Search for novel
therapies for triple negative breast cancers (TNBC): Analogs of
luteinizing hormone-releasing hormone (LHRH) and growth
hormone-releasing hormone (GHRH). Horm Mol Biol Clin Investig.
9:87–94. 2012.PubMed/NCBI
|
|
42
|
Kwok CW, Treeck O, Buchholz S, Seitz S,
Ortmann O and Engel JB: Receptors for luteinizing hormone-releasing
hormone (GnRH) as therapeutic targets in triple negative breast
cancers (TNBC). Target Oncol. 10:365–373. 2015. View Article : Google Scholar : PubMed/NCBI
|
|
43
|
Zhai X, Xue Q, Liu Q, Guo Y and Chen Z:
Colon cancer recurrenceassociated genes revealed by WGCNA
coexpression network analysis. Mol Med Rep. 16:6499–6505. 2017.
View Article : Google Scholar : PubMed/NCBI
|
|
44
|
Shay JW, Reddel RR and Wright WE:
Cancer. Cancer and telomeres-an ALTernative to telomerase.
Science. 336:1388–1390. 2012. View Article : Google Scholar : PubMed/NCBI
|
|
45
|
Subhawong AP, Heaphy CM, Argani P, Konishi
Y, Kouprina N, Nassar H, Vang R and Meeker AK: The alternative
lengthening of telomeres phenotype in breast carcinoma is
associated with HER-2 overexpression. Mod Pathol. 22:1423–1431.
2009. View Article : Google Scholar : PubMed/NCBI
|
|
46
|
Napier CE, Huschtscha LI, Harvey A, Bower
K, Noble JR, Hendrickson EA and Reddel RR: ATRX represses
alternative lengthening of telomeres. Oncotarget. 6:16543–16558.
2015. View Article : Google Scholar : PubMed/NCBI
|
|
47
|
Watson LA, Goldberg H and Bérubé NG:
Emerging roles of ATRX in cancer. Epigenomics. 7:1365–1378. 2015.
View Article : Google Scholar : PubMed/NCBI
|
|
48
|
Marinoni I, Kurrer AS, Vassella E, Dettmer
M, Rudolph T, Banz V, Hunger F, Pasquinelli S, Speel EJ and Perren
A: Loss of DAXX and ATRX are associated with chromosome instability
and reduced survival of patients with pancreatic neuroendocrine
tumors. Gastroenterology. 146:453–460.e5. 2014. View Article : Google Scholar : PubMed/NCBI
|
|
49
|
Qadeer ZA, Harcharik S, Valle-Garcia D,
Chen C, Birge MB, Vardabasso C, Duarte LF and Bernstein E:
Decreased expression of the chromatin remodeler ATRX associates
with melanoma progression. J Invest Dermatol. 134:1768–1772. 2014.
View Article : Google Scholar : PubMed/NCBI
|
|
50
|
Yang CY, Liau JY, Huang WJ, Chang YT,
Chang MC, Lee JC, Tsai JH, Su YN, Hung CC and Jeng YM: Targeted
next-generation sequencing of cancer genes identified frequent TP53
and ATRX mutations in leiomyosarcoma. Am J Transl Res. 7:2072–2081.
2015.PubMed/NCBI
|