Introduction
Peripheral T cell lymphoma (PTCL) is a heterogeneous
disease that accounts for 20–30% of all lymphomas in Asia (1–3).
According to the World Health Organization classification (2008)
(4), PTCL consists of 22 different
subtypes of T-cell and NK-cell lymphomas (5,6). The
majority of patients with PTCL experience an aggressive disease
process with a poor survival when treated with frontline therapies,
and there are currently few effective treatment options. Therefore,
PTCL urgently requires further research and novel treatment options
in order to improve the survival of affected patients.
Epigenetics have been receiving increasing attention
with respect to tumor development. Aberrant epigenetic
dysregulations, including DNA methylation, histone modification,
chromatin remodeling, genetic imprinting and random chromosome (X)
inactivation, serve key functions in tumorigenesis. Until now,
several inhibitors of histone deacetylases (HDACs), including
vorinostat, panobinostat and belinostat have been reported to
possess significant clinical value (7). The balance between histone acetylation
and deacetylation is regulated through the opposing family of
enzymes (8), histone acetylases.
HDACs are critical for gene transcription and for the functions of
various cellular proteins (9). The
initiation and progression of a variety of tumor types have also
been demonstrated to be associated with histone acetylation and
deacetylation (10). Increased
expression of HDACs reduces histone acetylation, which is widely
known to occur in cancer. To date, 18 members of the HDAC family
have been identified and may be categorized into four classes
according to their homology, subcellular localization and enzyme
reactions (11). Class I HDACs
include HDACs 1, 2, 3 and 8, which are primarily responsible for
regulating the acetylation of histones. HDACs enhance the
interactions between histones and negatively-charged DNA by
restoring the positive charge, which results in the stabilization
of chromatin conformations, thereby inhibiting gene expression,
particularly that of tumor suppressor genes. HDACs are
overexpressed in solid tumors and hematopoietic malignancies, and
contribute to disease progression and a poor prognosis (12–19).
However, studies regarding the association between the HDAC
expression and the prognosis or clinicopathological characteristics
in PTCL are rare.
Aberrant histone methylation also serves an
important role in tumorigenesis. Polycomb repressive complex 2
(PRC2), existing in distinct multiprotein complexes that bind to
and modify the chromatin of target genes, methylates lysine-27 of
histone H3 (H3K27) (20). PRC2
primarily consists of embryonic ectoderm development, suppressor of
zeste homolog 12, enhancer of zest homolog 2 (EZH2) and
RBAP48/RBBP4 (21). H3K27
methylation may lead to inhibition of gene expression through
transcriptional repression (22).
EZH2, as a catalytic subunit of PRC2, serves a key role in the
epigenetic silencing of target genes (23). Previous studies have revealed that
the upregulation of EZH2 is associated with aggressive progression
and a poor prognosis in a wide variety of tumor types (23). Certain studies on the clinical
significance of EZH2 in malignant B-cell lymphoma have been
reported (24). However, few studies
regarding PTCL in general or its association with EZH2 have been
reported.
The present study systematically studied the
potential associations between HDAC or EZH2 expression and
prognosis in PTCL not otherwise specified (PTCL-NOS),
angioimmunoblastic T-cell lymphoma (AITL), natural killer/T-cell
lymphoma (NK/TCL) and anaplastic large cell lymphoma (ALCL).
Materials and methods
Patient characteristics
A total of 82 patients with previously untreated
PTCL diagnosed by a pathologist were enrolled in the present study
at Tianjin Medical University Cancer Hospital (Tianjin, China)
between January 2007 and December 2015. The median age of all the
evaluated patients was 54 years (range, 17–80 years), with a
male-to-female ratio of 1.6:1. All patients exhibited one of four
subtypes, including PTCL-NOS, AITL, NK/TCL and ALCL. PTCL-NOS was
the most common subtype of PTCL, accounting for 52.4% (43/82),
while AITL accounted for 12.2% (10/82), NK/TCL for 17.1% (14/82)
and ALCL for 18.3% (15/82). Clinicopathological characteristics,
including age, sex, pathological type, clinical stage (Ann
Arbor-Cotswolds stage) (25), B
symptoms, marrow involvement, splenomegaly, lactate dehydrogenase
(LDH) level, β2 microglobulin (B2M) level, white blood cell count
at diagnosis, Ki-67 expression and international prognostic index
(IPI) (26), along with overall
survival (OS), were recorded. The median follow-up time was 45.8
months (range, 4.7–109.3 months). The present retrospective study
was approved by the Institutional Review Board of Tianjin Medical
University Cancer Hospital.
The present study included 51 males (62.2%) and 31
females (37.8%). The mean age was 51.4 years (range, 4–81 years)
and the mean OS time was 21.6 months (range, 1.1–74.6 moths), with
21/82 patients surviving until follow-up. Stages I–II accounted for
32.9% (27/82) of cases and stages III–IV accounted for 67.1%
(55/82). Splenomegaly and Ki-67 expression were observed in 43.9
and 64.6% of patients, respectively. There were 38 (46.3%) low-risk
and 44 (53.7%) high-risk cases, and marrow involvement and
B-symptoms were observed in 23 (28.1%) and 53 (64.6%) cases,
respectively.
Immunohistochemistry
Tissues were collected and fixed in 4% formaldehyde
at room temperature overnight and immunohistochemical staining was
performed on 4-µm formalin-fixed paraffin-embedded sections, which
were provided by the Pathology Department at The Tianjin Medical
University Cancer Hospital. Tissue sections were dewaxed in xylene
at 60°C for 40 min, rehydrated with graded alcohol and rinsed with
water. Briefly, 10 mM citrate buffer (pH 6.0) was used for antigen
retrieval at 120°C for 2.5 min followed by cooling to room
temperature. Freshly prepared 3% hydrogen peroxide in methanol
solution (V30% hydrogen peroxide: Vmethanol
=1:9) was added and tissues were incubated in the dark at room
temperature for 20 min to eliminate endogenous peroxidase activity.
Following rinsing with phosphate-buffered saline, the slides were
incubated with polyclonal rabbit anti-HDAC1 (catalog no. BS6485;
1:100 dilution; Bioworld Technology, Inc., St. Louis Park, MN,
USA), polyclonal rabbit anti-HDAC2 (catalog no. 12922-3-AP; 1:200
dilution; ProteinTech Group, Inc., Chicago, IL, USA) and polyclonal
rabbit anti-EZH2 (catalog no. BS90776; 1:50 dilution; Bioworld
Technology, Inc.) primary antibodies overnight at 4°C. Sections
were subsequently incubated with unconjugated anti-rabbit IgG Ab
secondary antibody (catalog no. TA130015; 1:200 dilution; OriGene
Technologies, Inc., Beijing, China) at 37°C for 90 min, and were
stained with hematoxylin for 3 min at room temperature. Negative
controls were included by omitting the primary antibody. Tissues
were imaged at ×200 and ×400 magnification with an optical
microscope. Prostate and breast cancer tissues were used as
positive controls as these tissues exhibit a high expression of
HDAC1/2 and EZH2, respectively.
Evaluation of
immunohistochemistry
Antibodies against HDAC1/2 and EZH2 proteins were
used to stain the nuclei of lymphoma cells. Immunohistochemical
staining was interpreted based upon the following two parameters:
The staining intensity and the proportion of positively-stained
cells. The number of positively-stained cells was scored as
follows: 0, <5%; 1, >5% and ≤25%; 2, >25% and ≤50%; and 3,
>50% positive cells. The intensity of positivity was scored as
follows: 0, no positivity; 1, weak positivity; 2, moderate
positivity; and 3, strong positivity. The values of the two scores
were then multiplied with a score of <3 as the low expression
group and a score of ≥3 as the high expression group.
Survival and statistical analysis
IBM SPSS version 18.0 (SPSS, Inc., Chicago, IL, USA)
was used for statistical analysis. Associations between HDAC1,
HDAC2 or EZH2 expression and clinicopathological characteristics
were analyzed using the a χ2 test. Correlations between
EZH2 and HDAC1/2 expression were analyzed using Phi coefficient
analysis. Univariate OS rates were obtained using the Kaplan-Meier
method and the log-rank test. OS periods were defined as the
intervals between primary surgery and the last follow-up visit or
mortality from any cause. The Cox proportional hazards model was
used to evaluate the associations between clinicopathological
factors and survival rates. The hazard ratio (HR) and associated
95% confidence interval (CI) were calculated for each variable.
P<0.05 was considered to indicate a statistically significant
difference.
Results
Correlation between EZH2 and HDAC1 and
HDAC2 expression in PTCL
The percentages of patients expressing EZH2, HDAC1
and HDAC2 were 64.6% (53/82), 61.0% (50/82) and 57.3% (47/82),
respectively, (staining intensity score ≥3). Table I presents the expression of these
biomarkers in PTCL, PTCL-NOS, AITL, NK/TCL and ALCL. Strong nuclear
staining for EZH2, HDAC1 and HDAC2 were observed in each subtype.
High EZH2 expression was observed in 29/43 PTCL-NOS (67.5%), 6/10
AITL (60%), 7/14 NK/TCL (50%) and 11/15 ALCL (73.3%) cases. High
HDAC1 expression was observed in 24/43 PTCL-NOS (55.8%), 5/10 AITL
(50%), 8/14 NK/TCL (57.1%) and 13/15 ALCL (86.7%) cases. High HDAC2
expression was observed in 25/43 PTCL-NOS (58.1%), 6/10 AITL (60%),
8/14 NK/TCL (57.1%) and 8/15 ALCL (53.3%) cases. Representative
EZH2 and HDAC1/2 immunostaining are presented in Fig. 1.
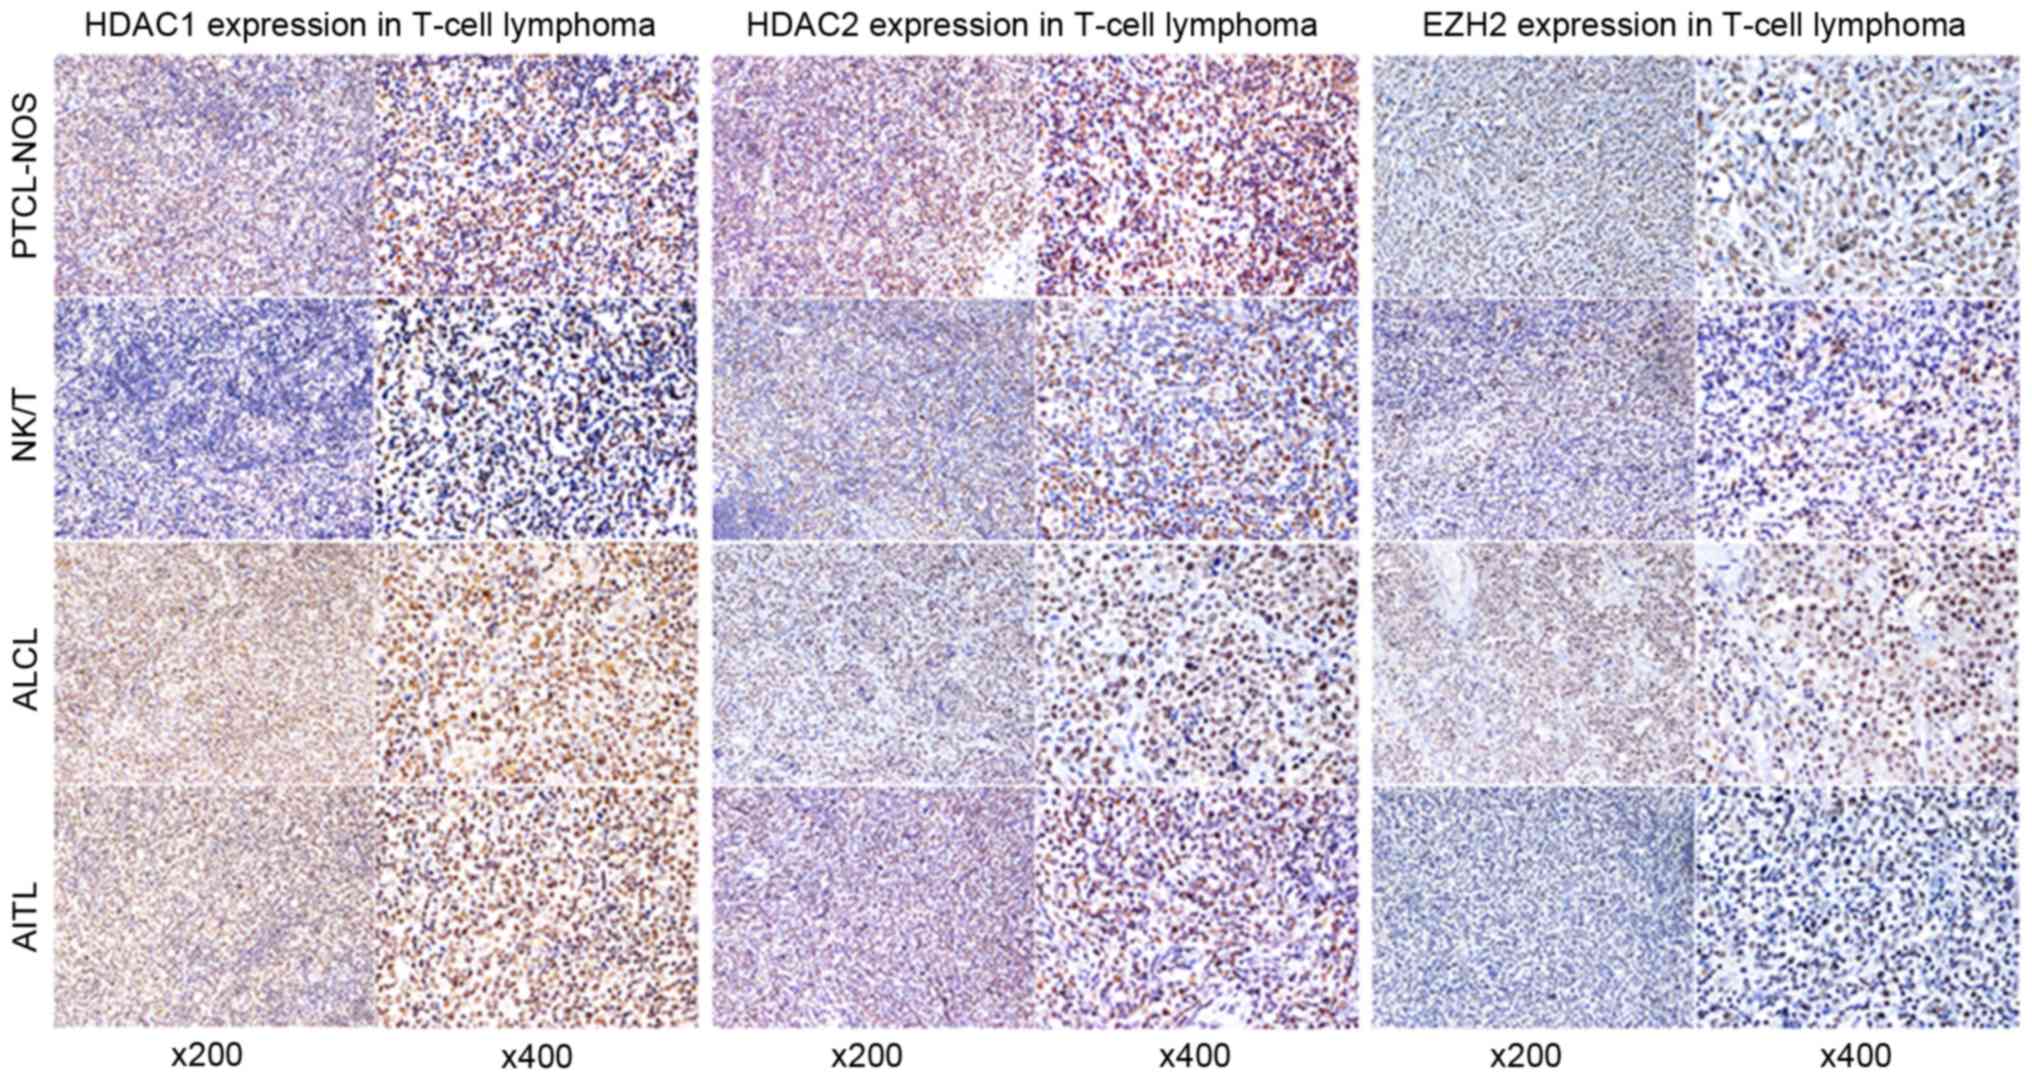 | Figure 1.Representative immunohistochemical
features of HDAC1 (left), HDAC2 (middle), and EZH2 (right) in
PTCL-NOS, ALCL, NK/T and AITL. All images were captured at ×200 and
×400 magnifications. HDAC, histone deacetylase; EZH2, enhancer of
zeste homolog 2; PTCL-NOS, peripheral T cell lymphoma not otherwise
specified; ALCL, anaplastic large cell lymphoma; NK/T, natural
killer/T-cell; AITL, angioimmunoblastic T-cell lymphoma. |
 | Table I.EZH2 and HDAC1/2 expression in
PTCL. |
Table I.
EZH2 and HDAC1/2 expression in
PTCL.
| Neoplasm | EZH2 | HDAC1 | HDAC2 |
|---|
| PTCL | 53/82 | 50/82 | 47/82 |
| PTCL-NOS | 29/43 | 24/43 | 25/43 |
| AICL | 6/10 | 5/10 | 6/10 |
| NK/TCL | 7/14 | 8/14 | 8/14 |
| ALCL | 11/15 | 13/15 | 8/15 |
Phi coefficient analysis demonstrated that EZH2
expression was correlated with HDAC1 and HDAC2 expression (r=0.297
and r=0.306, respectively; P<0.01). Of the four subtypes, the
correlation between EZH2 and HDAC2 expression was only observed in
patients with PTCL-NOS (r=0.517; P<0.01). However, the
correlation between EZH2 and HDAC1 was observed in patients with
ALCL (r=0.577; P<0.05) (Table
II).
| Table II.Correlations between EZH2 and HDAC1/2
in four subtypes of PTCL. |
Table II.
Correlations between EZH2 and HDAC1/2
in four subtypes of PTCL.
|
| PTCL | PTCL-NOS | AICL | NK/TCL | ALCL |
|---|
|
|
|
|
|
|
|
|---|
| Comparison | HDAC1 | HDAC2 | HDAC1 | HDAC2 | HDAC1 | HDAC2 | HDAC1 | HDAC2 | HDAC1 | HDAC2 |
|---|
| EZH2 | 0.007a | 0.005a | 0.068 |
<0.001a | 1.000 | 0.242 | 0.317 | 0.031 | 0.009a | 0.109 |
| Correlation
coefficient | 0.297 | 0.306 |
| 0.517 |
|
|
|
| 0.577 |
|
Association between EZH2, HDAC1 and
HDAC2 expression and clinicopathological characteristics in
PTCL
In patients with PTCL, high EZH2 expression was
significantly associated with the presence of B symptoms (P=0.022),
elevated LDH levels (P=0.029), elevated B2M levels (P=0.014) and a
high white blood cell count (P=0.010). High HDAC2 expression was
significantly associated with sex (P=0.016), Marrow involvement
(P=0.07), advanced clinical stage (P=0.005), a high IPI score
(P=0.032) and elevated B2M levels (P=0.037). High HDAC1 expression
was only significantly associated with a high IPI score (P=0.043;
Table III).
| Table III.Correlations between EZH2/HDAC1/2
expression and the clinicopathological characteristics in PTCL. |
Table III.
Correlations between EZH2/HDAC1/2
expression and the clinicopathological characteristics in PTCL.
|
| EZH2
expression | HDAC1
expression | HDAC2
expression |
|---|
| Characteristic | High | Low | P-value | High | Low | P-value | High | Low | P-value |
|---|
| Sex |
|
Male | 30 (58.8) | 21 (41.2) | 0.158 | 31 (60.8) | 20 (39.2) | 0.964 | 24 (47.1) | 27 (52.9) | 0.016b |
|
Female | 23 (74.2) | 8 (25.8) |
| 19 (61.3) | 12 (38.7) |
| 23 (74.2) | 8 (25.8) |
|
| Age, years |
|
≤60 | 32 (65.3) | 17 (34.7) | 0.877 | 34 (69.4) | 15 (30.6) | 0.057 | 30 (61.2) | 19 (38.8) | 0.383 |
|
>60 | 21 (63.6) | 12 (36.4) |
| 16 (48.5) | 17 (51.5) |
| 17 (51.5) | 16 (48.5) |
|
| B-symptoms |
|
Present | 39 (73.6) | 14 (26.4) | 0.022b | 36 (67.9) | 17 (32.1) | 0.081 | 31 (58.5) | 22 (41.5) | 0.771 |
|
Absent | 14 (48.3) | 15 (51.7) |
| 14 (48.3) | 15 (51.7) |
| 16 (55.2) | 13 (44.8) |
|
| Marrow
involvement |
|
Present | 18 (78.3) | 5 (21.7) | 0.107 | 16 (69.6) | 7 (30.4) | 0.319 | 17 (85.0) | 3 (15.0) | 0.007 |
|
Absent | 35 (59.3) | 24 (40.7) |
| 34 (57.6) | 25 (42.4) |
| 30 (50.8) | 29 (49.2) |
|
| Splenomegaly |
|
Present | 21 (58.3) | 15 (41.7) | 0.291 | 20 (55.6) | 16 (44.4) | 0.373 | 22 (61.1) | 14 (38.9) | 0.555 |
|
Absent | 32 (69.6) | 14 (30.4) |
| 30 (65.2) | 16 (34.8) |
| 31 (67.4) | 15 (32.6) |
|
| Stage |
|
I–II | 14 (53.8) | 12 (46.2) | 0.164 | 12 (46.2) | 14 (53.8) | 0.061 | 9 (34.6) | 17 (65.4) | 0.005a |
|
III–IV | 39 (69.6) | 17 (30.4) |
| 38 (67.9) | 18 (32.1) |
| 38 (67.9) | 18 (32.1) |
|
| IPI |
|
0–2 | 27 (60.0) | 18 (40.0) | 0.333 | 23 (51.1) | 22 (48.9) | 0.043 | 21 (46.7) | 24 (53.3) | 0.032b |
|
3–5 | 26 (70.3) | 11 (29.7) |
| 27 (73.0) | 10 (27.0) |
| 26 (70.3) | 11 (29.7) |
|
| B2M |
|
>Upper limit of normal | 35 (76.1) | 11 (23.9) | 0.014b | 32 (69.6) | 14 (30.4) | 0.071 | 31 (67.4) | 15 (32.6) | 0.037b |
|
Normal | 18 (50.0) | 18 (50.0) |
| 18 (50.0) | 18 (50.0) |
| 16 (44.4) | 20 (55.6) |
|
| LDH |
|
>Upper limit of normal | 40 (72.7) | 15 (27.3) | 0.029b | 30 (61.2) | 19 (38.8) | 0.813 | 34 (61.8) | 21 (38.2) | 0.240 |
|
Normal | 13 (48.1) | 14 (51.9) |
| 14 (58.3) | 10 (41.7) |
| 13 (48.1) | 14 (51.9) |
|
| WBC |
|
>Upper limit of normal | 11 (44.0) | 14 (56.0) | 0.010b | 12 (48.0) | 13 (52.0) | 0.111 | 11 (44.0) | 14 (56.0) | 0.106 |
|
Normal | 42 (73.7) | 15 (26.3) |
| 38 (66.7) | 19 (33.3) |
| 36 (63.2) | 21 (36.8) |
|
| Ki-67 |
|
≥30% | 38 (71.7) | 15 (28.3) | 0.070 | 33 (62.3) | 20 (37.7) | 0.746 | 32 (60.4) | 21 (39.6) | 0.449 |
|
<30% | 15 (51.7) | 14 (48.3) |
| 17 (58.6) | 12 (41.4) |
| 15 (51.7) | 14 (48.3) |
|
| Pathology |
|
PTCL-NOS | 26 (70.3) | 11 (29.7) | 0.440 | 22 (59.5) | 15 (40.5) | 0.212 | 26 (70.3) | 11 (29.7) | 0.962 |
|
Other | 19 (79.2) | 5 (20.8) |
| 18 (75) | 6 (25) |
| 17 (70.8) | 7 (29.2) |
|
In PTCL-NOS patients, high EZH2 expression was
significantly associated with advanced clinical stage (P=0.021) and
high Ki-67 expression (P=0.021), while overexpression of HDAC1 was
significantly associated with advanced clinical stage (P=0.029),
elevated B2M levels (P=0.004) and elevated LDH levels (P=0.028).
The overexpression of HDAC2 was significantly associated with
advanced clinical stage (P=0.000; Table
IV). However, the associations between high expression and low
expression of these proteins were insignificant in NK/TCL patients
(Table V).
| Table IV.Correlations between the EZH2/HDAC1/2
expression and the clinicopathological characteristics in
PTCL-NOS. |
Table IV.
Correlations between the EZH2/HDAC1/2
expression and the clinicopathological characteristics in
PTCL-NOS.
|
| EZH2
expression | HDAC1
expression | HDAC2
expression |
|---|
|
|
|
|
|
|---|
| Characteristic | High | Low | P-value | High | Low | P-value | High | Low | P-value |
|---|
| Sex |
|
Male | 20 (62.5) | 12 (37.5) | 0.420 | 18 (56.2) | 14 (43.8) | 0.213 | 17 (53.1) | 15 (46.9) | 0.434 |
|
Female | 9 (81.8) | 2 (18.2) |
| 14 (73.7) | 5 (26.3) |
| 8 (72.7) | 3 (27.3) |
|
| Age, years |
|
≤60 | 15 (73.7) | 9 (26.3) | 0.437 | 16 (66.7) | 8 (33.3) | 0.107 | 14 (58.3) | 10 (41.7) | 0.977 |
|
>60 | 14 (62.5) | 5 (37.5) |
| 8 (42.1) | 11 (57.9) |
| 11 (57.9) | 8 (42.1) |
|
| B-symptoms |
|
Present | 20 (74.1) | 7 (25.9) | 0.228 | 17 (63.0) | 10 (37.0) | 0.220 | 16 (59.3) | 11 (40.7) | 0.847 |
|
Absent | 9 (56.3) | 7 (43.7) |
| 7 (43.8) | 9 (56.3) |
| 9 (56.2) | 7 (43.8) |
|
| Marrow
involvement |
|
Present | 12 (85.7) | 2 (14.3) | 0.153 | 8 (57.1) | 6 (42.9) | 0.903 | 11 (78.6) | 3 (21.4) | 0.059 |
|
Absent | 17 (58.6) | 12 (41.4) |
| 16 (55.2) | 13 (44.8) |
| 14 (48.3) | 15 (51.7) |
|
| Splenomegaly |
|
Present | 11 (55.0) | 9 (45.0) | 0.104 | 10 (50.0) | 10 (50.0) | 0.474 | 9 (45.0) | 11 (55.0) | 0.103 |
|
Absent | 18 (78.3) | 5 (21.7) |
| 14 (60.9) | 9 (39.1) |
| 16 (69.6) | 7 (30.4) |
|
| Stage |
|
I–II | 5 (38.5) | 8 (61.5) | 0.021b | 4 (30.8) | 9 (69.2) | 0.029b | 2 (47.4) | 11 (52.6) | 0.000a |
|
III–IV | 24 (80.0) | 6 (20.0) |
| 20 (66.7) | 10 (33.3) |
| 23 (80.9) | 7 (19.1) |
|
| IPI |
|
0–2 | 14 (60.9) | 9 (39.1) | 0.324 | 10 (43.5) | 13 (56.5) | 0.081 | 11 (47.8) | 12 (52.2) | 0.142 |
|
3–5 | 15 (75.0) | 5 (25.0) |
| 14 (70.0) | 6 (30.0) |
| 4 (70.0) | 6 (30.0) |
|
| B2M |
|
>Upper limit of normal | 18 (75.0) | 6 (25.0) | 0.235 | 18 (75.0) | 6 (25.0) | 0.004a | 15 (62.5) | 9 (37.5) | 0.515 |
|
Normal | 11 (57.9) | 8 (42.1) |
| 6 (31.6) | 13 (68.4) |
| 10 (52.6) | 9 (47.4) |
|
| LDH |
|
>Upper limit of normal | 20 (76.9) | 6 (23.1) | 0.101 | 18 (69.2) | 8 (30.8) | 0.028 | 16 (61.5) | 10 (38.5) | 0.576 |
|
Normal | 9 (52.9) | 8 (47.1) |
| 6 (35.3) | 11 (64.7) |
| 9 (52.9) | 8 (47.1) |
|
| WBC |
|
>Upper limit of normal | 7 (50.0) | 7 (50.0) | 0.177 | 7 (50.0) | 7 (50.0) | 0.594 | 8 (57.1) | 6 (42.9) | 0.927 |
|
Normal | 22 (78.6) | 7 (21.4) |
| 17 (58.6) | 12 (41.4) |
| 17 (58.6) | 12 (41.4) |
|
| Ki-67 |
|
≥30% | 21 (80.8) | 5 (19.2) | 0.021b | 15 (57.7) | 11 (42.3) | 0.759 | 17 (65.4) | 9 (34.6) | 0.234 |
|
<30% | 8 (47.1) | 9 (52.9) |
| 9 (52.9) | 8 (47.1) |
| 8 (47.1) | 9 (52.9) |
|
| Table V.Correlations between the EZH2/HDAC1/2
expression and the clinicopathological characteristics in
NK/TCL. |
Table V.
Correlations between the EZH2/HDAC1/2
expression and the clinicopathological characteristics in
NK/TCL.
|
| EZH2
expression | HDAC1
expression | HDAC2
expression |
|---|
|
|
|
|
|
|---|
| Characteristic | High | Low | P-value | High | Low | P-value | High | Low | P-value |
|---|
| Sex |
|
Male | 2 (33.3) | 4 (66.7) | 0.589 | 3 (50.0) | 3 (50.0) | 1.000 | 1 (16.7) | 5 (83.3) | 0.035a |
|
Female | 5 (62.5) | 3 (37.5) |
| 5 (62.5) | 3 (37.5) |
| 7 (87.5) | 1 (12.5) |
|
| Age, years |
|
≤60 | 6 (85.7) | 6 (14.3) | 1.000 | 6 (50.0) | 6 (50.0) | 0.115 | 7 (58.3) | 5 (41.7) | 0.826 |
|
>60 | 1 (85.7) | 1 (14.3) |
| 2 (100.0) | 0 (00.0) |
| 1 (50.0) | 1 (50.0) |
|
| B-symptoms |
|
Present | 6 (60.0) | 4 (40.0) | 0.554 | 7 (70.0) | 3 (30.0) | 0.348 | 6 (60.0) | 4 (40.0) | 1.000 |
|
Absent | 1 (25.0) | 3 (75.0) |
| 1 (25.0) | 3 (75.0) |
| 2 (50.0) | 2 (50.0) |
|
| Marrow
involvement |
|
Present | 2 (66.7) | 1 (33.3) | 1.000 | 2 (66.7) | 1 (33.3) | 1.000 | 2 (66.7) | 1 (33.3) | 1.000 |
|
Absent | 5 (45.5) | 6 (54.5) |
| 6 (54.5) | 5 (45.5) |
| 6 (54.5) | 5 (45.5) |
|
| Splenomegaly |
|
Present | 3 (50.0) | 3 (50.0) | 1.000 | 4 (66.7) | 2 (33.3) | 0.938 | 5 (83.3) | 1 (16.7) | 0.242 |
|
Absent | 4 (50.0) | 4 (50.0) |
| 4 (50.0) | 4 (50.0) |
| 3 (37.5) | 5 (62.5) |
|
| Stage |
|
I–II | 2 (50.0) | 2 (50.0) | 1.000 | 2 (50.0) | 2 (50.0) | 1.000 | 1 (25.0) | 3 (75.0) | 0.348 |
|
III–IV | 5 (50.0) | 5 (50.0) |
| 6 (60.0) | 4 (40.0) |
| 7 (70.0) | 3 (30.0) |
|
| IPI |
|
0–2 | 4 (50.0) | 4 (50.0) | 1.000 | 5 (62.5) | 3 (37.5) | 1.000 | 3 (37.5) | 5 (62.5) | 0.242 |
|
3–5 | 3 (50.0) | 3 (50.0) |
| 3 (50.0) | 3 (50.0) |
| 5 (83.3) | 1 (16.7) |
|
| B2M |
|
>Upper limit of normal | 6 (66.7) | 3 (33.3) | 0.265 | 5 (55.6) | 4 (44.4) | 1.000 | 6 (66.7) | 3 (33.3) | 0.687 |
|
Normal | 1 (20.0) | 4 (80.0) |
| 3 (60.0) | 2 (40.0) |
| 2 (40.0) | 3 (60.0) |
|
| LDH |
|
>Upper limit of normal | 6 (60.0) | 4 (40.0) | 0.554 | 5 (50.0) | 5 (50.0) | 0.798 | 7 (70.0) | 3 (30.0) | 0.348 |
|
Normal | 1 (33.3) | 3 (66.7) |
| 3 (75.0) | 1 (25.0) |
| 1 (25.0) | 3 (75.0) |
|
| WBC |
|
>Upper limit of normal | 0 (100.0) | 3 (00.0) | 0.193 | 1 (33.3) | 2 (66.7) | 0.778 | 0 (00.0) | 3 (100.0) | 0.110 |
|
Normal | 7 (63.7) | 4 (36.3) |
| 7 (63.6) | 4 (36.4) |
| 8 (72.7) | 3 (27.3) |
|
| Ki-67 |
|
≥30% | 4 (36.4) | 7 (63.6) | 0.193 | 5 (45.5) | 6 (54.5) | 0.301 | 5 (45.5) | 6 (54.5) | 0.301 |
|
<30% | 3 (100.0) | 0 (00.0) |
| 3 (100.0) | 0 (00.0) |
| 3 (100.0) | 0 (00.0) |
|
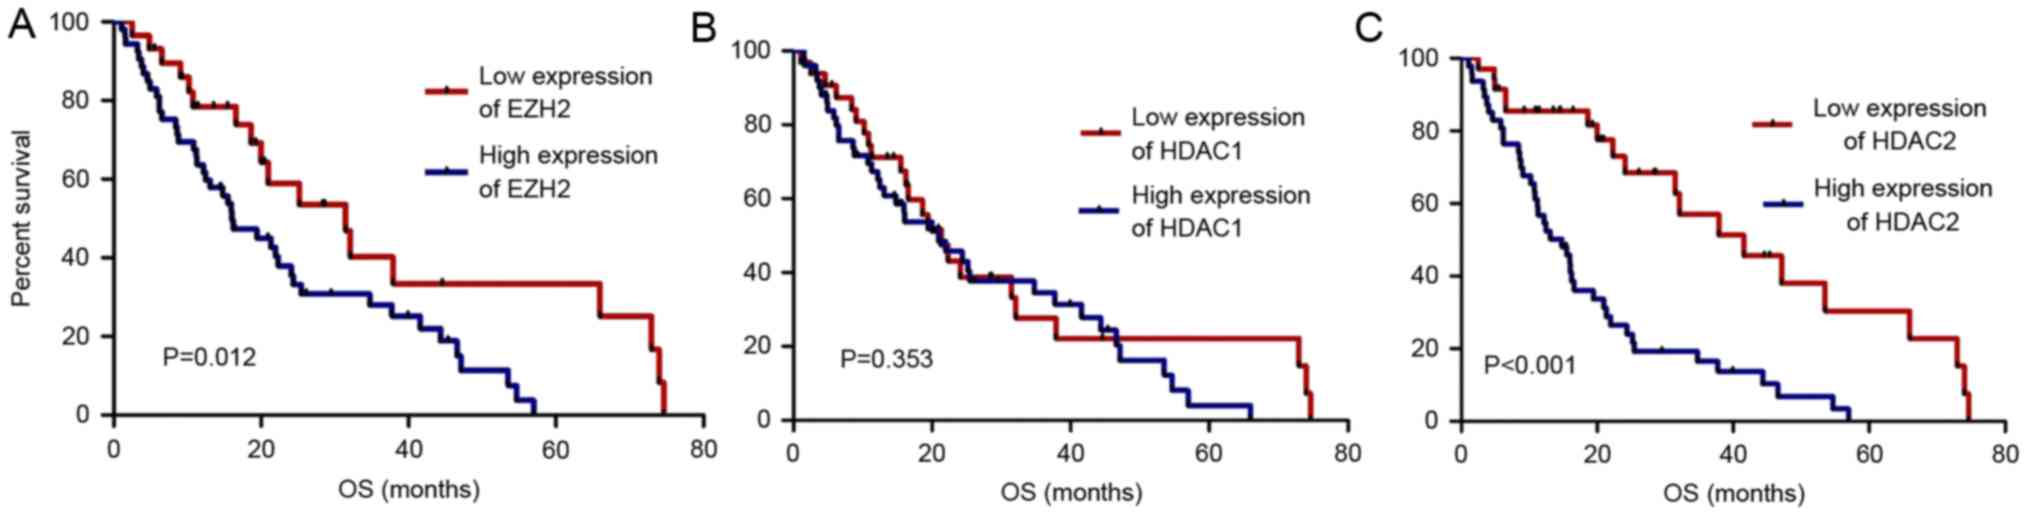
Correlation between EZH2, HDAC1 and
HDAC2, and survival
The median follow-up period was 45.8 months (range,
4.7–109.3 months). The 3-year OS rates of the high and low EZH2
expression PTCL groups were 28.0 and 40.2%, respectively (P=0.012).
The 3-year OS rates of the high and low HDAC2 expression groups
were 16.5 and 57.0%, respectively (P<0.01). However, the 3-year
OS rates of the high and low HDAC1 expression groups exhibited had
no significant differences (P>0.05). The OS rate was
significantly poorer in patients with PTCL exhibiting high EZH2 and
HDAC2 expression compared with those exhibiting low expression
(P<0.05; Fig. 2). This finding
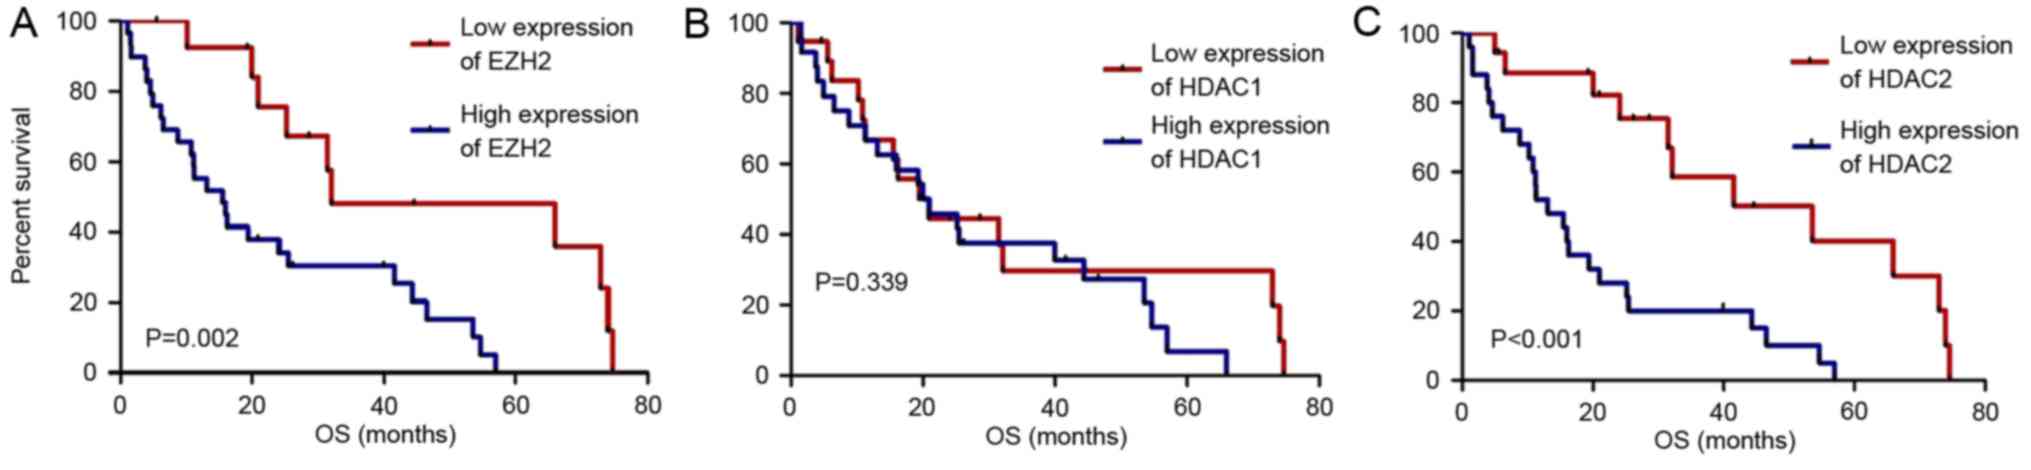
was also observed in the PTCL-NOS subtype (P<0.05; Fig. 3).
Multivariate analysis of age, sex, Ki-67 expression,
IPI, clinical stage, B symptoms, marrow involvement, LDH and B2M
levels during diagnosis was performed. The results revealed that
advanced clinical stage (P=0.024; HR, 0.360; 95% CI, 0.148–0.875)
and HDAC2 expression (P=0.027; HR, 0.462; 95% CI, 0.234–0.914), but
not EZH2 and HDAC1 expression, were significantly associated with a
poor OS, indicating that HDAC2 may be an independent prognostic
factor in PTCL (Table VI). Similar
results were observed in PTCL-NOS (Table VII).
| Table VI.Multivariate analysis of overall
survival in PTCL. |
Table VI.
Multivariate analysis of overall
survival in PTCL.
|
| Overall
survival |
|---|
|
|
|
|---|
| Factor | OR (95% CI) | P-value |
|---|
| LDH |
| Upper
limit of normal vs. normal | 0.574
(0.272–1.211) | 0.145 |
| B2M |
| Upper
limit of normal vs. normal | 0.631
(0.344–1.159) | 0.138 |
| IPI |
| 0–2 vs.
3–5 | 1.170
(0.535–2.559) | 0.694 |
| Ki-67 |
| >31%
vs. ≤30% | 0.556
(0.273–1.131) | 0.105 |
| Clinical
staging |
| III–IV
vs. I–II | 0.360
(0.148–0.875) | 0.024a |
| Presence of B
symptoms |
| Present
vs. absent | 0.642
(0.342–1.207) | 0.169 |
| Marrow
involvement |
| Present
vs. absent | 0.883
(0.480–1.627) | 0.690 |
| Sex |
| Female
vs. male | 0.805
(0.450–1.440) | 0.456 |
| Age |
| >60
vs. ≤60 | 1.039
(0.560–1.929) | 0.902 |
| Expression of
HDAC2 |
| Low
expression vs. high expression | 0.462
(0.234–0.914) | 0.027a |
| Table VII.Multivariate analysis of overall
survival in PTCL-NOS. |
Table VII.
Multivariate analysis of overall
survival in PTCL-NOS.
|
| Overall
survival |
|---|
|
|
|
|---|
| Factor | OR (95% CI) | P-value |
|---|
| LDH |
| Upper
limit of normal vs. normal | 0.649
(0.253–1.665) | 0.368 |
| B2M |
| Upper
limit of normal vs. normal | 0.633
(0.213–1.879) | 0.410 |
| IPI |
| 0–2 vs.
3–5 | 1.012
(0.300–3.411) | 0.985 |
| Ki-67 |
| >31%
vs. ≤30% | 0.476
(0.175–1.294) | 0.146 |
| Clinical
staging |
| III–IV
vs. I–II | 0.444
(0.119–1.653) | 0.226 |
| Presence of B
symptoms |
| Present
vs. absent | 0.468
(0.185–1.185) | 0.109 |
| Marrow
involvement |
| Present
vs. absent | 0.640
(0.274–1.495) | 0.303 |
| Sex |
| Female
vs. male | 0.418
(0.162–1.079) | 0.072 |
| Age |
| >60
vs. ≤60 | 0.973
(0.418–2.265) | 0.949 |
| Expression of
HDAC2 |
| Low
expression vs. high expression | 2.990
(1.102–8.112) | 0.032a |
Discussion
Tumorigenesis involves gene mutation and
epigenetics, which contribute to the heritable alteration of
cellular biological functions. Epigenetics include DNA methylation,
histone acetylation, chromatin remodeling, genetic imprinting and
random chromosome (X) inactivation. In particular, histone
methylation and acetylation serve critical roles in tumor
development. Histone deacetylases and methyltransferases have
become primary antitumorigenic targets in hematological and solid
malignancies. However, few studies have been reported on the
clinical significance of HDAC and EZH2 expression in PTCL.
The present study demonstrated that the patients
with B symptoms, elevated LDH or β2-MG levels exhibited high EZH2
expression in their PTCL tissues, and that these factors led to a
poorer OS (P<0.05). Based upon analysis of the pathological
subtypes of PTCL, high EZH2 expression was significantly associated
with advanced clinical stage and high Ki-67 expression in PTCL-NOS.
The enzymatic hyperactivity of EZH2 has previously been observed in
a variety of hematological malignancies, including diffused large
B-cell lymphoma, follicular lymphoma, mantle cell lymphoma
(27), T-lymphoblastic lymphoma
(28) and adult T-cell
leukemia/lymphoma (29). The results
of the present study were consistent with those of previous reports
that EZH2 expression is also associated with an aggressive clinical
outcome (30). The results of the
present study suggested that EZH2 may serve as a target for
anticancer therapy in PTCL and that further research on the
mechanisms of EZH2 is warranted.
Furthermore, the present study revealed that HDAC
expression was associated with EZH2 expression in PTCL, which was
consistent with the results of a previous study (31). HDAC1, HDAC2 and EZH2 serve important
roles in DNA repair by regulating the dynamic balance between
H3K27ac and H3K27me3. This balance may be disturbed by DNA damage,
resulting in tumorigenesis (31,32).
The catalysis of HDAC1 and HDAC2 contributes to the
reduction in H3K27ac levels, resulting in further methylation of
H3K27 by EZH2. C-myc, an important transcription regulatory factor,
regulates >70% of gene expression, including that of EZH2. C-myc
upregulates the expression of EZH2 by modulating the special
microRNAs in B-cell lymphoma cells (33). C-myc is overexpressed in several
subsets of T-cell lymphoma (30).
Therefore, several unknown associations may exist between
expression of HDACs and EZH2 in PTCL.
HDACs render the gene expression profiling aberrant
by deacetylating either histone or transcription factors (34–36). The
US Food and Drug Administration has approved four HDAC inhibitors
(HDACIs) for the treatment of cutaneous T-cell lymphoma, and the
clinical application of HDACIs in other subtypes of T-cell lymphoma
has received increasing attention. Based upon the results of
clinical trials, three HDACIs have received conditional marketing
authorization for the treatment of adult patients with relapsed or
refractory aggressive PTCL. However, the clinical significance of
HDAC expression in PTCL is poorly understood.
The present study demonstrated that high expression
of HDAC2 frequently occurred in PTCL patients with adverse
clinicopathological characteristics, including advanced clinical
stage, high IPI score and elevated B2M (P<0.05). However, for
PTCL subtype analysis, high HDAC2 expression was only associated
with the clinical stage in patients with PTCL-NOS, and was only
associated with patient sex in patients with NK/TCL. In addition,
in patients with the PTCL-NOS subtype, high HDAC2 expression
resulted in a shorter OS time than that in those exhibiting a low
HDAC2 expression (P<0.05). This association was observed in all
PTCL patients. According to the results of the present study, HDAC2
may be a possible prognostic marker in patients with PTCL,
particularly in those with the PTCL-NOS subtype. This phenomenon
was not observed in the other subtypes of PTCL. One possible reason
for this is the small number of patients enrolled in the present
study (37,38). Therefore, further studies on
assessing the clinical significance of HDAC2 were required in all
PTCL subtypes.
In conclusion, the present study observed that PTCL
patients with high expression of EZH2 and HDAC2 usually exhibit a
poorer prognosis, and that HDAC2 may be a prognostic marker in
PTCL, particularly for patients with the PTCL-NOS subtype.
Acknowledgements
Not applicable.
Funding
The present study was supported by the Natural
Science Foundation of China (grant nos. 81770213 and 81402945),
Tianjin Medical University Cancer Institute and Hospital Foundation
(grant no. 1504) and the Key Research Projects of Tianjin Municipal
Health Bureau (grant nos. 2015KZ081 and 15KG145).
Availability of data and materials
The datasets used and/or analyzed during the current
study are available from the corresponding author on reasonable
request.
Authors' contributions
HZ and XW designed the study. HZ, HL, XJ and XW
acquired and analyzed the data, drafted the manuscript. GH, LK, TZ,
LL, YP, QZ, BM, XW and HW acquired the data and critically revised
the manuscript. All authors read and approved the final manuscript,
and are accountable for all aspects of the study.
Ethics statement and consent to
participate
The present retrospective study was approved by the
Institutional Review Board of Tianjin Medical University Cancer
Hospital.
Patient consent for publication
Not applicable.
Competing interests
The authors declare that they have no competing
interests.
References
|
1
|
Cai MY, Hou JH, Rao HL, Luo RZ, Li M, Pei
XQ, Lin MC, Guan XY, Kung HF, Zeng YX and Xie D: High expression of
H3K27me3 in human hepatocellular carcinomas correlates closely with
vascular invasion and predicts worse prognosis in patients. Mol
Med. 17:12–20. 2011. View Article : Google Scholar : PubMed/NCBI
|
|
2
|
He LR, Liu MZ, Li BK, Rao HL, Liao YJ,
Guan XY, Zeng YX and Xie D: Prognostic impact of H3K27me3
expression on locoregional progression after chemoradiotherapy in
esophageal squamous cell carcinoma. BMC Cancer. 9:4612009.
View Article : Google Scholar : PubMed/NCBI
|
|
3
|
Liu J, Li Y, Liao Y, Mai S, Zhang Z, Liu
Z, Jiang L, Zeng Y, Zhou F and Xie D: High expression of H3K27me3
is an independent predictor of worse outcome in patients with
urothelial carcinoma of bladder treated with radical cystectomy.
Biomed Res Int. 2013:3904822013. View Article : Google Scholar : PubMed/NCBI
|
|
4
|
Sabattini E, Bacci F, Sagramoso C and
Pileri S: WHO classification of tumours of haematopoietic and
lymphoid tissues in 2008: An overview. Pathologica. 102:83–87.
2010.PubMed/NCBI
|
|
5
|
Chen X, Song N, Matsumoto K, Nanashima A,
Nagayasu T, Hayashi T, Ying M, Endo D, Wu Z and Koji T: High
expression of trimethylated histone H3 at lysine 27 predicts better
prognosis in non-small cell lung cancer. Int J Oncol. 43:1467–1480.
2013. View Article : Google Scholar : PubMed/NCBI
|
|
6
|
Wei Y, Xia W, Zhang Z, Liu J, Wang H,
Adsay NV, Albarracin C, Yu D, Abbruzzese JL, Mills GB, et al: Loss
of trimethylation at lysine 27 of histone H3 is a predictor of poor
outcome in breast, ovarian, and pancreatic cancers. Mol Carcinog.
47:701–706. 2008. View
Article : Google Scholar : PubMed/NCBI
|
|
7
|
Bassett SA and Barnett MP: The role of
dietary histone deacetylases (HDACs) inhibitors in health and
disease. Nutrients. 6:4273–4301. 2014. View Article : Google Scholar : PubMed/NCBI
|
|
8
|
Strahl BD and Allis CD: The language of
covalent histone modifications. Nature. 403:41–45. 2000. View Article : Google Scholar : PubMed/NCBI
|
|
9
|
Bannister AJ and Kouzarides T: Regulation
of chromatin by histone modifications. Cell Res. 21:381–395. 2011.
View Article : Google Scholar : PubMed/NCBI
|
|
10
|
Glozak MA and Seto E: Histone deacetylases
and cancer. Oncogene. 26:5420–5432. 2007. View Article : Google Scholar : PubMed/NCBI
|
|
11
|
Smith KT and Workman JL: Histone
deacetylase inhibitors: Anticancer compounds. Int J Biochem Cell
Biol. 41:21–25. 2009. View Article : Google Scholar : PubMed/NCBI
|
|
12
|
Weichert W, Denkert C, Noske A,
Darb-Esfahani S, Dietel M, Kalloger SE, Huntsman DG and Köbel M:
Expression of class I histone deacetylases indicates poor prognosis
in endometrioid subtypes of ovarian and endometrial carcinomas.
Neoplasia. 10:1021–1027. 2008. View Article : Google Scholar : PubMed/NCBI
|
|
13
|
Halkidou K, Gaughan L, Cook S, Leung HY,
Neal DE and Robson CN: Upregulation and nuclear recruitment of
HDAC1 in hormone refractory prostate cancer. Prostate. 59:177–189.
2004. View Article : Google Scholar : PubMed/NCBI
|
|
14
|
Weichert W, Röske A, Niesporek S, Noske A,
Buckendahl AC, Dietel M, Gekeler V, Boehm M, Beckers T and Denkert
C: Class I histone deacetylase expression has independent
prognostic impact in human colorectal cancer: Specific role of
class I histone deacetylases in vitro and in vivo. Clin Cancer Res.
14:1669–1677. 2008. View Article : Google Scholar : PubMed/NCBI
|
|
15
|
Weichert W, Röske A, Gekeler V, Beckers T,
Ebert MP, Pross M, Dietel M, Denkert C and Röcken C: Association of
patterns of class I histone deacetylase expression with patient
prognosis in gastric cancer: A retrospective analysis. Lancet
Oncol. 9:139–148. 2008. View Article : Google Scholar : PubMed/NCBI
|
|
16
|
Wang W, Gao J, Man XH, Li ZS and Gong YF:
Significance of DNA methyltransferase-1 and histone deacetylase-1
in pancreatic cancer. Oncol Rep. 21:1439–1447. 2009.PubMed/NCBI
|
|
17
|
Fritzsche FR, Röske A, Gekeler V, Beckers
T, Stephan C, Jung K, Scholman K, Denkert C, Dietel M and
Kristiansen G: Class I histone deacetylases 1, 2 and 3 are highly
expressed in renal cell cancer. BMC Cancer. 8:3812008. View Article : Google Scholar : PubMed/NCBI
|
|
18
|
Marquard L, Gjerdrum LM, Christensen IJ,
Jensen PB, Sehested M and Ralfkiaer E: Prognostic significance of
the therapeutic targets histone deacetylase 1, 2, 6 and acetylated
histone H4 in cutaneous T-cell lymphoma. Histopathology.
53:267–277. 2008. View Article : Google Scholar : PubMed/NCBI
|
|
19
|
Marquard L, Poulsen CB, Gjerdrum LM, de
Nully Brown P, Christensen IJ, Jensen PB, Sehested M, Johansen P
and Ralfkiaer E: Histone deacetylase 1, 2, 6 and acetylated histone
H4 in B- and T-cell lymphomas. Histopathology. 54:688–698. 2009.
View Article : Google Scholar : PubMed/NCBI
|
|
20
|
Swigut T and Wysocka J: H3K27
demethylases, at long last. Cell. 131:29–32. 2007. View Article : Google Scholar : PubMed/NCBI
|
|
21
|
Margueron R and Reinberg D: The Polycomb
complex PRC2 and its mark in life. Nature. 469:343–349. 2011.
View Article : Google Scholar : PubMed/NCBI
|
|
22
|
Cao R, Wang L, Wang H, Xia L,
Erdjument-Bromage H, Tempst P, Jones RS and Zhang Y: Role of
histone H3 lysine 27 methylation in Polycomb-group silencing.
Science. 298:1039–1043. 2002. View Article : Google Scholar : PubMed/NCBI
|
|
23
|
Simon JA and Lange CA: Roles of the EZH2
histone methyltransferase in cancer epigenetics. Mutat Res.
647:21–29. 2008. View Article : Google Scholar : PubMed/NCBI
|
|
24
|
Velichutina I, Shaknovich R, Geng HM,
Johnson NA, Gascoyne RD, Melnick AM and Elemento O: EZH2-mediated
epigenetic silencing in germinal center B cells contributes to
proliferation and lymphomagenesis. Blood. 116:5247–5255. 2010.
View Article : Google Scholar : PubMed/NCBI
|
|
25
|
Musshoff K and Schmidt-Vollmer H:
Proceedings: Prognosis of non-Hodgkin's lymphomas with special
emphasis on the staging classification. Z Krebsforsch Klin Onkol
Cancer Res Clin Oncol. 83:323–341. 1975. View Article : Google Scholar : PubMed/NCBI
|
|
26
|
Ziepert M, Hasenclever D, Kuhnt E, Glass
B, Schmitz N, Pfreundschuh M and Loeffler M: Standard International
prognostic index remains a valid predictor of outcome for patients
with aggressive CD20+ B-cell lymphoma in the rituximab era. J Clin
Oncol. 28:2373–2380. 2010. View Article : Google Scholar : PubMed/NCBI
|
|
27
|
Score J, Hidalgo-Curtis C, Jones AV,
Winkelmann N, Skinner A, Ward D, Zoi K, Ernst T, Stegelmann F,
Döhner K, et al: Inactivation of polycomb repressive complex 2
components in myeloproliferative and
myelodysplastic/myeloproliferative neoplasms. Blood. 119:1208–1213.
2012. View Article : Google Scholar : PubMed/NCBI
|
|
28
|
Ntziachristos P, Tsirigos A, Van
Vlierberghe P, Nedjic J, Trimarchi T, Flaherty MS, Ferres-Marco D,
da Ros V, Tang Z, Siegle J, et al: Genetic inactivation of the
polycomb repressive complex 2 in T cell acute lymphoblastic
leukemia. Nat Med. 18:298–301. 2012. View
Article : Google Scholar : PubMed/NCBI
|
|
29
|
Simon C, Chagraoui J, Krosl J, Gendron P,
Wilhelm B, Lemieux S, Boucher G, Chagnon P, Drouin S, Lambert R, et
al: A key role for EZH2 and associated genes in mouse and human
adult T-cell acute leukemia. Genes Dev. 26:651–656. 2012.
View Article : Google Scholar : PubMed/NCBI
|
|
30
|
Shi M, Shahsafaei A, Liu C, Yu H and
Dorfman DM: Enhancer of zeste homolog 2 is widely expressed in
T-cell neoplasms, is associated with high proliferation rate and
correlates with MYC and pSTAT3 expression in a subset of cases.
Leuk Lymphoma. 56:2087–2091. 2015. View Article : Google Scholar : PubMed/NCBI
|
|
31
|
Johnson DP, Spitz GS, Tharkar S, Quayle
SN, Shearstone JR, Jones S, McDowell ME, Wellman H, Tyler JK,
Cairns BR, et al: HDAC1,2 inhibition impairs EZH2- and
BBAP-mediated DNA repair to overcome chemoresistance in EZH2
gain-of-function mutant diffuse large B-cell lymphoma. Oncotarget.
6:4863–4887. 2015. View Article : Google Scholar : PubMed/NCBI
|
|
32
|
Chou DM, Adamson B, Dephoure NE, Tan X,
Nottke AC, Hurov KE, Gygi SP, Colaiácovo MP and Elledge SJ: A
chromatin localization screen reveals poly (ADP ribose)-regulated
recruitment of the repressive polycomb and NuRD complexes to sites
of DNA damage. Proc Natl Acad Sci USA. 107:18475–18480. 2010.
View Article : Google Scholar : PubMed/NCBI
|
|
33
|
Zappasodi R, Cavanè A, Iorio MV, Tortoreto
M, Guarnotta C, Ruggiero G, Piovan C, Magni M, Zaffaroni N,
Tagliabue E, et al: Pleiotropic antitumor effects of the pan-HDAC
inhibitor ITF2357 against c-Myc-overexpressing human B-cell
non-Hodgkin lymphomas. Int J Cancer. 135:2034–2045. 2014.
View Article : Google Scholar : PubMed/NCBI
|
|
34
|
Hess-Stumpp H: Histone deacetylase
inhibitors and cancer: From cell biology to the clinic. Eur J Cell
Biol. 84:109–121. 2005. View Article : Google Scholar : PubMed/NCBI
|
|
35
|
Mariadason JM: HDACs and HDAC inhibitors
in colon cancer. Epigenetics. 3:28–37. 2008. View Article : Google Scholar : PubMed/NCBI
|
|
36
|
Barneda-Zahonero B and Parra M: Histone
deacetylases and cancer. Mol Oncol. 6:579–589. 2012. View Article : Google Scholar : PubMed/NCBI
|
|
37
|
Xie W, Hu K, Xu F, Zhou D, Huang W, He J,
Shi J, Luo Y, Zhang J, Lin M, et al: Significance of clinical
factors as prognostic indicators for patients with peripheral
T-cell non-Hodgkin lymphoma: A retrospective analysis of 252 cases.
Mol Clin Oncol. 1:911–917. 2013. View Article : Google Scholar : PubMed/NCBI
|
|
38
|
Gallamini A, Stelitano C, Calvi R, Bellei
M, Mattei D, Vitolo U, Morabito F, Martelli M, Brusamolino E,
Iannitto E, et al: Peripheral T-cell lymphoma unspecified (PTCL-U):
A new prognostic model from a retrospective multicentric clinical
study. Blood. 103:2474–2479. 2004. View Article : Google Scholar : PubMed/NCBI
|