Introduction
Breast cancer is one the most severe types of cancer
worldwide and is the leading cause of cancer-associated mortality
in women (1). The breast cancer
incidence rate varies widely across regions, with rates ranging
from 0.194% in East Africa to 0.897% in Western Europe, and is
increasing gradually (2). A number
of risk factors are associated with breast cancer, including
long-term fertility, the use of hormonal contraception, physical
inactivity and alcohol consumption; however, its etiology and
pathogenesis are not fully understood (3).
Following the implementation of several large-cohort
human tumor genome projects, including The Cancer Genome Atlas
(TCGA) (4) and the International
Cancer Genome Consortium, a large amount of genomic data was
generated from tumor samples, which has aided cancer studies
considerably (5,6). In addition, smaller-scale cancer
projects led by individual institutions have made substantial
contributions and provided large amounts of valuable data, which
have been deposited into public databases including Gene Expression
Omnibus (GEO) (7). The availability
of cancer genome data has accelerated and may continue to
accelerate a comprehensive understanding of the genetics underlying
cancer pathophysiology, facilitating examination of the underlying
molecular mechanisms involved in cancer initiation and progression,
and improving diagnostic methods and preventive strategies.
Due to the limitations of experimental techniques
(8,9), the development and application of
microarray and sequencing technology brought cancer research into a
new era. High-throughput techniques have been widely used for
global gene expression profiling, which reflects the molecular
basis of tumor phenotypes and has been used to classify tumors,
identify pathogenic genes for various tumors, examine
tumorigenesis, and distinguish between the occurrence and
progression of tumors (10–12). The large numbers of gene microarray
datasets in public databases have facilitated comprehensive
analyses of gene expression in different types of cancer (13–16).
Using bioinformatics and correlating the results with clinical
data, new biomarkers for the diagnosis, therapy and prognosis of
different types of cancer can be identified.
‘Weighted correlation network analysis’ (WGCNA) is
an R package that has been used as a data mining method to identify
co-expressed gene modules and examine the association between gene
networks and phenotypes (17).
A number of studies have applied the aforementioned
methods to screen and identify specific hub genes in different
types of cancer. In an oral squamous cell carcinoma study, the
authors revealed 10 relevant hub genes, and the findings were
supported at the transcriptional and translational levels (16); and, in a previous study, 10 hub genes
associated with pancreatic ductal adenocarcinoma (PDAC) were
identified, and the cell cycle pathway was reported to serve an
important role in PDAC (18).
In the present study, two microarray gene expression
datasets, GSE10810 (19) and
GSE65194 (20), were obtained from
the GEO database. Strict calibration and filtering were used to
obtain differentially expressed genes (DEGs), which were
subsequently subjected to Kyoto Encyclopedia of Genes and Genomes
(KEGG; www.genome.ad.jp/kegg/) pathway
analysis and Gene Ontology (GO; www.geneontology.org) enrichment analysis. An
integrated DEG protein-protein interaction (PPI) network was
constructed together with a WGCNA co-expression network. Using a
series of bioinformatics approaches, hub genes were identified, and
an enrichment analysis was used to identify possible key pathways
associated with breast cancer. Breast cancer RNA expression
profiles were additionally obtained from TCGA and the same strategy
was performed to verify the data. A series of Kaplan-Meier (KM)
survival plots were constructed to identify the association between
the expression of hub genes and the prognosis of breast cancer. At
present, only a small number of previous studies used a similar
approach to screen hub genes for breast cancer to the best of our
knowledge. In the present study, the scale of the KM survival
analysis was larger, which may improve support of the findings from
the genetic screen. The present findings may provide further
insight into the tumorigenesis and development of breast cancer at
the molecular level, and provide precise and practically valuable
markers for the diagnosis, therapy, monitoring and prognosis of
breast cancer.
Materials and methods
Datasets
GEO is a public database of gene expression profiles
and sequence-based data that is freely available for users. The
size of datasets and the unity of the platform were evaluated, and
two gene expression profile datasets (GSE10810 and GSE65194) were
selected and downloaded from GEO. GSE10810 and GSE65194 were
obtained from the GPL570 platform [HG-U133_Plus_2] Affymetrix Human
Genome U133 Plus 2.0 Array. GSE10810 contained 58 samples,
including 31 breast cancer samples and 27 normal control samples,
whereas GSE65194 contained 130 breast cancer samples and 11 normal
control samples.
The gene expression profiles based on RNA-sequencing
were additionally obtained from TCGA ‘GDC TCGA-BRCA’ cohort,
University of California, Santa Cruz Xena (https://xena.ucsc.edu/), which contained 1,104 breast
cancer samples and 113 normal samples.
Filtering of DEGs
The ‘limma’ R package (21,22) was
applied to filter the DEGs between the group of patients with
breast cancer and the normal group from the GSE10180 and GSE65194
datasets. The P-value of each DEG was calculated and then adjusted
using the Bonferroni method (23).
The threshold used to select genes that were significantly
differentially expressed at values 2-fold greater than those of the
control group was a |log fold change (FC)|≥2 and a Bonferroni
P<0.01.
KEGG pathway and GO enrichment
analyses of DEGs
KEGG was used to systematically analyze and annotate
gene functions (24). The GO
database classified the genes into three functional groups:
‘Molecular function’ (MF), ‘biological process’ (BP) or ‘cellular
component’ (CC) (25). In the
present study, KEGG pathway and GO enrichment analyses of the DEGs
obtained in the previous step were conducted using the
‘clusterProfiler’ R package (26)
with a cut-off P=0.05.
Integration of the PPI network and
cluster analysis
The Search Tool for the Retrieval of Interacting
Genes (STRING) (27) is a biological
database for predicting pairs of PPIs. The interactions between
DEGs were evaluated using STRING and genes with a combined score
>0.9 were defined as key DEGs. Subsequently, Cytoscape (version
3.6.1; http://cytoscape.org/) (28) was used to develop the PPI network of
the key DEGs that were identified. Molecular complex detection
(MCODE) (29), a Cytoscape plugin,
was used with the default parameters to identify the most important
modules of the PPI network.
Construction of the co-expression
network and analysis of clinically significant modules
The co-expression network was established using
WGCNA, an R package designed for the construction of weighted gene
co-expression networks (17). In the
present study, an automatic one-step network construction and
module detection method in WGCNA was performed with the default
settings, including the calculation of Pearson's correlation
coefficients, an unsigned type of topological overlap matrix, a
merge cut height of 0.25 and a default minimal module size. The
first principal component calculation module eigengene (ME) was
used to quantify the similarity of the co-expression of entire
modules. Pearson's correlation coefficients were calculated to
assess the potential correlations between MEs and the
phenotype.
Hub gene selection
Key genes were identified in the most significant
module of the PPI network. The phenotype-associated modules in the
WGCNA network were additionally identified, and the genes in those
modules were extracted. Hub genes common to the two networks were
selected as candidates for further analysis and validation.
Construction of a co-expression
network from the TCGA dataset for further validation
To confirm the reliability of the identified DEGs
from the aforementioned two GEO datasets, the TCGA-breast cancer
data were analyzed using the same strategy to obtain DEGs in the
TCGA database. A one-step function of WGCNA was used for TCGA DEG
network construction and the detection of consensus modules. The
correlation coefficients between MEs and phenotypes was calculated.
The candidate genes that also appeared in the TCGA co-expression
network were considered the true hub genes.
KM survival analysis
KM plotter (kmplot.com/)
contains and utilizes expression data from 5,143 breast cancer
patients (30). The median
expression level of each gene was used to divide patients into two
groups, and overall survival analysis was performed to determine
the association between the expression levels of hub genes and the
overall survival time of patients with breast cancer. The hazard
ratio was provided, and the P-value was calculated using log-rank
tests.
Results
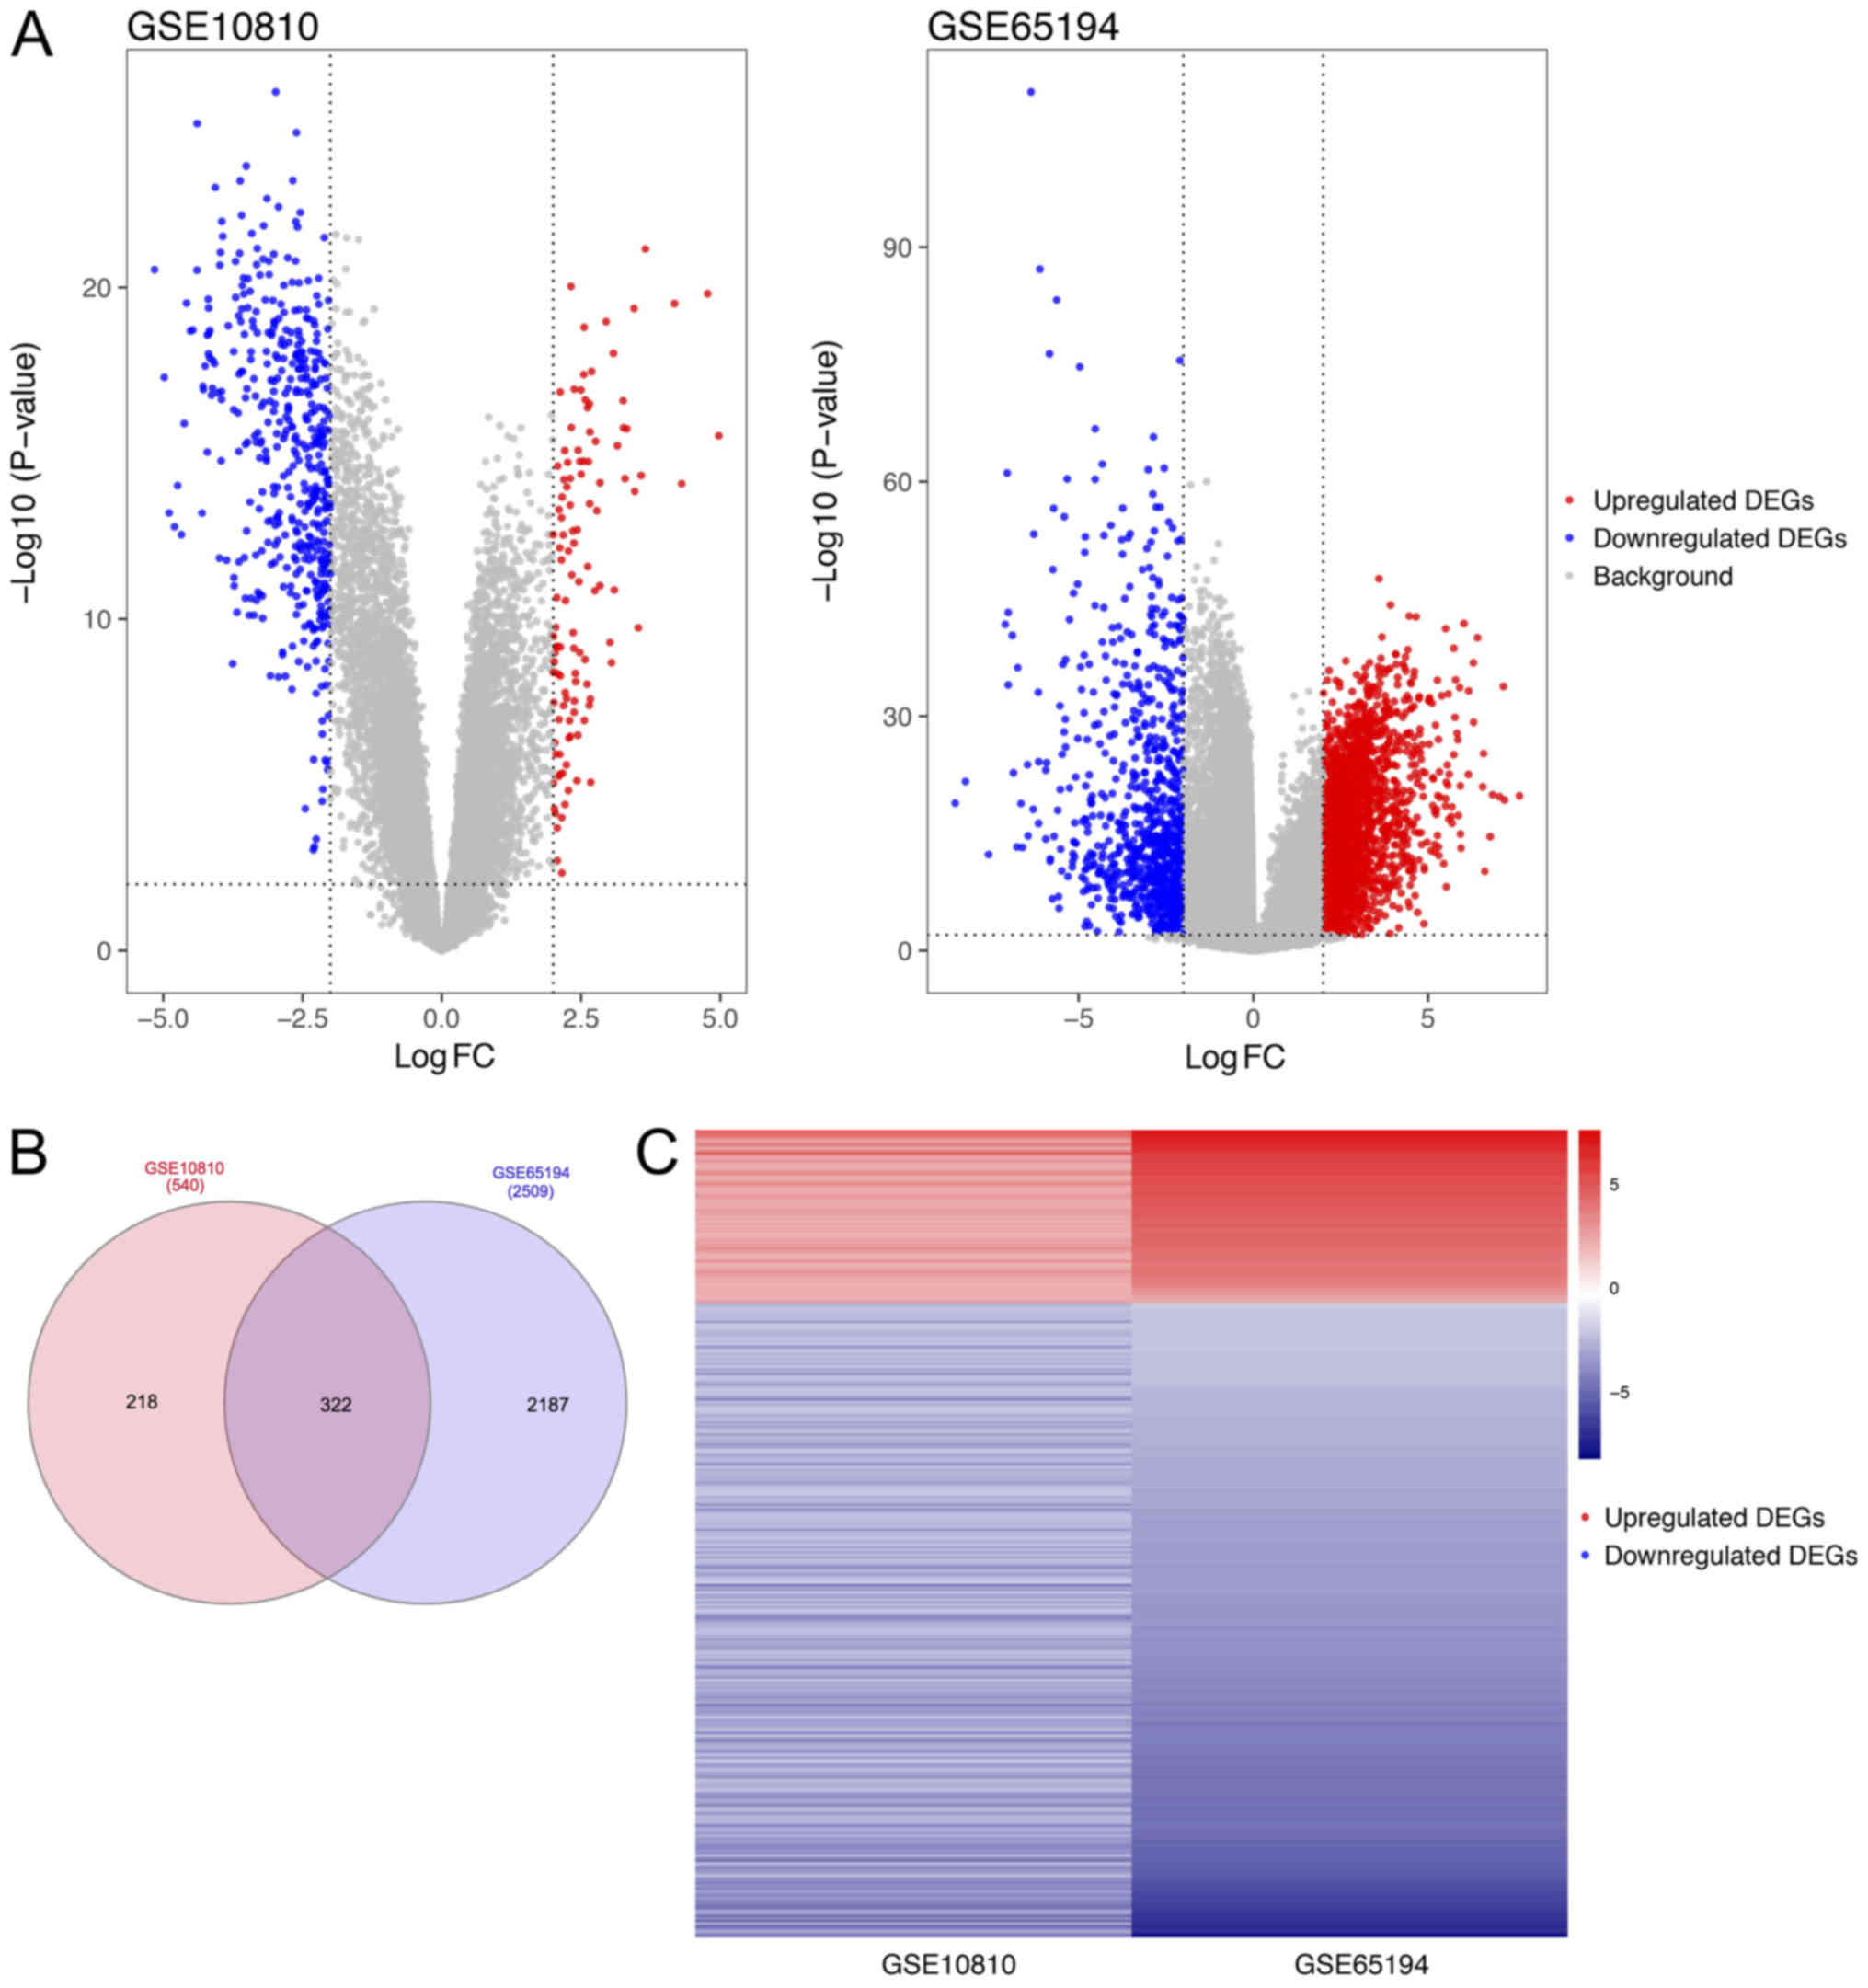
DEG filtering
With thresholds of |logFC|≥2 and Bonferroni adjusted
P<0.01, 540 and 2,509 DEGs were extracted from the expression
profiles in the GSE10180 and GSE65194 datasets, respectively.
Scatter volcano plots were plotted to illustrate the distribution
of each gene according to the logFC and -log(P-value) values
(Fig. 1A). Subsequent to performing
the integrated bioinformatics analysis, 322 consistent DEGs were
identified from the two datasets (Fig.
1B; Table SI). Among those
DEGs, 69 genes were upregulated and 253 genes were downregulated.
In addition, the gene expression pattern was consistent in the two
datasets, as presented in the heat map (Fig. 1C).
KEGG pathway analysis and GO
enrichment analysis
KEGG pathway analysis was used to examine the
functions of the DEGs. The top results for each functional group
are presented in Fig. 2A and
Table SII. ‘Oocyte meiosis’, ‘cell
cycle’ or ‘progesterone-mediated oocyte maturation’ were the
pathways in which upregulated genes were primarily enriched. The
majority of the downregulated genes were enriched in ‘PPAR
signaling pathway’, ‘5’ AMPK signaling pathway’, ‘regulation of
lipolysis in adipocytes’ and ‘adipocytokine signaling pathway’.
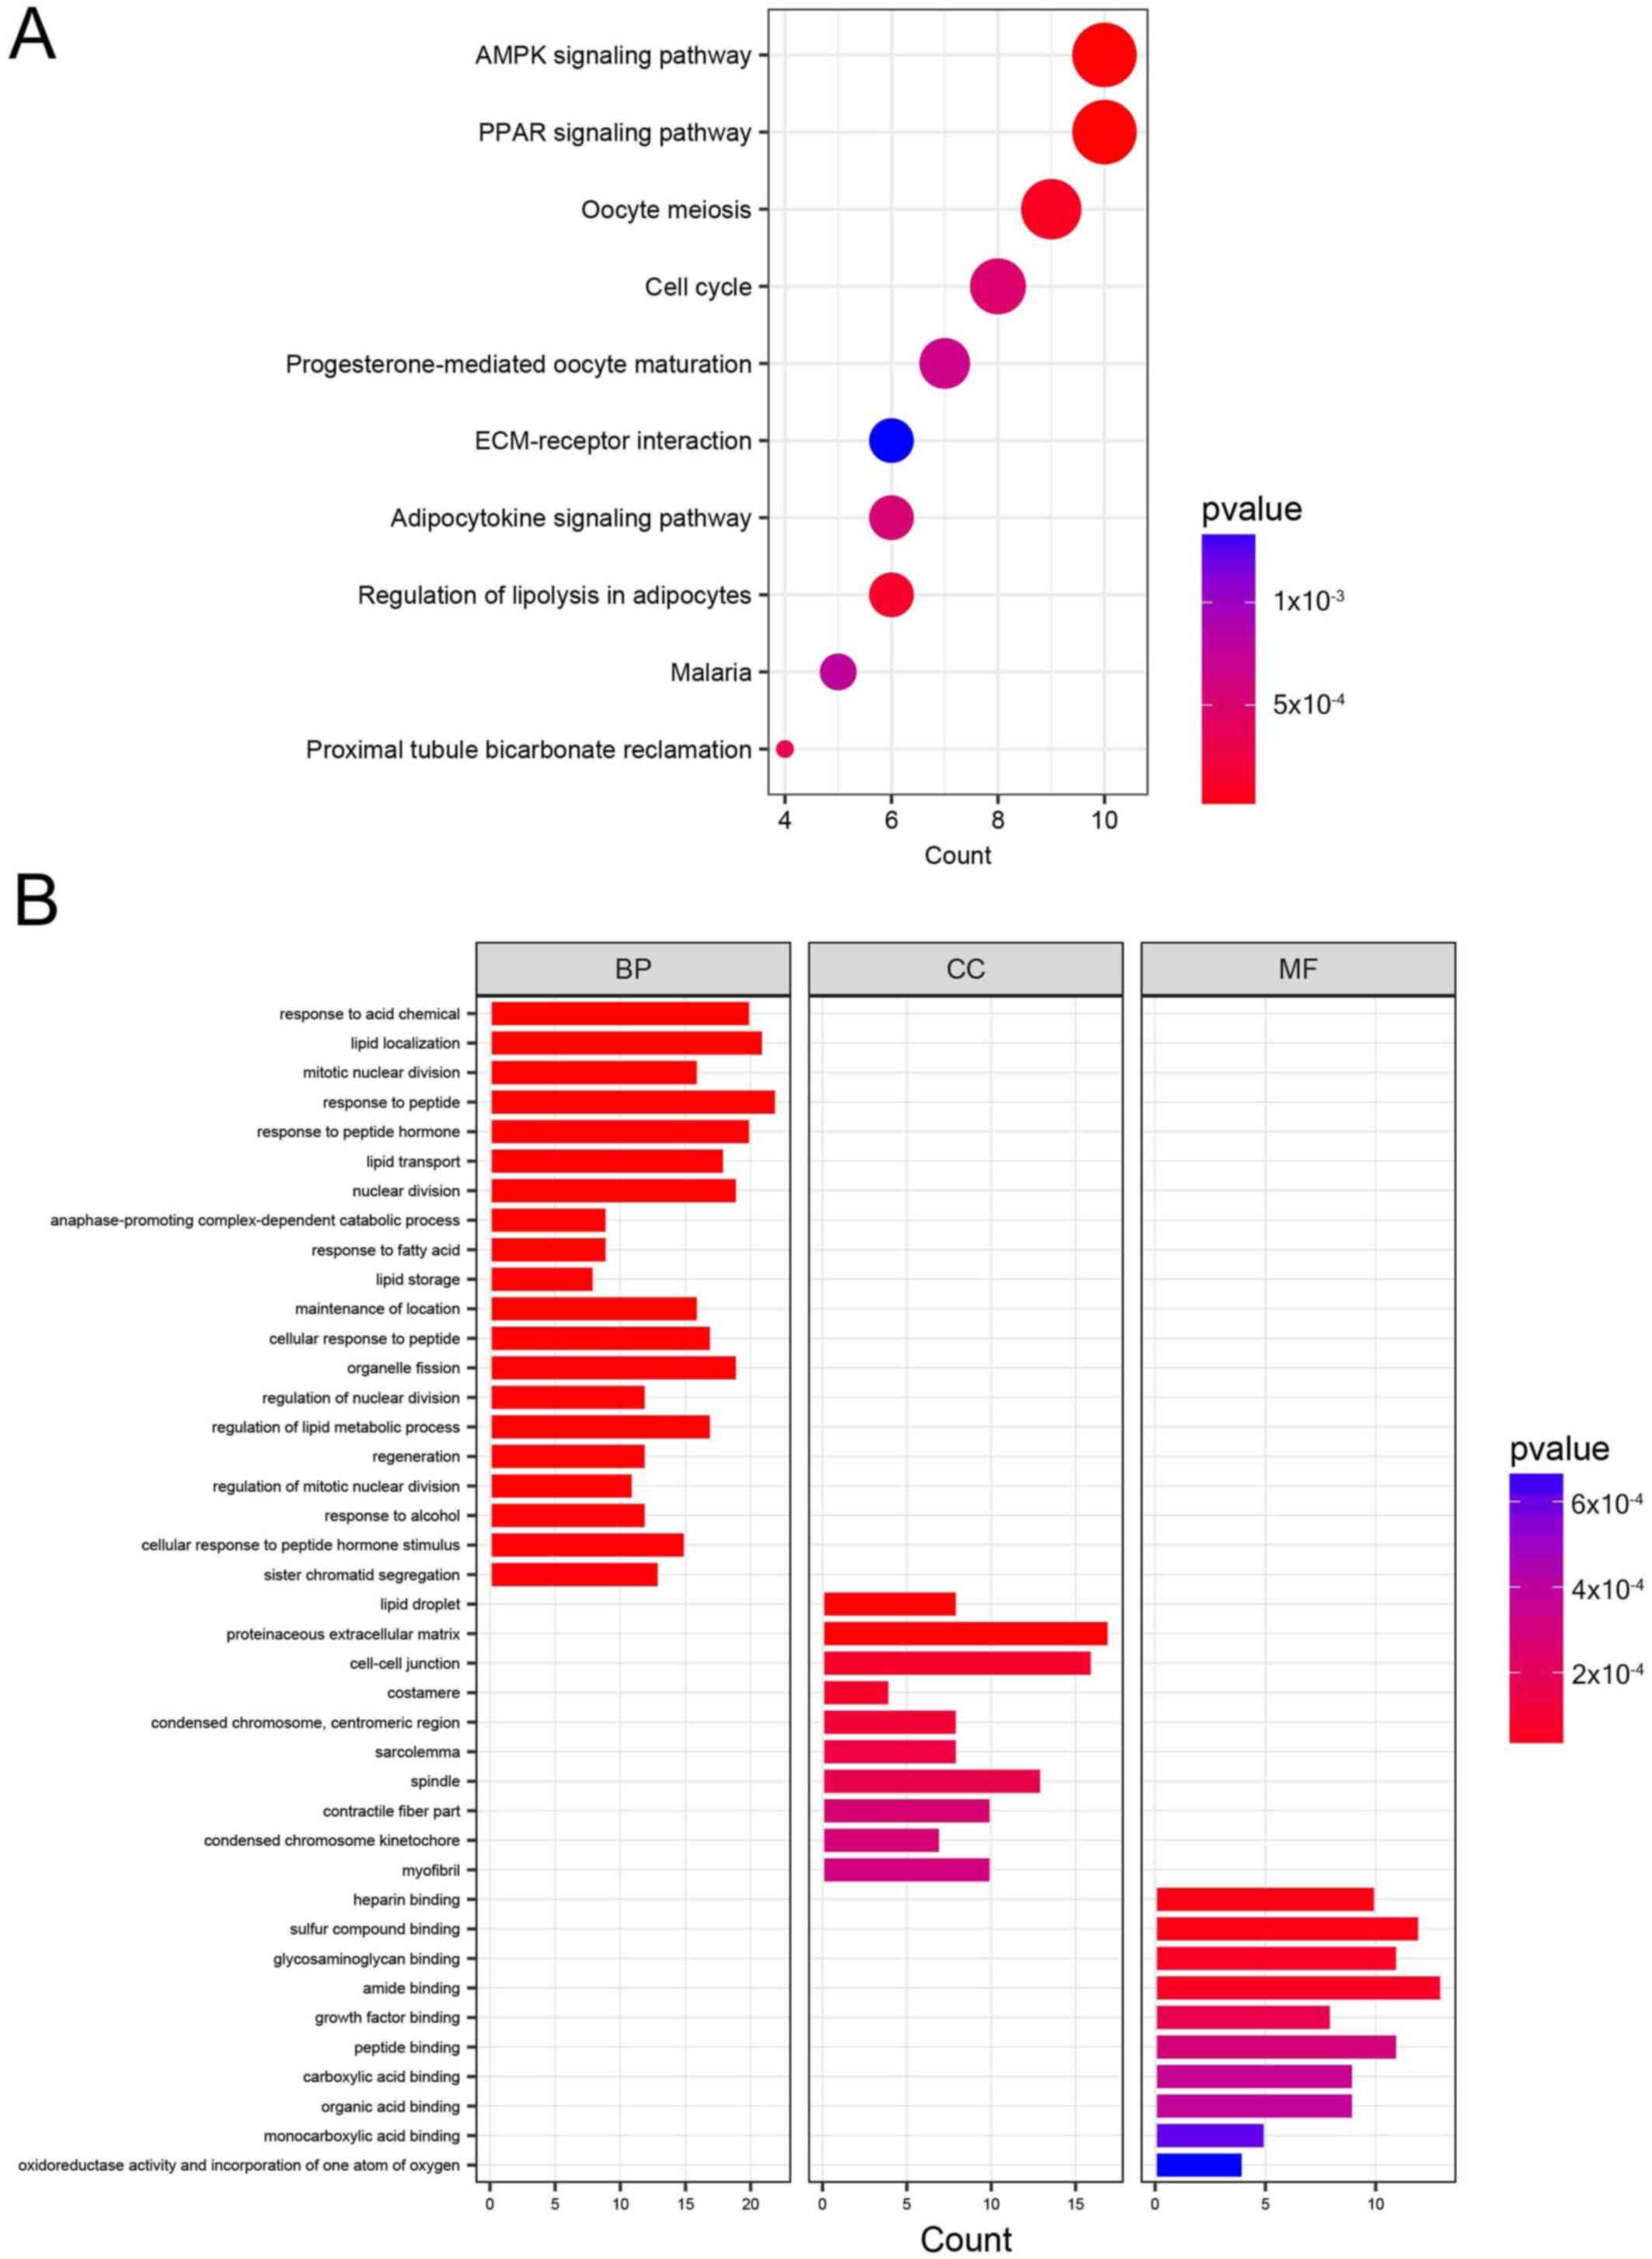 | Figure 2.Top enriched KEGG pathways and GO
annotations of 322 common DEGs identified from the GSE10180 and
GSE65194 datasets. (A) Top enriched KEGG pathways for the 322 DEGs.
The size of the circle represents the number of genes enriched in
the pathway. The color of the circle represents the P-value. (B)
Top enriched GO terms for key DEGs classified into the MF, BP or CC
groups. KEGG, Kyoto Encyclopedia of Genes and genomes; GO, Gene
Ontology; DEG, differentially expressed genes; MF, molecular
function; BP, biological process; CC, cellular component; AMPK, 5′
adenosine monophosphate-activated kinase; PPAR, peroxisome
proliferator-activated receptor; ECM, extracellular matrix. |
The enriched GO terms are listed in Fig. 2B and Table SII. In the BP group, the majority of
the upregulated genes were enriched in ‘nuclear division’, ‘mitotic
nuclear division’, ‘organelle fission’ and ‘regulation of nuclear
division’, and the downregulated genes were primarily enriched in
‘lipid localization’. In the CC group, the upregulated genes were
primarily enriched in ‘spindle’, ‘spindle pole’ and ‘condensed
chromosome, centromeric region’, while downregulated genes were
mainly enriched in ‘lipid droplet’. In the MF group, the majority
of the downregulated genes were enriched in ‘amide binding’,
‘growth factor binding’, and ‘peptide binding’.
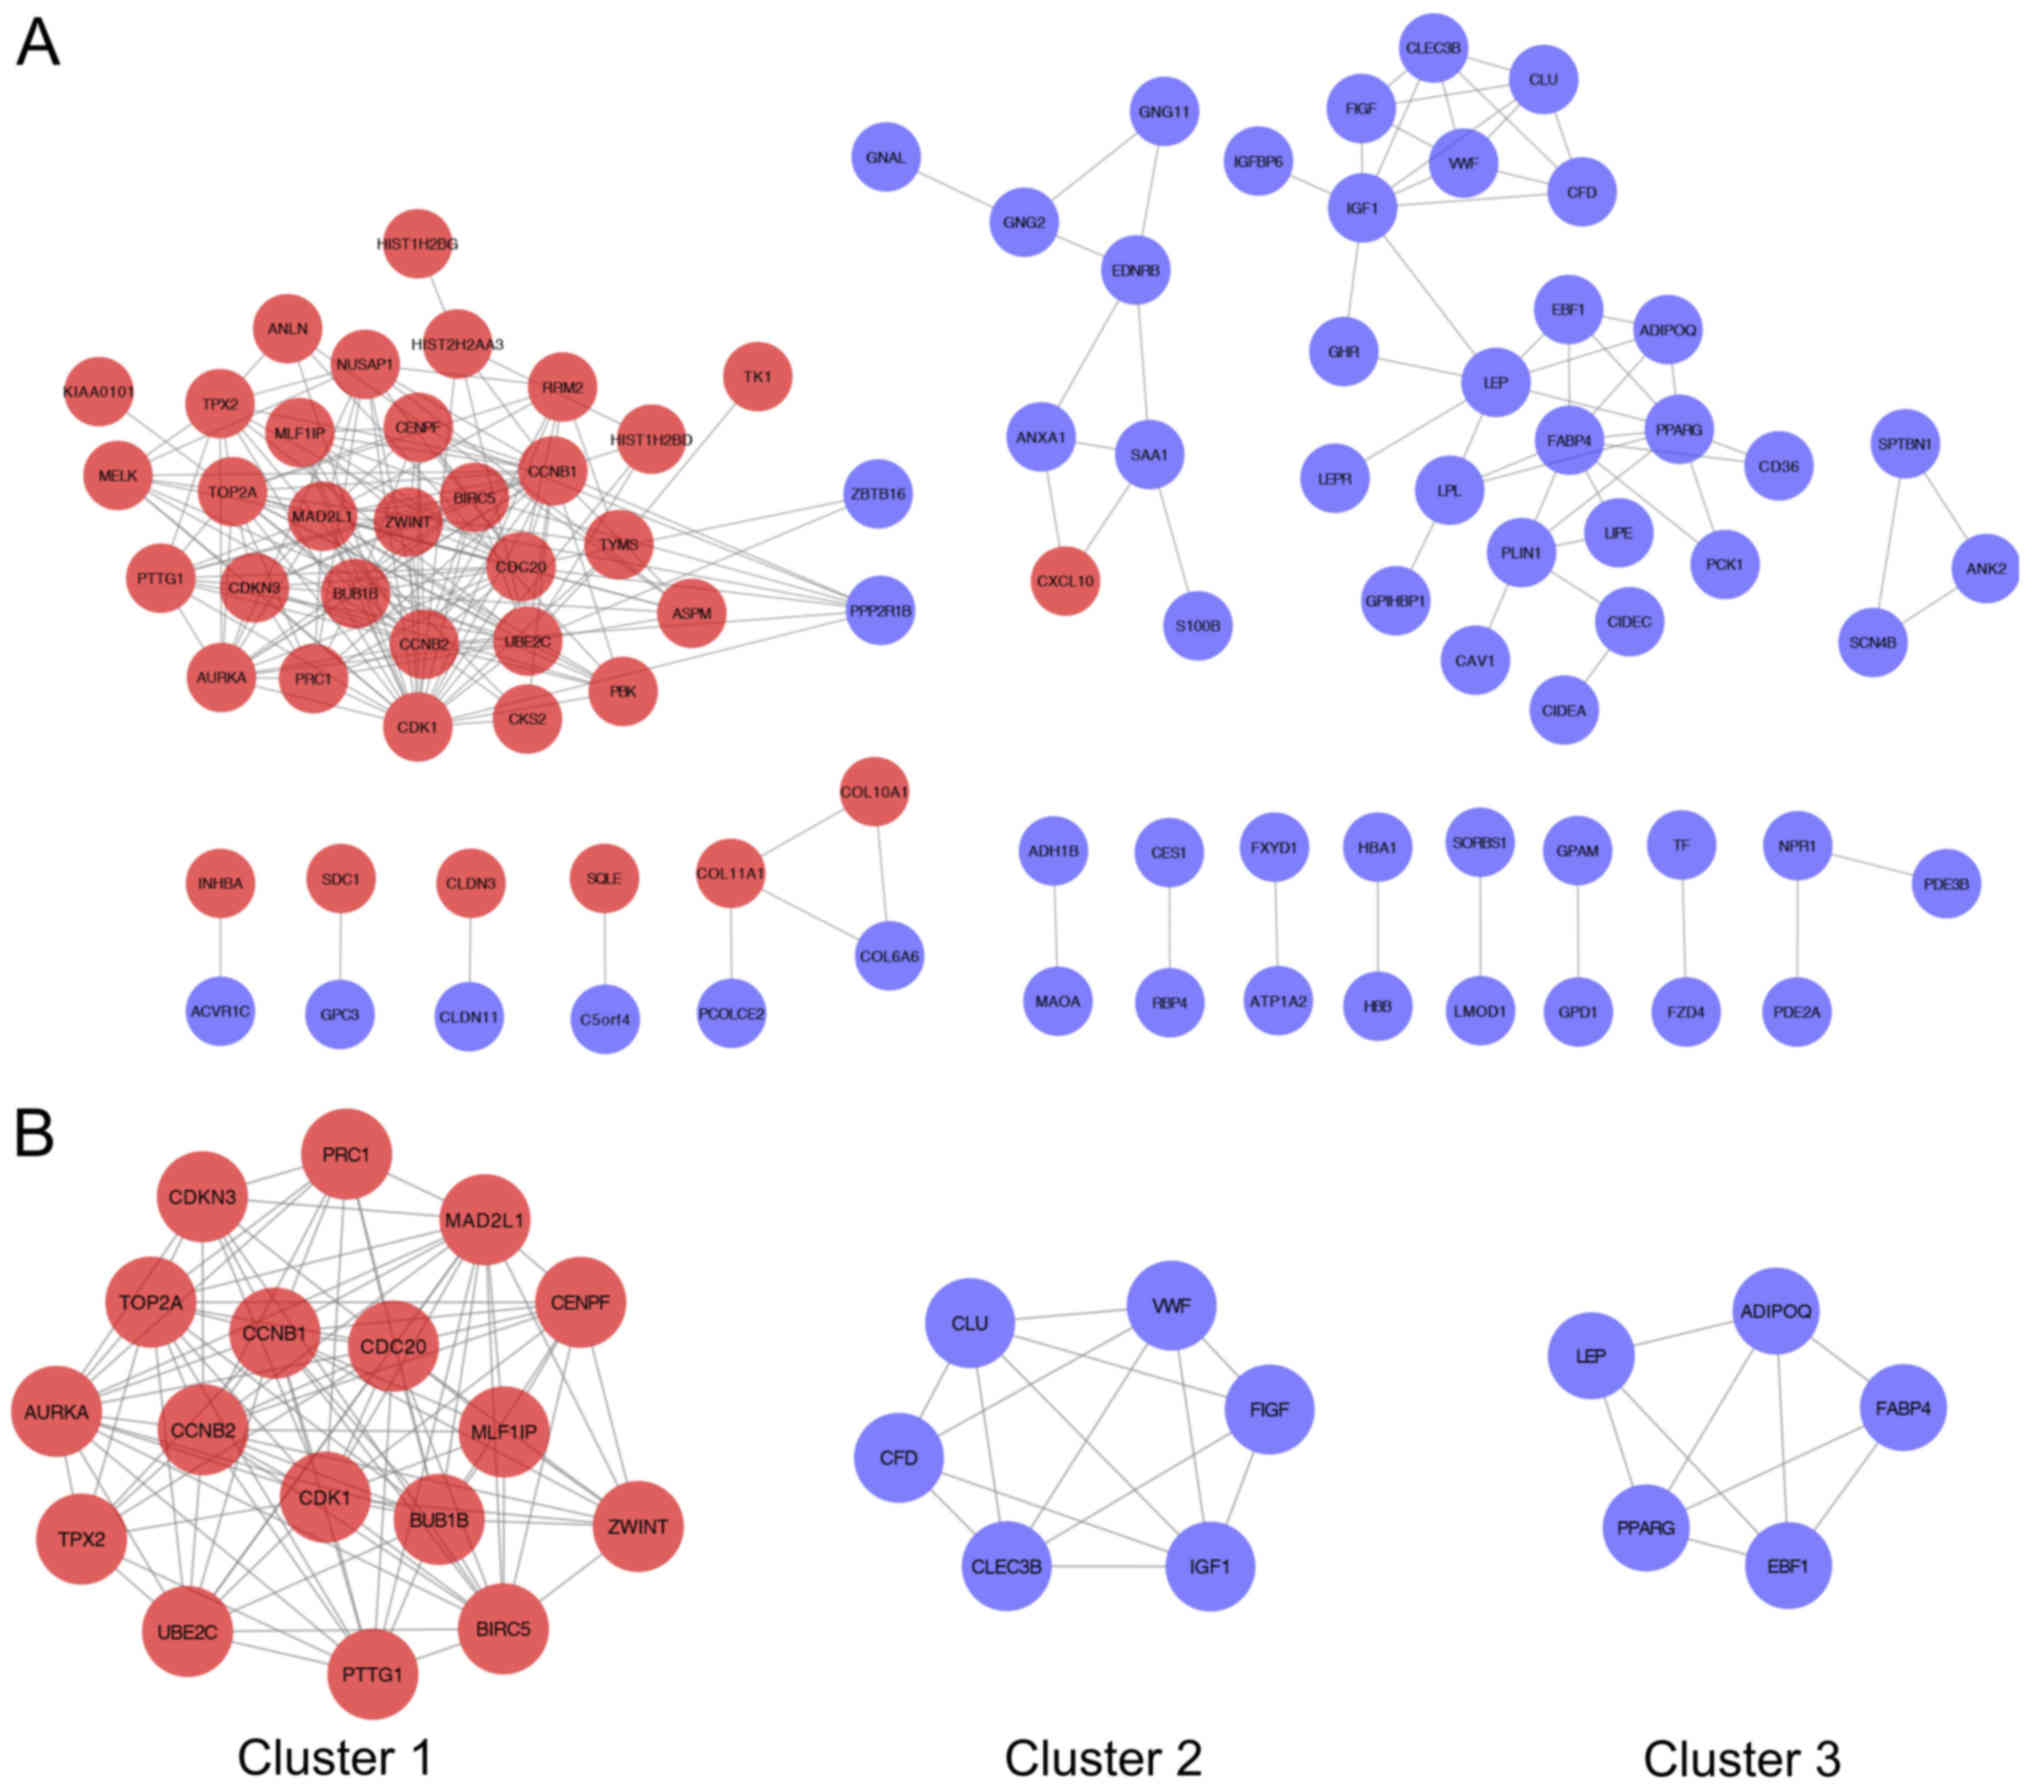
Identification of key DEGs and
significant clusters in the PPI network
The online STRING database was used to identify the
interactions between DEGs. Genes with a combined score >0.9 were
defined as key DEGs. A total of 95 key DEGs as network nodes and
244 edges were used to construct the PPI network (Fig. 3A). MCODE recognized three of the most
significant clusters and identified 28 genes from the PPI network
(Fig. 3B and Table I).
 | Table I.Key differentially expressed genes
identified from the protein-protein interaction network. |
Table I.
Key differentially expressed genes
identified from the protein-protein interaction network.
| A, MCODE cluster
1 |
|---|
|
|---|
| Gene | MCODE score | Degree | Clustering
coefficient | Topological
coefficient | Expression |
|---|
| CDK1 | 7.2 | 16 | 0.73333333 | 0.75 | Upregulated |
| UBE2C | 8.836.363.636 | 11 | 0.92727273 | 0.85795455 |
|
| ZWINT | 9 | 9 | 1 | 0.86805556 |
|
| CENPF | 9 | 10 | 0.93333333 | 0.85625 |
|
| BUB1B | 7.813.186.813 | 14 | 0.8021978 | 0.79017857 |
|
| MAD2L1 | 7.2 | 15 | 0.77142857 | 0.77083333 |
|
| PRC1 | 7.822.222.222 | 9 | 0.97222222 | 0.88888889 |
|
| BIRC5 | 7.961.538.462 | 13 | 0.80769231 | 0.79326923 |
|
| CCNB2 | 7.2 | 16 | 0.73333333 | 0.75 |
|
| CCNB1 | 7.2 | 16 | 0.73333333 | 0.75 |
|
| CDC20 | 7.2 | 16 | 0.73333333 | 0.75 |
|
| MLF1IP | 9 | 9 | 1 | 0.86805556 |
|
| TOP2A | 9 | 13 | 0.80769231 | 0.78846154 |
|
| AURKA | 8.192.307.692 | 13 | 0.84615385 | 0.80288462 |
|
| CDKN3 | 8 | 9 | 0.94444444 | 0.88194444 |
|
| TPX2 | 8 | 8 | 1 | 0.875 |
|
|
| B, MCODE cluster
2 |
|
| Gene | MCODE
score | Degree | Clustering
coefficient | Topological
coefficient |
Expression |
|
| IGF1 | 3.733.333.333 | 5 | 0.9 | 0.92 | Downregulated |
| CLU | 3.733.333.333 | 5 | 0.9 | 0.92 |
|
| VWF | 3.733.333.333 | 5 | 0.9 | 0.92 |
|
| CLEC3B | 3.733.333.333 | 5 | 0.9 | 0.92 |
|
| FIGF | 4 | 4 | 1.0 | 1.0 |
|
| CFD | 4 | 4 | 1.0 | 1.0 |
|
|
| C, MCODE cluster
3 |
|
| Gene | MCODE
score | Degree | Clustering
coefficient | Topological
coefficient |
Expression |
|
| FABP4 | 3 | 3 | 1 | 1 | Downregulated |
| PPARG | 2.4 | 4 | 0.83333333 | 0.875 |
|
| ADIPOQ | 2.7 | 4 | 0.83333333 | 0.875 |
|
| LEP | 3.0 | 3 | 1 | 1 |
|
| EBF1 | 2.7 | 4 | 0.83333333 | 0.875 |
|
Construction of the weighted
co-expression network and identification of key modules
A WGCNA was performed to classify the DEGs into
different modules based on the similarity of their expression
patterns using the method of average linkage clustering. In the
present study, three modules (MEblue, MEturquoise and MEgrey) were
identified and marked with different colors (blue, turquoise and
gray, respectively) in Fig. 4A.
Subsequently, all of the samples in the dataset were classified
into a breast cancer group (case) and normal control group (normal)
as two phenotypes. The blue module of the MEs demonstrated the most
marked correlation with the breast cancer phenotype (Fig. 4B). All 35 genes in the blue module
were identified (ANLN, ASPM, AURKA, BIRC5, BUB1B, CCNB1, CCNB2,
CDC20, CDK1, CDKN3, CENPF, CENPU, CKS2, CXCL10, DTL, GINS1, HMGB3,
HN1, IGF1, KIAA0101, MAD2L1, MELK, NUSAP1, PBK, PRC1, PTTG1, RRM2,
TK1, TOP2A, TPX2, TYMS, UBE2C, UBE2T, UHRF1, ZWINT) and
considered to be the most relevant genes for breast cancer.
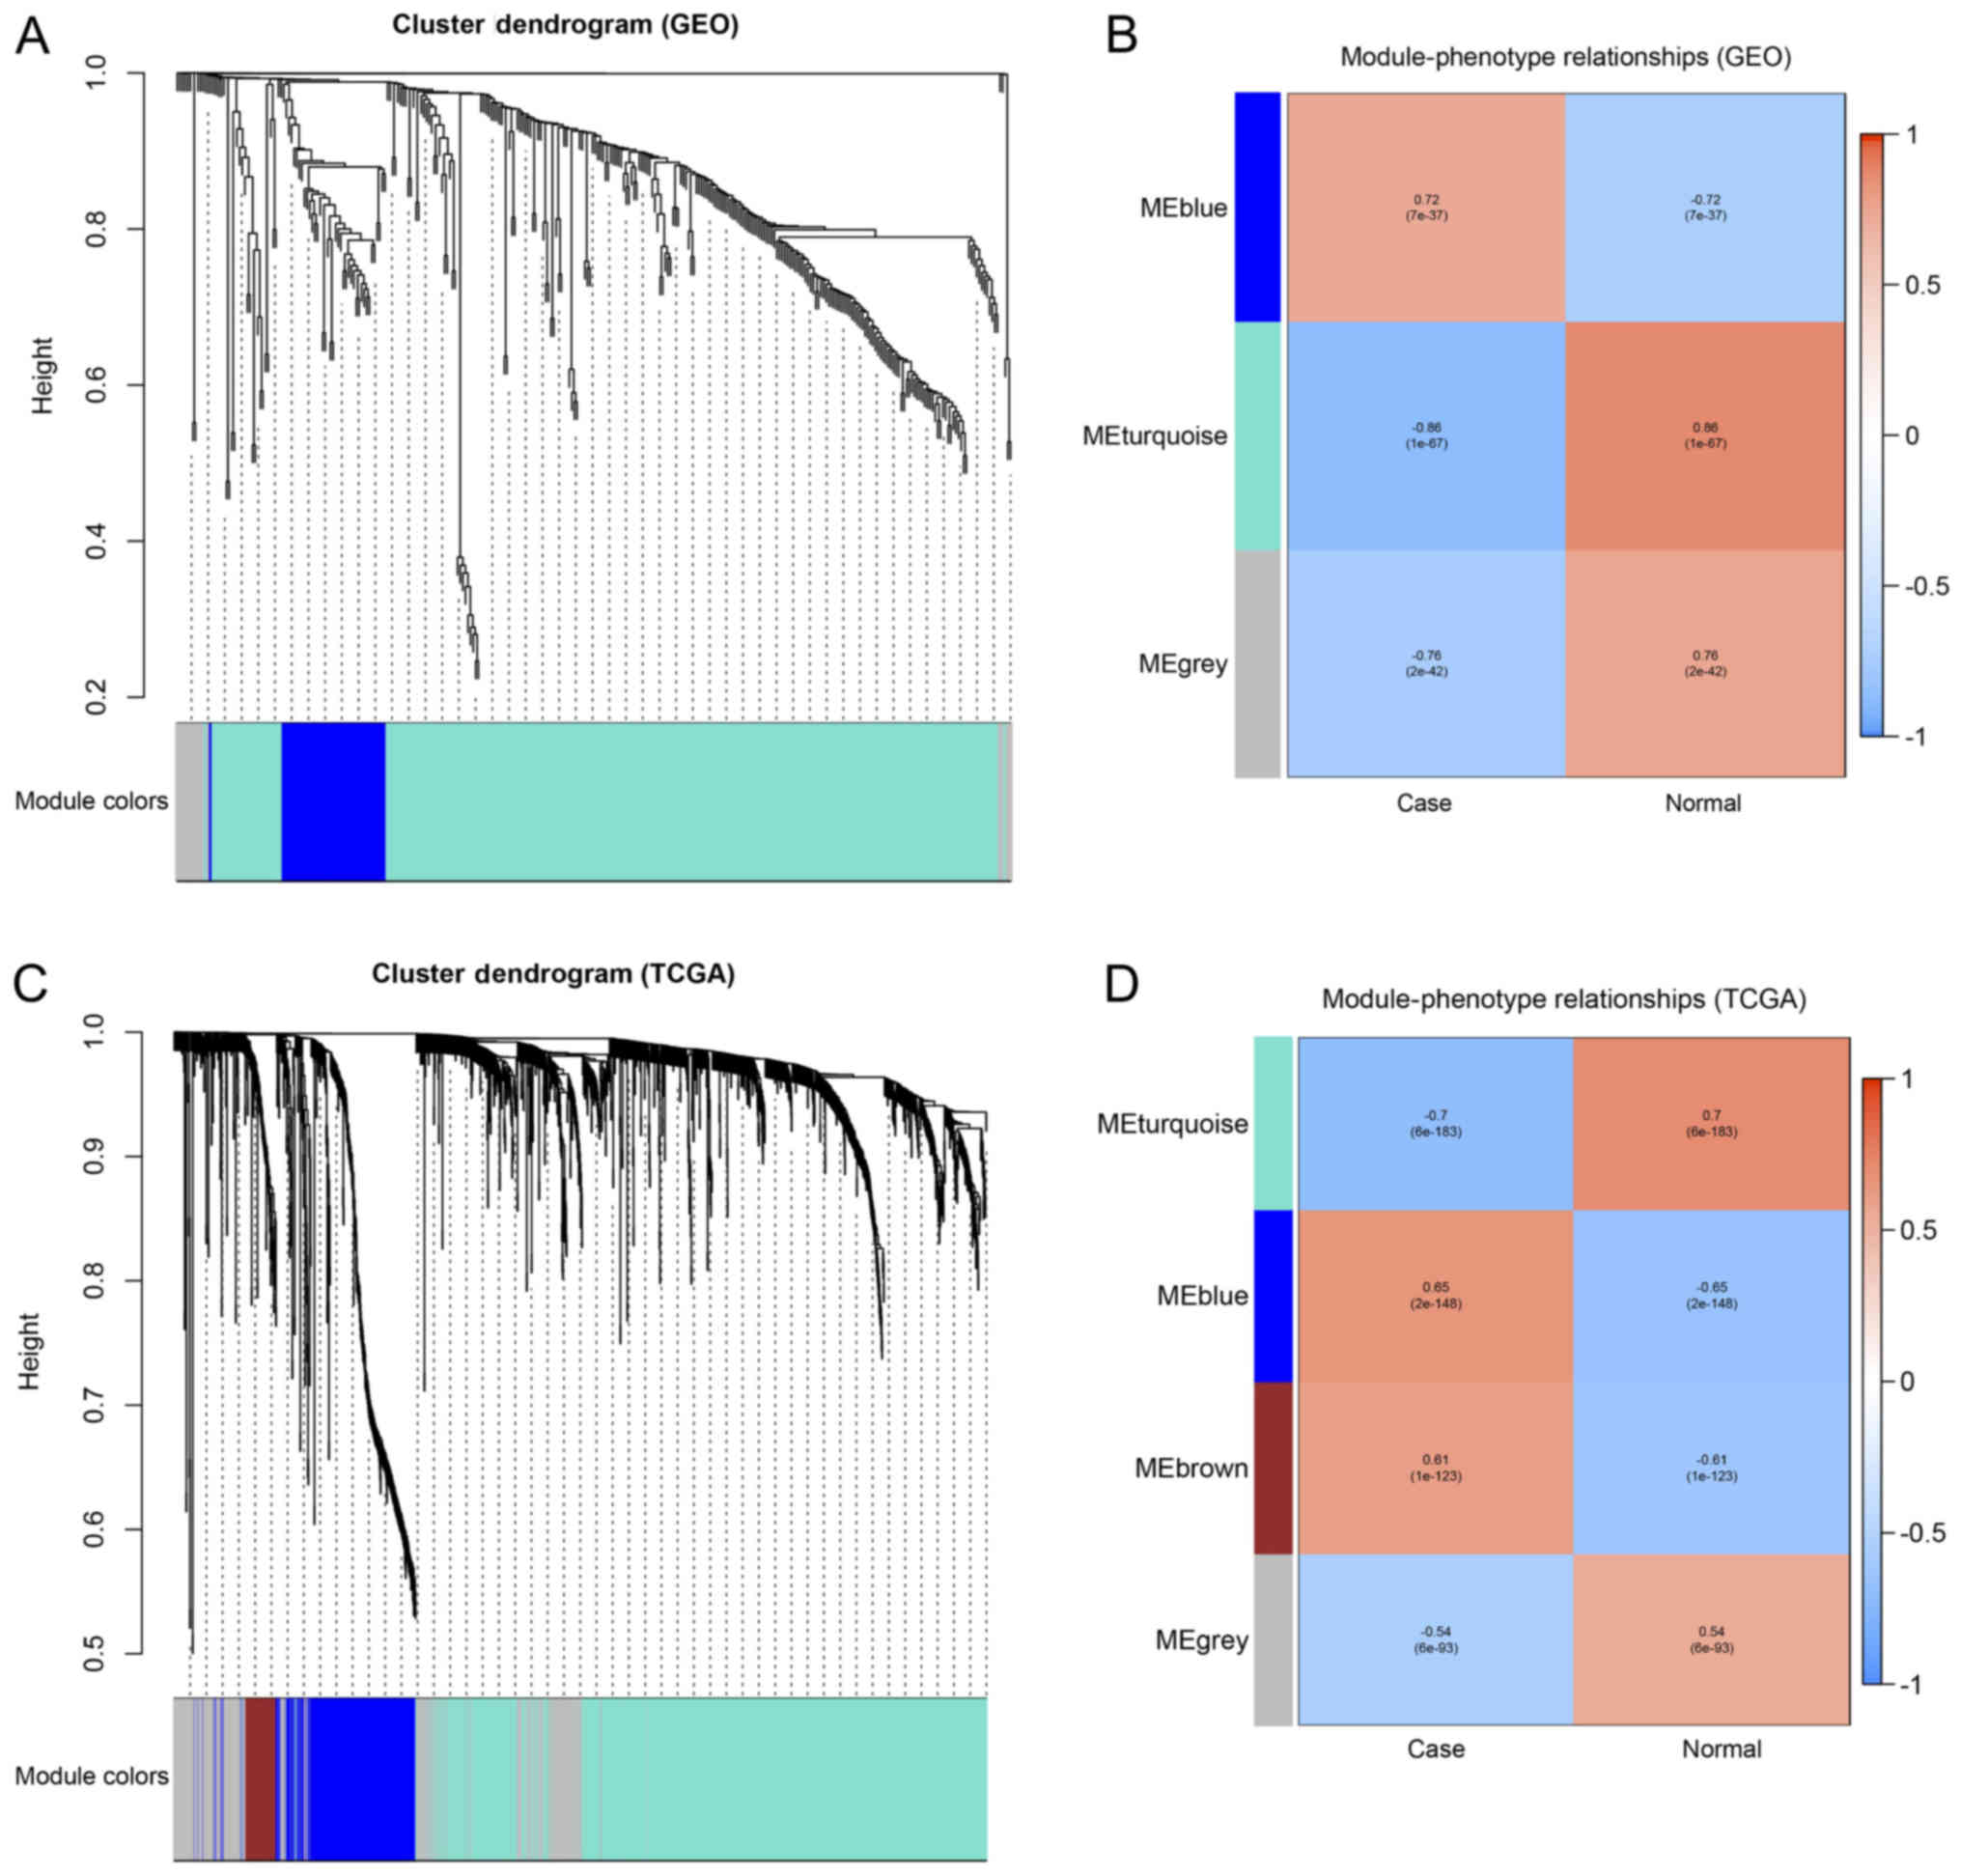 | Figure 4.Weighted correlation co-expression
network analysis of the GEO datasets and TCGA dataset. (A) Gene
dendrogram obtained by clustering the DEGs from the GEO datasets. A
total of 3 modules (MEblue, MEturquoise and MEgrey) were marked
with different colors (blue, turquoise and gray, respectively). (B)
Association between the consensus MEs and phenotypes in the GEO
datasets. (C) Gene dendrogram obtained by clustering the DEGs in
TCGA dataset. A total of 4 modules (MEturquoise, MEblue, MEbrown
and MEgrey) were marked with different colors (turquoise, blue,
brown and gray, respectively). (D) Correlations between consensus
MEs and phenotypes in the TCGA dataset. GEO, Gene Expression
Omnibus; TCGA, The Cancer Genome Atlas; DEG, differentially
expressed gene; ME, module eigengene. |
Hub gene selection
According to the WGCNA results, 35 genes were
correlated with the blue module. Of the 35 genes, 17 genes
identified from the PPI network were consistent across the WGCNA
network. Therefore, 17 common network genes [aurora kinase A
(AURKA), baculoviral inhibitor of apoptosis
repeat-containing protein 5 (BIRC5), mitotic checkpoint
serine/threonine-protein kinase BUB1β (BUB1B),
G2/mitotic-specific cyclin-B (CCNB)1, CCNB2, cell division
cycle 20 (CDC20), cyclin-dependent kinase (CDK)1, CDK
inhibitor 3 (CDKN3), centrosome protein F (CENPF),
insulin-like growth factor 1 (IGF1), mitotic spindle
assembly checkpoint protein MAD2A (MAD2L1), protein
regulator of cytokinesis 1 (PRC1), pituitary
tumor-transforming gene 1 protein (PTTG1), DNA topoisomerase
2α (TOP2A), targeting protein for Xklp2 (TPX2),
ubiquitin-conjugating enzyme E2 C (UBE2C) and ZW10
interacting (ZWINT)] were considered hub genes and subjected
to further analysis and validation.
Construction of the co-expression
network from the TCGA dataset for further validation
For further validation, TCGA-breast cancer
expression dataset of 1,217 samples was downloaded (113 normal
samples and 1,104 tumor samples), and the WGCNA was performed using
the aforementioned method. A total of 4 modules were identified,
MEturquoise, MEblue, MEbrown and MEgrey (Fig. 4C), and the MEblue and MEbrown modules
exhibited more marked correlations with the breast cancer phenotype
compared with the other modules (Fig.
4D). Upon integrating the 17 hub genes obtained from the PPI
and WGCNA network, the MAD2L1 and IGF1 genes were not
found in MEblue or MEbrown module and were excluded from the hub
gene list. The remaining 15 genes (AURKA, BIRC5, BUB1B, CCNB1,
CCNB2, CDC20, CDK1, CDKN3, CENPF, PRC1, PTTG1, TOP2A, TPX2,
UBE2C and ZWINT) were present in MEblue. Based on the
results obtained, 15 hub genes were identified in breast
cancer.
KEGG pathway analysis and GO
enrichment analysis of final 15 hub genes
According to the result mentioned above, the 15 hub
genes were identified and performed with KEGG and GO enrichment
analysis subsequently. The result of KEGG enrichment analysis
showed that these hub genes were primarily associated with ‘cell
cycle’, ‘oocyte meiosis’ and ‘p53 signaling pathway’, and the GO
enrichment analysis also demonstrated that they were significantly
involved in cell cycle, cell division, nuclear division and
chromosome segregation processes (Fig.
S1 and Table SIII)
KM survival analysis
To further evaluate the prognostic importance of the
hub genes in the present study, overall survival analysis was
performed to examine the association between the expression of each
gene and the overall survival time of patients with breast cancer
(Fig. 5). The patients were
separated into a high expression and a low expression group based
on the median level of expression. All hub genes with higher
expression levels were associated with a significantly shorter
overall survival time among patients with breast cancer, suggesting
that these hub genes are associated with the pathophysiology of
breast cancer to varying extents and may serve as potential
prognostic biomarkers to monitor the severity of breast cancer or
predict the survival time of patients, or as therapeutic
targets.
Discussion
Although the treatment of breast cancer has
improved, it remains the most prevalent malignant tumor with the
highest increase in prevalence among women worldwide (2,3). The
identification of the molecular mechanisms of breast cancer is
crucial to its diagnosis, therapy and prognosis. DNA microarray
gene expression profiles are widely used to explore DEGs involved
in tumorigenesis, which has provided valuable information for
clinical applications (31).
In the present study, two gene expression profile
datasets (GSE10810 and GSE65194) from the GEO database were
retrieved and analyzed. A total of 322 consistent DEGS were first
identified (69 upregulated DEGs and 253 downregulated DEGs) using
the ‘limma’ R package. The common DEGs were filtered out and 17 hub
genes were identified that were detected in the PPI and WGCNA
co-expression networks, using an integrated bioinformatics
analysis. To further validate these breast cancer hub genes,
TCGA-breast cancer data were screened and extracted into the
modules associated with a breast cancer phenotype using WGCNA. Of
the 17 genes, 15 true hub genes (AURKA, BIRC5, BUB1B, CCNB1,
CCNB2, CDC20, CDK1, CDKN3, CENPF, PRC1, PTTG1, TOP2A, TPX2,
UBE2C and ZWINT) that are closely associated with breast
cancer were identified. The present study may provide valuable
information for treatment decisions and prognostic predictions for
breast cancer.
The 15 hub genes were all commonly overexpressed
among patients with breast cancer. According to the KEGG enrichment
analysis, these hub genes were primarily associated with ‘cell
cycle’, ‘oocyte meiosis’ and ‘p53 signaling pathway’, and the GO
enrichment analysis also demonstrated that they were significantly
involved in cell cycle, cell division, nuclear division and
chromosome segregation processes. Based on the results of the KEGG
and GO analyses, these hub genes were generally associated with
chromosome instability, and may serve an important role in
tumorigenesis and tumor proliferation. Furthermore, based on the
results of a KM survival analysis of each hub genes, it was
identified that higher expression of each gene was associated with
a worse prognosis among patients with breast cancer. Therefore, the
15 hub genes may be closely associated with breast cancer
pathophysiology and represent potential prognostic biomarkers.
An additional 3 of the 15 hub genes (BUB1B,
TOP2A and AURKA) are frequently identified in the OncoKB
cancer gene list (oncokb.org/#/cancerGenes), which collects a large
number of genes that are associated with cancer, based on their
inclusion in various different sequencing panels, the Sanger Cancer
Gene Census or the comprehensive study (32). BUB1B encodes a kinase that is
associated with spindle checkpoint function and controls proper
chromosome segregation during cell division (33). The BUB1B protein is localized to the
kinetochore and is involved in the anaphase-promoting
complex/cyclosome inhibition, which delays the onset of anaphase
and ensures proper chromosome segregation. Therefore, BUB1B serves
important roles in tumor proliferation and progression among
multiple cancer types (34). As a
checkpoint-associated gene, BUB1B overexpression may
increase the risk of cancer (35).
TOP2A encodes DNA topoisomerase, an enzyme that controls the
topological states of DNA and cell progression (36). The TOP2A protein is primarily
associated with processes such as chromatid separation, chromosome
condensation, and the relief of torsional stress that occurs during
DNA transcription and replication. The upregulation of TOP2A is
associated with female breast cancer and other cancer types
(37). As a negative regulator of
p53, AURKA promotes tumor growth and cell survival (38). Myc proto-oncogene and AURKA
regulate the expression of the other genes at the transcriptional
level and contribute to the development of liver carcinoma
(39).
The proteins encoded by the remaining 12 hub genes
are associated with a number of tumor processes. PTTG1
prevents separin from promoting sister chromatid separation by
encoding for securin proteins, and promotes tumor cell growth
(40) and malignancy in breast
cancer (41). CDK1 promotes cell
cycle gene expression and is necessary for accurate cell division
(42). Strategies targeting CDK1
inhibit the proliferation of liver cancer cells (43). As a member of the E2
ubiquitin-conjugating enzyme family, the protein encoded by UBE2C
serves important roles in mitotic cyclin disassembly and the cell
cycle. Therefore, UBE2C may affect the progression of cancer to a
certain extent (44,45). BIRC5 is a protein-coding gene
from the inhibitor of apoptosis gene family. BIRC5 functions as a
negative regulator of apoptosis (46,47).
CCNB1 and CCNB2 are members of the cyclin family. As important
components in cell cycle regulation, CCNB1 and CCNB2 appear to
function as oncogenes and are associated with breast cancer,
according to numerous studies (48–50).
CDC20 serves as a regulatory protein during cell cycle progression,
and performs certain functions in coordination with a series of
other proteins, such as serving as an activator of the
anaphase-promoting complex/cyclosome during the metaphase-anaphase
transition, and the overexpression of CDC20 is associated with
tumorigenesis and tumor progression (51–53).
Furthermore, CDC20 is associated with reduced survival in patients
with breast cancer (54). ZWINT is
involved in kinetochore function and its overexpression affects the
proliferation of breast cancer cells (55). CENPF is required for kinetochore
function during cell division and is associated with the cell
cycle, mitotic and cell proliferative pathways. CENPF, together
with forkhead box protein M1, coordinately promote cancer
malignancy (56,57). PRC1 encodes a protein that is
involved in cytokinesis and is essential for cell cleavage
(58). PRC1 overexpression
was detected in p53-deficient cells, and the negative regulatory
feedback mechanism was controlled by p53 (59). CDKN3 encodes a
cyclin-dependent kinase inhibitor protein that is essential for
normal mitosis and the G1/S transition (60). CDKN3 overexpression in cancer is
typically associated with a poor survival outcome for patients
(61). Therefore, it is a potential
therapeutic target in cancer treatment studies (62). TPX2 encodes a spindle assembly
factor required for the normal assembly of mitotic spindles and for
the normal assembly of microtubules around the chromosomes during
apoptosis (63). TPX2 may serve as a
prognostic marker and promote the proliferation, progression,
migration and invasion of breast cancer (64).
In conclusion, the present study identified 322
consistent candidate DEGs and demonstrated the presence of 15 hub
genes using expression profiles from datasets containing multiple
cohorts and a series of bioinformatics analyses. These hub genes
were significantly enriched in ‘cell cycle’, ‘oocyte meiosis’ and
‘p53 signaling pathway’, in addition to cell division, nuclear
division, chromosome segregation and other tumor-associated
processes, which may prove their value in clinical applications
designed to treat breast cancer. The present study may effectively
improve our understanding of the innate causes of breast cancer,
and the 15 hub genes may serve as biomarkers for the prediction,
diagnosis, individualized prevention, treatment and prognosis of
breast cancer.
Supplementary Material
Supporting Data
Acknowledgements
The authors are grateful to the technical team at
BGI-Shenzhen for their assistance and technical support. The
authors would like to thank all the members of the BGI Cancer
Genomics Institute research group for their enthusiastic
involvement in the present study.
Funding
The present study was supported by funding from The
Shenzhen Municipal Government of China (Shenzhen, China; grant no.
JSGG20140702161347218).
Availability of data and materials
The datasets analyzed in the present study are
available from the GEO repository at (https://www.ncbi.nlm.nih.gov/geo/query/acc.cgi?acc=GSE10810)
and (https://www.ncbi.nlm.nih.gov/geo/query/acc.cgi?acc=GSE65194),
and TCGA repository at (https://xenabrowser.net/datapages/?cohort=GDC%20TCGA%20Breast%20Cancer%20).
The data presented in the present study is available from the
authors on reasonable request.
Authors' contributions
HJ and XH analyzed the data and made major
contributions to writing the manuscript. KS and GL analyzed the
data and contributed to revising the article. JW and HY contributed
to the design of the study and provided final approval of the
manuscript. YH contributed to the design of the study and assisted
with writing the manuscript. All authors read and approved the
final manuscript.
Ethics approval and consent to
participate
Not applicable.
Patient consent for publication
Not applicable.
Competing interests
The authors declare that they have no competing
interests.
References
|
1
|
Kamangar F, Dores GM and Anderson WF:
Patterns of cancer incidence, mortality, and prevalence across five
continents: Defining priorities to reduce cancer disparities in
different geographic regions of the world. J Clin Oncol.
24:2137–2150. 2006. View Article : Google Scholar : PubMed/NCBI
|
|
2
|
Ghoncheh M, Pournamdar Z and Salehiniya H:
Incidence and mortality and epidemiology of breast cancer in the
world. Asian Pac J Cancer Prev. 17:43–46. 2016. View Article : Google Scholar : PubMed/NCBI
|
|
3
|
Ataollahi MR, Sharifi J, Paknahad MR and
Paknahad A: Breast cancer and associated factors: A review. J Med
Life. 8:6–11. 2015.PubMed/NCBI
|
|
4
|
Tankard RM, Bennett MF, Degorski P,
Delatycki MB, Lockhart PJ and Bahlo M: Detecting expansions of
tandem repeats in cohorts sequenced with short-read sequencing
data. Am J Hum Genet. 103:858–873. 2018. View Article : Google Scholar : PubMed/NCBI
|
|
5
|
Medicine N: The future of cancer genomics.
Nat Med. 21:992015. View
Article : Google Scholar : PubMed/NCBI
|
|
6
|
International Cancer Genome Consortium,
Hudson TJ, Anderson W, Artez A, Barker AD, Bell C, Bernabé RR, Bhan
MK, Calvo F, Eerola I, et al: International network of cancer
genome projects. Nature. 464:993–998. 2010. View Article : Google Scholar : PubMed/NCBI
|
|
7
|
Barrett T, Wilhite SE, Ledoux P,
Evangelista C, Kim IF, Tomashevsky M, Marshall KA, Phillippy KH,
Sherman PM, Holko M, et al: NCBI GEO: Archive for functional
genomics data sets-update. Nucleic Acids Res. 39:D991–D995.
2013.
|
|
8
|
Ong SL, Gravante G, Metcalfe MS and
Dennison AR: History, ethics, advantages and limitations of
experimental models for hepatic ablation. World J Gastroenterol.
19:147–154. 2013. View Article : Google Scholar : PubMed/NCBI
|
|
9
|
Afshari E, Rostami M and Farahmand F:
Review on different experimental techniques developed for recording
force-deformation behaviour of soft tissues; with a view to surgery
simulation applications. J Med Eng Technol. 41:257–274. 2017.
View Article : Google Scholar : PubMed/NCBI
|
|
10
|
Moldovan L, Mitroi A, Petrescu CM and
Aschie M: Classification of breast carcinomas according to gene
expression profiles. J Med Life. 6:14–17. 2013.PubMed/NCBI
|
|
11
|
Srivastava P, Mangal M and Agarwal SM:
Understanding the transcriptional regulation of cervix cancer using
microarray gene expression data and promoter sequence analysis of a
curated gene set. Gene. 535:233–238. 2014. View Article : Google Scholar : PubMed/NCBI
|
|
12
|
Kandoth C, Mclellan MD, Vandin F, Ye K,
Niu B, Lu C, Xie M, Zhang Q, McMichael JF, Wyczalkowski MA, et al:
Mutational landscape and significance across 12 major cancer types.
Nature. 502:333–339. 2013. View Article : Google Scholar : PubMed/NCBI
|
|
13
|
Guo Y, Bao Y, Ma M and Yang W:
Identification of key candidate genes and pathways in colorectal
cancer by integrated bioinformatical analysis. Int J Mol Sci.
18:E7222017. View Article : Google Scholar : PubMed/NCBI
|
|
14
|
Pan Q, Long X, Song L, Zhao D, Li X, Li D,
Li M, Zhou J, Tang X, Ren H and Ding K: Transcriptome sequencing
identified hub genes for hepatocellular carcinoma by weighted-gene
co-expression analysis. Oncotarget. 7:38487–38499. 2016. View Article : Google Scholar : PubMed/NCBI
|
|
15
|
Yin L, Cai Z, Zhu B and Xu C:
Identification of key pathways and genes in the dynamic progression
of HCC based on WGCNA. Genes. 9:E922018. View Article : Google Scholar : PubMed/NCBI
|
|
16
|
Zhou Z, Cheng Y, Jiang Y, Liu S, Zhang M,
Liu J and Zhao Q: Ten hub genes associated with progression and
prognosis of pancreatic carcinoma identified by co-expression
analysis. Int J Biol Sci. 14:124–136. 2018. View Article : Google Scholar : PubMed/NCBI
|
|
17
|
Langfelder P and Horvath S: WGCNA: An R
package for weighted correlation network analysis. BMC
Bioinformatics. 9:5592008. View Article : Google Scholar : PubMed/NCBI
|
|
18
|
Zhang X, Feng H, Li Z, Li D, Liu S, Huang
H and Li M: Application of weighted gene co-expression network
analysis to identify key modules and hub genes in oral squamous
cell carcinoma tumorigenesis. OncoTargets Ther. 11:6001–6021. 2018.
View Article : Google Scholar
|
|
19
|
Pedraza V, Gomezcapilla JA, Escaramis G,
Gomez C, Torné P, Rivera JM, Gil A, Araque P, Olea N, Estivill X
and Fárez-Vidal ME: Gene expression signatures in breast cancer
distinguish phenotype characteristics, histologic subtypes, and
tumor invasiveness. Cancer. 116:486–496. 2010. View Article : Google Scholar : PubMed/NCBI
|
|
20
|
Maubant S, Tesson B, Maire V, Ye M,
Rigaill G, Gentien D, Cruzalegui F, Tucker GC, Roman-Roman S and
Dubois T: Transcriptome analysis of Wnt3a-treated triple-negative
breast cancer cells. PLoS One. 10:e01223332015. View Article : Google Scholar : PubMed/NCBI
|
|
21
|
Smyth GK: limma: Linear models for
microarray data. In: Bioinformatics and Computational Biology
Solutions Using R and Bioconductor. Gentleman R, Carey VJ, Huber W,
Irizarry RA and Dudoit S: Springer; New York, NY: pp. 397–420.
2005
|
|
22
|
R Core Team: A language and environment
for statistical computing R Foundation for Statistical Computing,
Vienna, Austria. https://www.R-project.org/June
16–2014PubMed/NCBI
|
|
23
|
Bland JM and Altman DG: Multiple
significance tests: The Bonferroni method. BMJ. 310:1701995.
View Article : Google Scholar : PubMed/NCBI
|
|
24
|
Kanehisa M and Goto S: KEGG: Kyoto
encyclopedia of genes and genomes. Nucleic Acids Res. 28:27–30.
2000. View Article : Google Scholar : PubMed/NCBI
|
|
25
|
Ashburner M, Ball CA, Blake JA, Botstein
D, Butler H, Cherry JM, Davis AP, Dolinski K, Dwight SS, Eppig JT,
et al: Gene Ontology: Tool for the unification of biology. Nat
Genet. 25:25–29. 2000. View
Article : Google Scholar : PubMed/NCBI
|
|
26
|
Yu G, Wang LG, Han Y and He QY:
ClusterProfiler: An R package for comparing biological themes among
gene clusters. OMICS. 16:284–287. 2012. View Article : Google Scholar : PubMed/NCBI
|
|
27
|
Szklarczyk D, Morris JH, Cook H, Kuhn M,
Wyder S, Simonovic M, Santos A, Doncheva NT, Roth A, Bork P, et al:
The STRING database in 2017: quality-controlled protein-protein
association networks, made broadly accessible. Nucleic Acids Res.
45:D362–D368. 2017. View Article : Google Scholar : PubMed/NCBI
|
|
28
|
Shannon P, Markiel A, Ozier O, Baliga NS,
Wang JT, Ramage D, Amin N, Schwikowski B and Ideker T: Cytoscape: A
software environment for integrated models of biomolecular
interaction networks. Genome Res. 13:2498–2504. 2003. View Article : Google Scholar : PubMed/NCBI
|
|
29
|
Bader GD and Hogue CW: An automated method
for finding molecular complexes in large protein interaction
networks. BMC Bioinformatics. 4:22003. View Article : Google Scholar : PubMed/NCBI
|
|
30
|
Lánczky A, Nagy Á, Bottai G, Munkácsy G,
Szabó A, Santarpia L and Győrffy B: miRpower: A web-tool to
validate survival-associated miRNAs utilizing expression data from
2178 breast cancer patients. Breast Cancer Res Treat. 160:439–446.
2016. View Article : Google Scholar : PubMed/NCBI
|
|
31
|
Mohr S, Leikauf GD, Keith G and Rihn BH:
Microarrays as cancer keys: An array of possibilities. J Clin
Oncol. 20:3165–3175. 2002. View Article : Google Scholar : PubMed/NCBI
|
|
32
|
Chakravarty D, Gao J, Phillips SM, Kundra
R, Zhang H, Wang J, Rudolph JE, Yaeger R, Soumerai T, Nissan MH, et
al: OncoKB: A precision oncology knowledge base. JCO Precis Oncol.
2017:2017.
|
|
33
|
de Voer RM, Geurts VKA, Weren RD,
Ligtenberg MJ, Smeets D, Fu L, Vreede L, Kamping EJ, Verwiel ET,
Hahn MM, et al: Germline mutations in the spindle assembly
checkpoint genes BUB1 and BUB3 are risk factors for colorectal
cancer. Gastroenterology. 145:544–547. 2013. View Article : Google Scholar : PubMed/NCBI
|
|
34
|
Takagi K, Miki Y, Shibahara Y, Nakamura Y,
Ebata A, Watanabe M, Ishida T, Sasano H and Suzuki T: BUB1
immunolocalization in breast carcinoma: Its nuclear localization as
a potent prognostic factor of the patients. Horm Cancer. 4:92–102.
2013. View Article : Google Scholar : PubMed/NCBI
|
|
35
|
Xin F, Guo C, Cai ZD, Wang C, Liu ZZ, Lin
ZY, Wu YD, Liang YX, Han ZD, Liu JC and Zhong WD: Overexpression of
BUB1B contributes to progression of prostate cancer and predicts
poor outcome in patients with prostate cancer. Onco Targets Ther.
9:2211–2220. 2016.PubMed/NCBI
|
|
36
|
De MR, Vieira S, Chinen LT, Chiappelli F,
da Fonseca FP, Guimarães GC, Soares FA, Neves I, Pagotty S,
Pellionisz PA, et al: Prognostication of prostate cancer based on
TOP2A protein and gene assessment: TOP2A in prostate cancer. J
Transl Med. 11:362013. View Article : Google Scholar : PubMed/NCBI
|
|
37
|
Panvichian R, Tantiwetrueangdet A,
Angkathunyakul N and Leelaudomlipi S: TOP2A amplification and
overexpression in hepatocellular carcinoma tissues. Biomed Res Int.
2015:3816022015. View Article : Google Scholar : PubMed/NCBI
|
|
38
|
Sehdev V, Katsha A, Arras J, Peng D,
Soutto M, Ecsedy J, Zaika A, Belkhiri A and El-Rifai W: HDM2
regulation by AURKA promotes cell survival in gastric cancer. Clin
Cancer Res. 20:76–86. 2014. View Article : Google Scholar : PubMed/NCBI
|
|
39
|
Lu L, Han H, Tian Y, Li W, Zhang J, Feng M
and Li Y: Aurora kinase A mediates c-Myc's oncogenic effects in
hepatocellular carcinoma. Mol Carcinog. 54:1467–1479. 2014.
View Article : Google Scholar : PubMed/NCBI
|
|
40
|
Xiea Y and Wangb R: Pttg1 promotes growth
of breast cancer through P27 nuclear exclusion. Cell Physiol
Biochem. 38:393–400. 2016. View Article : Google Scholar : PubMed/NCBI
|
|
41
|
Yoon CH, Kim MJ, Lee H, Kim RK, Lim EJ,
Yoo KC, Lee GH, Cui YH, Oh YS, Gye MC, et al: PTTG1 Oncogene
promotes tumor malignancy via epithelial to mesenchymal transition
and expansion of cancer stem cell population. J Biol Chem.
287:19516–19527. 2012. View Article : Google Scholar : PubMed/NCBI
|
|
42
|
Landry BD, Mapa CE, Arsenault HE, Poti KE
and Benanti JA: Regulation of a transcription factor network by
Cdk1 coordinates late cell cycle gene expression. EMBO J.
33:1044–1060. 2014. View Article : Google Scholar : PubMed/NCBI
|
|
43
|
Zhang Y, Huang W, Ran Y, Xiong Y, Zhong Z,
Fan X, Wang Z and Ye Q: miR-582-5p inhibits proliferation of
hepatocellular carcinoma by targeting CDK1 and AKT3. Tumor Biol.
36:8309–8316. 2015. View Article : Google Scholar
|
|
44
|
Rawat A, Gopal G, Selvaluxmy G and
Rajkumar T: Inhibition of ubiquitin conjugating enzyme UBE2C
reduces proliferation and sensitizes breast cancer cells to
radiation, doxorubicin, tamoxifen and letrozole. Cell Oncol.
36:459–467. 2013. View Article : Google Scholar
|
|
45
|
Chou CP, Huang NC, Jhuang SJ, Pan HB, Peng
NJ, Cheng JT, Chen CF, Chen JJ and Chang TH: Ubiquitin-conjugating
enzyme UBE2C is highly expressed in breast microcalcification
lesions. PLoS One. 9:e939342014. View Article : Google Scholar : PubMed/NCBI
|
|
46
|
Ghaffari K, Hashemi M, Ebrahimi E and
Shirkoohi R: BIRC5 genomic copy number variation in early-onset
breast cancer. Iran Biomed J. 20:241–245. 2016.PubMed/NCBI
|
|
47
|
Hamy AS, Bieche I, Lehmannche-Che J, Scott
V, Bertheau P, Guinebretière JM, Matthieu MC, Sigal-Zafrani B,
Tembo O, Marty M, et al: BIRC5 (survivin): A pejorative prognostic
marker in stage II/III breast cancer with no response to
neoadjuvant chemotherapy. Breast Cancer Res Treat. 159:499–511.
2016. View Article : Google Scholar : PubMed/NCBI
|
|
48
|
Ding K, Li W, Zou Z, Zou X and Wang C:
CCNB1 is a prognostic biomarker for ER+ breast cancer. Med
Hypotheses. 83:359–364. 2014. View Article : Google Scholar : PubMed/NCBI
|
|
49
|
Li Y, Chen YL, Xie YT, Zheng LY, Han JY,
Wang H, Tian XX and Fang WG: Association study of germline variants
in CCNB1 and CDK1 with breast cancer susceptibility, progression,
and survival among chinese han women. PLoS One. 8:e844892013.
View Article : Google Scholar : PubMed/NCBI
|
|
50
|
Shubbar E, Kovács A, Hajizadeh S, Parris
TZ, Nemes S, Gunnarsdóttir K, Einbeigi Z, Karlsson P and Helou K:
Elevated cyclin B2 expression in invasive breast carcinoma is
associated with unfavorable clinical outcome. BMC Cancer. 13:12013.
View Article : Google Scholar : PubMed/NCBI
|
|
51
|
Chang LF, Zhang Z, Yang J, Mclaughlin SH
and Barford D: Molecular architecture and mechanism of the
anaphase-promoting complex. Nature. 513:388–393. 2014. View Article : Google Scholar : PubMed/NCBI
|
|
52
|
Sewart K and Hauf S: Different
functionality of Cdc20 binding sites within the mitotic checkpoint
complex. Curr Biol. 27:1213–1220. 2017. View Article : Google Scholar : PubMed/NCBI
|
|
53
|
Wang L, Zhang J, Wan L, Zhou X, Wang Z and
Wei W: Targeting Cdc20 as a novel cancer therapeutic strategy.
Pharmacol Ther. 151:141–151. 2015. View Article : Google Scholar : PubMed/NCBI
|
|
54
|
Karra H, Repo H, Ahonen I, Löyttyniemi E,
Pitkänen R, Lintunen M, Kuopio T, Söderström M and Kronqvist P:
Cdc20 and securin overexpression predict short-term breast cancer
survival. Br J Cancer. 110:2905–2913. 2014. View Article : Google Scholar : PubMed/NCBI
|
|
55
|
Endo H, Ikeda K, Urano T, Horie-Inoue K
and Inoue S: Terf/TRIM17 stimulates degradation of kinetochore
protein ZWINT and regulates cell proliferation. J Biochem.
151:139–144. 2012. View Article : Google Scholar : PubMed/NCBI
|
|
56
|
Lokody I: Signalling: FOXM1 and CENPF:
Co-pilots driving prostate cancer. Nat Rev Cancer. 14:450–451.
2014. View Article : Google Scholar : PubMed/NCBI
|
|
57
|
Aytes A, Mitrofanova A, Lefebvre C,
Alvarez MJ, Castillo-Martin M, Zheng T, Eastham JA, Gopalan A,
Pienta KJ, Shen MM, et al: Cross-species regulatory network
analysis identifies a synergistic interaction between FOXM1 and
CENPF that drives prostate cancer malignancy. Cancer Res.
25:638–651. 2014.
|
|
58
|
Mollinari C, Kleman JP, Jiang W, Schoehn
G, Hunter T and Margolis RL: PRC1 is a microtubule binding and
bundling protein essential to maintain the mitotic spindle midzone.
J Cell Biol. 157:1175–1186. 2002. View Article : Google Scholar : PubMed/NCBI
|
|
59
|
Li C, Lin M and Liu J: Identification of
PRC1 as the p53 target gene uncovers a novel function of p53 in the
regulation of cytokinesis. Oncogene. 23:9336–9347. 2004. View Article : Google Scholar : PubMed/NCBI
|
|
60
|
Nalepa G, Barnholtzsloan J, Enzor R, Dey
D, He Y, Gehlhausen JR, Lehmann AS, Park SJ, Yang Y, Yang X, et al:
The tumor suppressor CDKN3 controls mitosis. J Cell Biol.
201:997–1012. 2013. View Article : Google Scholar : PubMed/NCBI
|
|
61
|
Fan C, Chen L, Huang Q, Shen T, Welsh EA,
Teer JK, Cai J, Cress WD and Wu J: Overexpression of majorCDKN3
transcripts is associated with poor survival in lung
adenocarcinoma. Br J Cancer. 113:1735–1743. 2015. View Article : Google Scholar : PubMed/NCBI
|
|
62
|
Berumen J, Espinosa AM and Medina I:
Targeting CDKN3 in cervical cancer. Expert Opin Ther Targets.
18:1149–1162. 2014. View Article : Google Scholar : PubMed/NCBI
|
|
63
|
Wittmann T, Wilm M, Karsenti E and Vernos
I: Tpx2, a novel xenopus map involved in spindle pole organization.
J Cell Biol. 149:1405–1418. 2000. View Article : Google Scholar : PubMed/NCBI
|
|
64
|
Yang Y, Li DP, Shen N, Yu XC, Li JB, Song
Q and Zhang JH: TPX2 promotes migration and invasion of human
breast cancer cells. Asian Pac J Trop Med. 8:1064–1070. 2015.
View Article : Google Scholar : PubMed/NCBI
|