Introduction
Head and neck cancer is the eighth most common
cancer worldwide. Oral cancers account for approximately one-half
of head and neck cancers. In 2018, approximately 345,900 new cases
of oral cancer were documented and 177,400 deaths from the disease
occurred worldwide (1). In Japan, it
is estimated that over 9,000 new cases of head and neck cancer
occurred in 2015. Among them, over 2,000 new oral cancers were
added to the clinical statistics registry, 90% of which were
diagnosed histologically as squamous cell carcinoma (Japan Society
for Head and Neck Cancer, 2015). Advances in surgical techniques,
radiotherapy, and chemotherapy have improved the extent of organ
preservation and the overall quality of life and have decreased
morbidity. However, a better understanding of the molecular
mechanisms underlying the transitions from normal epithelium to
pre-malignancy to invasive oral carcinoma is still necessary for
improving the long-term survival of affected patients.
To examine the mechanisms underlying this process in
detail, we established a transcriptional progression database for
oral tumorigenesis in identical oral cancer samples using laser
microdissection and expression microarray analysis. Then, we
examined genes that were differentially expressed in normal tissues
compared with oral dysplastic lesions (ODLs) and in ODLs compared
with invasive carcinomas and identified 15 candidate genes with
continuously increasing or decreasing expression during oral
carcinogenesis (2). Furthermore,
several candidate genes that specifically contribute to the
transitioning of ODLs to invasive carcinomas were found using this
database (3).
Cancer metabolism is clearly distinct from normal
cellular metabolism. Many cancer cells exhibit a specific type of
irregular metabolism characterized by a high dependence on
glycolysis to meet their higher energy requirements (4). This is called the ‘Warburg effect,’
which depends on aerobic glycolysis and is characterized by cancer
phenotypes such as a high glycolytic rate and elevated lactate
production under normoxia (5,6). Because
tumor cells are often exposed to hypoxia under physiological
conditions, their sustained hypoxic metabolism may be a direct
cause of the Warburg effect; however, the underlying mechanism
remains incompletely understood. Glucose metabolism changes support
the acquisition and maintenance of malignant properties. Because
some altered metabolic features are observed in many types of
malignant cells, reprogrammed metabolism is a characteristic common
to cancer cells and is considered a very significant alteration
contributing to the development and maintenance of malignant
phenotypes. Regarding oral cancer, such reprogrammed metabolism is
also regarded as a crucial factor for oral carcinogenesis and is
associated with radiotherapy and chemotherapy resistance, as well
as tumor recurrence (7). Evidence
suggests that various metabolic changes occurring in cancer cells,
glycolysis, mitochondrial oxidative phosphorylation, and
glutaminolysis play particularly important roles in tumor
metabolism (8). Understanding
metabolic changes occurring in cancer cells has uncovered
remarkable activities in specific pathways activated by tumor cells
that support these key functions. However, it has not been
elucidated how and when metabolic changes occur during
carcinogenesis in oral cancer. In this study, we aimed to identify
significant metabolic alterations during oral carcinogenesis using
our transcriptional progression database.
Patients and methods
Patients and tissue samples
All clinical and histopathological data were
reviewed from medical records of the Department of Maxillofacial
Surgery, Graduate School of Medical and Dental Sciences, Tokyo
Medical and Dental University (Tokyo, Japan). All clinical samples
were obtained from patients with oral tongue squamous cell
carcinoma (OTSCC) or oral tongue epithelial dysplasia (OTED) who
had undergone surgical excision as a primary treatment at our
department between 2010 and 2014. The protocols used in this study
were reviewed and approved by the Research Ethics Committee of the
Faculty of Dentistry of the Tokyo Medical and Dental University
(approval no. D2015-534). Written informed consent forms were
obtained from all patients in accordance with institutional
guidelines. Clinical staging was defined according to the Union for
International Cancer Control TNM classification system (https://www.uicc.org/). Tumors were classified
histopathologically as being poorly, moderately, or well
differentiated, and epithelial dysplastic lesions were classified
histopathologically as being low- or high-grade according to World
Health Organization criteria (9).
Disease-free survival (DFS) was measured from the time of initial
examination to the time of local, regional, or distant recurrence
of the disease or the time of last follow-up. Overall survival (OS)
was measured from the time of initial examination to the time of
death or last follow-up.
Profiling analyses using microarray
data
Microarray samples of invasive tumor, adjacent
dysplastic lesions and noncancerous normal tissue were collected
from 11 patients with primary OTSCCs. None of these patients
received preoperative treatment. Before Laser microdissection
(LMD), an oral pathologist determined the area of invasive tumor,
adjacent dysplastic lesion and noncancerous normal tissue on all
samples. Cancer tissue for LMD was immediately cut to 3 mm thick
sections, while excluding the center of the tumor for pathological
diagnosis and embedded in Tissue-Tek OCT compound medium (Sakura,
Tokyo, Japan) after resection. The sections were then fixed in
liquid nitrogen and stored at −80°C. Frozen sections, 9 µm thick,
were cut from the frozen samples and mounted onto a foil-coated
glass slide, membrane slide (Leica Microsystems, Wezlar, Germany).
Frozen sections were fixed in 70% ethanol for 30 sec and stained
with hematoxylin and eosin before dehydration (5 sec each in 70, 95
and 100% ethanol). After air-drying, the sections were laser
microdissected using AS LMD (Leica) (2).
Microarray data of the transcriptional progression
profiles obtained during oral carcinogenesis were previously
deposited in Gene Expression Omnibus (http://www.ncbi.nlm.nih.gov/geo) under accession
number GSE35261 (2). In this study,
we aimed to identify genes whose expression increased in the order
of normal mucosal tissues, dysplastic lesions, and invasive tumors.
First, we selected 15 candidate genes related to the tri-carboxylic
acid (TCA) cycle using Kyoto Encyclopedia of Genes and Genomes
(KEGG) pathway database (http://www.kegg.jp). Fold-changes were calculated
using the ratios of geometric means of gene-expression levels
between each tissue. We further selected 15 candidate genes related
to metabolic control mechanisms that were differentially expressed
in normal mucosal tissues and dysplastic lesions compared with
invasive tumors using the Wilcoxon signed-rank test, with a
significance level of 0.005. Among these, genes with >3-fold
upregulation in invasive tumors were selected. To focus on genes
involved in carcinogenesis, we selected genes with average
expression levels in tumor tissues of at least 100 units (3). Furthermore, comparison of gene
expression levels among normal mucosal tissues, dysplastic lesions,
and invasive tumors were performed by the Friedman test, followed
by the Wilcoxon signed-rank test adjusted by the Bonferroni
correction (P=0.010). Analysis of the gene-expression data
was performed using R statistical software, version 3.3.2
(http://www.r-project.org).
Immunohistochemical (IHC)
analysis
IHC analysis was used to confirm GLUT1 protein
expression. Formalin-fixed, paraffin-embedded (FFPE) specimens
collected from the Department of Maxillofacial Surgery, Graduate
School of Medical and Dental Sciences, Tokyo Medical and Dental
University were used for IHC analysis. GLUT1 expression was
assessed by IHC staining in 65 cases of OTED, 110 cases of OTSCC,
and 20 cases of normal tongue mucosal tissue. A histologic normal
part of resected specimen of cancer was used as normal tissues.
Paraffin blocks were sectioned at a thickness of 4
µm. Initially, the sections were deparaffinized and rehydrated, and
then heated in 10 mM sodium citrate buffer (pH 6) for 15 min at
121°C in an autoclave for antigen retrieval. Next, sections were
immersed in 3% hydrogen peroxide for 20 min at room temperature to
inhibit endogenous peroxidases. Subsequently, the sections were
incubated at room temperature for 1 h with a primary mouse
monoclonal antibody against GLUT1 (ab40084; Abcam, Cambridge, UK)
at a 1:200 dilution and then for 1 h at room temperature with a
secondary antibody using the EnVision™ + Dual Link System-HRP Kit
(Dako, Glostrup, Denmark), according to the manufacturer's
instructions. Coloration was conducted with the 3,
3-diaminobenzidine substrate. All slides were assembled,
counterstained with hematoxylin, and evaluated under light
microscopy. GLUT1 (stained brown) was expressed on the cell
membranes.
We examined each section at a low magnification to
identify areas with highest GLUT1 expression in cancer cells and
then selected 3 fields in each case. Three microphotographs were
taken in each case at a high magnification (400×) to score the
proportion of positive cells and their staining intensity, as
described below. The percentages of positive cells were scored as
follows: 1 (0% to ≤25%), 2 (>25% to ≤50%), 3 (>50% to ≤75%),
4 (>75%). Similarly, the staining intensities of positive tumors
were scored as follows: 1 (no staining or weak staining), 2
(moderate staining), or 3 (high staining). These two scores were
averaged, and the expression intensity was calculated by
multiplying both scores to yield a final score, as follows:
(1–6)
low-expression or (7–12) high-expression, as described
previously (10,11). Examples of the above evaluation
method are shown in Fig. 1.
Evaluation of the immunostaining was conducted by three independent
observers including oral pathologists, who were blinded to the
clinical data.
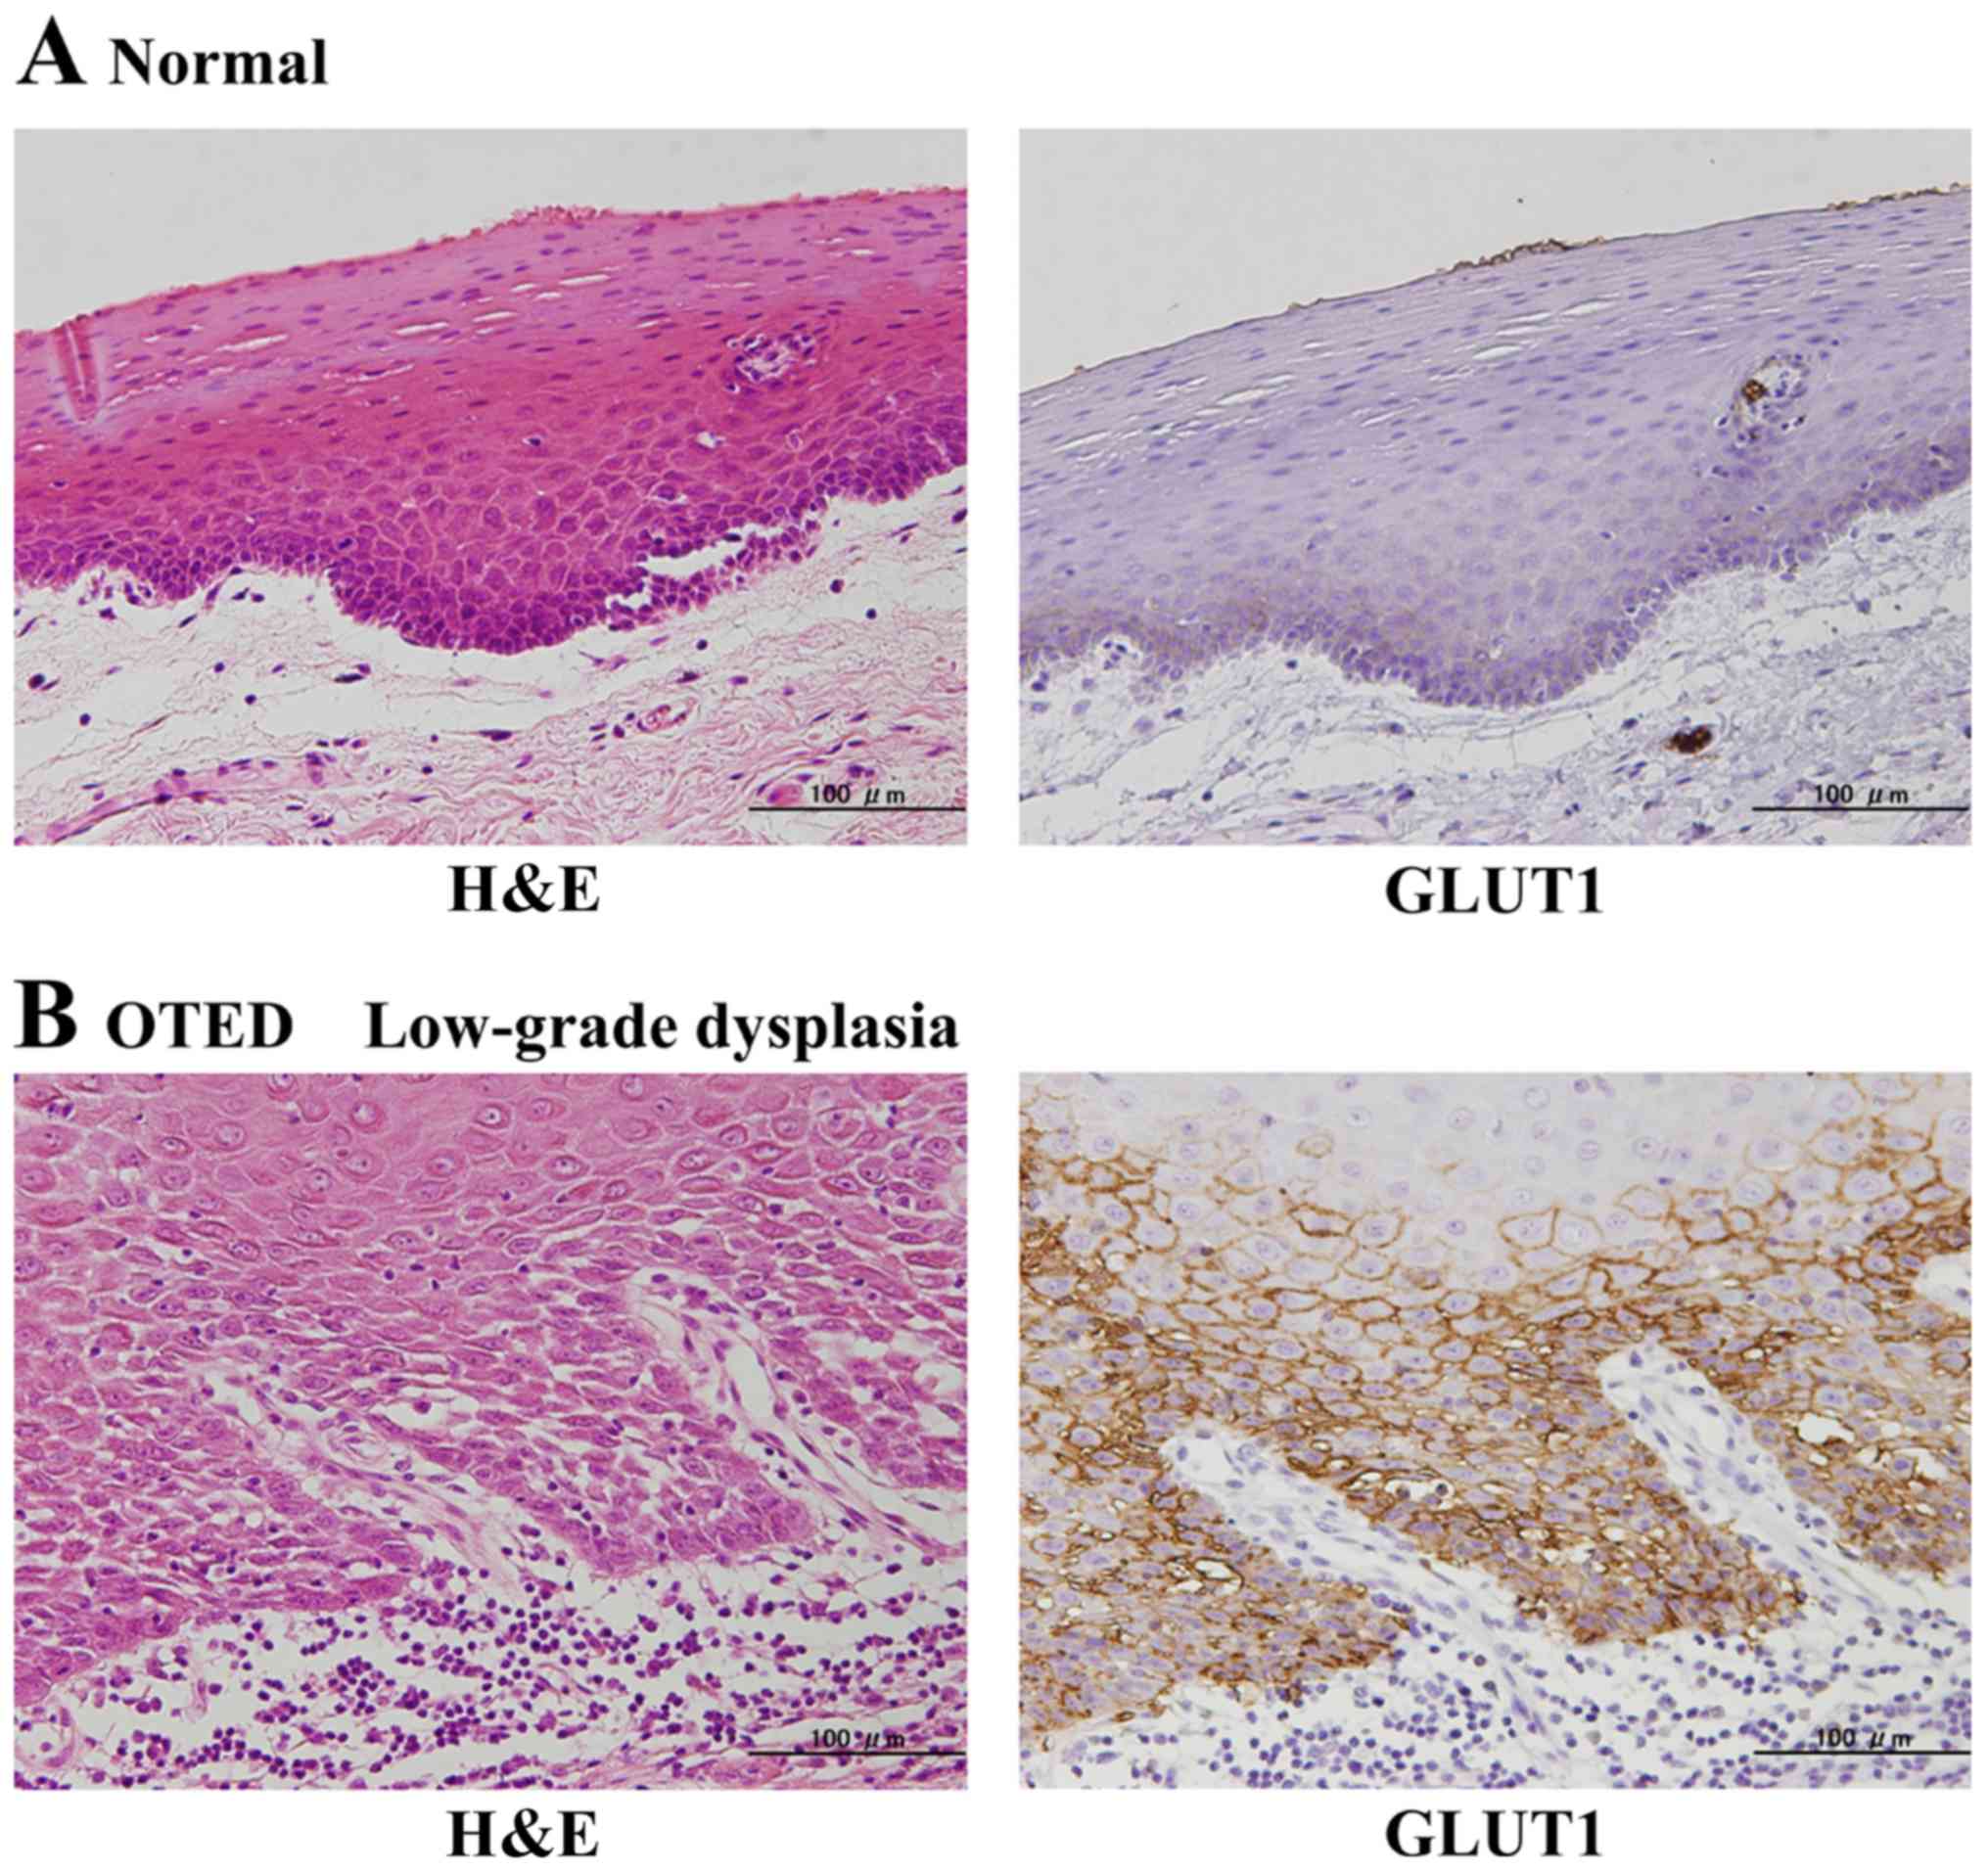
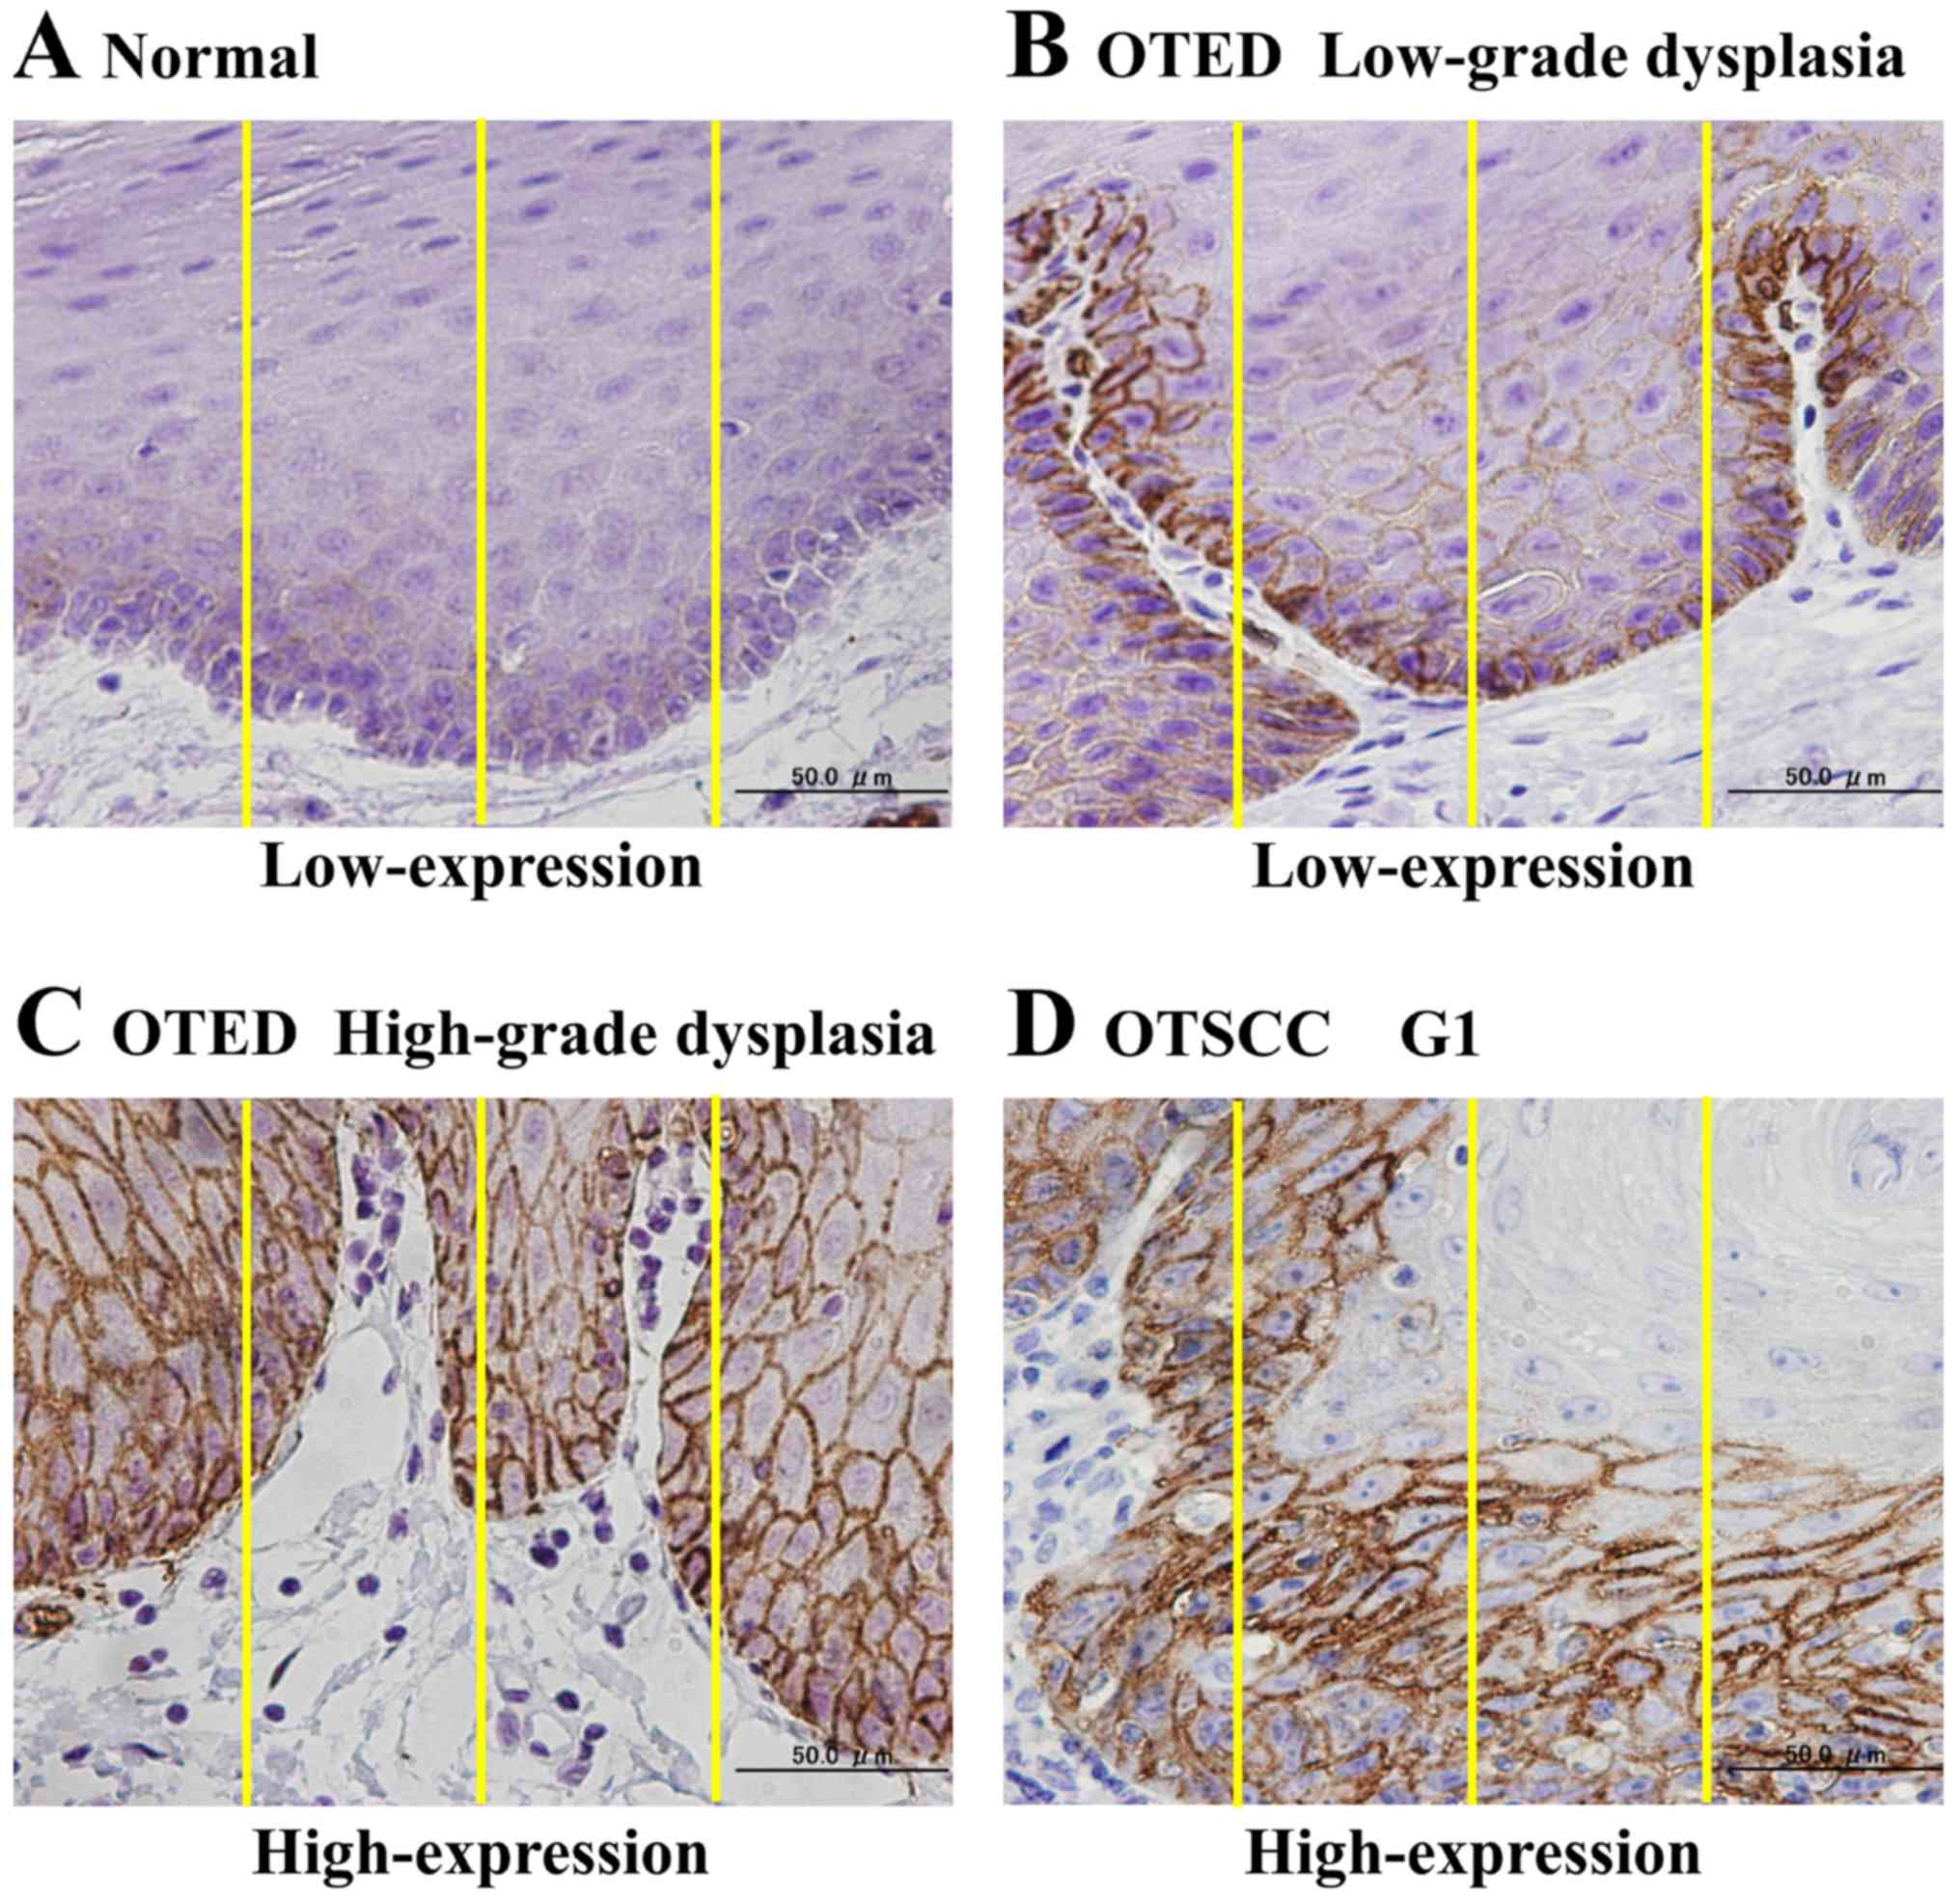 | Figure 1.Examples of the immunohistochemical
analysis method used to evaluate GLUT1 expression. (A) Normal
mucosal tissue. Following evaluation, the expression area was
assigned a score of 2, and the staining intensity was assigned a
score of 1. The expression intensity was calculated by multiplying
the two scores, resulting in an overall score of 2 (low GLUT1
expression). (B) OTED, low-grade dysplasia. The expression area was
assigned a score of 3, and the staining intensity was assigned a
score of 2. The expression intensity was calculated by multiplying
the two scores, resulting an overall score of 6 (low GLUT1
expression). (C) OTED, high-grade dysplasia. The expression area
was assigned a score of 4, and the staining intensity was assigned
a score of 3. Therefore, the expression intensity was 12,
corresponding to high GLUT1 expression. (D) OTSCC G1
(well-differentiated type). The expression area was assigned a
value of 4, and the staining intensity was assigned a value of 3.
Therefore, the expression intensity was 12, corresponding to high
GLUT1 expression. GLUT1, glucose transporter type 1,
erythrocyte/brain; OTED, oral tongue epithelial dysplasia; OTSCC,
oral tongue squamous cell carcinoma. |
Statistical analysis
With the IHC assay data, two-tailed Fisher's exact
test was applied to analyze differences in expression intensities
in normal tongue mucosal tissues and OTEDs, compared with OTSCCs,
and the results were compared with the clinicopathological factors.
DFS and OS were calculated by the Kaplan-Meier method, and
statistical significance was determined by the log-rank test.
Multivariate DFS and OS analyses were performed using the Cox
proportional hazards model. P<0.05 was considered to indicate a
statistically significant difference. These statistical analyses
were performed using SPSS software, version 15.0 J (SPSS, Inc.,
Chicago, IL, USA).
Results
Selection of genes that specifically
contributed to metabolic changes during oral carcinogenesis
We first attempted to select genes that may play
important roles in metabolic control mechanisms. We searched genes
associated with the TCA cycle using the KEGG pathway database. We
chose 15 candidate genes related to the TCA cycle. For example,
solute carrier family 2 member (SLC2), L-lactate dehydrogenase
(LDH), pyruvate dehydrogenase kinase isozyme (PDK), pyruvate
dehydrogenase (PDH), and hypoxia-inducible factor 1 (HIF-1) were
selected (Table I).
 | Table I.Identification of 15 candidate genes
that are associated with the tri-carboxylic acid cycle. |
Table I.
Identification of 15 candidate genes
that are associated with the tri-carboxylic acid cycle.
| Gene symbol | Gene Bank accession
no. | Function |
|---|
| SLC2A1 | NM_006516.1 | D-glucose
transmembrane transporter activity |
| LDHC | NM_002301.2 | L-lactate
dehydrogenase activity |
| LDHAL6B | NM_033195.1 | L-lactate
dehydrogenase activity |
| LDHA | NM_005566.1 | L-lactate
dehydrogenase activity |
| PDK2 | NM_002611.3 | Pyruvate
dehydrogenase (acetyl-transferring) kinase activity |
| PDK3 | NM_005391.1 | Pyruvate
dehydrogenase (acetyl-transferring) kinase activity |
| PDK1 | NM_002610.3 | Pyruvate
dehydrogenase (acetyl-transferring) kinase activity |
| LDHAL6A | NM_144972.3 | L-lactate
dehydrogenase activity |
| PDHA1 | NM_000284.1 | Pyruvate
dehydrogenase (acetyl-transferring) activity |
| HIF1A | NM_001530.2 | DNA binding
transcription factor activity |
| PDHA2 | NM_005390.3 | Pyruvate
dehydrogenase (acetyl-transferring) activity |
| PDK4 | NM_002612.3 | Pyruvate
dehydrogenase (acetyl-transferring) kinase activity |
| SLC2A3 | NM_006931.1 | D-glucose
transmembrane transporter activity |
| PDHB | NM_000925.1 | Pyruvate
dehydrogenase (acetyl-transferring) activity |
| LDHB | NM_002300.3 | L-lactate
dehydrogenase activity |
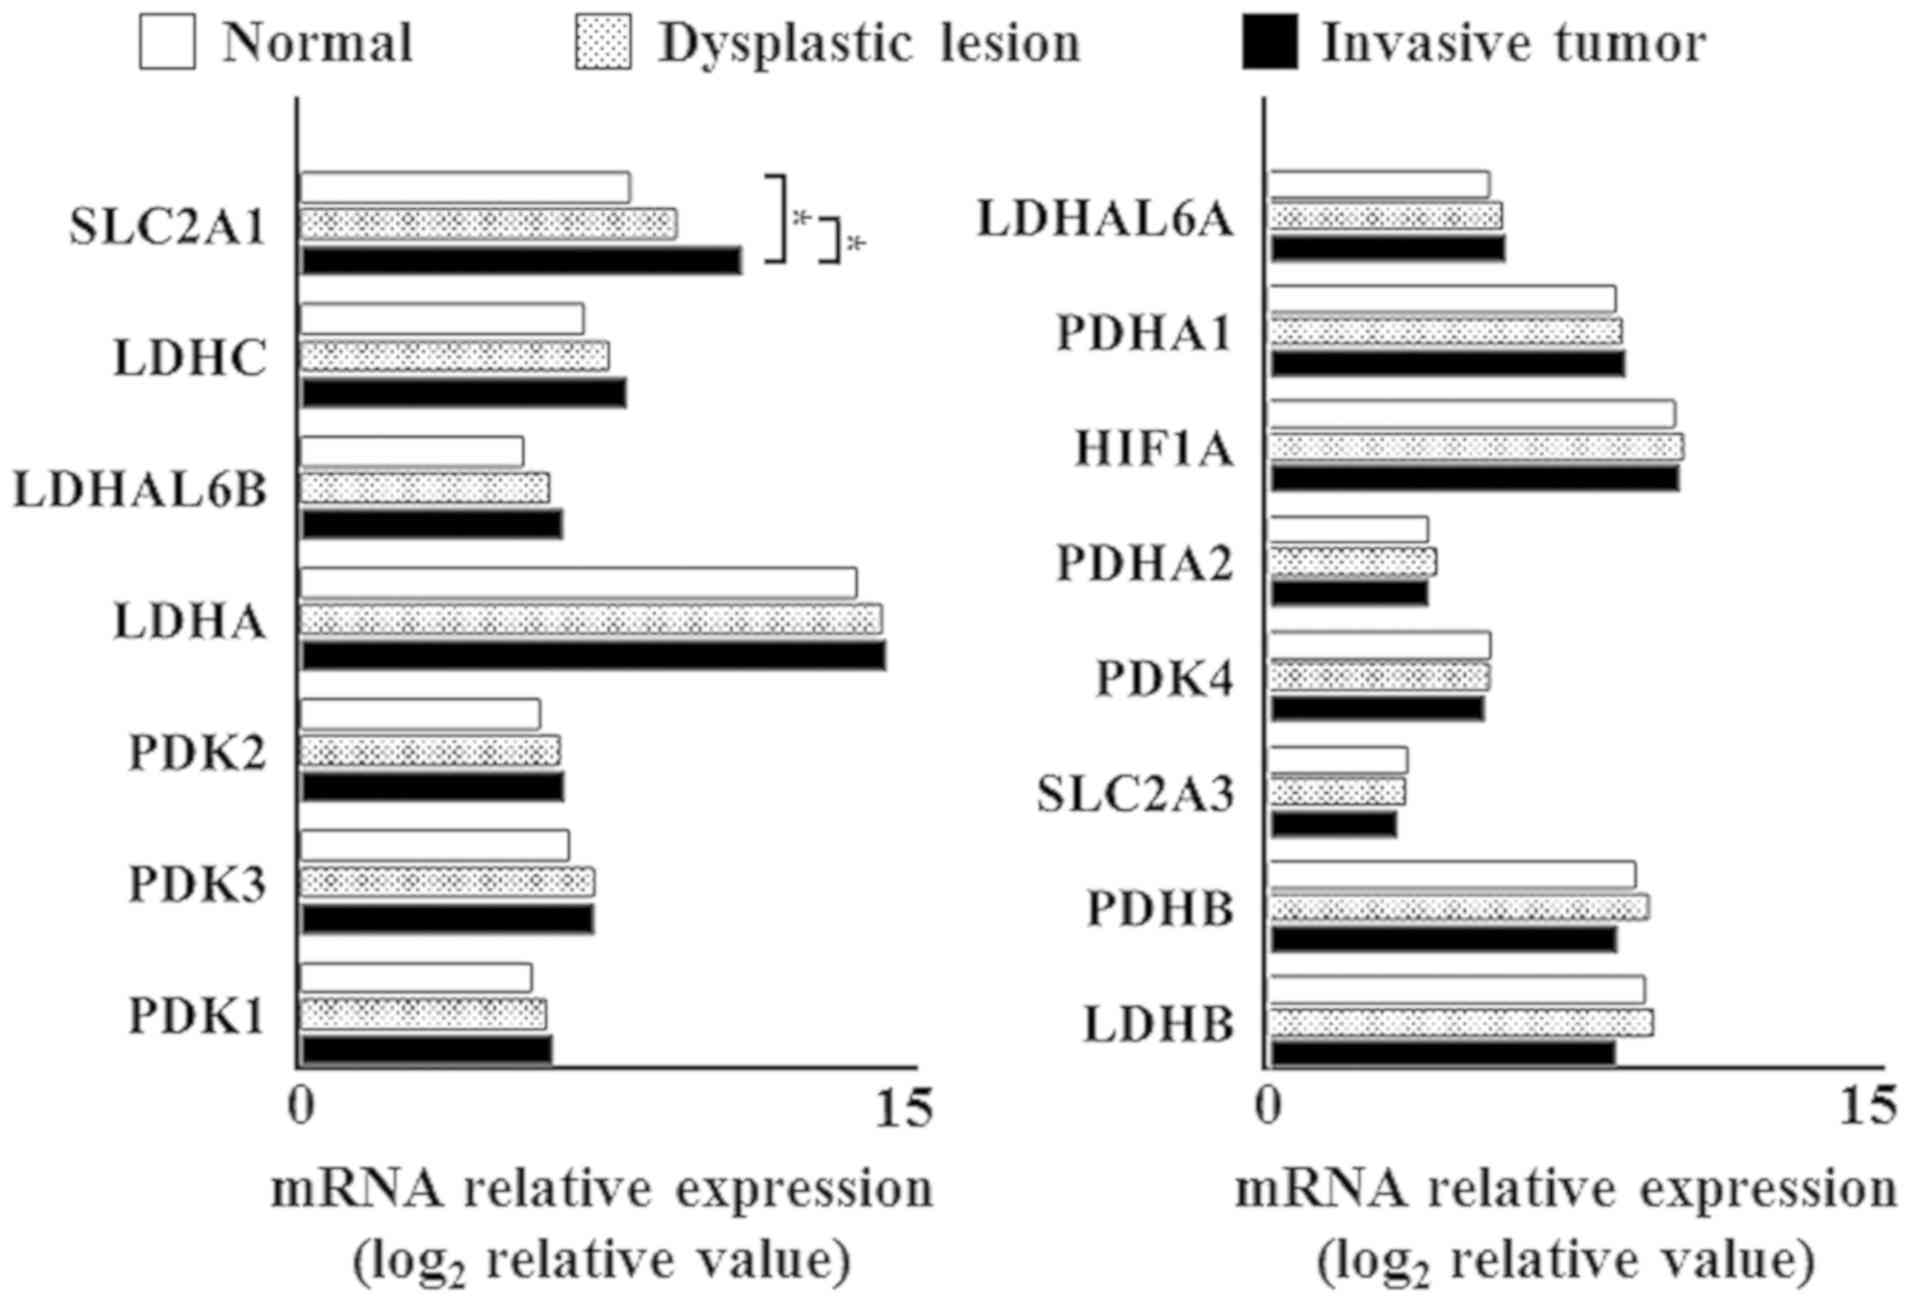
Then, we examined the mRNA expression status of each
candidate gene in normal mucosal tissue, dysplastic lesions, and
invasive cancer tissues using our expression array database to
identify genes showing significant expression differences between
normal mucosal tissues or dysplastic lesions versus invasive
tumors, using the Wilcoxon signed-rank test with a significance
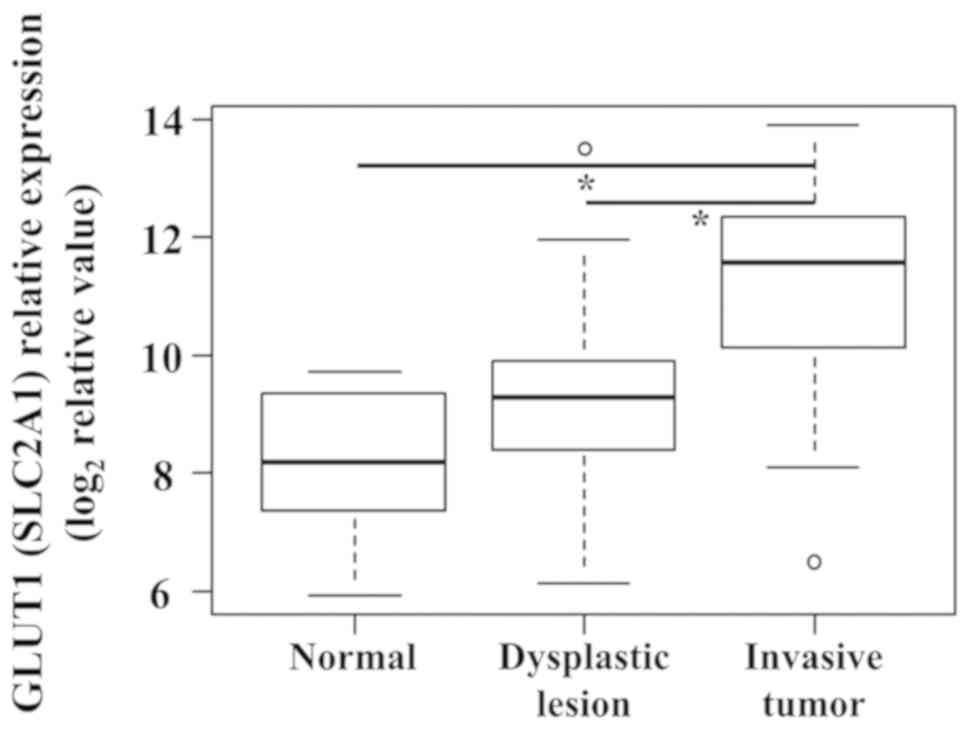
level of 0.005 (Fig. 2). Only SLC2A1
expression was significantly different in normal mucosal tissues
and dysplastic lesions, compared with invasive tumors, as
determined using Fisher's exact test with a significance level of
0.005 (Fig. 3). In addition, the
expression levels of SLC2A1 showed significant difference among
normal mucosal tissues, dysplastic lesions, and invasive tumors.
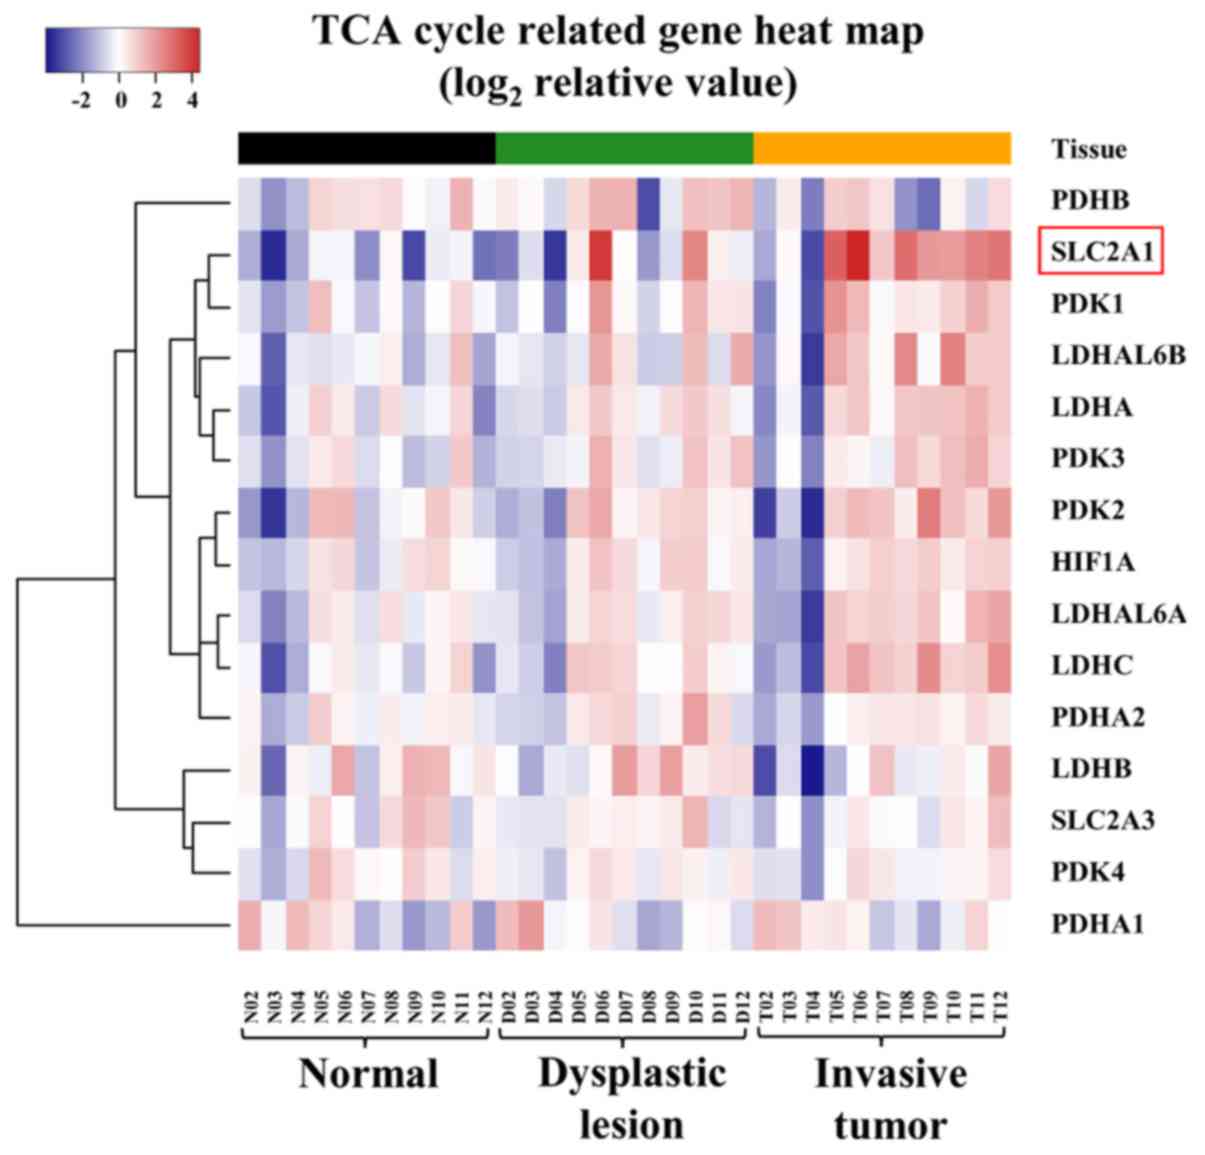
(P=0.009 by Friedman test). Moreover, we performed
hierarchical clustering analysis for each of the 15 candidate genes
and confirmed that the mRNA-expression status increased in order of
normal mucosal tissues, epithelial dysplastic lesions, and invasive
carcinomas (Fig. 4).
IHC analyses
The SLC2A1 gene provides instruction for producing a
protein called the glucose transporter protein type 1 (GLUT1). To
confirm the mRNA expression status of SLC2A1 during oral
tumorigenesis, GLUT1 protein-expression status was investigated by
performing IHC staining with 110 OTSCC samples, 65 OTED samples,
and 20 normal samples. In the normal mucosa, GLUT1 protein
expression was detected predominantly on the cell membrane and was
expressed only in the basal and parabasal layers (Fig. 5A), and all 20 cases (100%) showed
low-expression. Overall, the area positive for GLUT1 expression was
very narrow, and the staining intensity ranged from no staining to
weak staining. In addition, the OTED staining range had expanded to
include the spinous layer (Fig. 5B and
C), with 14 samples (21.5%) showing high-expression and 51
samples (78.5%) showed low-expression. Overall the expression area
was limited to epithelial dysplasia lesions, and the staining
intensity was weak to moderate. In contrast, in the invasive
OTSCCs, the GLUT1 protein was expressed at the periphery of cancer
nests (Fig. 5D-F), with 82 samples
(74.5%) showing high-expression and 28 samples (25.5%) exhibiting
low-expression. Overall the expression area included the cancer
nests and invading tissues, and the staining intensity was moderate
to high. GLUT1 protein-expression levels were significantly
different between normal mucosa or OTEDs versus OTSCCs, as
determined using Fisher's exact test with a significance level of
P<0.001 (Table II),
indicating that GLUT1 may play a significant role in progression
from normal mucosa or precancerous lesions to invasive cancer.
| Table II.Immunohistochemical staining for
GLUT1 protein expression status in normal mucosal tissues, OTEDs
and OTSCCs. |
Table II.
Immunohistochemical staining for
GLUT1 protein expression status in normal mucosal tissues, OTEDs
and OTSCCs.
| Histologic
status | Low-expression
(%) | High-expression
(%) |
|---|
| Normal mucosal
tissues | 20/20 (100) | 0/20
(0)a |
| OTEDs | 51/65 (78.5) | 14/65
(21.5)a |
| OTSCCs | 28/110 (25.5) | 82/110 (74.5) |
| Normal mucosal
tissues | 20/20 (100) | 0/20 (0) |
| OTEDs |
|
|
|
Low-grade | 29/36 (80.6) | 7/36 (19.4) |
|
High-grade | 22/29 (75.9) | 7/29 (24.1) |
| OTSCCs |
|
|
| G1 | 20/76 (26.3) | 56/76 (73.7) |
| G2 | 5/21 (23.8) | 16/21 (76.2) |
| G3 | 3/13 (23.1) | 10/13 (76.9) |
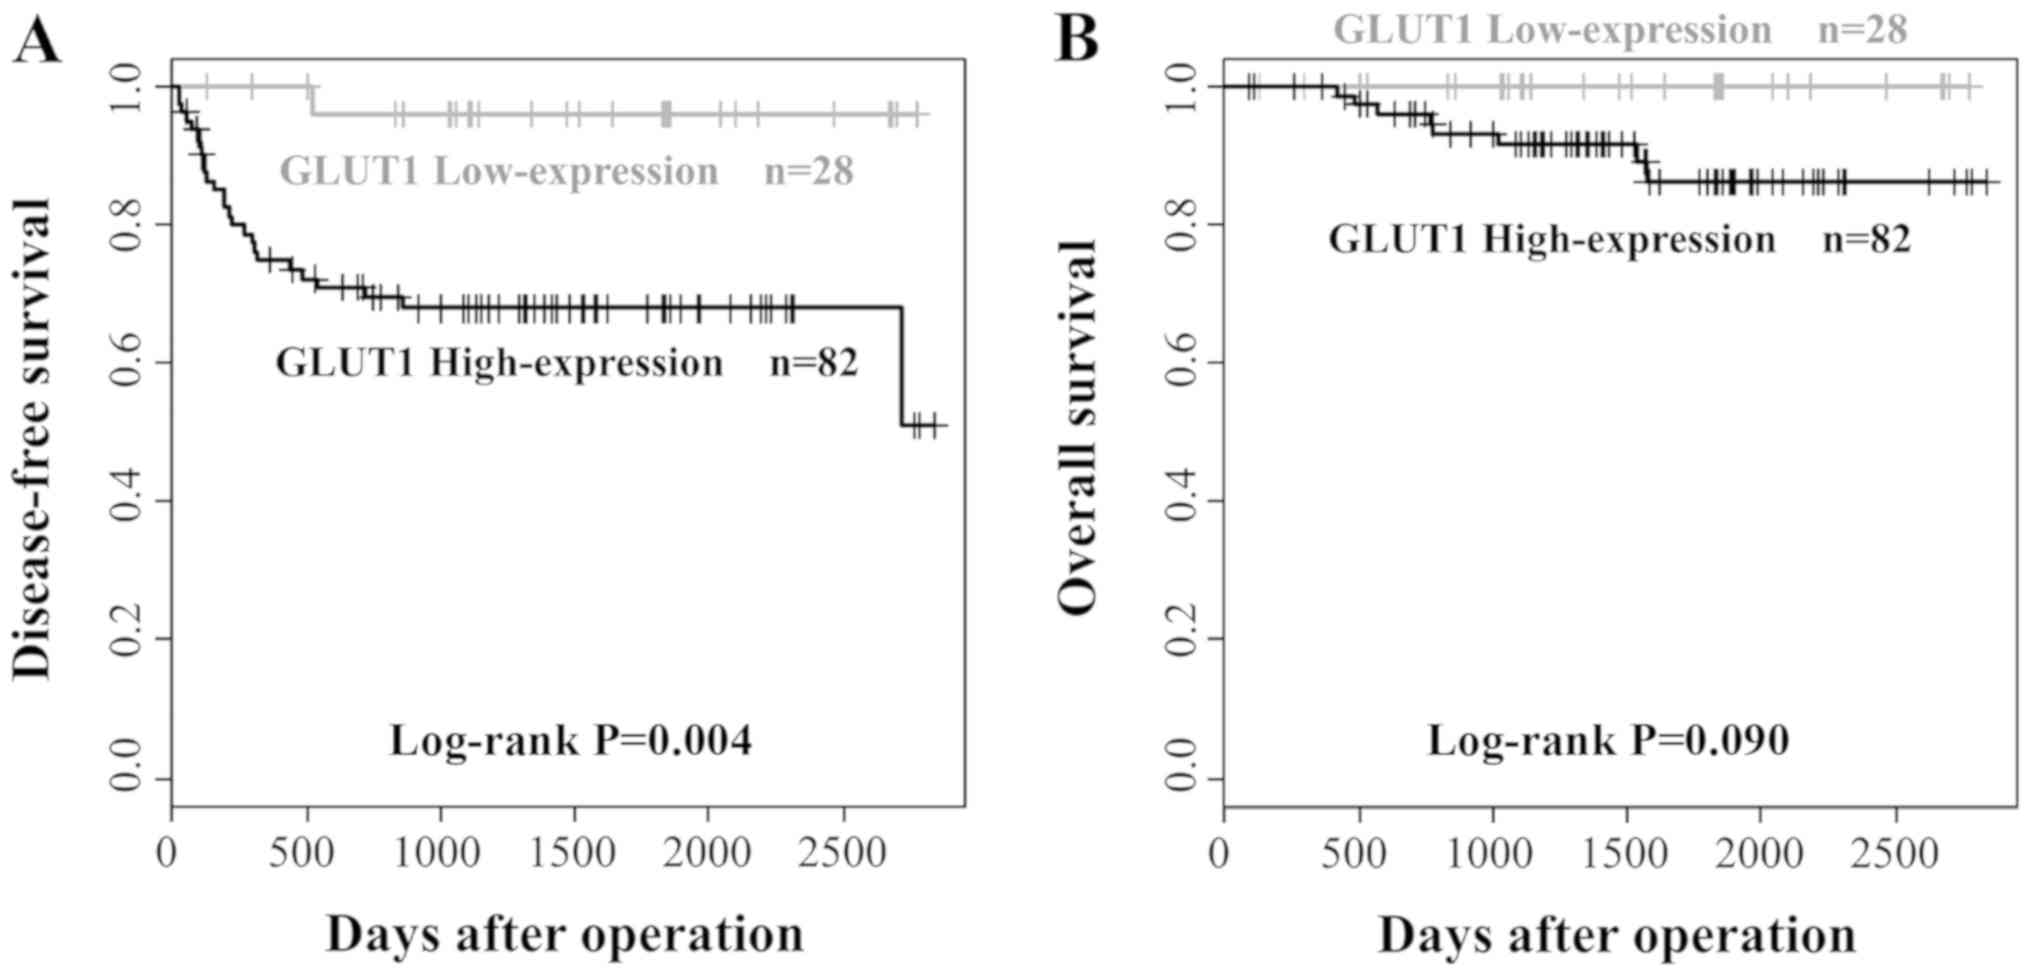
Clinicopathological significance of
GLUT1 protein expression in OTSCCs
The correlation between GLUT1 protein expression and
the clinicopathological features of the 110 OTSCC samples are
summarized in Table III. No
significant association was observed between GLUT1 protein
expression and age, sex, cellular differentiation, the mode of
invasion, and local recurrence. However, high-expression of GLUT1
correlated significantly with the nodal status (P=0.002).
Although no patients with nodal metastatic disease had tumors with
low GLUT1 expression, 21 of 82 patients (25.6%) with tumors showed
high- expression had nodal metastases. Kaplan-Meier survival curves
clearly demonstrated the adverse impact of high GLUT1 expression on
DFS (P=0.004). However, no significant association was found
between GLUT1 expression and OS (P=0.090; Fig. 6).
| Table III.Clinicopathological parameters of 110
OTSCCs and correlation with GLUT1 protein expression status. |
Table III.
Clinicopathological parameters of 110
OTSCCs and correlation with GLUT1 protein expression status.
|
|
| GLUT1 protein
expression |
|
|---|
|
|
|
|
|
|---|
| Clincopathological
parameter | Total number
(%) | Low-expression |
High-expression |
P-valuea |
|---|
| Age, years |
|
|
|
|
|
<60 | 44 (40.0) | 10 | 34 | 0.659 |
|
≥60 | 66 (60.0) | 18 | 48 |
|
| Sex |
|
|
|
|
|
Male | 55 (50.0) | 13 | 42 | 0.827 |
|
Female | 55 (50.0) | 15 | 40 |
|
| Cellular
differentiation |
|
|
|
|
| Well to
moderate | 97 (69.1) | 25 | 72 | 1.000 |
|
Poor | 13 (11.8) | 3 | 10 |
|
| Mode of invasion
(YK) |
|
|
|
|
|
1–3 | 89 (80.9) | 25 | 64 |
0.268 |
|
4C-4D | 21 (19.1) | 3 | 18 |
|
| Nodal
statusb |
|
|
|
|
|
Metastasis | 21 (19.1) | 0 | 21 | 0.002 |
| No
metastasis | 89 (80.9) | 28 | 61 |
|
| Local
recurrence |
|
|
|
|
|
Positive | 4 (3.6) | 0 | 4 | 0.571 |
|
Negative | 106 (96.7) | 28 | 78 |
|
Discussion
Cancer metabolism is one of the oldest areas of
research in cancer biology, predating the discovery of oncogenes
and tumor-suppressor genes by a half century. The field is based on
the principles that metabolic activities are altered in cancer
cells relative to normal cells and that these alterations support
the acquisition and maintenance of malignant properties. Tumors
reprogram pathways of nutrient acquisition and metabolism to meet
the bioenergetic, biosynthetic, and redox demands of malignant
cells. These reprogrammed activities are recognized as hallmarks of
cancer, and recent work has uncovered remarkable flexibility in the
specific pathways activated by tumor cells to support these key
functions (12). Although metabolic
alterations were thought to have an important role in the
carcinogenic process, no metabolism-related genes have been
implicated in oral squamous cell tumorigenesis. In the present
study, we analyzed metabolic changes arising during oral
carcinogenesis. We examined the mRNA-expression statuses of 15
candidate genes related to the TCA cycle using our expression array
database to search for genes showing significant expression changes
during this process. As a result, we identified that only GLUT1
expression at both the mRNA and protein levels was significantly
elevated during oral tumorigenesis, suggesting GLUT1 may be the
most important metabolism-related genes that promote malignant
transformation of the oral mucosa.
GLUT proteins are encoded by the SLC2 genes and are
members of the major facilitator superfamily of membrane
transporters. Humans express 14 different GLUT proteins. These GLUT
proteins can be categorized into three classes according to their
sequence similarity: Class 1 (GLUTs 1–4, and 14), class 2 (GLUTs 5,
7, 9, and 11), and class 3 (GLUTs 6, 8, 10, 12, and 13/HMIT). GLUTs
comprise a family of transmembrane proteins that mediate the
transport of glucose across cellular membranes. The GLUT proteins
are mainly distributed as follows: GLUT1/erythrocyte and brain,
GLUT2/liver and islet of Langerhans, GLUT3/brain and testes,
GLUT4/adipose tissue and skeletal and cardiac muscle, GLUT5/small
intestine and kidney, GLUT6/brain and spleen, GLUT7/small intestine
and colon, GLUT8/testes and brain, GLUT9/kidney and liver,
GLUT10/heart and lungs, GLUT11/heart and muscle, GLUT12/heart and
prostate, GLUT13/HMIT/brain and adipose tissue, GLUT14/testes
(13). Among them, GLUT1 was the
first of the family of facilitative GLUT proteins to be cloned.
Although GLUT1 expression in normal human tissues is limited, it is
expressed at higher levels in erythrocytes, as well as brain,
cartilage, retinal, and placental tissue. Moreover, it is widely
overexpressed in many kinds of human malignancies, including
hepatic, pancreatic, breast, esophageal, brain, renal, lung,
cutaneous, endometrial, ovarian, cervical, and oral SCCs (14).
The data generated in this study demonstrated that
in normal mucosal tissues, the GLUT1 protein was expressed
predominantly on the cell membrane, but only in the basal and
parabasal layers, and weak staining was found with all 20 normal
specimens. These observations were consistent with previous reports
(15), suggesting that the
expression status in the normal mucosa seems to respond to a
hypoxic environment. In contrast, in the OTEDs, GLUT1 expression
was strong throughout the entire dysplastic area. GLUT1 expression
occurred in the basal area of mildly dysplastic epithelium tissue,
the basal and suprabasal areas in moderately dysplastic epithelium
tissue, and in all areas of highly dysplastic epithelium tissue.
Thus, GLUT1 expression area depended on the extent of epithelial
dysplasia. These findings also agree with a previous report and
similar findings were observed in another malignancy, such as
cervical cancer (16,17). Recent findings indicated that the
metabolic alteration of cancer cells is more a consequence of the
activation of proto-oncogenes (e.g., Myc), transcription factors
(e.g., HIF-1), and signaling pathways (e.g., PI3K), as well as the
inactivation of tumor-suppressor genes (e.g., p53), rather than the
primary generation of much needed energy (18). Considering these possibilities,
changes in GLUT1 expression of the dysplastic epithelium are more
likely caused, not only by responses to a hypoxic and nutrient-poor
environment, but also by accumulation of numerous genetic
abnormalities. Further investigation was required to clarify the
mechanism of enhanced GLUT1 expression associated with malignant
transformation.
On the other hand, in the invasive OTSCCs, the GLUT1
protein was expressed at the periphery of cancer nests and was
absent from the center of more differentiated tumor islands. In
addition, the GLUT1-expression intensity in invasive OTSCCs was
significantly stronger than that of normal mucosa and OTEDs. GLUT1
overexpression was also observed in various malignant tumors,
including non-small cell lung cancer, colorectal cancer, breast
cancer, and gastric cancer (14).
The upregulation of GLUTs has been reported in numerous cancer
types due to perturbations in gene expression or protein
re-localization or stabilization (19) and might be a critical event for
cancer cells that reside in a microenvironment with a limited
glucose supply (4). These findings
indicated that GLUT1 upregulation is not lacking during the
malignant transformation process in many kinds of human
malignancies. An important question is why GLUT1 upregulation is
indispensable for many types of cancer cells. Tumor cells are known
to have accelerated metabolic rates and high glucose and energy
demands in a nutrient-poor environment, due to their rapid
proliferation. Therefore, it seems that cancer cells necessarily
undergo a marked transformation of their metabolism. Glycolysis
generates ATP with lower efficiency, but at a faster rate, than
oxidative phosphorylation. The enhanced rate of ATP generation has
been postulated to be beneficial for rapid proliferating cells.
However, several recent findings have identified mitochondria as
the major source of cellular ATP in most cancer cell lines and
tissues (18,20). Rather, cancer cells have been found
to benefit from the production of glycolytic intermediates by
altering their glucose metabolism (18). Moreover, high-level glucose
metabolism causes a large amount of lactate secretion into the
extracellular space. The subsequent accumulation of extracellular
lactate may create a tumor microenvironment favorable for tumor
cell migration, angiogenesis, and the immunological escape of
tumors. Consequently, increased GLUT1 expression may be essential
for ensuring energy production, accelerating cell growth, and
preparing the microenvironment for malignant transformation and
tumor progression.
Many previous reports revealed GLUT1 overexpression
as a prognostic indictor in OSCC and that it was also significantly
associated with metastases and other clinical factors (21). Recent prisma-compliant meta-analysis
of the prognostic value of GLUT1 expression in OSCC also showed
that GLUT1 overexpression was associated with aggressive clinical
features and worsened OS in OSCC (22). In this study, we examined the
GLUT1-expression status for 110 OTSCCs, which were divided into
high- and low-expression groups and examined for correlations with
clinicopathological factors. Cervical lymph node metastasis was
significantly more frequent in the high GLUT1-expression group than
in the low GLUT1-expression group (P=0.002). Moreover,
although no significant effect of the GLUT1-expressions level on OS
was found, the DFS rate in the high GLUT1-expression group was
significantly lower than that of the low GLUT1-expression group, as
determined by Kaplan-Meier survival analysis (P=0.004).
These observations suggested that the GLUT1-expression status
correlated significantly with clinical aggressiveness and the
metastatic ability of cancer cells.
Why do cancer cells with high GLUT1 expression show
aggressive behavior? Tumor cells with high GLUT1 expression
actively transport extracellular glucose and obtain great energy
for rapid proliferation, and then the increased lactic acid
produced is transported from tumor cells into the extracellular
space. Lactic acid efflux leads to acidosis of the tumor
microenvironment, which can drive tumor growth and metastasis.
Increased lactate levels promote the emergence of an
immune-permissive microenvironment by attenuating dendritic and T
cell activation and monocyte migration (23–25). In
addition, lactate stimulates the polarization of resident
macrophages to a so-called M2 state, which plays a role in
immunosuppression (26,27). Furthermore, lactate accumulation is
instrumental in promoting angiogenesis. Lactate also enhances the
stabilization of HIF-1α, activates nuclear factor
kappa-light-chain-enhancer of activated B cells (NF-κB) and
phosphoinositide 3-kinase (PI-3K) signaling in endothelial cells,
and induces secretion of the proangiogenic vascular endothelial
growth factor (VEGF) from tumor-associated stromal cells (28–31).
Increased levels of lactate also stimulate hyaluronic acid
production by fibroblasts, which may contribute to tumor
invasiveness (32). Presumably, high
GLUT1 expression in tumor cells is clinically aggressive feature
because of the greater activity (described above) than in cells
with low GLUT1 expression. However, further studies on the
correlation between GLUT1-expression status and clinical
aggressiveness are needed.
In conclusion, we sought to determine significant
genes that may contribute to metabolic alterations during oral
carcinogenesis and determined that only GLUT1 expression was
significantly elevated at both the mRNA and protein levels during
this process. These findings suggest that GLUT1 serves a crucial
role in the initiation and progression of OSCC and that elevated
GLUT1 expression is an early critical event in the development of
invasive OSCCs. Moreover, regarding OSCCs, tumors with high GLUT1
expression were significantly associated with the presence of
cervical lymph node metastases. Therefore, the GLUT1-expression
status might be used both as a diagnostic tool for the early
detection of pre-neoplastic lesions, as a biomarker for treatment
escalation, and as an independent prognostic marker for OSCC
patients. Further studies are needed to evaluate the prognostic and
diagnostic potentials of GLUT1 and address its potential role in
oral carcinogenesis.
Acknowledgements
Not applicable.
Funding
The present study was supported by Japan Society for
the Promotion of Science KAKENHI (grant no. 15K11288).
Availability of data and materials
The data used and/or analyzed during the present
study are available from the corresponding author on reasonable
request.
Authors' contributions
The study was conceived by KN, YM, TY and NU.
Collection of samples and the laboratory preparations were
conducted by KN. The manuscript was drafted by KN. The statistical
analysis was performed by KM, KK, MT, KT and JS. All authors were
involved in the preparation and revision of the manuscript.
Ethics approval and consent to
participate
The protocols used in this study were reviewed and
approved by the Research Ethics Committee of the Faculty of
Dentistry of the Tokyo Medical and Dental University (approval no.
D2015-534; Tokyo, Japan). Written informed consent forms were
obtained from all patients in accordance with institutional
guidelines.
Patient consent for publication
Not applicable.
Competing interests
The authors declare that they have no competing
interests.
References
|
1
|
Ferlay J, Colombet M, Soerjomataram I,
Mathers C, Parkin DM, Piñeros M, Znaor A and Bray F: Estimating the
global cancer incidence and mortality in 2018: GLOBOCAN sources and
methods. Int J Cancer. 144:1941–1953. 2019.PubMed/NCBI
|
|
2
|
Sumino J, Uzawa N, Okada N, Miyaguchi K,
Mogushi K, Takahashi K, Sato H, Michikawa C, Nakata Y, Tanaka H and
Amagasa T: Gene expression changes in initiation and progression of
oral squamous cell carcinomas revealed by laser microdissection and
oligonucleotide microarray analysis. Int J Cancer. 132:540–548.
2013. View Article : Google Scholar : PubMed/NCBI
|
|
3
|
Moriya Y, Uzawa N, Morita T, Mogushi K,
Miyaguchi K, Takahashi K, Michikawa C, Sumino J, Tanaka H and
Harada K: The high-temperature requirement factor A3 (HtrA3) is
associated with acquisition of the invasive phenotype in oral
squamous cell carcinoma cells. Oral Oncol. 51:84–89. 2015.
View Article : Google Scholar : PubMed/NCBI
|
|
4
|
Yonashiro R, Eguchi K, Wake M, Takeda N
and Nakayama K: Pyruvate dehydrogenase PDH-E1β controls tumor
progression by altering the metabolic status of cancer cells.
Cancer Res. 78:1592–1603. 2018. View Article : Google Scholar : PubMed/NCBI
|
|
5
|
Warburg O: On the origin of cancer cells.
Science. 123:309–314. 1956. View Article : Google Scholar : PubMed/NCBI
|
|
6
|
Vander Heiden MG, Cantley LC and Thompson
CB: Understanding the warburg effect: The metabolic requirements of
cell proliferation. Science. 324:1029–1033. 2009. View Article : Google Scholar : PubMed/NCBI
|
|
7
|
DE Lima PO, Jorge CC, Oliveira DT and
Pereira MC: Hypoxic condition and prognosis in oral squamous cell
carcinoma. Anticancer Res. 34:605–612. 2014.PubMed/NCBI
|
|
8
|
Pavlova NN and Thompson CB: The emerging
hallmarks of cancer metabolism. Cell Metabo. 23:27–47. 2016.
View Article : Google Scholar
|
|
9
|
Müller S: Update from the 4th edition of
the World Health Organization of head and neck tumours: Tumours of
the oral cavity and mobile tongue. Head Neck Pathol. 11:33–40.
2017. View Article : Google Scholar : PubMed/NCBI
|
|
10
|
Angadi VC and Angadi PV: GLUT-1
immunoexpression in oral epithelial dysplasia, oral squamous cell
carcinoma, and verrucous carcinoma. J Oral Sci. 57:115–122. 2015.
View Article : Google Scholar : PubMed/NCBI
|
|
11
|
Ribeiro M, Teixeira SR, Azevedo MN, Fraga
AC Jr, Gontijo AP and Vêncio EF: Expression of hypoxia-induced
factor-1 alpha in early-stage and in metastatic oral squamous cell
carcinoma. Tumour Biol. 39:10104283176955272017. View Article : Google Scholar : PubMed/NCBI
|
|
12
|
DeBerardinis RJ and Chandel NS:
Fundamentals of cancer metabolism. Sci Adv. 2:e16002002016.
View Article : Google Scholar : PubMed/NCBI
|
|
13
|
Mueckler M and Thorens B: The SLC2 (GLUT)
family of membrane transporters. Mol Aspects Med. 34:121–138. 2013.
View Article : Google Scholar : PubMed/NCBI
|
|
14
|
Macheda ML, Rogers S and Best JD:
Molecular and cellular regulation of glucose transporter (GLUT)
proteins in cancer. J Cell Physiol. 202:654–662. 2005. View Article : Google Scholar : PubMed/NCBI
|
|
15
|
Barron CC, Bilan PJ, Tsakiridis T and
Tsiani E: Facilitative glucose transporters: Implications for
cancer detection, prognosis and treatment. Metabolism. 65:124–139.
2016. View Article : Google Scholar : PubMed/NCBI
|
|
16
|
Mendez LE, Manci N, Cantuaria G,
Gomez-Marin O, Penalver M, Braunschweiger P and Nadji M: Expression
of glucose transporter-1 in cervical cancer and its precursors.
Gynecol Oncol. 86:138–143. 2002. View Article : Google Scholar : PubMed/NCBI
|
|
17
|
Rudlowski C, Becker AJ, Schroder W, Rath
W, Büttner R and Moser M: GLUT1 messenger RNA and protein induction
relates to the malignant transformation of cervical cancer. Am J
Clin Pathol. 120:691–698. 2003. View Article : Google Scholar : PubMed/NCBI
|
|
18
|
Hamanaka RB and Chandel NS: Targeting
glucose metabolism for cancer therapy. J Exp Med. 209:211–215.
2012. View Article : Google Scholar : PubMed/NCBI
|
|
19
|
Ancey PB, Contat C and Meylan E: Glucose
transporters in cancer-from tumor cells to the tumor
microenvironment. FEBS J. 2018.(Epub ahead of print). View Article : Google Scholar : PubMed/NCBI
|
|
20
|
Mandujano-Tinoco EA, Gallardo-Pérez JC,
Marín-Hernández A, Moreno-Sánchez R and Rodríguez-Enríquez S: Anti-
mitochondrial therapy in human breast cancer multi-cellular
spheroids. Biochim Biophys Acta. 1833:541–551. 2013. View Article : Google Scholar : PubMed/NCBI
|
|
21
|
Grimm M, Cetindis M, Lehmann M, Biegner T,
Munz A, Teriete P, Kraut W and Reinert S: Association of cancer
metabolism-related proteins with oral carcinogenesis-indications
for chemoprevention and metabolic sensitizing of oral squamous cell
carcinoma? J Transl Med. 12:2082014. View Article : Google Scholar : PubMed/NCBI
|
|
22
|
Grimm M, Munz A, Teriete P, Nadtotschi T
and Reinert S: GLUT-1(+)/TKTL1(+) coexpression predicts poor
outcome in oral squamous cell carcinoma. Oral Surg Oral Med Oral
Pathol Oral Radiol. 117:743–753. 2014. View Article : Google Scholar : PubMed/NCBI
|
|
23
|
Gottfried E, Kunz-Schughart LA, Ebner S,
Mueller-Klieser W, Hoves S, Andreesen R, Mackensen A and Kreutz M:
Tumor-derived lactic acid modulates dendritic cell activation and
antigen expression. Blood. 107:2013–2021. 2006. View Article : Google Scholar : PubMed/NCBI
|
|
24
|
Fischer K, Hoffmann P, Voelkl S,
Meidenbauer N, Ammer J, Edinger M, Gottfried E, Schwarz S, Rothe G,
Hoves S, et al: Inhibitory effect of tumor cell-derived lactic acid
on human T cells. Blood. 109:3812–3819. 2007. View Article : Google Scholar : PubMed/NCBI
|
|
25
|
Goetze K, Walenta S, Ksiazkiewicz M,
Kunz-Schughart LA and Mueller-Klieser W: Lactate enhances motility
of tumor cells and inhibits monocyte migration and cytokine
release. Int J Oncol. 39:453–463. 2011.PubMed/NCBI
|
|
26
|
Carmona-Fontaine C, Bucci V, Akkari L,
Deforet M, Joyce JA and Xavier JB: Emergence of spatial structure
in the tumor microenvironment due to the warburg effect. Proc Natl
Acad Sci USA. 110:19402–19407. 2013. View Article : Google Scholar : PubMed/NCBI
|
|
27
|
Colegio OR, Chu NQ, Szabo AL, Chu T,
Rhebergen AM, Jairam V, Cyrus N, Brokowski CE, Eisenbarth SC,
Phillips GM, et al: Functional polarization of tumour-associated
macrophages by tumour-derived lactic acid. Nature. 513:559–563.
2014. View Article : Google Scholar : PubMed/NCBI
|
|
28
|
Constant JS, Feng JJ, Zabel DD, Yuan H,
Suh DY, Scheuenstuhl H, Hunt TK and Hussain MZ: Lactate elicits
vascular endothelial growth factor from macrophages: A possible
alternative to hypoxia. Wound Repair Regen. 8:353–360. 2000.
View Article : Google Scholar : PubMed/NCBI
|
|
29
|
Schmid SA, Gaumann A, Wondrak M, Eckermann
C, Schulte S, Mueller-Klieser W, Wheatley DN and Kunz-Schughart LA:
Lactate adversely affects the in vitro formation of endothelial
cell tubular structures through the action of TGF-beta1. Exp Cell
Res. 313:2531–2549. 2007. View Article : Google Scholar : PubMed/NCBI
|
|
30
|
Végran F, Boidot R, Michiels C, Sonveaux P
and Feron O: Lactate influx through the endothelial cell
monocarboxylate transporter MCT1 supports an NF-κB/IL-8 pathway
that drives tumor angiogenesis. Cancer Res. 71:2550–2560. 2011.
View Article : Google Scholar : PubMed/NCBI
|
|
31
|
Sonveaux P, Copetti T, De Saedeleer CJ,
Végran F, Verrax J, Kennedy KM, Moon EJ, Dhup S, Danhier P, Frérart
F, et al: Targeting the lactate transporter MCT1 in endothelial
cells inhibits lactate-induced HIF-1 activation and tumor
angiogenesis. PLoS One. 7:e334182012. View Article : Google Scholar : PubMed/NCBI
|
|
32
|
Stern R, Shuster S, Neudecker BA and
Formby B: Lactate stimulates fibroblast expression of hyaluronan
and CD44: The Warburg effect revisited. Exp Cell Res. 276:24–31.
2002. View Article : Google Scholar : PubMed/NCBI
|