Introduction
Renal cell carcinoma (RCC) is the second most common
type of cancer of the urological system and represents 2–3% of all
adult cancer cases (1). Clear cell
RCC is the primary subtype of RCC and accounts for 70–80% of all
cases (1). In recent years, there
has been an increase in the rates of RCC-associated morbidity and
mortality (2). Given the absence of
specific clinical manifestations, including local pain and
hematuria, 20–30% of patients with RCC possess metastatic disease
at the time of diagnosis and ~20% of patients relapse with
metastasis following surgical intervention (2,3). RCC is
highly resistant to conventional cytotoxic chemotherapy and
immunotherapy offers unsatisfactory improvement in survival
(4). The prognosis of metastatic RCC
(mRCC) is poor, with a 5-year survival rate <5% (5). In the last decade, the introduction of
several targeted therapies has improved the treatment of mRCC.
Among a number of molecularly-targeted agents, sunitinib is
regarded as a powerful therapeutic agent against mRCC (6). Sunitinib is an oral multi-target
tyrosine kinase inhibitor that acts on vascular endothelial growth
factor receptor (VEGFR)-1, VEGFR-2, Fms-like tyrosine kinase
receptor 3, c-KIT and platelet-derived growth factor receptor
(7,8). A large-scale randomized phase III trial
(SU11248) comparing sunitinib with interferon in patients with mRCC
demonstrated a significantly higher objective response rate (31 vs.
6%) and longer progression-free survival time (11 vs. 5 months) for
the sunitinib-treated group (HR, 0.42; CI, 0.32–0.54) (9). However, tumor cells gradually become
refractory and drug resistance is inevitable following sunitinib
treatment for a certain period (5).
Cyclooxygenase 2 (COX-2) is a key enzyme that
stimulates the production of prostaglandin E2 (PGE2) and
arachidonic acid. COX-2 serves a role in the inflammation, growth,
invasiveness and metastasis of a tumor, and inhibits apoptosis and
angiogenesis (9). However, to the
best of our knowledge, the involvement of COX-2 in RCC drug
resistance remains unknown. Celecoxib, a selective COX-2 inhibitor,
is a clinically effective drug as it can inhibit COX enzymes and
consequently prevent, inhibit or abrogate the effects of
prostaglandins (10). Previous
studies have reported the antitumor effect of celecoxib against RCC
(11,12).
Cancer stem cells (CSCs) are important for cancer
progression (13). CSCs are a small
subpopulation of cells that exhibit stem-like properties, which are
associated with the initiation, chemoresistance, metastasis and
recurrence of cancer (13). CSCs
express several specific markers that may facilitate the isolation
and identification of CSCs, including cluster of differentiation
(CD) 133, which is widely expressed (14). CD133, also termed prominin 1, is a
120 kDa transmembrane glycoprotein that is recognized as a useful
marker for the identification and isolation of CSCs from many types
of solid tumors, including colon, brain, lung, liver, prostate,
skin and kidney cancer (15).
A number of studies have elucidated the molecular
mechanism underlying sunitinib resistance in RCC (7–9);
however, this mechanism remains largely unclear. The present study
established a human RCC cell line that was resistant to sunitinib
and analyzed the changes in COX-2, PGE2 and CD133 expression to
identify potential targets for overcoming acquired resistance to
sunitinib.
Materials and methods
Materials and reagents
The human RCC cell line 786-O was obtained from the
American Type Culture Collection (Manassas, VA, USA). Sunitinib and
3-(4, 5-dimethylthiazol-2-yl)-2,5-diphenyl tetrazolium bromide
(MTT) were purchased from Sigma-Aldrich; Merck KGaA (Darmstadt,
Germany). Materials for cell culture, including RPMI-1640 medium,
trypsin and 10% fetal bovine serum (FBS) were obtained from Gibco
(Thermo Fisher Scientific, Inc., Waltham, MA, USA). All other
reagents were of reagent grade.
Determination of the half-inhibitory
concentration (IC50) of sunitinib for the RCC cell line 786-O
The 786-O cell line was cultured at 37°C in the
RPMI-1640 medium supplemented with 10% of FBS. Upon reaching their
logarithmic growth phase, the cells were seeded in 96-well culture
plates at optimal density (104 cells/well) and incubated in a 5%
CO2 incubator at 37°C. The cells were cultured for 24 h and the
medium of the experimental group was supplemented with different
concentrations (0.5, 1, 2.5, 5 or 15 µM) of sunitinib at 37°C.
Media with the same concentrations of sunitinib but without cells
were used as the drug blank controls. Cells with the culture medium
alone served as the control and wells with the culture medium alone
were designated as the normal blank group. Five parallel wells were
included in each group. Following 72 h of treatment, MTT (20 µl)
was added to each well and incubated for an additional 4 h at 37°C.
The formazan precipitate was dissolved in 150 µl dimethyl sulfoxide
and the absorbance at 490 nm was measured on a microplate reader to
provide the optical density (OD). The relative growth rate (RGR)
was calculated as follows: RGR (%)=(ODe-ODe0)/(ODc-ODc0) ×100%,
where ODe0, ODc0, ODe and ODc represent the absorbance of the drug
blank, normal blank, experimental group and control group,
respectively. A cell survival curve was plotted as the mean value
of each group; the IC50 was calculated following curve fitting.
Creation of a sunitinib-resistant RCC
cell line
According to the results of IC50 evaluation, an RCC
cell line demonstrating resistance to sunitinib, termed 786-O/S,
was generated by serial treatment of the parental 786-O cell line
with various concentrations of sunitinib from 2.5 to 10 µM at 37°C
with the dose given at 1 month intervals. Following continuous
culture in the complete medium supplemented with 10 µM sunitinib
for >10 passages, identify the IC50 of 786O/S cells with method
mentioned above (concentrations of sunitinib, 5, 10, 15, 20, 30, 40
and 50 µM). The cells were employed as sunitinib-resistant RCC
cells in all subsequent experiments.
Cell migration analysis
786-O and 786-O/S cells were cultured in RPMI-1640
supplemented with 10% FBS at 37°C and 5% CO2 in a
humidity-saturated incubator. Upon reaching their logarithmic
growth phase, the cells were seeded in 12-well culture plates at
optimal density (105 cells/well) and kept in the 5% CO2 incubator
at 37°C overnight. Following culture, the cells were incubated at
37°C with RPMI-1640 without FBS for >4 h to obtain cells in the
same growth phase. Subsequently, a scratch was created using a 200
µl tip. The culture medium was replaced with culture medium
containing 6 µM sunitinib and images of the cells were obtained
using a fluorescence microscope (×40 magnification) at 0, 24 and 48
h.
Colony formation ability
To detect the effects of sunitinib on colony
formation ability, 786-O and 786-O/S cells were seeded in 6-well
culture plates at 1,000, 500 and 200 cells/well. Following 24 h at
37°C, culture medium containing 6 µM sunitinib was added to each
well and cells were cultured for 15 days at 37°C with 5% CO2.
During this time, the medium was refreshed every 3 days.
Subsequently, the cells were washed three times at 37°C with PBS,
fixed with 4% paraformaldehyde for 15 min at room temperature and
washed three times with distilled water. The cells were then
stained with 0.5% crystal violet (5 mg/ml) for 15 min at room
temperature, followed by washing with distilled water. The colonies
stained with crystal violet were counted.
Western blot analysis of COX-2 and
PGE2
Both 786-O and 786-O/S cell lines were seeded in
24-well culture plates in culture medium alone or with 6 µM
sunitinib for 72 h at 37°C. Total protein was extracted from cells
using SDS lysis buffer (Beyotime Institute of Biotechnology,
Shanghai, China). Protein concentration was determined with a
Bicinchoninic Acid Protein assay kit (Thermo Fisher Scientific,
Inc.). Samples containing 30 µg of protein were subjected to
SDS-polyacrylamide gel (4% stacking gel and 10% separating gel)
electrophoresis and the protein bands were then transferred onto a
polyvinylidene difluoride membrane. The membrane was blocked for 1
h at room temperature with 5% fat-free milk in Tris-buffered saline
containing 0.1% Tween-20 and incubated overnight with primary
antibodies at 4°C. The primary antibodies included those against
human COX-2 (Cell Signaling Technology, #12282, 1:1,000), PGE2
(Absin Bioscience, www.absin.cn,
abs124338, 1:1,000) and GAPDH (Sigma-Aldrich, G9545, 1:5,000). The
following day the blots were incubated with the goat-anti-rabbit
and goat-anti-mouse antibody (Jackson ImmunoResearch, 111-035-045
and 115-035-062, 1:10,000) at room temperature for 1 h. Specific
binding was detected using an enhanced chemiluminescenct kit
(Pierce; Thermo Fisher Scientific, Inc.).
Detection of CSC marker proteins and
COX-2 by reverse transcription-quantitative polymerase chain
reaction (RT-qPCR)
Both 786-O and 786-O/S cells were cultivated in
24-well culture plates for 48 h. Total RNA was extracted from the
cells using RNAiso Plus (Takara Bio, Inc., Otsu, Japan). To detect
mRNA, complementary DNA was synthesized from the total RNA with
SuperScript Reverse Transcriptase (Takara Bio, Inc.) according to
the manufacturer's protocols and then mRNA was detected with SYBR
Primer Ex Tag II (Takara Bio, Inc.). The primers targeting CD133,
COX-2 and GAPDH were as follows: CD133 forward,
5′-TTGTGGCAAATCACCAGGTA and reverse, 5′-TCAGATCTGTGAACGCCTTG; COX-2
forward, 5′-GCACAAATATGATGTTCGCATT and reverse,
5′-CTGAACCCAGGTCCTCGCTTCT; and GAPDH forward,
5′-TCATGGGTGTGAACCATGAGAA and reverse, 5′-GGCATGGACTGTGGTCATGAG-3′.
qPCR was performed on a Roche 480 machine (Roche Diagnostics GmbH,
Mannheim, Germany) with the following parameters: One cycle at 95°C
for 10 min, followed by 40 cycles of 95°C for 15 sec and 60°C for 1
min. Each group was set 3 parallel well and the quantification
cycle values were calculated for all genes with 2−ΔΔCq
method (16).
Detection of COX-2 and CD133 by qPCR
in the celecoxib condition
Both 786-O and 786-O/S cell lines were seeded in
24-well culture plates in the culture medium alone or culture
medium containing 6 µM sunitinib for 48 h incubation at 37°C.
Different concentrations of celecoxib (10 or 25 µM) were added to
each well for 24 h. The experimental procedure for RT-qPCR was then
performed as aforementioned.
Detection of CD133 by western blot
analysis in the celecoxib condition
Both 786-O and 786-O/S cell lines were seeded in
24-well plates in the culture medium alone or culture medium
containing 6 µM sunitinib for 48 h incubation at 37°C. Different
concentrations of celecoxib (10 or 25 µM) were added to each well.
The anti-human CD133 antibody was purchased from Cell Signaling
Technology, Inc. (#64326, 1:1,000). The experimental procedure for
western blot analysis was then performed as aforementioned.
Statistical analysis
Experiments were performed three times and data are
presented as the mean ± standard error of the mean. Data were
analyzed using SPSS 18.0 software (SPSS, Inc., Chicago, IL, USA).
Comparisons were performed by an unpaired Student t-test for two
groups and one-way analysis of variance for more than two groups.
Comparisons between multiple groups was performed using S-N-K
method. P<0.05 was considered to indicate a statistically
significant difference. The results were statistically analyzed by
GraphPad software V.8 (GraphPad Software, Inc., La Jolla, CA,
USA).
Results
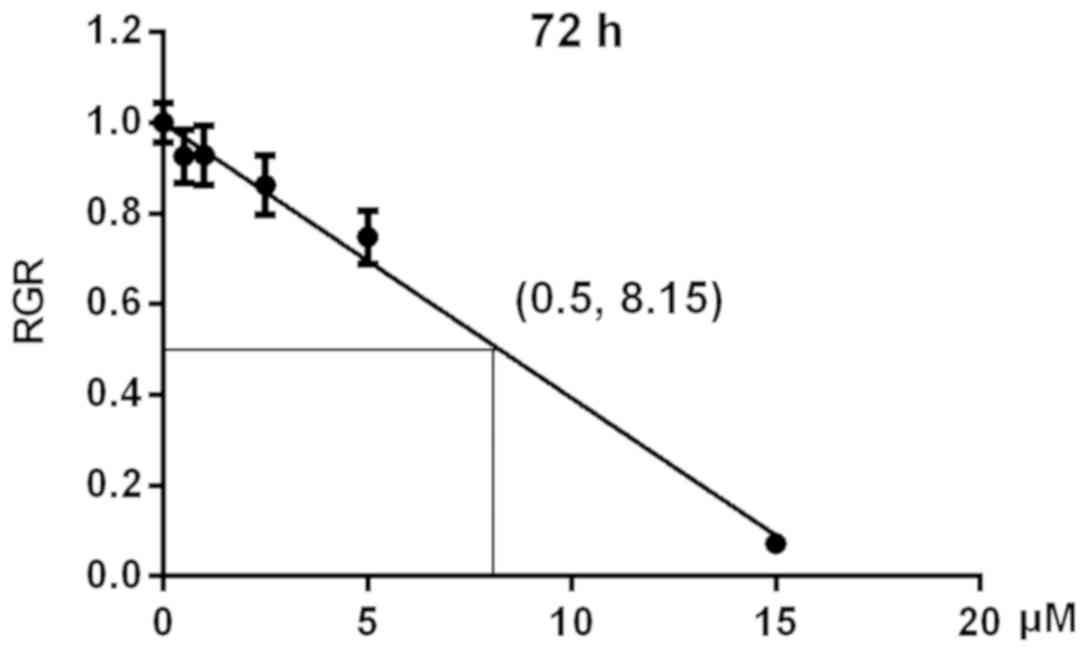
IC50 of sunitinib for 786-O cells
To evaluate the effects of different concentrations
(0, 0.5, 1, 2.5, 5 or 15 µM) of sunitinib on the viability of 786-O
cells an MTT assay was performed. The mean value of each group at
490 nm decreased with increases in sunitinib concentration
(Table I). Based on these data, RGR
values were calculated and cell survival curves were plotted. The
IC50 value was calculated following curve fitting and identified to
be 8.15 µM (Fig. 1).
 | Table I.Mean value of the optical density at
490 nm for 786-O cells treated with different concentrations of
sunitinib for 72 h. |
Table I.
Mean value of the optical density at
490 nm for 786-O cells treated with different concentrations of
sunitinib for 72 h.
| Sunitinib (µM) | Mean ± standard
deviation |
|---|
| 0.0 | 0.6190±0.0269 |
| 0.5 | 0.5625±0.0365 |
| 1.0 | 0.5697±0.03451 |
| 2.5 | 0.5273±0.03519 |
| 5.0 | 0.4647±0.02996 |
| 15.0 | 0.0421±0.00652 |
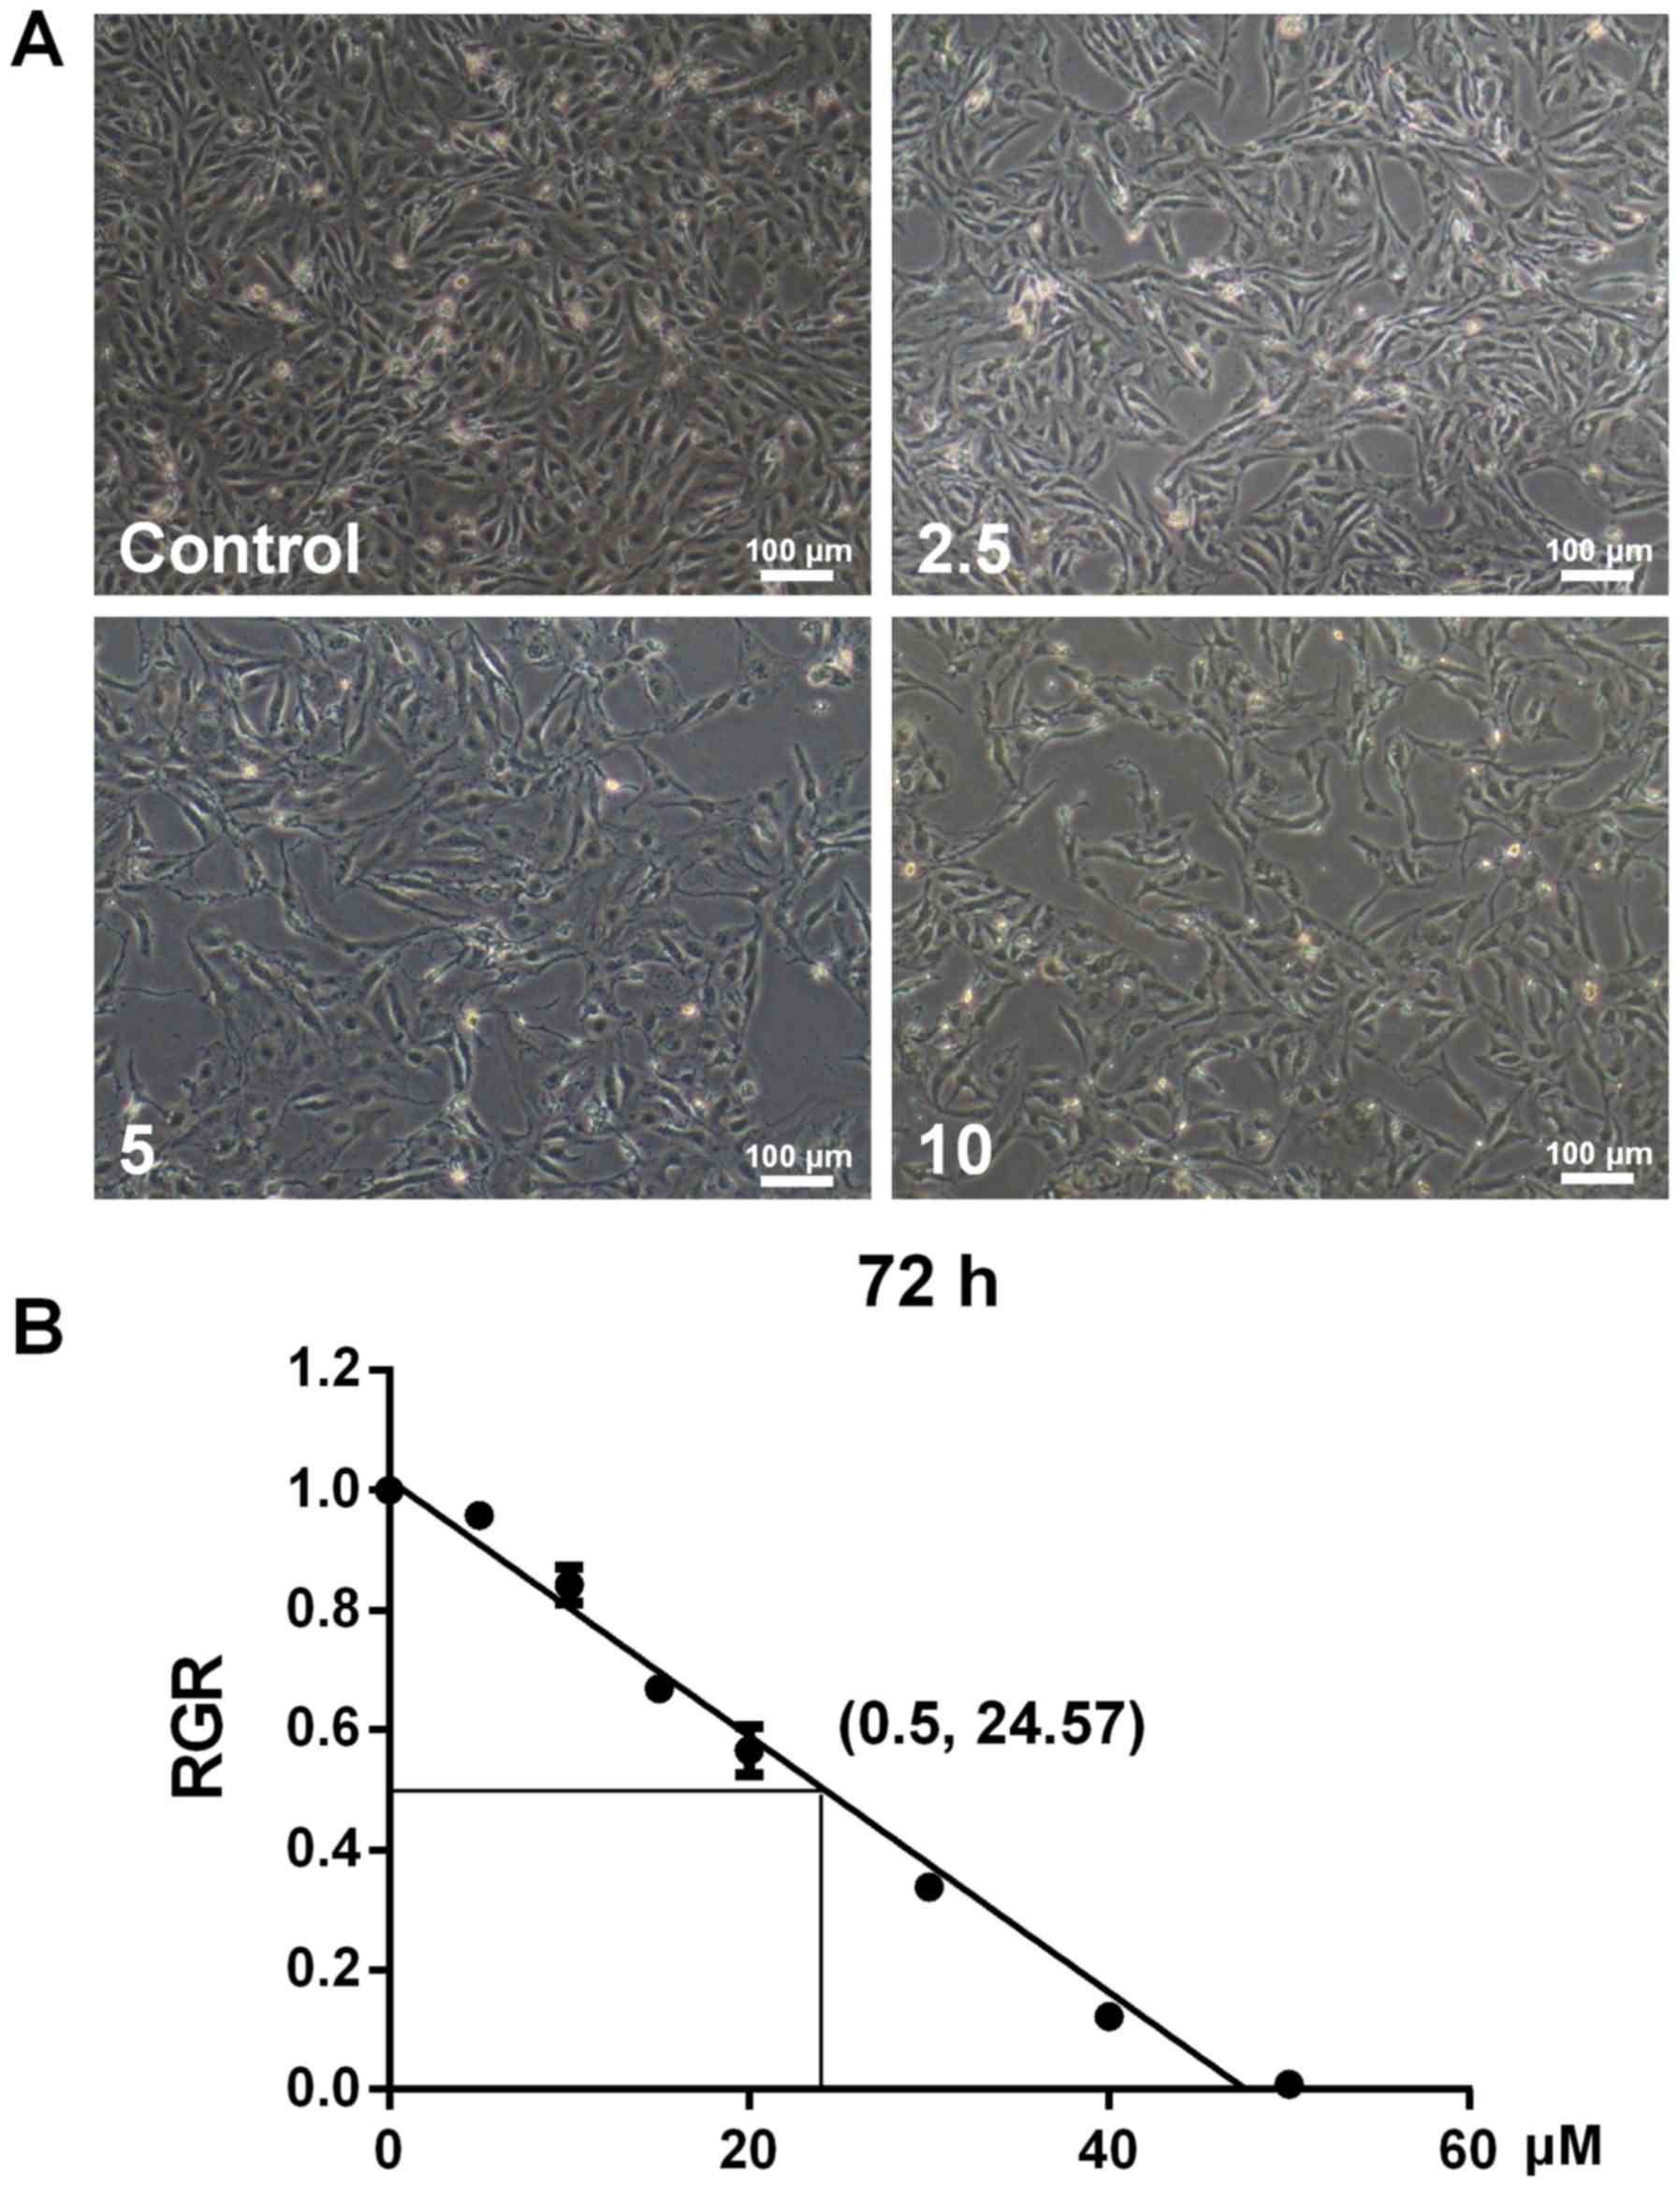
Development of the sunitinib-resistant
RCC cell line (786-O/S)
When 786-O cells were treated with various
concentrations of sunitinib from 2.5 to 10 µM, morphological
changes were observed (Fig. 2). In
comparison with the control cells, sunitinib-resistant cells
appeared slimmer with increasing drug concentration (Fig. 2A). Following continuous culture in
complete culture medium supplemented with 10 µM sunitinib for
>10 passages, the IC50 determined by an MTT assay was 24.57 µM.
According to the IC50 values for 786-O and 786-O/S cells, the
resistance index (IC50786-O/S/IC50786-O) was identified to be 3.01.
These results demonstrated that drug resistance of 786-O/S cells
significantly increased following treatment with high
concentrations of sunitinib.
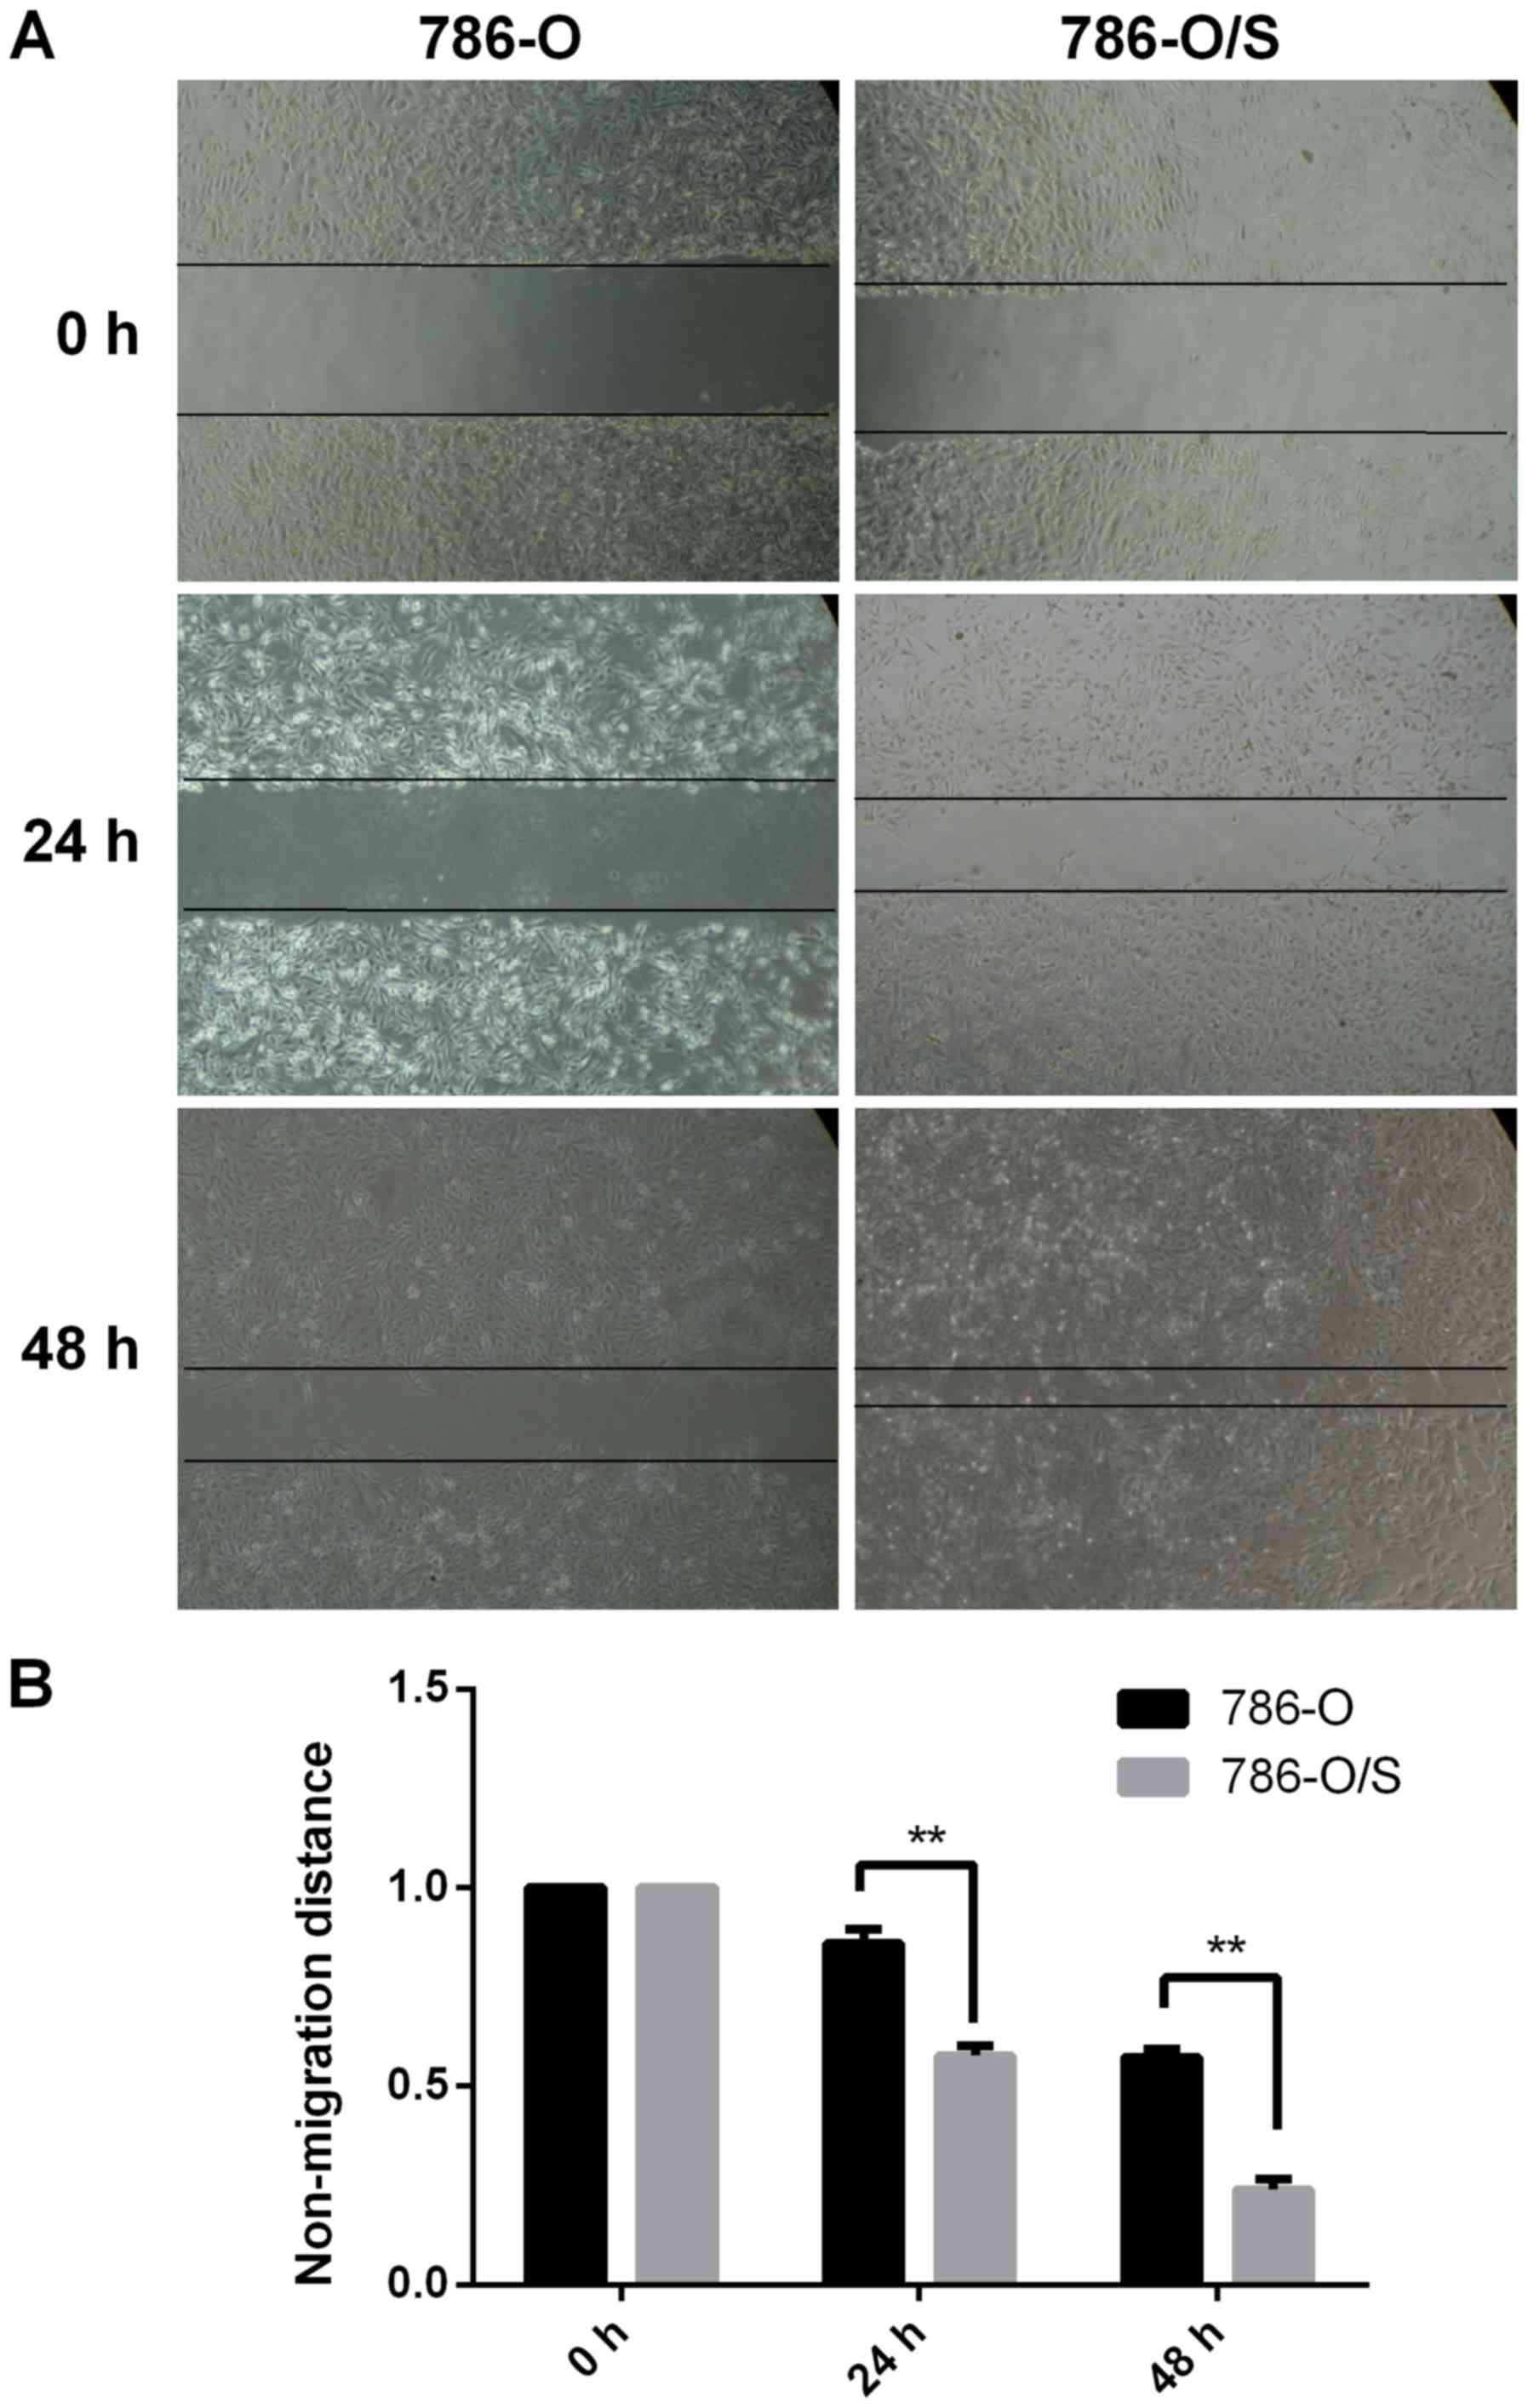
Cell migration assay for 786-O and
786-O/S cells
The migration of 786-O and 786-O/S cells was
observed and photographed following treatment with 6 µM sunitinib.
As demonstrated in Fig. 3, the
scratch area was significantly larger for 786-O cells compared with
786-O/S cells at 24 and 48 h, indicating that the migration speed
of 786-O/S cells was faster compared with that of the parental
cells. The width of the scratch was significantly reduced in the
786-O/S cell group at 48 h compared with 786-O cells. Therefore,
the migration ability of sunitinib-resistant cells was
significantly promoted compared with the parental cells.
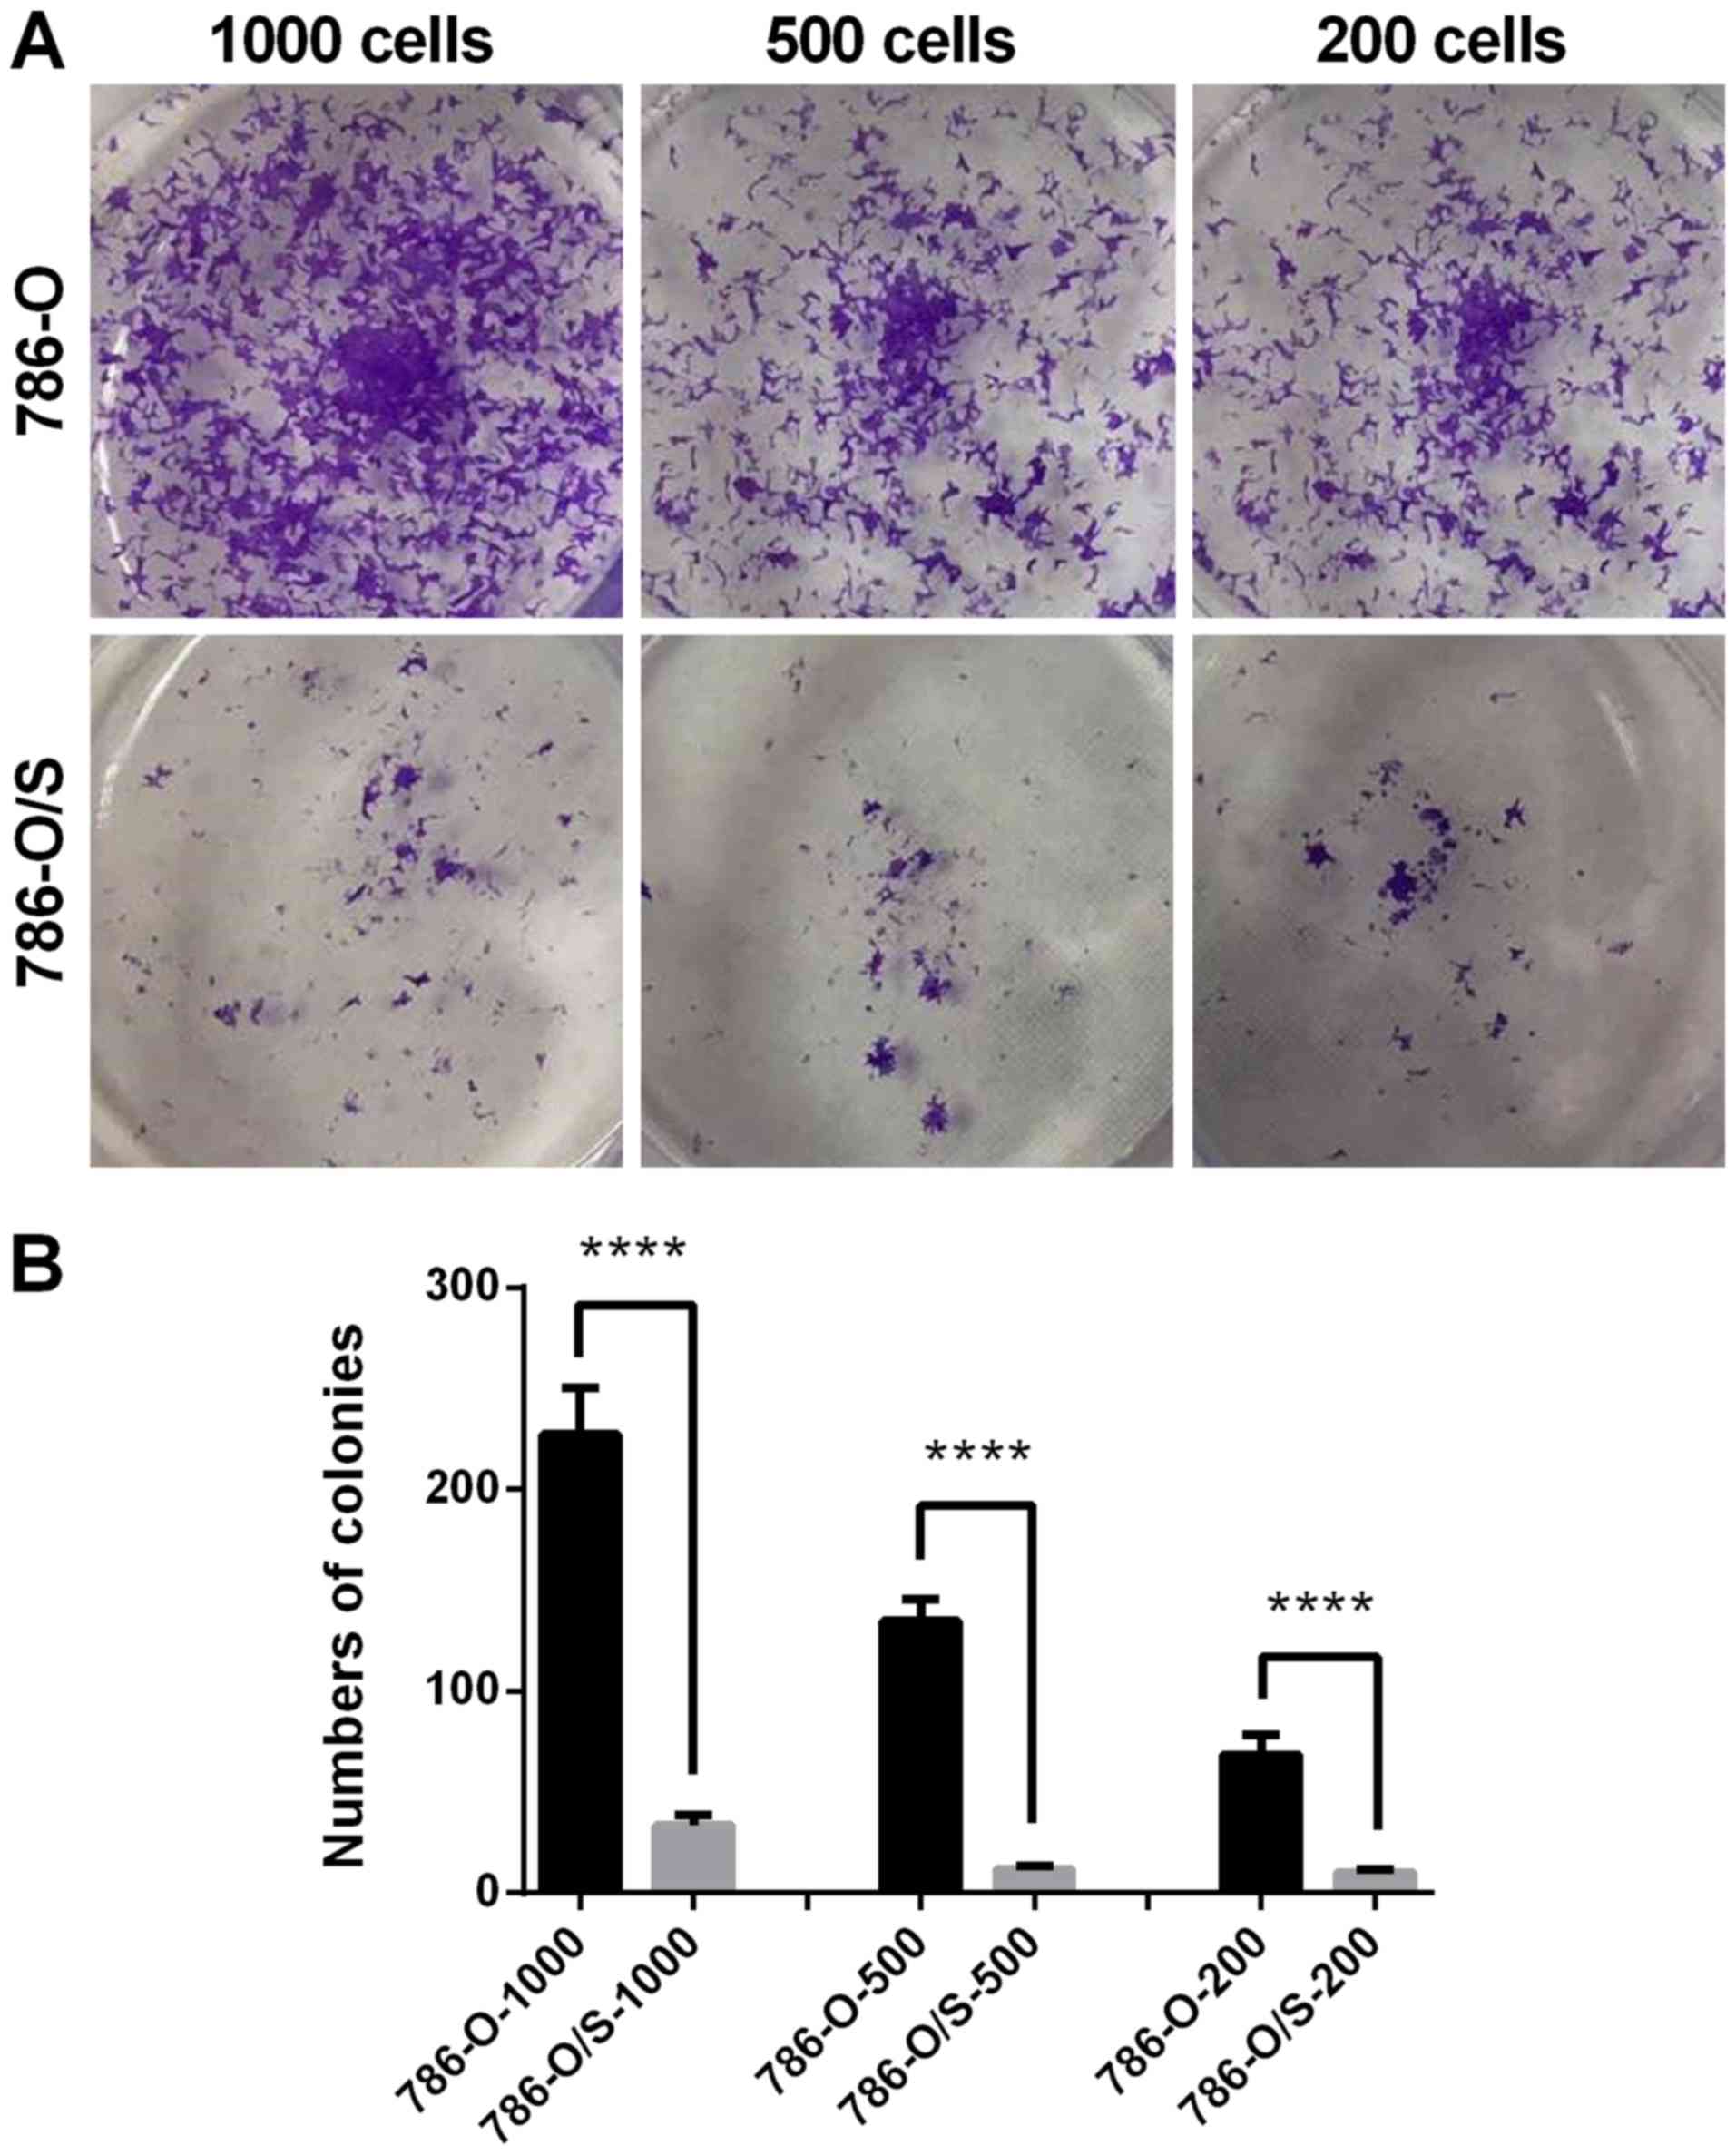
Proliferative ability of 786-O and
786-O/S cells
A colony formation assay was performed to analyze
the proliferative ability of 786-O and 786-O/S cells. The cells
were stained with crystal violet following culture with 6 µM
sunitinib for 15 days. When observed directly, the number of
colonies of 786-O/S cells was greater and the size of the colonies
was larger compared with that of 786-O cells in the 1,000-, 500-
and 200-cell groups (Fig. 4A). This
was consistent with the quantified analysis results, which revealed
a significantly higher number of colonies in the 786-O/S group
compared with the control (Fig. 4B).
The colony formation ability of the cells notably decreased
following treatment with 6 µM sunitinib (Fig. 4). Therefore, sunitinib-resistant
cells demonstrated a significant increase in proliferative
ability.
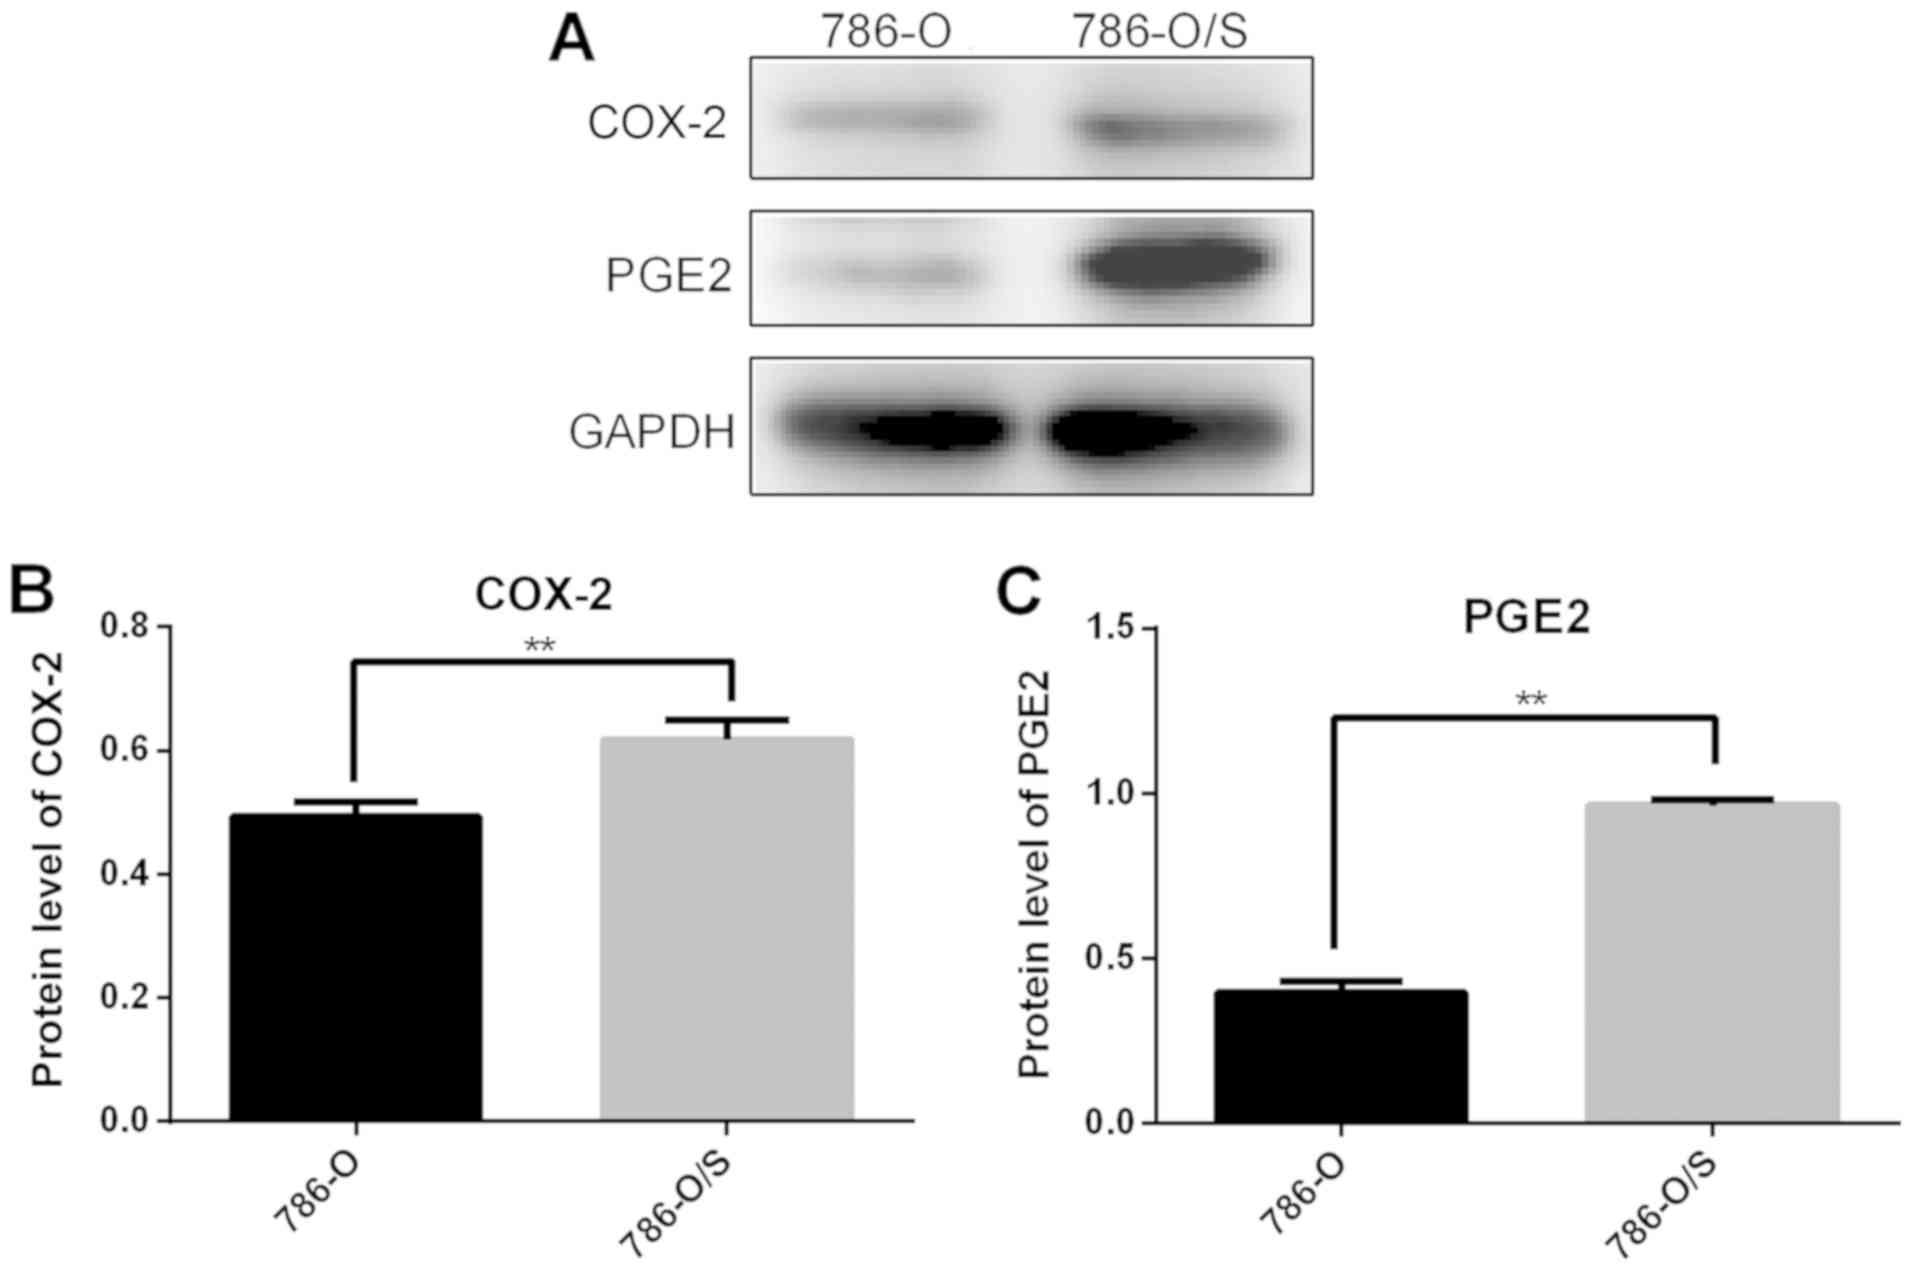
Expression of COX-2 and PGE2 in 786-O
and 786-O/S cells
The expression levels of COX-2 and PGE2 in 786-O and
786-O/S cells were quantified following western blot analysis
(Fig. 5), which revealed
significantly higher expression levels of COX-2 (Fig. 5B) and PGE2 (Fig. 5C) in 786-O/S cells compared with
786-O cells.
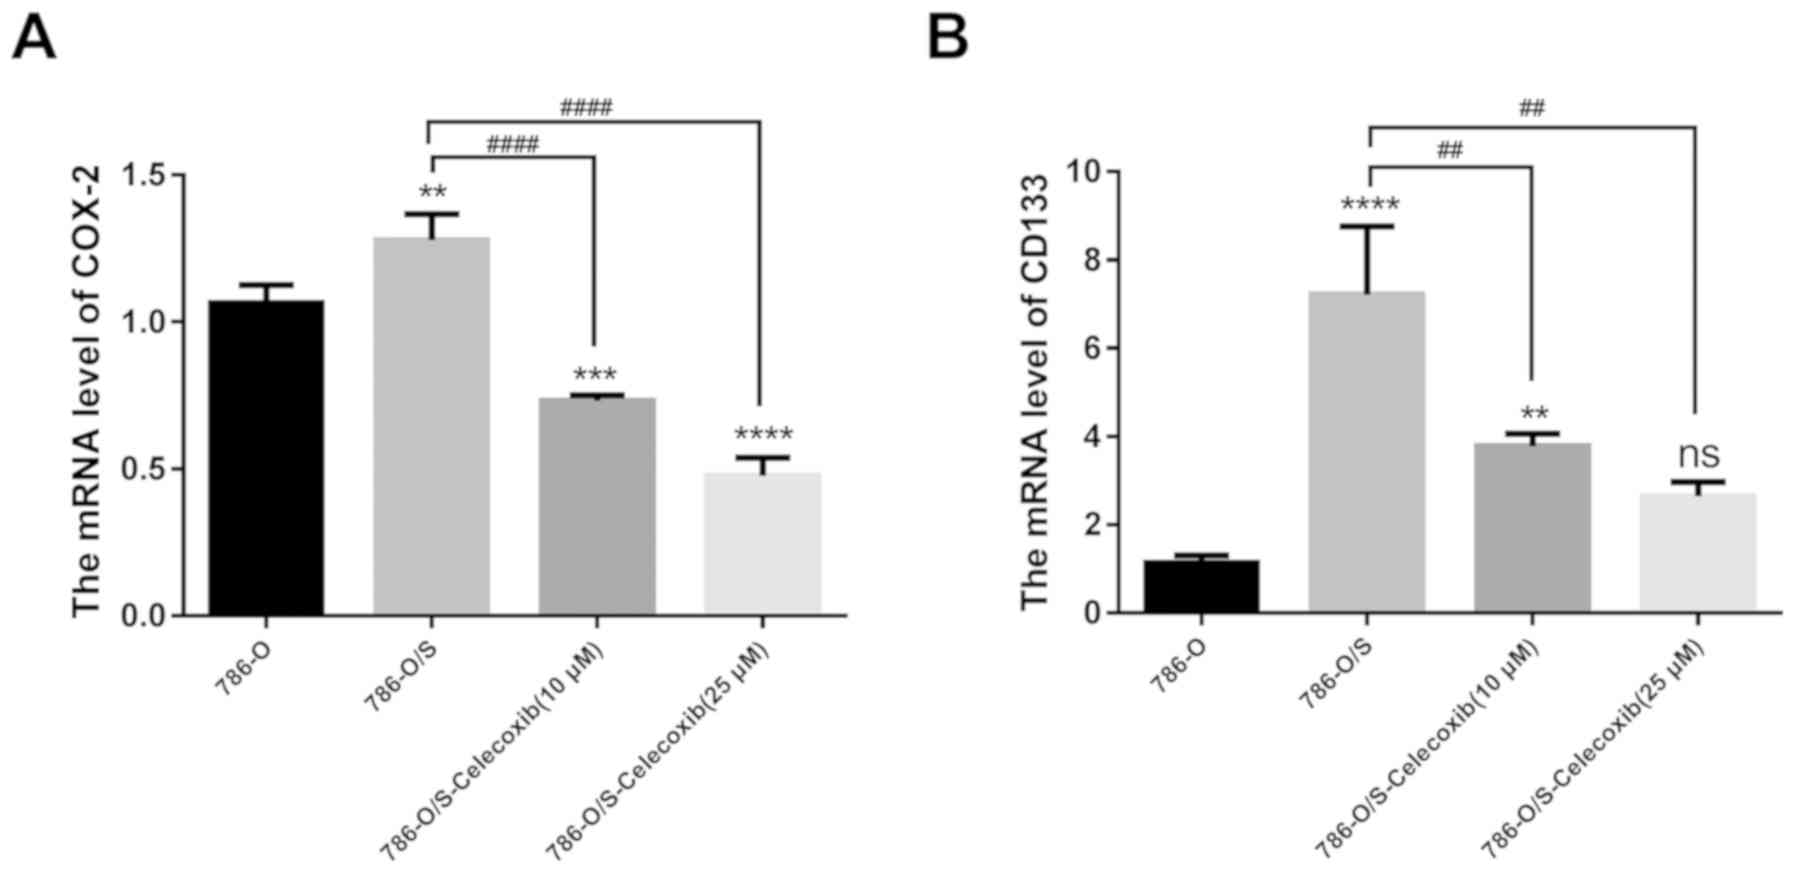
Expression of COX-2 and CD133 in 786-O
and 786-O/S cells
The mRNA expression levels of COX-2 in 786-O and
786-O/S cells were quantified by RT-qPCR. The results demonstrated
that the expression levels of COX-2 in 786-O/S cells were higher
compared with the control cells (Fig.
6A; P<0.01). CD133, an important CSC marker in RCC, was used
to examine the stemness of 786-O/S cells. The expression levels of
CD133 in 786-O/S cells were higher compared with that in the
control cells (Fig. 6B). When
different concentrations (10 or 25 µM) of celecoxib were incubated
with the cells, the expression levels of COX-2 significantly
decreased at both concentrations (P<0.001). In addition, a
significant decrease in the expression of CD133 was observed
following treatment with 10 µM (P<0.01), but not 25 µM celecoxib
(Fig. 6).
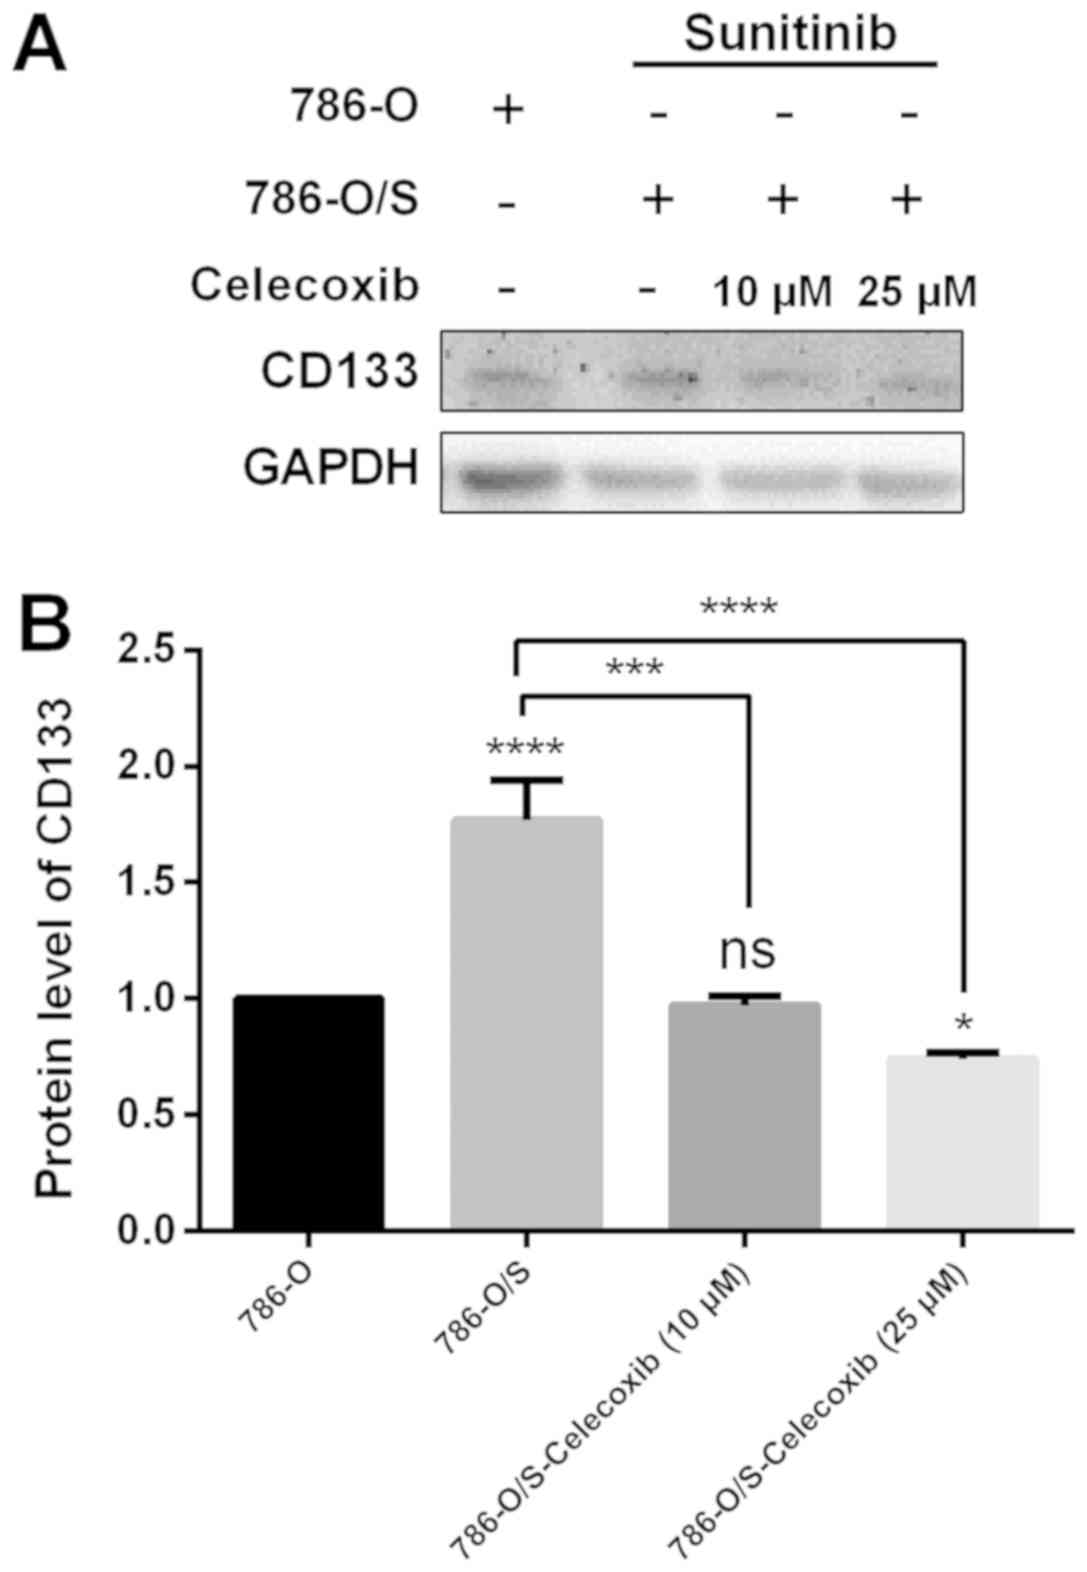
Expression of CD133 following
celecoxib treatment
The protein expression of CD133 in 786-O and 786-O/S
cells was quantified by western blot analysis (Fig. 7). The results demonstrated that the
expression of CD133 was significantly higher in 786-O/S cells
compared with 786-O cells (Fig. 7B;
P<0.0001). When different concentrations (10 or 25 µM) of
celecoxib were incubated with the cells, the expression of CD133
significantly decreased (P<0.001), particularly at a
concentration of 25 µM compared with in untreated 786-O/S cells
(Fig. 7A).
Discussion
Several mechanisms are thought to be involved in the
development of sunitinib resistance (17–25).
These mechanisms include: i) Lysosomal membrane permeabilization
and autophagy; ii) antiangiogenic-therapy-induced hypoxia that may
stimulate the expression of other proangiogenic factors, such as
fibroblast growth factor and interleukin-8; iii)
epithelial-to-mesenchymal transition regulation via epidermal
growth factor receptor; iv) intrinsic resistance and multidrug
resistance; v) sequestration of sunitinib in acidic lysosomes to
reduce its cytoplasmic availability; and vi) alterations in the
transcription of genes, including protein kinase X-linked, tau
tubulin kinase 2, ribosomal protein S6 kinase α4, tyrosine-protein
kinase receptor UFO, MET and interleukin 13 receptor subunit α2.
The present study investigated the possible mechanism of sunitinib
resistance via the COX-2-PGE2 signaling pathway.
In the early 1970s, Hamburger and Salmon (26) proposed the CSC theory by confirming
that only a small number of cells in solid malignant tumors may
further proliferate and form colonies following transplantation.
This hypothesis implies that only a small number of CSCs possess
the capacity for unlimited proliferation and tumor formation; thus,
solid malignant tumors originate from a few CSCs. This theory has
been studied further in acute myeloid leukemia, breast cancer and
other cancer types (27,28). CSCs in RCC have also been studied
(29,30). It has been reported that the
expression of Bmi-1, a gene that may promote self-renewal of stem
cells and whose mutation may lead to tumor initiation, is inversely
proportional to the degree of RCC differentiation (31). Numerous characteristics of RCC are
similar to those of stem cells (31), which indicates a possibility of the
existence of renal CSCs. The surface marker of CSCs, CD133, also
termed prominin 1, was initially identified as a cell surface
antigen specific to hematopoietic stem cells (32). Bussolati et al (33) have reported the presence of CD133 in
multipotent progenitor cells in the proximal tubules and Bowman's
capsule in the kidneys of adults. Sun et al (34) demonstrated that CD133 expression is
closely associated with the degree of tumor differentiation and TNM
staging, including lymph node metastasis status. This observation
was supported by Costa et al (35). The present study revealed the
expression of CD133 in both 786-O and 786-O/S cells; however, CD133
expression was 24-fold higher in 786-O/S cells compared with 786-O
cells. Therefore, the proportion of CSCs may notably increase among
resistant cells, which suggests that CD133 may serve as a potential
maker for the development of novel treatment strategies to target
CSCs. A number of studies have demonstrated that CD133 may be
inhibited by the Notch pathway in glioma stem cells and
neuroblastoma cells (36,37).
The enzyme COX-2 converts arachidonic acid to
prostaglandin G2, which is later converted via peroxidase activity
to prostaglandin H2, a precursor of other prostaglandins (38). The COX-2-PGE2 pathway is understood
to perform an important function by increasing cell proliferation,
promoting angiogenesis, inhibiting apoptosis, regulating cell
adhesion and increasing the invasiveness of malignant cells
(39). This pathway is seldom
detected in human tissues under normal physiological conditions but
may be activated in several solid malignant tumors, including
colorectal, breast, prostate, skin, lung, bladder and pancreatic
cancers (40). Yi et al
(41) demonstrated that the
expression levels of COX-2 in RCC were 10% higher compared with
that in healthy renal tissue. Treatment of RCC with a combination
of a tyrosine kinase inhibitor and COX-2 inhibitor has been rarely
reported. Using a nude-mouse model of RCC, Wang et al
(42) demonstrated that a COX-2
inhibitor may enhance the therapeutic effect of sunitinib and
prolong the progression-free survival time. In addition, they
revealed that the resistance to sunitinib is associated with strong
expression of COX-2. Zhao et al (43) reported that a COX-2 inhibitor in
combination with sunitinib is more effective compared with
sunitinib or the COX-2 inhibitor alone in RCC-bearing mice.
Therefore, combination therapy consisting of a COX-2 inhibitor and
sunitinib may enhance the antitumor effect by reducing the number
of immunosuppressive cells and regulating the tumor
microenvironment. It can be hypothesized that sunitinib resistance
in RCC may be mediated by the activation of the COX-2-PGE2 pathway.
The current study identified that the expression of COX-2 and
synthesis of PGE-2 were significantly higher in the resistant cell
line compared with parental cells.
Celecoxib is widely used in the clinic. One study on
COX-2 in non-selected patients with mRCC evaluated the
effectiveness of celecoxib administered in conjunction with
interferon-α and revealed that 20–30% of mRCC tumors exhibit
maximal (3+) staining for COX-2 (44). Wang et al (42) identified that the combination of
sunitinib with celecoxib resulted in a longer time to tumor
progression compared with treatment with either agent alone or
compared with untreated control animals in four models. Zhao et
al (11) have also revealed that
combination therapy consisting of sunitinib and celecoxib exerts
improved curative effects against RCC compared with any monotherapy
and identified that immunoregulatory cells may be involved in this
phenomenon.
A number of studies have indicated that celecoxib
inhibits tumor sphere formation by CD133 downregulation (45–48).
COX-2 can facilitate proliferation of CSCs (45). COX-2-dependent mechanisms of an
inflammatory balance may be responsible for the treatment-resistant
phenotype of CSCs (46). Annabi
et al (46) revealed that
COX-2 induction is associated with CD133 expression in human glioma
cell lines and demonstrated that selective COX-2 inhibitors hold
promise for further developments in the treatment of glioma. In
in vivo and in vitro experiments, Ma et al
(47) reported that CD133-associated
tumorigenicity is significantly suppressed by celecoxib treatment.
Furthermore, celecoxib combined with radiation strongly suppressed
the growth of CD133+ glioblastoma stem-like cells. Similarly, Deng
et al (48) reported a
significant decrease in the levels of CD133 expression with
increasing concentrations or increasing duration of treatment with
celecoxib, as demonstrated in colon cancer HT29 cells. A gene
expression microarray revealed that stemness-associated genes,
including leucine-rich repeat-containing g-protein coupled receptor
5, octamer-binding transcription factor 4, prominin 1, prominin 2,
C-X-C receptor type 4, E2F transcription factor 8 and cyclin
dependent kinase-2, were downregulated and
differentiation-associated genes, including carcinoembryonic
antigenic related cell adhesion molecule 5, growth/differentiation
factor 15, adipose differentiation-related proteins and
intercellular adhesion molecule 1, were upregulated (42).
In the current study, a drug-resistant RCC cell line
(786-O/S) was established. The proliferation and migration
abilities of 786-O/S were significantly higher compared with those
of the control cell line, as evident from morphological
observations, a scratch test and colony formation assay. Based on
the close association between cancer resistance and CSCs, CD133 was
assumed to be an important marker of CSCs in RCC. The current
results demonstrated that the expression of CD133 was significantly
higher in 786-O/S cells compared with the control cells. The
expression levels of COX-2 and PGE2 were investigated, and were
determined to be significantly increased in 786-O/S cells compared
with the control cells. According to the present results, the
expression of COX-2 increased in 786-O/S cells when COX-2 was
inhibited by celecoxib. The expression of CD133 decreased at the
same time. It could be hypothesized that COX-2 may, in part, be
responsible for the drug resistance via CD133, which suggests that
COX-2 may affect the activation of CSCs. Therefore, celecoxib
should be considered for investigation within a clinical trial in
the future; however, the mechanism of action of COX-2 inhibitors in
the regulation of the cancer stem-like properties requires more
in-depth study. In summary, COX-2 was identified to be
overexpressed in sunitinib-resistant RCC cells and the COX-2-PGE2
signaling pathway may serve an important role in the maintenance of
CSC characteristics of RCC cells that are closely associated with
drug resistance.
Acknowledgements
The authors would like to thank Professor Haitao Niu
and his team of Key Laboratory, Department of Urology and
Andrology, Affiliated Hospital of Qingdao University for their help
and technical support.
Funding
This study was supported by the National Natural
Science Foundation of China (grant nos. 81672512, 81502195 and
81401899).
Availability of data and materials
The datasets used and/or analyzed during the current
study are available from the corresponding author on reasonable
request.
Authors' contributions
Conceptualization, LS and GZ; methodology, LL;
formal analysis, LL and YL; resources, LL; data curation, XD;
writing, original draft preparation, LL; writing, review and
editing, LL; visualization, data analysis and paper revision, XM;
funding acquisition, LS. All authors read and approved the final
manuscript.
Ethics approval and consent to
participate
Not applicable.
Patient consent for publication
Not applicable.
Competing interests
The authors declare that they have no competing
interests.
References
|
1
|
Jemal A, Bray F, Center MM, Ferlay J, Ward
E and Forman D: Global cancer statistics. CA Cancer J Clin.
61:69–90. 2011. View Article : Google Scholar : PubMed/NCBI
|
|
2
|
Chin AI, Lam JS, Figlin RA and Belldegrun
AS: Surveillance strategies for renal cell carcinoma patients
following nephrectomy. Rev Urol. 8:1–7. 2006.PubMed/NCBI
|
|
3
|
National Cancer Institute: Previous
version: SEER Cancer Statistics Review, 1975–2010. NCI; Bethesda,
MD: 2013, https://seer.cancer.gov/archive/csr/1975_2010/
|
|
4
|
Zhu H, Wang Z, Xu Q, Zhang Y, Zhai Y, Bai
J, Liu M, Hui Z and Xu N: Inhibition of STAT1 sensitizes renal cell
carcinoma cells to radiotherapy and chemotherapy. Cancer Biol Ther.
13:401–417. 2012. View Article : Google Scholar : PubMed/NCBI
|
|
5
|
Pantuck AJ, Zisman A and Belldegrun AS:
The changing natural history of renal cell Carcinoma. J Urol.
166:1611–1623. 2001. View Article : Google Scholar : PubMed/NCBI
|
|
6
|
Gan HK, Seruga B and Knox JJ: Sunitinib in
solid tumors. Expert Opin Investig Drugs. 18:821–834. 2009.
View Article : Google Scholar : PubMed/NCBI
|
|
7
|
Abrams TJ, Lee LB, Murray LJ, Pryer NK and
Cherrington JM: SU11248 inhibits KIT and platelet-derived growth
factor receptor beta in preclinical models of human small cell lung
cancer. Mol Cancer Ther. 2:471–478. 2003.PubMed/NCBI
|
|
8
|
Mendel DB, Laird AD, Xin X, Louie SG,
Christensen JG, Li G, Schreck RE, Abrams TJ, Ngai TJ, Lee LB, et
al: In vivo antitumor activity of SU1 a novel tyrosine kinase
inhibitor targeting vascular endothelial growth factor and
platelet-derived growth factor receptors: Determination of a
pharmacokinetic/pharmacodynamic relationship. Clin Cancer Res.
9:327–337. 2003.PubMed/NCBI
|
|
9
|
Motzer R, Hutson TE, Tomczak P, Michaelson
MD, Bukowski RM, Rixe O, Oudard S, Negrier S, Szczylik C, Kim ST,
et al: Sunitinib versus interferon alfa in metastatic renal-cell
carcinoma. N Engl J Med. 356:115–124. 2007. View Article : Google Scholar : PubMed/NCBI
|
|
10
|
Tabriz HM, Mirzaalizadeh M, Gooran S, Niki
F and Jabri M: COX-2 Expression in renal cell carcinoma and
correlations with tumor grade, stage and patient prognosis. Asian
Pac J Cancer Prev. 17:535–538. 2016. View Article : Google Scholar : PubMed/NCBI
|
|
11
|
Zhao Q, Guo J, Wang G, Chu Y and Hu X:
Suppression of immune regulatory cells with combined therapy of
celecoxib and sunitinib in renal cell carcinoma. Oncotarget.
8:1668–1677. 2017.PubMed/NCBI
|
|
12
|
Kaminska K, Szczylik C, Lian F and
Czarnecka AM: The role of prostaglandin E2 in renal cell cancer
development: Future implications for prognosis and therapy. Future
Oncol. 10:2177–2187. 2014. View Article : Google Scholar : PubMed/NCBI
|
|
13
|
Liu LM, Sun HA, Li X, Chen Y, Wei BF and
Li XJ: Cluster of differentiation 44- and octamer-binding
transcription factor-4-positive stem-like osteosarcoma cells
involved in tumor development. Oncol Lett. 10:273–276. 2015.
View Article : Google Scholar : PubMed/NCBI
|
|
14
|
Li J, Zhong XY, Li ZY, Cai JF, Zou L, Li
JM, Yang T and Liu W: CD133 expression in osteosarcoma and
derivation of CD133+ cells. Mol Med Rep. 7:577–584. 2012.
View Article : Google Scholar : PubMed/NCBI
|
|
15
|
Ranji P, Salmani Kesejini T, Saeedikhoo S
and Alizadeh AM: Targeting cancer stem cell-specific markers and/or
associated signaling pathways for overcoming cancer drug
resistance. Tumor Biol. 37:13059–13075. 2016. View Article : Google Scholar
|
|
16
|
Livak KJ and Schmittgen TD: Analysis of
relative gene expression data using real-time quantitative PCR and
the 2(-Delta Delta C(T)) method. Methods. 25:402–408. 2001.
View Article : Google Scholar : PubMed/NCBI
|
|
17
|
Wiedmer T, Blank A, Pantasis S, Normand L,
Bill R, Krebs P, Tschan MP, Marinoni I and Perren A: Autophagy
inhibition improves sunitinib efficacy in pancreatic neuroendocrine
tumors via a lysosome-dependent mechanism. Mol Cancer Ther.
23:2502–2515. 2017. View Article : Google Scholar
|
|
18
|
Giuliano S and Pagès G: Mechanisms of
resistance to antiangiogenesis therapy. Biochimie. 95:1110–1119.
2013. View Article : Google Scholar : PubMed/NCBI
|
|
19
|
Gustafsson A, Fritz HKM and Dahlbäck B:
Gas6-Axl signaling in presence of Sunitinib is enhanced,
diversified and sustained in renal tumor cells, resulting in
tumor-progressive advantages. Exp Cell Res. 355:47–56. 2017.
View Article : Google Scholar : PubMed/NCBI
|
|
20
|
Lim SH, Hwang IG, Ji JH, Oh SY, Yi JH, Lim
DH, Lim HY, Lee SJ and Park SH: Intrinsic resistance to sunitinib
in patients with metastatic renal cell carcinoma. Asia Pac J Clin
Oncol. 13:61–67. 2016. View Article : Google Scholar : PubMed/NCBI
|
|
21
|
Sarkadi B, Homolya L, Szakács G and Váradi
A: Human multidrug resistance ABCB and ABCG transporters:
Participation in a chemoimmunity defense system. Physiol Rev.
86:1179–1236. 2006. View Article : Google Scholar : PubMed/NCBI
|
|
22
|
Gotink KJ, Broxterman HJ, Labots M, de
Haas RR, Dekker H, Honeywell RJ, Rudek MA, Beerepoot LV, Musters
RJ, Jansen G, et al: Lysosomal sequestration of Sunitinib: A novel
mechanism of drug resistance. Clin Cancer Res. 17:7337–7346. 2011.
View Article : Google Scholar : PubMed/NCBI
|
|
23
|
Bender C and Ullrich A: PRKX, TTBK2 and
RSK4 expression causes Sunitinib resistance in kidney carcinoma-
and melanoma-cell lines. Int J Cancer. 131:E45–E55. 2012.
View Article : Google Scholar : PubMed/NCBI
|
|
24
|
Zhou L, Liu XD, Sun M, Zhang X, German P,
Bai S, Ding Z, Tannir N, Wood CG, Matin SF, et al: Targeting MET
and AXL overcomes resistance to sunitinib therapy in renal cell
carcinoma. Oncogene. 35:2687–2697. 2016. View Article : Google Scholar : PubMed/NCBI
|
|
25
|
Shibasaki N, Yamasaki T, Kanno T, Arakaki
R, Sakamoto H, Utsunomiya N, Inoue T, Tsuruyama T, Nakamura E,
Ogawa O and Kamba T: Role of IL13RA2 in sunitinib resistance in
clear cell renal cell carcinoma. PLoS One. 10:e01309802015.
View Article : Google Scholar : PubMed/NCBI
|
|
26
|
Hamburger AW and Salmon SE: Primary
bioassay of human tumor stem cells. Science. 197:461–463. 1997.
View Article : Google Scholar
|
|
27
|
Bonnet D and Dick JE: Human acute myeloid
leukemia is organized as a hierarchy that originates form a
primitive hematopoietic cell. Nat Med. 3:730–737. 1997. View Article : Google Scholar : PubMed/NCBI
|
|
28
|
Al-Hajj M, Wicha MS, Benito-Hernandez A,
Morrison SJ and Clarke MF: Prospective identification of
tumorigenic breast cancer cells. Proc Natl Acad Sci USA.
100:3983–3988. 2003. View Article : Google Scholar : PubMed/NCBI
|
|
29
|
Gedye C, Sirskyj D, Lobo NC, Meens J,
Hyatt E, Robinette M, Fleshner N, Hamilton RJ, Kulkarni G, Zlotta
A, et al: Cancer stem cells are underestimated by standard
experimental methods in clear cell renal cell carcinoma. Sci Rep.
6:252202016. View Article : Google Scholar : PubMed/NCBI
|
|
30
|
Yuan ZX, Mo J, Zhao G, Shu G, Fu HL and
Zhao W: Targeting strategies for renal cell carcinoma: From renal
cancer cells to renal cancer stem cells. Front Pharmacol.
10:4232016.
|
|
31
|
Kozakowski N, Soleiman A and Pammer J: BM
I-1 expression is inversely correlated with the grading ofrenal
cell carcinoma. Pathol Oncol Res. 14:9–13. 2008. View Article : Google Scholar : PubMed/NCBI
|
|
32
|
Kim K, Ihm H, Ro JY and Cho YM: High-level
expression of stem cell marker CD133 in clear cell renal cell
carcinoma with favorable prognosis. Oncol Lett. 2:1095–1100.
2011.PubMed/NCBI
|
|
33
|
Bussolati B, Bruno S, Grange C,
Buttiglieri S, Deregibus MC, Cantino D and Camussi G: Isolation of
renal progenitor cells from adult human kidney. Am J Pathol.
166:545–555. 2005. View Article : Google Scholar : PubMed/NCBI
|
|
34
|
Sun C, Song H, Zhang H, Hou C, Zhai T,
Huang L and Zhang L: CD133 expression in renal cell carcinoma (RCC)
is correlated with nuclear hypoxia-inducing factor 1α (HIF-1α). J
Cancer Res Clin Oncol. 138:1619–1624. 2012. View Article : Google Scholar : PubMed/NCBI
|
|
35
|
Costa WH, Rocha RM, Cunha IW, Fonseca FP,
Guimaraes GC and Zequi Sde C: CD133 immunohistochemical expression
predicts progression and cancer-related death in renal cell
carcinoma. World J Urol. 30:553–558. 2012. View Article : Google Scholar : PubMed/NCBI
|
|
36
|
Fan X, Matsui W, Khaki L, Stearns D, Chun
J, Li YM and Eberhart CG: Notch pathway inhibition depletes
stem-like cells and blocks engraftment in embryonal brain tumors.
Cancer Res. 66:7445–7452. 2006. View Article : Google Scholar : PubMed/NCBI
|
|
37
|
Wang J, Wang H, Li Z, Wu Q, Lathia JD,
McLendon RE, Hjelmeland AB and Rich JN: c-Myc is required for
maintenance of glioma cancer stem cells. PLoS One. 3:e37692008.
View Article : Google Scholar : PubMed/NCBI
|
|
38
|
Taketo MM: Cyclooxygenase-2 inhibitors in
tumorigenesis (part I). J Natl Cancer Inst. 90:1529–1536. 1998.
View Article : Google Scholar : PubMed/NCBI
|
|
39
|
Tsujii M, Kawano S and DuBois RN:
Cyclooxygenase-2 expression in human colon cancer cells increase
metastatic potential. Proc Nad Acad Sci USA. 94:3336–3340. 1997.
View Article : Google Scholar
|
|
40
|
Zha S, Yegnasubramanian V, Nelson WG,
Isaacs WB and De Marzo AM: Cyclooxygenases in cancer: Progress and
perspective. Cancer Lett. 215:1–20. 2004. View Article : Google Scholar : PubMed/NCBI
|
|
41
|
Yi S, Wang CP and Zeng FQ: Expression
levels of COX-2 and MMP-14 in renal cell carcinoma and clinical
significance. Modern Hospital. 17:77–80. 2017.
|
|
42
|
Wang X, Zhang L, O'Neill A, Bahamon B,
Alsop DC, Mier JW, Goldberg SN, Signoretti S, Atkins MB, Wood CG
and Bhatt RS: Cox-2 inhibition enhances the activity of sunitinib
in human renal cell carcinoma xenografts. Br J Cancer. 108:319–326.
2013. View Article : Google Scholar : PubMed/NCBI
|
|
43
|
Zhao Q, Hu XY, Wang GM, Guo JM and Chu YW:
COX-2 inhibitor enhances the activity of sunitinib in renal cell
carcinoma-bearing mice and its mechanism. Fudan Univ J Med Sci.
43:527–533. 2016.
|
|
44
|
Rini BI, Weinberg V, Dunlap S, Elchinoff
A, Yu N, Bok R, Simko J and Small EJ: Maximal COX-2 immumostaining
and clinical response to celecoxib and interferon alpha therapy in
metastatic renal cell carcinoma. Cancer. 106:566–575. 2006.
View Article : Google Scholar : PubMed/NCBI
|
|
45
|
Sharma V, Dixit D, Ghosh S and Sen E:
Cox-2 regulates the proliferation of glioma stem like cells.
Neurochem Int. 59:567–571. 2011. View Article : Google Scholar : PubMed/NCBI
|
|
46
|
Annabi B, Laflamme C, Sina A, Lachambre MP
and Béliveau R: A MT1-MMP/NF-kappaB signaling axis as a checkpoint
controller of COX-2 expression in CD133(+) U87 glioblastoma cells.
J Neuroinflammation. 6:82009. View Article : Google Scholar : PubMed/NCBI
|
|
47
|
Ma HI, Chiou SH, Hueng DY, Tai LK, Huang
PI, Kao CL, Chen YW and Sytwu HK: Celecoxib and radioresistant
glioblastoma-derived CD133+ cells: Improvement in radiotherapeutic
effects. J Neurosurg. 114:651–662. 2011. View Article : Google Scholar : PubMed/NCBI
|
|
48
|
Deng Y, Su Q, Mo J, Fu X, Zhang Y and Lin
EH: Celecoxib downregulates CD133 expression through inhibition of
the Wnt signaling pathway in colon cancer cells. Cancer Invest.
31:97–102. 2013. View Article : Google Scholar : PubMed/NCBI
|