Introduction
Gastric cancer (GC) is commonly diagnosed and has
been identified as the leading cause of cancer-associated mortality
in China since 2010; it remains a major clinical challenge due to
the limited treatment options and poor prognosis (1,2). The
occurrence and development of GC are complex processes involving
multiple genes and mechanisms. Numerous studies have been performed
to investigate potential associated genes, with the aim of
identifying the pathogenic mechanisms involved in GC, which may
ultimately aid in improving diagnostic and treatment methods for
the disease (3,4).
Hypoxia, which serves a vital role in
carcinogenesis, is able to induce metabolic reprogramming and
alterations associated with glucose metabolism and glucose
transport, angiogenesis, invasion and metastasis in malignant
cells, facilitating adaptation to anaerobic conditions by
upregulation of target genes (5,6). Hypoxia
not only induces tumor cell mutations, but also promotes the
survival of malignant cell clones via hypoxia-mediated
anti-apoptotic effects, which are associated with malignant tumor
cell invasion, proliferation, and resistance to radiotherapy and
chemotherapy (5). Hypoxia-inducible
factor-1 (HIF-1) is a heterodimeric transcription factor consisting
of α (HIF-1α) and β (HIF-1β) subunits (7). HIF-1 is overexpressed and exhibits
enhanced activity in the hypoxic microenvironment of tumors
(8,9). Notably, the protein expression levels
of HIF-1α and the binding activity of HIF-1β are upregulated during
hypoxia. The overexpression of HIF-1α has been identified in
numerous types of cancer and precancerous lesions, but not in
normal tissues or benign lesions (10–12).
Additionally, HIF-1α may contribute to hypoxia-induced drug
resistance, which is a major obstacle in the development of
effective cancer therapy (13).
Previously, clinical studies have revealed a significant
association between the expression levels of HIF-1α and prognosis
in GC (14–16). The role of HIF-1α in the initiation
and progression of tumors has attracted increasing attention.
GC, as is the case for most solid types of cancer,
produces energy via active glycolysis, regardless of whether the
conditions are aerobic or anaerobic (17). The increased energy consumption of
tumor cells requires higher levels of glucose transporters (GLUTs)
to be present in the cell membranes for the transport of glucose. A
previous study investigated the association between glucose
transporter 1 (GLUT1) and various tumor types, and identified that
the abnormal expression of GLUT1 and other relevant genes may be
associated with the intensive glucose metabolism in malignant cells
(18). Previous studies have
demonstrated that the transcription of GLUT1 is enhanced by HIF-1α
in other solid types of cancer under hypoxic conditions (19,20), and
glycolysis is enhanced to compensate for the increased energy
demands (21,22). Therefore, HIF-1α and GLUT1 may also
be associated with the regulation of certain oncogenes and growth
factors in GC.
Lactate dehydrogenase-5 (LDH-5) contains four LDH-M
subunits, and is one of the LDH isoenzymes that catalyze the
transformation of pyruvate to lactate to provide energy under
hypoxia, which may serve an important role in the development and
progression of malignancies, according to the well-known Warburg
effect (23). The role of LDH-5 in
GC remains unclear, although recent studies have revealed certain
insights (24,25). Kolev et al (25) demonstrated that LDH-5 expression in
human GC has a positive correlation with the HIF-1α pathway at the
protein expression level. Additionally, it appears that LDH-5
expression is associated with high tumoral and stromal vascular
endothelial growth factor expression in GC (24).
The development and identification of novel
potential targeting sites for intervention are essential in the
search for enhanced treatments for GC. Effective targeting to GC
requires a considerable understanding of the associated crosstalk
and pathways in cancerous and noncancerous cells. Our group
previously demonstrated that HIF-1α is a potential target gene
involved in the endogenous hypoxic response and bioenergetic
metabolism of GC cells. HIF-1α gene silencing may disturb cellular
energy metabolism and promote the apoptosis of GC cells (Hao et
al, unpublished). Furthermore, GLUT1 and LDH-5 serve key roles
in the use of pyruvate for anaerobic energy acquisition and the
predominance of this metabolic pathway in cancer cells. Given the
close interplay among HIF-1α, GLUT1 and LDH-5, the present study
investigated the protein and gene expression levels of HIF-1α,
GLUT1 and LDH-5 in patients with GC in order to assess their
clinical correlation and co-expression, with the aim of providing a
basis for the development of diagnostic and treatment methods for
GC.
Materials and methods
Patients and samples
A total of 85 patients with GC who were recruited
between March 2015 and September 2015 were included in the present
study, and were treated at the General Surgery Department, West
China Hospital. All individuals had a confirmed diagnosis of GC
based on histopathological evaluation and underwent partial or
total gastrectomy, depending on the extent of the neoplastic
lesions [21 of these 85 patients with distant metastasis (M1)
underwent planned gastrectomy due to bleeding, obstruction or
perforation directly resulting from GC]. Clinical data describing
the patient demographics (age and sex) and clinical variables
(site, size of lesions and disease duration) were obtained and
documented (Table I). The grading
and staging classifications were made according to the 8th English
edition of American Joint Committee on Cancer/Union for
International Cancer Control TNM classifications (26). A written consent form approved by the
Clinical Trials and Biomedical Ethics Committee of West China
Hospital, Sichuan University, was signed by every patient prior to
study initiation.
 | Table I.Demographic characteristics of
patients with gastric cancer. |
Table I.
Demographic characteristics of
patients with gastric cancer.
|
Characteristics | Number of patients,
n (%) |
|---|
| Sample size | 85 |
| Median age
(range) | 52 (33–81) |
| Age (years) |
|
<50 | 36 (42.35) |
|
≥50 | 49 (57.65) |
| Sex |
|
Male | 52 (61.18) |
|
Female | 33 (38.82) |
| Tumor size |
| <3
cm | 32 (37.65) |
| ≥3
cm | 53 (62.35) |
| Site of
lesions |
|
Fundus | 28 (32.94) |
|
Body | 20 (23.53) |
|
Antrum | 37 (43.53) |
| Lymph node
metastasisa |
|
N0 | 26 (30.59) |
|
N1 | 12 (14.12) |
|
N2 | 27 (31.76) |
|
N3 | 20 (23.53) |
| Degree of tumor
infiltrationa |
|
T1 | 10 (11.76) |
|
T2 | 13 (15.29) |
|
T3 | 51 (60.00) |
|
T4 | 11 (12.95) |
| Clinical
stagea |
| I | 11 (12.95) |
| II | 13 (15.29) |
|
III | 34 (40.00) |
| IV | 27 (31.76) |
| Histologic
gradea |
|
G1 | 15 (17.65) |
|
G2 | 29 (34.12) |
|
G3 | 41 (48.23) |
The tissue specimens collected in the operating room
were prepared and evaluated by an experienced pathologist. Normal
gastric tissues were taken from distant sites from the margins of
the tumors (>5.0 cm) by individually harvesting samples from
presumed noncancerous regions. Hematoxylin and eosin staining was
performed for the histological confirmation of noncancerous and
cancerous tissues. In brief, tissues were fixed in 4%
paraformaldehyde for 24 h and embedded in paraffin. Then, tissue
blocks were cut into 4-µm thick sections and incubated at 60°C for
4 h. After the removal of the paraffin, the sections were incubated
with hematoxylin for 5 min and with eosin for 1 min, respectively.
The slides were observed under a Zeiss light microscope at ×400
magnification (Carl Zeiss AG). Biopsies from cases were
site-matched and stored at −80°C prior to analysis.
Reagents
Mouse anti-human HIF-1α monoclonal antibody (cat.
no. ab16066), rabbit anti-human GLUT1 polyclonal antibody (cat. no.
ab15309) and goat anti-human LDH-5 polyclonal antibody (cat. no.
ab240482) were purchased from Abcam. Horseradish peroxidase (HRP)
labeled secondary antibodies (cat. nos. ZB-2305, ZB-2306 and
ZB-5301) were from Origene Technologies, Inc. An UltraSensitive SP
kit, liquid diaminobenzidine (DAB) enzyme substrate kit,
poly-L-lysine and antigen retrieval buffer were obtained from
Fuzhou Maixin Biotech Co., Ltd. TRIzol® reagent, a total
RNA extraction kit and the RevertAid™ First Strand cDNA Synthesis
kit were purchased from Invitrogen; Thermo Fisher Scientific, Inc.
DNA Marker (Marker I) was provided by Tiangen Biotech Co., Ltd. All
other chemicals and solvents were of analytical grade.
Immunohistochemical staining
Sections of tumor tissues (4-µm thickness) were
deparaffinized and peroxidase was quenched with methanol and 3%
hydrogen peroxide (1:1) for 30 min at 80°C. The sections were
immersed in citrate buffer, followed by microwaving for antigen
retrieval (3×5 min). After neutralization with endogenous
peroxidase using 3% H2O2 for 5 min at room
temperature, sections were preincubated with 5% blocking serum for
1 h and then incubated with primary antibodies overnight at room
temperature (mouse anti-human HIF-1α monoclonal antibody was
diluted to 1:80; rabbit anti-human GLUT1 polyclonal antibody was
diluted to 1:100; goat anti-human LDH-5 polyclonal antibody was
diluted to 1:150). Following washing with 0.01 M PBS (pH=7.4), the
sections were incubated with HRP-labeled secondary antibodies
(diluted 1:200) at room temperature for 15 min and washed in PBS.
Finally, the sections were incubated with streptavidin peroxidase
reagent for 15 min at room temperature and washed in PBS again. The
color was developed via a 15 min incubation with DAB solution and
the sections were weakly counterstained with hematoxylin at room
temperature for 1 min. Normal IgG was substituted for the primary
antibody as a negative control (equivalent concentration to the
respective test antibody) (11). The
slides were observed under a Zeiss light microscope at ×400
magnification (Carl Zeiss AG).
Assessment of HIF-1α, GLUT1 and LDH-5
protein expression
The percentages of GC cells with strong cytoplasmic
and nuclear HIF-1α, GLUT1 and LDH-5 expression were assessed
following inspection of each entire section. Blinded scoring of the
specimens was performed using a Zeiss microscope (Zeiss AG) by
three independent evaluators. In each ×200 magnification optical
field the percentage was recorded and the final score for each case
was the mean value, and the blinding was removed when all scoring
had been completed. Tumors were semi-quantitatively scored using a
three-point system (score 0–3) according to the intensity and
extent of staining.
HIF-1α expression in GC cells was assessed as score
0 (no positive or <1% of cell nuclei positive), score 1 (1–10%
of cell nuclei positive), score 2 (11–50% of cell nuclei positive)
and score 3 (>50% of cell nuclei positive), as previously
described (27).
Cellular GLUT1 expression was considered positive
only if distinct membrane staining was present. Cytoplasmic-only
stained cells were not designated as positive. GLUT1 expression in
GC cells was classified as score 0 (no positive cells), score 1
(<10% of cells positive), score 2 (11–50% of cells positive) and
score 3 (51–100% of cells positive), as described previously
(28).
LDH-5 expression in GC cells was graded as score 0
(negative or weak staining in <50% of the optical fields), score
1 (weak staining in 60–100% of the optical fields), score 2 (strong
staining in <50% of the optical fields) and score 3 (strong
staining in 60–100% of the optical fields), as described previously
(29).
Reverse transcription-quantitative PCR
(RT-qPCR)
Tissues stored at −80°C were placed in a liquid
nitrogen pre-cooled mortar. Following homogenization with liquid
nitrogen, the total RNA of the tissues was isolated using the
TRIzol® one-step extraction method at 4°C and cDNA was
synthesized using the RevertAid™ first strand cDNA
synthesis kit and followed by the PCR condition protocol from
Bio-Rad Laboratories, Inc. The reaction mixture was incubated at
20°C for 10 min, 42°C for 60 min then at 70°C for 10 min. After
centrifugation at 4°C for 10 min, the cDNA was obtained and stored
at −20°C. The primers and probes were designed using Primer-BLAST
(www.ncbi.nlm.nih.gov/tools/primer-blast/) (Table II) and synthesized by Sangon Biotech
Co., Ltd. The β-actin gene was used as the internal control. The
amplification reaction of the target genes, including HIF-1α, GLUT1
and LDH-M (LDH-5 contains four LDH-M subunits), was performed in a
30-μl volume containing 3 µl 10X buffer (Mg2+ free), 3
µl MgCl2 (25 mM), 0.36 µl dNTP (25 mM), 2 µl respective
primers, 1 µl probe with a FAM (10 µM), 5 µl cDNAs and 0.3 µl Taq
DNA polymerase (5 U/µl). The RT-qPCR reaction was conducted under
the following conditions: Denaturation for 3 min at 95°C, followed
by 33 cycles of 30 sec at 95°C, annealing for 35 sec at 61.4°C and
extension for 1 min at 72°C. All PCR results contained
amplification products obtained in the linear range of
amplification. Relative mRNA quantification was performed using the
ΔCq method. Relative expression ratios (R) were
recalculated using the following equation (30):
| Table II.Sequences of primers and probes for
the determination of HIF-1α, GLUT1 and LDH-M gene expression. |
Table II.
Sequences of primers and probes for
the determination of HIF-1α, GLUT1 and LDH-M gene expression.
| Target gene | Sequence
(5′-3′) | Length (bp) |
|---|
| HIF-1α (245
bp) |
|
Forward |
CTGACCCTGCACTCAATCAA | 20 |
|
Reverse |
CTTTGCTTCTGTGTCTTCAGCA | 22 |
|
Probe |
FAM-CACCTGAGCCTAATAGTCCCAG | 22 |
| GLUT1 (126 bp) |
|
Forward |
GGCATCAACGCTGTCTTCTAT | 21 |
|
Reverse |
CACAAACAGCGACACGACAGT | 21 |
|
Probe |
FAM-CAGCAGCCTGTGTATGCCACCA | 22 |
| LDH-M (195 bp) |
|
Forward |
CCAGCGTAACGTGAACATCTT | 21 |
|
Reverse |
CCCATTAGGTAACGGAATCG | 20 |
|
Probe |
FAM-CTTGACCTACGTGGCTTGGAAGA | 23 |
| β-actin (114
bp) |
|
Forward |
GCCAACACAGTGCTGTCT | 18 |
|
Reverse |
AGGAGCAATGATCTTGATCTT | 21 |
|
Probe |
FAM-ATCTCCTTCTGCATCCTGTC-TAMRA | 20 |
R=(Etarget)ΔCP
target(control-sample)/(Ereference)ΔCP
ref(control-sample)
Where E represents the corresponding real-time PCR
efficiency of one cycle in the exponential phase which was
calculated according to the equation E=10[-1/slope]; CP is defined
as the point at which the fluorescence rises appreciably above the
background fluorescence; Etarget is the qPCR
efficiency of the target gene transcript;
Ereference is the qPCR efficiency of the
reference gene transcript; ΔCPtarget is the
CP deviation of the control-sample of the target gene transcript;
and ΔCPreference is the CP deviation of
control-sample of the reference gene transcript.
Statistical analysis
Statistical analysis was performed using SPSS
version 14.0 software (SPSS, Inc.). The χ2 test and
Fisher's exact test were used to assess the associations between
categorical tumor variables, as appropriate. Spearman's rank
correlation was used to test the associations between continuous
variables. Gene expression in GC and normal tissues was analyzed
using the Relative Expression Software Tool (REST, version 2009)
(31). RT-qPCR experiments for each
sample were repeated at least twice. The data were presented as
mean ± standard deviation. All P-values were two-sided and
P<0.05 was considered to indicate a statistically significant
difference.
Results
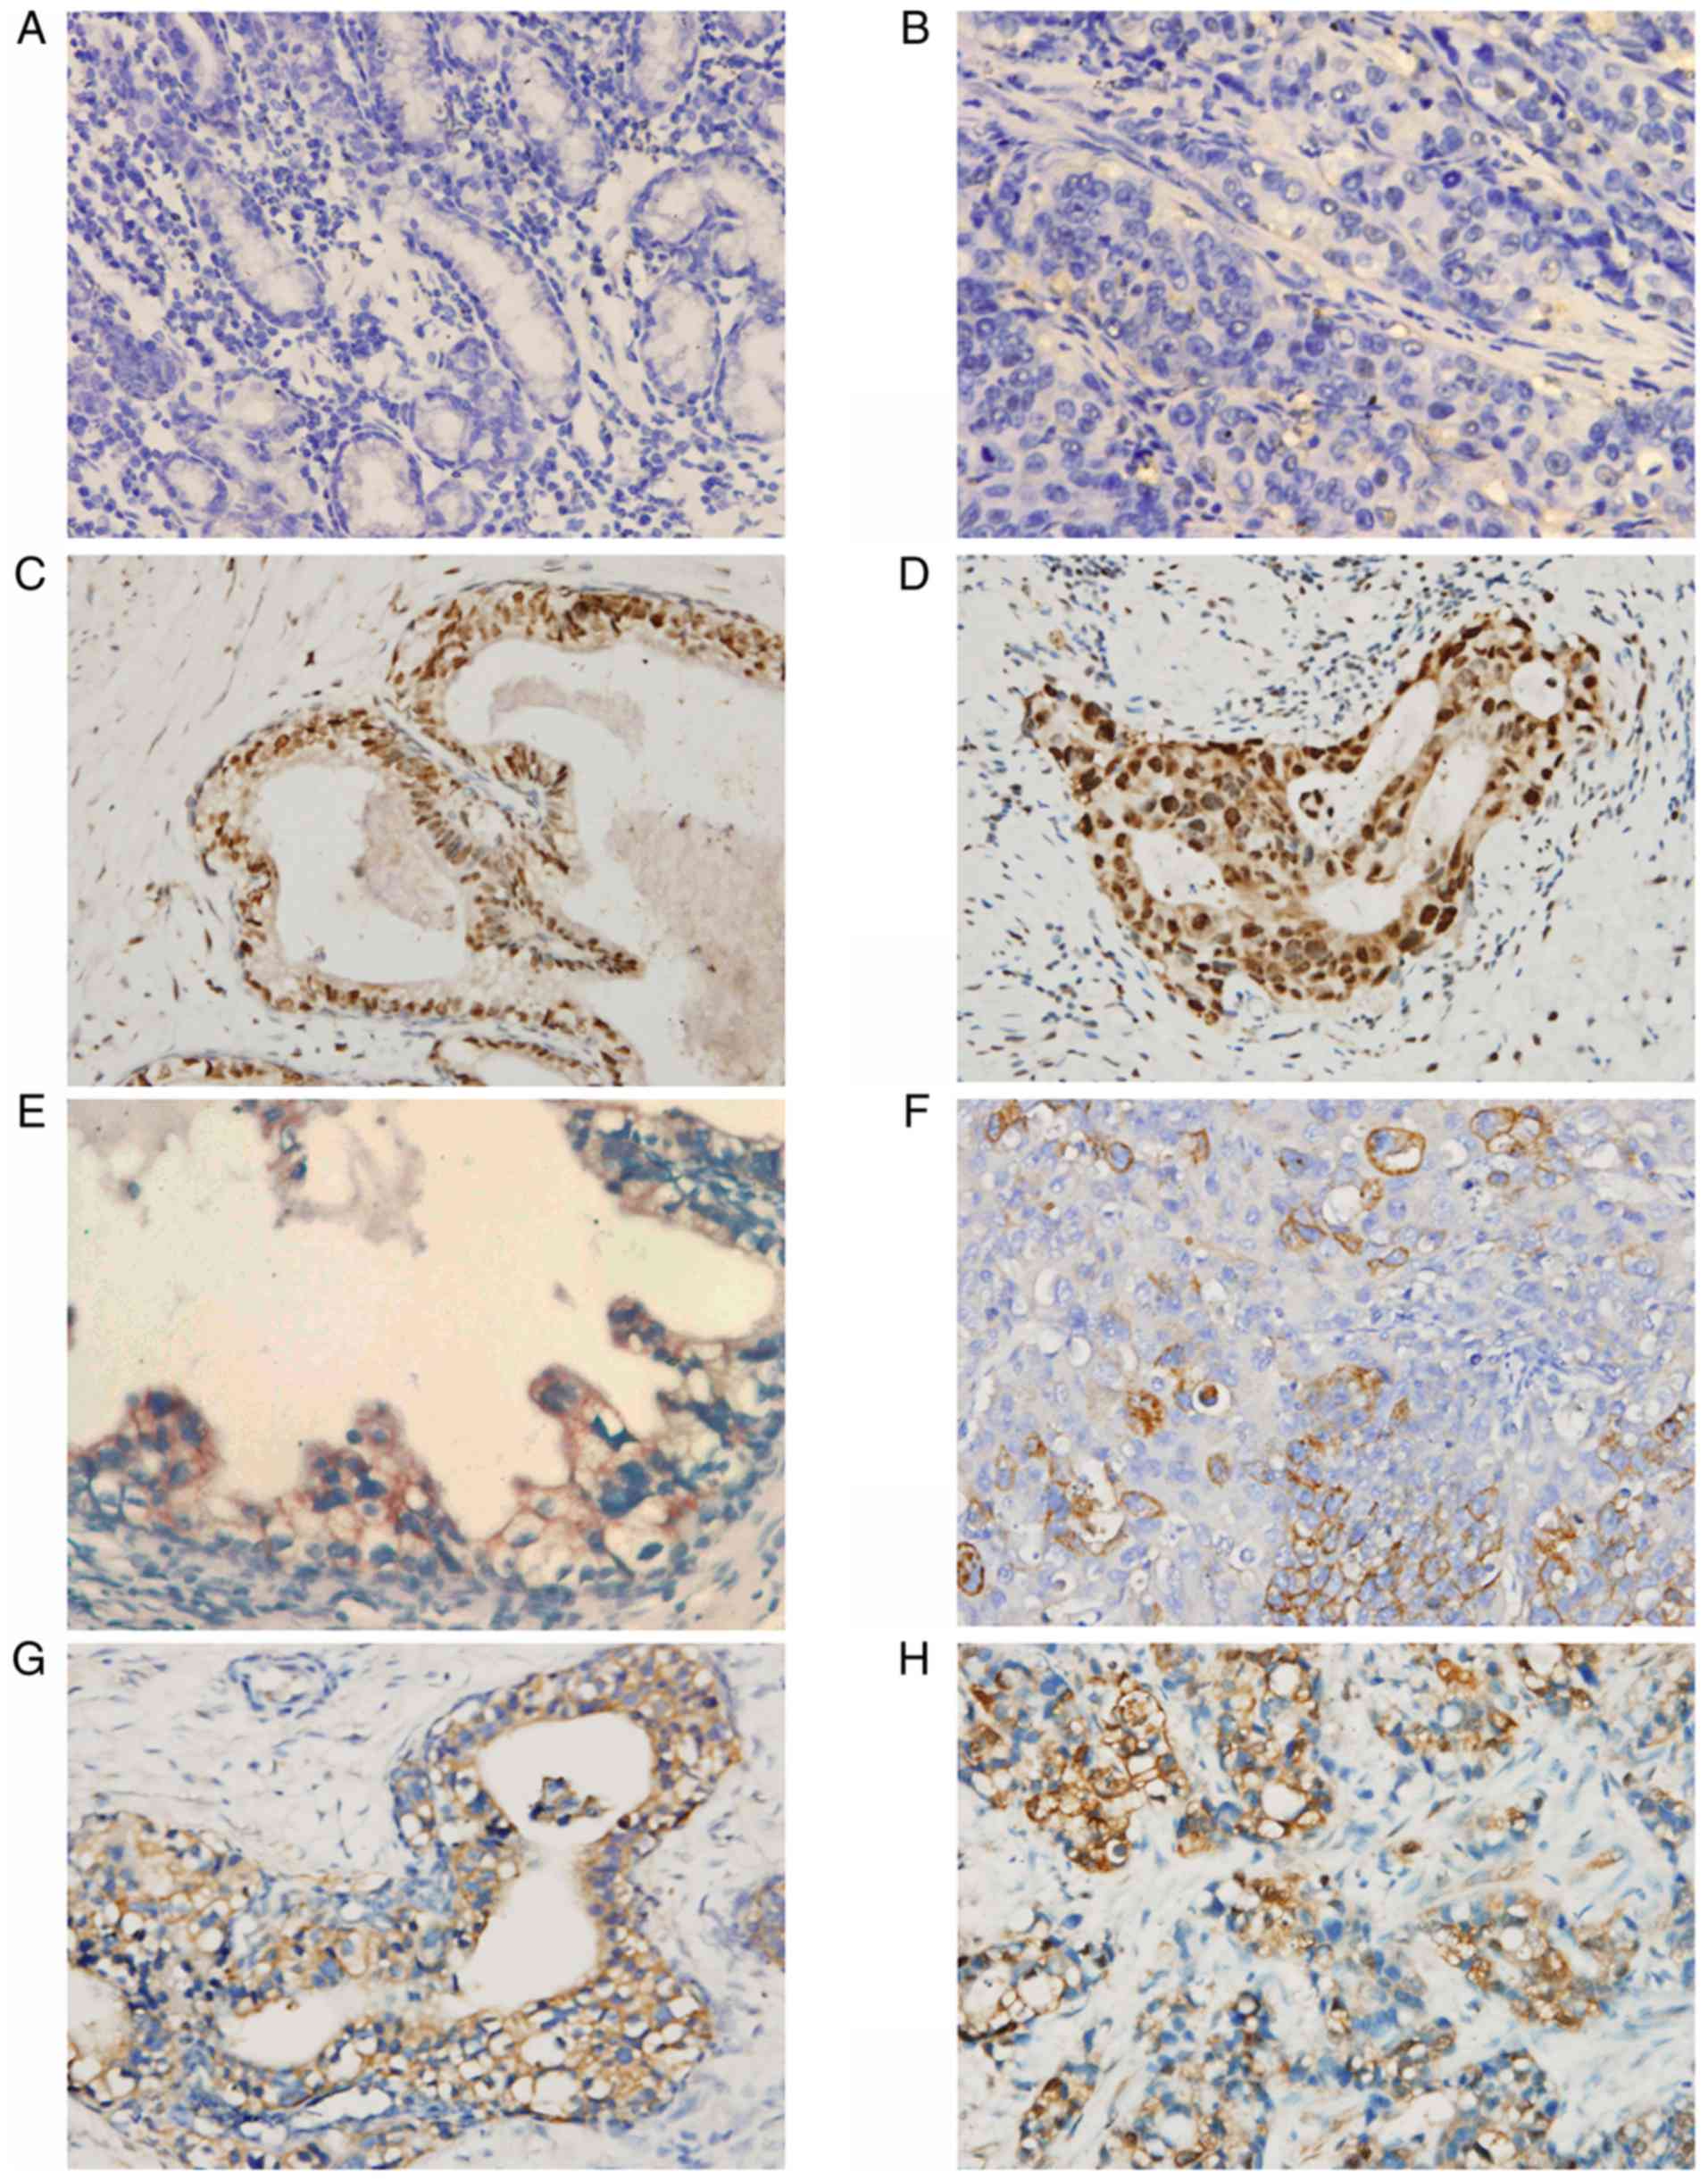
HIF-1α expression in GC
HIF-1α expression was semi-quantitatively examined
using immunohistochemical staining. Generally, the staining was
evident at the edges of the tumor invasion and necrotic areas,
whereas the staining in the normal gastric mucosa was negative
(Fig. 1A-D). The staining was
primarily nucleoplasmic and partly cytoplasmic, and the extent of
staining also varied appreciably among sections. Tumors with scores
of 0–1 were considered to have negative reactivity, while tumors
with scores of 2–3 were considered to exhibit HIF-1α reactivity. A
total of 56/85 cancerous tissues (65.88%) exhibited HIF-1α positive
reactivity using these criteria (Table
III), indicating that HIF-1α expression was significantly
associated with tumor invasion (P<0.01), lymph node metastasis
(P<0.05), clinical stage (P<0.01), degree of differentiation
(P<0.01) and distant metastasis (P<0.01), but not with age,
sex, tumor location or tumor size (Table IV).
| Table III.HIF-1α, GLUT1 and LDH-5 expression in
normal stomach and gastric cancer tissues. |
Table III.
HIF-1α, GLUT1 and LDH-5 expression in
normal stomach and gastric cancer tissues.
|
|
| HIF-1α | GLUT1 | LDH-5 |
|---|
|
|
|
|
|
|
|---|
| Specimen | (+) Number, n | (−)
χ2=83.509 | (+) P<0.01 | (−)
χ2=95.138 | (+) P<0.01 | (−)
χ2=105.238 | P<0.01 |
|---|
| Cancerous
tissues | 85 | 56 | 29 | 61 | 24 | 65 | 20 |
| Normal tissues | 85 | 0 | 85 | 0 | 85 | 0 | 85 |
| Table IV.Associations of the expression levels
of HIF-1α, GLUT1 and LDH-5 with clinical and pathological
parameters. |
Table IV.
Associations of the expression levels
of HIF-1α, GLUT1 and LDH-5 with clinical and pathological
parameters.
|
|
| HIF-1α
expression | GLUT1
expression | LDH-5
expression |
|---|
|
|
|
|
|
|
|---|
| Variable | Number, n
(n=85) | + (n=56) | - (n=29) | + (n=61) | - (n=24) | + (n=65) | - (n=20) |
|---|
| Sex |
|
χ2=0.349 | P>0.05 |
χ2=0.692 | P>0.05 |
χ2=0.015 | P>0.05 |
|
Male | 52 | 33 | 19 | 39 | 13 | 40 | 12 |
|
Female | 33 | 23 | 10 | 22 | 11 | 25 | 8 |
| Age (years) |
|
χ2=0.353 | P>0.05 |
χ2=0.006 | P>0.05 |
χ2=0.075 | P>0.05 |
|
<50 | 36 | 25 | 11 | 26 | 10 | 27 | 9 |
|
≥50 | 49 | 31 | 18 | 35 | 14 | 38 | 11 |
| Tumor location |
|
χ2=1.419 | P>0.05 |
χ2=4.361 | P>0.05 |
χ2=1.217 | P>0.05 |
|
Upper | 28 | 19 | 9 | 20 | 8 | 20 | 8 |
|
Middle | 20 | 11 | 9 | 11 | 9 | 17 | 3 |
|
Lower | 37 | 26 | 11 | 30 | 7 | 28 | 9 |
| Tumor diameter
(cm) |
|
χ2=0.967 | P>0.05 |
χ2=6.096 | P<0.05 |
χ2=5.567 | P<0.05 |
|
<3 | 32 | 19 | 13 | 18 | 14 | 20 | 12 |
| ≥3 | 53 | 37 | 16 | 43 | 10 | 45 | 8 |
| Degree of
Differentiation |
|
χ2=11.149 | P<0.01 |
χ2=6.209 | P<0.05 |
χ2=6.272 | P<0.05 |
|
Well | 15 | 5 | 10 | 7 | 8 | 8 | 7 |
|
Moderate | 29 | 18 | 11 | 21 | 8 | 22 | 7 |
|
Poor | 41 | 33 | 8 | 33 | 8 | 35 | 6 |
| Tumor
invasiona |
|
χ2=10.040 | P<0.01 |
χ2=8.918 | P<0.01 |
χ2=10.345 | P<0.01 |
|
T1+T2 | 23 | 9 | 14 | 11 | 12 | 12 | 11 |
|
T3+T4 | 62 | 47 | 15 | 50 | 12 | 53 | 9 |
| Lymph node
metastasisa |
|
χ2=4.204 | P<0.05 |
χ2=1.933 | P>0.05 |
χ2=1.091 | P>0.05 |
| N0 | 26 | 13 | 13 | 16 | 10 | 18 | 8 |
|
N1+N2+N3 | 59 | 43 | 16 | 45 | 14 | 47 | 12 |
| Distant
metastasisa |
|
χ2=7.505 | P<0.01 |
χ2=4.819 | P<0.05 |
χ2=4.162 | P<0.05 |
|
M0 | 64 | 37 | 27 | 42 | 22 | 45 | 19 |
|
M1 | 21 | 19 | 2 | 19 | 2 | 20 | 1 |
| Clinical
stagea |
|
χ2=8.725 | P<0.01 |
χ2=7.818 | P<0.01 |
χ2=9.246 | P<0.01 |
|
I+II | 24 | 10 | 14 | 12 | 12 | 13 | 11 |
|
III+IV | 61 | 46 | 15 | 49 | 12 | 52 | 9 |
GLUT1 expression in GC
The majority of cancerous cells exhibited distinct
membrane staining for GLUT1, while cytoplasmic staining was
occasionally observed (Fig. 1E and
F). Normal gastric mucosa exhibited non-staining with
anti-GLUT1. Tumors with scores 0–1 were considered to exhibit
negative reactivity, while tumors with scores 2–3 were considered
to exhibit GLUT1 reactivity. The results demonstrated that 61/85
cancerous tissues (71.76%) were GLUT1-positive (Table III). The protein expression levels
of GLUT1 were clearly associated with tumor size (P<0.05), depth
of invasion (P<0.01), distant metastasis (P<0.05), clinical
stage (P<0.01) and differentiation (P<0.05), but not with
age, sex, tumor location or nodal metastasis (Table IV).
LDH-5 expression in GC
Cytoplasmic expression of LDH-5 was strong and
universal, while nucleoplasmic staining was an infrequent
observation. In addition, nucleoplasmic expression was always
accompanied by strong staining in the cytoplasm. The paracancerous
tissues were occasionally weakly positive (Fig. 1G and H). There was no staining in the
normal tissues. Tumors with scores of 0–1 were designated as having
negative LDH-5 reactivity, and tumors with scores of 2–3 were
considered to exhibit positive reactivity. A total of 65/85
cancerous tissues (76.47%) were LDH-5-positive (Table III). Consistent with GLUT1, the
expression levels of LDH-5 protein were also associated with tumor
size (P<0.05), depth of invasion (P<0.01), distant metastasis
(P<0.05), clinical stage (P<0.01) and differentiation
(P<0.05), but not with age, sex, tumor location or nodal
metastasis (Table IV).
Correlation of HIF-1α expression to
GLUT1 and LDH-5
Details of the correlations among HIF-1α expression
and GLUT1 and LDH-5 are presented in Table V. Out of 61 cancerous tissues with
GLUT1 expression, 45 cancerous tissues (73.77%) exhibited HIF-1α
expression, while 11/24 cancerous tissues (45.83%) with negative
expression of GLUT1 exhibited HIF-1α expression (P<0.05).
Correlation analysis of GLUT1 expression with HIF-1α expression
revealed a significant association (P<0.01, r=0.697).
Additionally, the expression of LDH-5 in the tumor tissues was
observed in 47/65 cancerous tissues (72.31%) exhibiting HIF-1α
expression, whereas 9/20 cancerous tissues (45.00%) with no
expression of GLUT1 exhibited HIF-1α expression (P<0.05).
Therefore, LDH-5 expression was significantly correlated with
HIF-1α expression (P<0.01, r=0.783).
| Table V.Correlations of HIF-1α expression
with expression levels of GLUT1 and LDH-5 in gastric cancer. |
Table V.
Correlations of HIF-1α expression
with expression levels of GLUT1 and LDH-5 in gastric cancer.
|
|
| HIF-1α | χ2
test | Spearman's rank
correlation |
|---|
|
|
|
|
|
|
|---|
| Marker | Number, n n=85 | + (n=56) | - (n=29) | Positive ratio
(%) | χ2 | P-value | r | P-value |
|---|
| GLUT1 (+) | 61 | 45 | 16 | 73.77 | 5.981 | P<0.05 | 0.697 | P<0.01 |
| GLUT1 (−) | 24 | 11 | 13 | 45.83 |
|
|
|
|
| LDH-5 (+) | 65 | 47 | 18 | 72.31 | 5.074 | P<0.05 | 0.783 | P<0.01 |
| LDH-5 (−) | 20 | 9 | 11 | 45.00 |
|
|
|
|
HIF-1α, GLUT1 and LDH-M gene
expression in GC
RT-qPCR analysis was performed for the determination
of mRNA expression levels of HIF-1α, GLUT1 and LDH-M in cancerous
and noncancerous tissues, with β-actin as a reference. As a
standard practice, R of target genes was expressed as levels in
samples compared with those in controls and normalized to the
reference gene. R values >1 represented upregulated expression
of the target genes. Upregulated expression of HIF-1α, GLUT1 and
LDH-M transcripts was confirmed in 72.94 (62/85), 78.82 (67/85) and
81.18% (69/85) of cancerous tissue samples, respectively. The
statistical significance of the differences in mRNA expression
levels was analyzed using REST. mRNA expression levels of HIF-1α,
GLUT1 and LDH-M in GC were significantly higher compared with those
in normal gastric tissues, with P-values of 0.003, 0.014 and 0.008,
respectively.
The expression levels of HIF-1α, GLUT1 and LDH-M
transcripts with respect to relevant clinical and pathological
parameters in patients with GC are presented in Table VI. Consistent with the protein
expression data, the mRNA expression levels of HIF-1α were
significantly associated with depth of invasion, nodal metastasis,
clinical stage, differentiation and distant metastasis, and not
with age, sex, tumor location or tumor size. GLUT1 mRNA expression
was associated with tumor size, depth of invasion, distant
metastasis, clinical stage and differentiation, but not with age,
gender, tumor location or nodal metastasis, which was consistent
with the protein expression pattern of GLUT1. The same trends were
observed for the mRNA expression levels of LDH-M.
| Table VI.Associations of the gene expression
levels of HIF-1α, GLUT1 and LDH-5 with clinical and pathological
parameters. |
Table VI.
Associations of the gene expression
levels of HIF-1α, GLUT1 and LDH-5 with clinical and pathological
parameters.
|
|
| HIF-1α mRNA | GLUT1 mRNA | LDH-5 mRNA |
|---|
|
|
|
|
|
|
|---|
| Variable | Number, n
(n=85) | R>1 (n=62) | R≤1 (n=23) | R>1 (n=67) | R≤1 (n=18) | R>1 (n=69) | R≤1 (n=16) |
|---|
| Sex |
|
χ2=0.217 | P>0.05 |
χ2=0.304 | P>0.05 |
χ2=0.201 | P>0.05 |
|
Male | 52 | 37 | 15 | 42 | 10 | 43 | 9 |
|
Female | 33 | 25 | 8 | 25 | 8 | 26 | 7 |
| Age (years) |
|
χ2=0.134 | P>0.05 |
χ2=0.547 | P>0.05 |
χ2=0.016 | P>0.05 |
|
<50 | 36 | 27 | 9 | 27 | 9 | 29 | 7 |
|
≥50 | 49 | 35 | 14 | 40 | 9 | 40 | 9 |
| Tumor location |
|
χ2=2.311 | P>0.05 |
χ2=3.592 | P>0.05 |
χ2=1.718 | P>0.05 |
|
Upper | 28 | 21 | 7 | 22 | 6 | 21 | 7 |
|
Middle | 20 | 12 | 8 | 13 | 7 | 18 | 2 |
|
Lower | 37 | 29 | 8 | 32 | 5 | 30 | 7 |
| Tumor diameter
(cm) |
|
χ2=0.030 | P>0.05 |
χ2=8.192 | P<0.01 |
χ2=5.186 | P<0.05 |
|
<3 | 32 | 23 | 9 | 20 | 12 | 22 | 10 |
| ≥3 | 53 | 39 | 14 | 47 | 6 | 47 | 6 |
| Degree of
differentiation |
|
χ2=8.686 | P<0.05 |
χ2=7.824 | P<0.05 |
χ2=6.674 | P<0.05 |
|
Well | 15 | 7 | 8 | 8 | 7 | 9 | 6 |
|
Moderate | 29 | 20 | 9 | 23 | 6 | 23 | 6 |
|
Poor | 41 | 35 | 6 | 36 | 5 | 37 | 4 |
| Tumor
invasiona |
|
χ2=4.307 | P<0.05 |
χ2=4.704 | P<0.05 |
χ2=6.785 | P<0.01 |
|
T1+T2 | 23 | 13 | 10 | 14 | 9 | 14 | 9 |
|
T3+T4 | 62 | 49 | 13 | 53 | 9 | 55 | 7 |
| Lymph node
metastasisa |
|
χ2=4.41 | P<0.05 |
χ2=2.065 | P>0.05 |
χ2=0.935 | P>0.05 |
|
N0 | 26 | 15 | 11 | 18 | 8 | 19 | 7 |
|
N1+N2+N3 | 59 | 47 | 12 | 49 | 10 | 50 | 9 |
| Distant
metastasisa |
|
χ2=7.025 | P<0.01 |
χ2=5.903 | P<0.05 |
χ2=4.935 | P<0.05 |
|
M0 | 64 | 42 | 22 | 46 | 18 | 48 | 16 |
|
M1 | 21 | 20 | 1 | 21 | 0 | 21 | 0 |
| Clinical
stagea |
|
χ2=5.972 | P<0.05 |
χ2=8.412 | P<0.01 |
χ2=6.626 | P<0.05 |
|
I+II | 24 | 13 | 11 | 14 | 10 | 15 | 9 |
|
III+IV | 61 | 49 | 12 | 53 | 8 | 54 | 7 |
Correlations of individual protein and
mRNA expression levels
The present study compared the protein expression
levels of HIF-1α, GLUT1 and LDH-5 with their associated mRNA
expression levels in 85 GC samples (Table VII). The Spearman correlation
coefficients of HIF-1α, GLUT1 and LDH-5 and their associated mRNAs
were 0.648, 0.664 and 0.713, respectively, indicating statistically
significant correlations among the expression levels of proteins
and mRNAs (P<0.01).
| Table VII.Correlations of protein expression
levels with mRNA expression in gastric cancer (n=85). |
Table VII.
Correlations of protein expression
levels with mRNA expression in gastric cancer (n=85).
|
| Protein | Gene | Spearman's rank
correlation |
|---|
|
|
|
|
|
|---|
| Protein/Gene
name | Positive | Negative | R>1 | R≤1 | r | P-value |
|---|
| HIF-1α | 56 | 29 | 62 | 23 | 0.648 | <0.01 |
| GLUT1 | 61 | 24 | 67 | 18 | 0.664 | <0.01 |
| LDH-5/LDH-M | 65 | 20 | 69 | 16 | 0.713 | <0.01 |
Correlation of HIF-1α gene expression
with GLUT1 and LDH-M gene expression levels
The R values of HIF-1α, GLUT1 and LDH-M gene
expression and the results of the statistical analysis are
summarized in Table VIII. Out of
67 cancerous tissues with GLUT1 gene upregulation, 54 cancerous
tissues (80.60%) exhibited HIF-1α gene upregulation, while 8/18
cancerous tissues (44.44%) with downregulated expression of GLUT1
exhibited HIF-1α gene upregulation (P<0.01). A significant
correlation was observed between GLUT1 and HIF-1α mRNA expression
levels (P<0.01, r=0.765). In addition, upregulated expression
levels of the LDH-M gene in the tumor tissues were observed in
56/69 cancerous tissues (81.16%) exhibiting HIF-1α gene
upregulation, whereas 6/16 cancerous tissues (37.50%) with
downregulated expression of LDH-M exhibited upregulated expression
of HIF-1α (P<0.05). Correlation analysis of LDH-M with HIF-1α
mRNA expression levels revealed a significant association
(P<0.01, r=0.892).
| Table VIII.Correlations of HIF-1α mRNA
expression with GLUT1 and LDH-M mRNA expression in gastric
cancer. |
Table VIII.
Correlations of HIF-1α mRNA
expression with GLUT1 and LDH-M mRNA expression in gastric
cancer.
|
|
| HIF-1α mRNA |
| χ2
test | Spearman's rank
correlation |
|---|
|
|
|
|
|
|
|
|---|
| Marker | Number, n
(n=85) | R>1(n=62) | R≤1 (n=23) | Upregulation ratio,
% | χ2 | P-value | r | P-value |
|---|
| GLUT1 R>1 | 67 | 54 | 13 | 80.60 | 7.653 | <0.01 | 0.765 | <0.01 |
| GLUT1 R≤1 | 18 | 8 | 10 | 44.44 |
|
|
|
|
| LDH-M R>1 | 69 | 56 | 13 | 81.16 | 10.43 | <0.01 | 0.892 | <0.01 |
| LDH-M R≤1 | 16 | 6 | 10 | 37.50 |
|
|
|
|
Discussion
Associations among HIF expression and tumor
properties have become a topic of interest in oncology research
(6,32). Notably, a trend between rapid tumor
proliferation and metastasis and positive HIF-1α expression in
cancer cells has been identified (33). Additionally, certain studies have
demonstrated that HIF-1α may be a predictive marker of a high
recurrence risk in patients with Dukes B colorectal cancer, as
high-level expression of HIF-1α is strongly associated with
invasive subtypes (21,34,35).
Furthermore, elevated expression levels of HIF-1α are considered to
be a response of tumor cells to hypoxia, and may be one of the
factors that induce glycolysis during hypoxia (36).
In the present study, high protein expression levels
of HIF-1α in GC samples with a positive ratio of 65.88% were
revealed by immunohistochemical staining. The staining was marked
at the edge of the tumor invasion and necrotic areas, particularly
with larger or deeply invasive tumors, far from interstitial blood
vessels with poor oxygen supplementation and nutritional intake.
The positively-stained cells were observed in the nucleoplasmic and
cytoplasmic areas, since HIF-1α is synthesized in the cytoplasm and
transferred to the nucleus, followed by binding to HIF-1β for
activation (37). Additionally, Jung
et al (38) demonstrated that
HIF-1α was overexpressed in GC at the protein expression level with
a ratio of 52.3%, but not in normal gastric tissues. Furthermore,
in the present study, the protein expression data were consistent
with the mRNA expression levels of HIF-1α in GC samples. However,
there was no positive response in certain cases. The reason for
this may be that hypoxia-induced apoptosis was increased while
hypoxia-induced adaptation was restricted in patients, reducing the
proliferation of tumor cells. This may also explain the improved
prognosis of patients with negative HIF-1α expression.
HIF-1α is able to upregulate glucose-associated
receptors, including GLUT1, GLUT4 and GLUT8 in the cell membrane,
in addition to the expression of key enzyme genes, in order to
facilitate the intake and metabolism of glucose in tumor cells, and
even to biosynthesize nutrients for the proliferation and
differentiation of tumor cells via the glycolysis pathway (39,40). In
a rapidly growing tumor tissue, the hypoxic cells tend to consume
more glucose to satisfy their energy requirements as a consequence
of enhanced glycolytic flux and accumulation of pyruvate (40). Consistent with the studies by
Kawamura et al (41) and Jung
et al (38), the results of
the present study suggested that GLUT1 is essential for the
tumorigenesis, progression, invasion and metastasis of GC. From the
perspective of glycolytic flux control analysis, it has been
demonstrated that GLUT and key glycolytic enzymes provide the ideal
targeting sites for therapeutic intervention at the level of energy
metabolism in hypoxic and glycolytic tumors (42).
LDH-5 is the most important enzyme for promoting
anaerobic glycolysis via transformation of pyruvate to lactate, and
the upregulation of LDH-5 in cancerous cells guarantees a
predominant glycolytic metabolism that reduces tumor dependence in
the presence of oxygen (25). The
clinical importance of high LDH-5 expression in tumors has
attracted extensive attention and thorough investigation (25,43,44). The
correlation of a high LDH-5 level with aggressive forms of several
different tumor types have been observed (23–25,27).
Notably, HIF-1α upregulates LDH-5 expression favoring enhanced
glycolytic flux (42). Under
hypoxia, lactate, as the end product of anaerobic glycolysis
catalyzed by lactate dehydrogenase enzyme, is released to acidify
the cellular matrix, which may further trigger aggressive behavior.
In accordance with the study of Kolev et al (25), the present study demonstrated that
cytoplasmic expression of LDH-5 was strong and universal, with a
positive ratio of 76.47% (65/85 cases), while nucleoplasmic
staining was an infrequent observation. The results demonstrated
that LDH-M mRNA and LDH-5 protein were specifically upregulated in
GC, indicating the induction of energy metabolism in tumor cells
via the glycolysis pathway, which confers a dominant proliferation
during cancer evolution. At early stages in carcinogenesis, LDH-5
may represent a promising target for cancer treatment.
At present, limited data are available regarding the
linkage of HIF-1α with GLUT-1 and LDH-5 co-expression to
bioenergetic metabolism in GC. In the present study, correlation
analysis of HIF-1α with GLUT1 and LDH-5 protein and gene expression
levels in GC indicated that HIF-1α expression was positively
correlated with the mRNA and protein expression levels of GLUT1 and
LDH-5 (LDH-M). GLUT1 and LDH-M (LDH-5), as downstream target genes,
are upregulated by HIF-1α, increasing the transmembrane transport
of glucose, promoting the conversion of pyruvate to lactate and
enhancing the activity of the LDH isoenzyme (45). The increased glycolysis in
proliferating cells results in high expression levels of a number
of glycolytic enzymes, which serve an important role in the energy
metabolism of tumor cells. HIF-1 upregulates glucose transporters
and glycolysis enzymes in tumors, directing tumors toward anaerobic
glycolysis in hypoxic conditions. Due to genetic mutations in
protein-coding and tumor suppressor genes causing structural
alterations in HIF-1, tumor cells preferentially convert pyruvate
into lactate even under conditions of sufficient oxygen (46). Additionally, the metabolic switch
from oxidative phosphorylation to glycolysis in tumor cells is able
to reduce the formation of oxygen free radicals during the
destruction of DNA to facilitate proliferation. The enhanced
structural regulation of glycolysis and the formation of the acidic
tumor microenvironment serve key roles in invasive tumor growth.
Upregulation of glycolysis leads to microenvironmental acidosis,
requiring tumor cells to evolve phenotypes resistant to
acid-induced cell toxicity. Subsequent cell populations with acid
resistance and upregulated glycolysis have a powerful growth
advantage, promoting unconstrained proliferation and invasion
(47). However, the present study
had several limitations. The use of immunohistochemistry for the
evaluation of protein expression levels is not always sufficient to
reflect protein structure and functionality. Immunofluorescence
staining and other methods should be performed in future studies.
Nonetheless, a strength of the present study was that HIF-1α, GLUT1
and LDH-5 expressions were examined at the protein and gene levels
to examine their correlations.
In conclusion, the results of the present study
provided evidence for a possible key role of the HIF-1α, GLUT1 and
LDH-5 pathway in the occurrence, development, metastasis and poor
prognosis of gastric tumors. These proteins may be used as markers
for the diagnosis and prognosis of GC. HIF-1α, GLUT1 and LDH-5 are
capable of acting as an important reference for the evaluation of
hypoxia in GC prior to and following treatment. Additionally, the
results of the present study suggested that HIF-1α, GLUT1 and LDH-5
may be potential target genes involved in the endogenous tumor
response to hypoxia and the inhibition of tumor energy metabolism,
and thus highlighted novel therapeutic targets for GC.
Acknowledgements
Not applicable.
Funding
The present study was supported by the project
(grant no. 2016M602706) funded by China Postdoctoral Science
Foundation and the International Exchange and Collaboration Project
(grant no. 2018HH0057) funded by Science and Technology Department
of Sichuan Province.
Availability of data and materials
The datasets used and/or analyzed during the current
study are available from the corresponding authors on reasonable
request.
Authors' contributions
LSH, QL, CT and DXZha collected the samples,
recorded the information and conducted the experiments. BW, DXZho
and ZPL analyzed the data. ZXY contributed to the project design
and drafted the manuscript. All authors read and approved the final
manuscript.
Ethics approval and consent to
participate
Human samples used in the present study were
obtained from patients who provided written informed consent. The
present study was approved by the Ethics Committee of West China
Hospital, Sichuan University and was conducted according to The
Declaration of Helsinki.
Patient consent for publication
Consent for publication was obtained from all
patients.
Competing interests
The authors declare that they have no competing
interests.
References
|
1
|
Chen W, Zheng R, Baade PD, Zhang S, Zeng
H, Bray F, Jemal A, Yu XQ and He J: Cancer statistics in China,
2015. CA Cancer J Clin. 66:115–132. 2016. View Article : Google Scholar : PubMed/NCBI
|
|
2
|
Rugge M, Fassan M and Graham DY:
Epidemiology of gastric cancer. Gastric Cancer: Principles and
Practice. Strong VE: Springer International Publishing; Cham: pp.
23–34. 2015, View Article : Google Scholar
|
|
3
|
Xuan Y, Hur H, Ham IH, Yun J, Lee JY, Shim
W, Kim YB, Lee G, Han SU and Cho YK: Dichloroacetate attenuates
hypoxia-induced resistance to 5-fluorouracil in gastric cancer
through the regulation of glucose metabolism. Exp Cell Res.
321:219–230. 2014. View Article : Google Scholar : PubMed/NCBI
|
|
4
|
Lordick F, Allum W, Carneiro F, Mitry E,
Tabernero J, Tan P, Van Cutsem E, van de Velde C and Cervantes A:
Unmet needs and challenges in gastric cancer: The way forward.
Cancer Treat Rev. 40:692–700. 2014. View Article : Google Scholar : PubMed/NCBI
|
|
5
|
Muz B, de la Puente P, Azab F and Azab AK:
The role of hypoxia in cancer progression, angiogenesis,
metastasis, and resistance to therapy. Hypoxia (Auckl). 3:83–92.
2015. View Article : Google Scholar : PubMed/NCBI
|
|
6
|
Zeng W, Liu P, Pan W, Singh SR and Wei Y:
Hypoxia and hypoxia inducible factors in tumor metabolism. Cancer
Lett. 356:263–267. 2015. View Article : Google Scholar : PubMed/NCBI
|
|
7
|
Semenza GL: HIF-1: Upstream and downstream
of cancer metabolism. Curr Opin Genet Dev. 20:51–56. 2010.
View Article : Google Scholar : PubMed/NCBI
|
|
8
|
Esfandiary A, Taherian-Esfahani Z,
Abedin-Do A, Mirfakhraie R, Shirzad M, Ghafouri-Fard S and
Motevaseli E: Lactobacilli modulate hypoxia-inducible factor
(HIF)-1 regulatory pathway in triple negative breast cancer cell
line. Cell J. 18:237–244. 2016.PubMed/NCBI
|
|
9
|
Koyasu S, Kobayashi M, Goto Y, Hiraoka M
and Harada H: Regulatory mechanisms of hypoxia-inducible factor 1
activity: Two decades of knowledge. Cancer Sci. 109:560–571. 2018.
View Article : Google Scholar : PubMed/NCBI
|
|
10
|
Li M, Wang YX, Luo Y, Zhao J, Li Q, Zhang
J and Jiang Y: Hypoxia inducible factor-1α-dependent epithelial to
mesenchymal transition under hypoxic conditions in prostate cancer
cells. Oncol Rep. 36:521–527. 2016. View Article : Google Scholar : PubMed/NCBI
|
|
11
|
Isobe T, Aoyagi K, Koufuji K, Shirouzu K,
Kawahara A, Taira T and Kage M: Clinicopathological significance of
hypoxia-inducible factor-1 alpha (HIF-1α) expression in gastric
cancer. Int J Clin Oncol. 18:293–304. 2013. View Article : Google Scholar : PubMed/NCBI
|
|
12
|
Qian J, Hao B, Gao Z, Dong YU, Pei J, Ma M
and Han B: Downregulation of HIF-1α inhibits the proliferation and
invasion of non-small cell lung cancer NCI-H157 cells. Oncol Lett.
11:1738–1744. 2016. View Article : Google Scholar : PubMed/NCBI
|
|
13
|
Liu L, Ning X, Sun L, Zhang H, Shi Y, Guo
C, Han S, Liu J, Sun S, Han Z, et al: Hypoxia-inducible factor-1
alpha contributes to hypoxia-induced chemoresistance in gastric
cancer. Cancer Sci. 99:121–128. 2008.PubMed/NCBI
|
|
14
|
Wang J, Ni Z, Duan Z, Wang G and Li F:
Altered expression of hypoxia-inducible factor-1α (HIF-1α) and its
regulatory genes in gastric cancer tissues. PLoS One. 9:e998352014.
View Article : Google Scholar : PubMed/NCBI
|
|
15
|
Chen J, Li T, Liu Q, Jiao H, Yang W, Liu X
and Huo Z: Clinical and prognostic significance of HIF-1α, PTEN,
CD44v6, and survivin for gastric cancer: A meta-analysis. PLoS One.
9:e918422014. View Article : Google Scholar : PubMed/NCBI
|
|
16
|
Zhu CL, Huang Q, Liu CH, Lin XS and Xie F:
Prognostic value of HIF-1α expression in patients with gastric
cancer. Mol Biol Rep. 40:6055–6062. 2013. View Article : Google Scholar : PubMed/NCBI
|
|
17
|
Liu X, Wang X, Zhang J, Lam EK, Shin VY,
Cheng AS, Yu J, Chan FK, Sung JJ and Jin HC: Warburg effect
revisited: An epigenetic link between glycolysis and gastric
carcinogenesis. Oncogene. 29:442–450. 2010. View Article : Google Scholar : PubMed/NCBI
|
|
18
|
Szablewski L: Expression of glucose
transporters in cancers. Biochim Biophys Acta. 1835:164–169.
2013.PubMed/NCBI
|
|
19
|
Fan R, Hou WJ, Zhao YJ, Liu SL, Qiu XS,
Wang EH and Wu GP: Overexpression of HPV16 E6/E7 mediated HIF-1α
upregulation of GLUT1 expression in lung cancer cells. Tumor Biol.
37:4655–4663. 2016. View Article : Google Scholar
|
|
20
|
Masoud GN and Li W: HIF-1α pathway: Role,
regulation and intervention for cancer therapy. Acta Pharm Sin B.
5:378–389. 2015. View Article : Google Scholar : PubMed/NCBI
|
|
21
|
Rajaganeshan R, Prasad R, Guillou PJ,
Poston G, Scott N and Jayne DG: The role of hypoxia in recurrence
following resection of Dukes' B colorectal cancer. Int J Colorectal
Dis. 23:1049–1055. 2008. View Article : Google Scholar : PubMed/NCBI
|
|
22
|
Oh S, Kim H, Nam K and Shin I: Glut1
promotes cell proliferation, migration and invasion by regulating
epidermal growth factor receptor and integrin signaling in
triple-negative breast cancer cells. BMB Rep. 50:132–137. 2017.
View Article : Google Scholar : PubMed/NCBI
|
|
23
|
Kayser G, Kassem A, Sienel W,
Schulte-Uentrop L, Mattern D, Aumann K, Stickeler E, Werner M,
Passlick B and zur Hausen A: Lactate-dehydrogenase 5 is
overexpressed in non-small cell lung cancer and correlates with the
expression of the transketolase-like protein 1. Diagn Pathol.
5:222010. View Article : Google Scholar : PubMed/NCBI
|
|
24
|
Kim HS, Lee HE, Yang HK and Kim WH: High
lactate dehydrogenase 5 expression correlates with high tumoral and
stromal vascular endothelial growth factor expression in gastric
cancer. Pathobiology. 81:78–85. 2014. View Article : Google Scholar : PubMed/NCBI
|
|
25
|
Kolev Y, Uetake H, Takagi Y and Sugihara
K: Lactate dehydrogenase-5 (LDH-5) expression in human gastric
cancer: association with hypoxia-inducible factor (HIF-1alpha)
pathway, angiogenic factors production and poor prognosis. Ann Surg
Oncol. 15:2336–2344. 2008. View Article : Google Scholar : PubMed/NCBI
|
|
26
|
Brierley JD, Gospodarowicz MK and
Wittekind C: TNM classification of malignant tumours. 8th. John
Wiley & Sons, Published in affiliation with the Union for
International Cancer Control (UICC); 2016
|
|
27
|
Guan G, Zhang Y, Lu Y, Liu L, Shi D, Wen
Y, Yang L, Ma Q, Liu T, Zhu X, et al: The HIF-1α/CXCR4 pathway
supports hypoxia-induced metastasis of human osteosarcoma cells.
Cancer Lett. 357:254–264. 2015. View Article : Google Scholar : PubMed/NCBI
|
|
28
|
Yasuda M, Miyazawa M, Fujita M, Kajiwara
H, Iida T, Hirasawa T, Muramatsu T, Murakami M, Mikami M, Saitoh K,
et al: Expression of hypoxia inducible factor-1alpha (HIF-1alpha)
and glucose transporter-1 (GLUT-1) in ovarian adenocarcinomas:
Difference in hypoxic status depending on histological character.
Oncol Rep. 19:111–116. 2008.PubMed/NCBI
|
|
29
|
Koukourakis MI, Giatromanolaki A and
Sivridis E; Tumour; Angiogenesis Research Group, : Lactate
dehydrogenase isoenzymes 1 and 5: Differential expression by
neoplastic and stromal cells in non-small cell lung cancer and
other epithelial malignant tumors. Tumour Biol. 24:199–202. 2003.
View Article : Google Scholar : PubMed/NCBI
|
|
30
|
Pfaffl MW: A new mathematical model for
relative quantification in real-time RT-PCR. Nucleic Acids Res.
29:e452001. View Article : Google Scholar : PubMed/NCBI
|
|
31
|
Pfaffl MW, Horgan GW and Dempfle L:
Relative expression software tool (REST) for group-wise comparison
and statistical analysis of relative expression results in
real-time PCR. Nucleic Acids Res. 30:e362002. View Article : Google Scholar : PubMed/NCBI
|
|
32
|
Kitajima Y and Miyazaki K: The critical
impact of hif-1a on gastric cancer biology. Cancers (Basel).
5:15–26. 2013. View Article : Google Scholar : PubMed/NCBI
|
|
33
|
Semenza GL: Defining the role of
hypoxia-inducible factor 1 in cancer biology and therapeutics.
Oncogene. 29:625–634. 2010. View Article : Google Scholar : PubMed/NCBI
|
|
34
|
Schmitz KJ, Müller CI, Reis H, Alakus H,
Winde G, Baba HA, Wohlschlaeger J, Jasani B, Fandrey J and Schmid
KW: Combined analysis of hypoxia-inducible factor 1 alpha and
metallothionein indicates an aggressive subtype of colorectal
carcinoma. Int J Colorectal Dis. 24:1287–1296. 2009. View Article : Google Scholar : PubMed/NCBI
|
|
35
|
Cleven AH, van Engeland M, Wouters BG and
de Bruïne AP: Stromal expression of hypoxia regulated proteins is
an adverse prognostic factor in colorectal carcinomas. Cell Oncol.
29:229–240. 2007.PubMed/NCBI
|
|
36
|
Hanahan D and Weinberg RA: Hallmarks of
cancer: The next generation. Cell. 144:646–674. 2011. View Article : Google Scholar : PubMed/NCBI
|
|
37
|
Lee K, Zhang H, Qian DZ, Rey S, Liu JO and
Semenza GL: Acriflavine inhibits HIF-1 dimerization, tumor growth,
and vascularization. Proc Natl Acad Sci USA. 106:17910–17915. 2009.
View Article : Google Scholar : PubMed/NCBI
|
|
38
|
Jung JH, Im S, Jung ES and Kang CS:
Clinicopathological implications of the expression of
hypoxia-related proteins in gastric cancer. Int J Med Sci.
10:1217–1223. 2013. View Article : Google Scholar : PubMed/NCBI
|
|
39
|
Baumann MU, Zamudio S and Illsley NP:
Hypoxic upregulation of glucose transporters in BeWo
choriocarcinoma cells is mediated by hypoxia-inducible factor-1. Am
J Physiol Cell Physiol. 293:C477–C485. 2007. View Article : Google Scholar : PubMed/NCBI
|
|
40
|
Courtnay R, Ngo DC, Malik N, Ververis K,
Tortorella SM and Karagiannis TC: Cancer metabolism and the Warburg
effect: The role of HIF-1 and PI3K. Mol Biol Rep. 42:841–851. 2015.
View Article : Google Scholar : PubMed/NCBI
|
|
41
|
Kawamura T, Kusakabe T, Sugino T, Watanabe
K, Fukuda T, Nashimoto A, Honma K and Suzuki T: Expression of
glucose transporter-1 in human gastric carcinoma: Association with
tumor aggressiveness, metastasis, and patient survival. Cancer.
92:634–641. 2001. View Article : Google Scholar : PubMed/NCBI
|
|
42
|
Marín-Hernández A, Gallardo-Pérez J, Ralph
SJ, Rodríguez-Enríquez S and Moreno-Sánchez R: HIF-1alpha modulates
energy metabolism in cancer cells by inducing over-expression of
specific glycolytic isoforms. Mini Rev Med Chem. 9:1084–1101. 2009.
View Article : Google Scholar : PubMed/NCBI
|
|
43
|
Danner BC, Didilis VN, Wiemeyer S,
Stojanovic T, Kitz J, Emmert A, Füzesi L and Schöndube FA:
Long-term survival is linked to serum LDH and partly to tumour
LDH-5 in NSCLC. Anticancer Res. 30:1347–1351. 2010.PubMed/NCBI
|
|
44
|
Augoff K, Hryniewicz-Jankowska A and
Tabola R: Lactate dehydrogenase 5: An old friend and a new hope in
the war on cancer. Cancer Lett. 358:1–7. 2015. View Article : Google Scholar : PubMed/NCBI
|
|
45
|
Sevinc A, Sari R and Fadillioglu E: The
utility of lactate dehydrogenase isoenzyme pattern in the
diagnostic evaluation of malignant and nonmalignant ascites. J Natl
Med Assoc. 97:79–84. 2005.PubMed/NCBI
|
|
46
|
Li XB, Gu JD and Zhou QH: Review of
aerobic glycolysis and its key enzymes-new targets for lung cancer
therapy. Thorac Cancer. 6:17–24. 2015. View Article : Google Scholar : PubMed/NCBI
|
|
47
|
Gillies RJ and Gatenby RA: Adaptive
landscapes and emergent phenotypes: Why do cancers have high
glycolysis? J Bioenerg Biomembr. 39:251–257. 2007. View Article : Google Scholar : PubMed/NCBI
|