Introduction
The extensive use of whole breast radiotherapy has
rendered it a standard treatment for patients with early breast
cancer undergoing breast-conserving surgery (1–4).
Previous advancements of individualised treatment for breast cancer
have facilitated the gradual application of whole breast
radiotherapy to neoadjuvant radiotherapy (5,6) and
palliative radiotherapy (7,8), which have enhanced opportunities for
surgical intervention, and improved the survival time and quality
of life of patients with breast cancer.
At present, radiotherapy techniques for breast
cancer are typically based on three-dimensional computerised
tomography (3D-CT) simulation. However, the 3D-CT plan overlooks
the target volume and radiotherapy dosage bias induced by breathing
movements. Reportedly, 3D-CT images depend on different respiration
phases when the CT scan starts (9).
Previous studies have established that the accuracy and efficiency
of radiotherapy in the chest and abdomen can easily be reduced by
motions of tumours and organs at risk (OAR) (10,11). To
overcome these problems, a novel technological innovation,
four-dimensional (4D)-CT radiotherapy technique, has emerged.
Compared with conventional scanning, more accurate images of
tumours and normal organs can be acquired by the 4D-CT process
(11). At present, 4D-CT
radiotherapy has been extensively applied in the treatment of lung
cancer, liver cancer, oesophageal cancer, gastric cancer and kidney
cancer; however, it has rarely been applied for breast cancer
(11–19). For 4D-CT simulation, a breathing
cycle is evenly divided into ten respiration phases and ten sets of
CT images are acquired, respectively (10,11).
Typically, the outline of targets and OAR on all ten sets of images
is delineated by radiation oncologists, which increases the
workload compared with 3D-CT radiotherapy (17,20,21). A
number of composite methods have been used to decrease and optimise
the work, including maximal intensity projection (MIP), average
intensity projection (AIP), minimum intensity projection and
two-extreme-phases fusion (21,22).
While MIP and MIP-CT images are acquired by finding the maximum and
minimum CT value along the slices at the same pixel location,
AIP-CT images are acquired by averaging all CT values along the
slices at the same pixel location (22,23). The
two-extreme-phases fusion method involves delineating target
outlines on CT images of the two extreme respiration phases (T00
for the end of inhalation and T50 for the end of exhalation) and
then fusing them (21). Notably,
MIP-CT images are effective for assessing the motion of the organ
but not for determining the tumour boundary near the diaphragm and
chest wall, which can be readily demonstrated by AIP-CT and MIP-CT
images (22). For partial breast
irradiation, previous studies have demonstrated that 4D-CT
radiotherapy improves the target definition and decreases the
radiation dose of OAR (18,19). Furthermore, certain previous studies
have compared different composite methods for lung cancer and liver
cancer (21,23–28);
however, to the best of our knowledge, at present, there is no
study that has been published in English for breast cancer.
Therefore, the present study aimed to compare the
target volumes and the dosimetric difference between the 3D-CT and
4D-CT plans for whole breast radiotherapy to determine the more
effective radiotherapy technique for breast cancer.
Patients and methods
Patients and design
In the present study, seven female patients with
breast cancer with residual breast tissue received whole breast
radiotherapy based on 3D-CT and 4D-CT between March 2016 and April
2017 at The First Affiliated Hospital of Xi'an Jiaotong University
(Xi'an, China). Inclusion criteria: i) Female patients were
digonsed with breast cancer by pathology and and clinical
examination; ii) patients were willing to accept and could tolerate
breast radiotherapy; and iii) patients had no radiotherapeutic
contraindication. Exclusion criteria: i) patients with metastatic
or recurrent breast cancer; and ii) patients who had previously
received chest radiotherapy. Table I
summarises the characteristics of all patients. The present study
was approved by The Ethics Committee of First Affiliated Hospital
of Xi'an Jiaotong University (approval no. 2015-101). Written
informed consent was obtained from all participants.
 | Table I.Characteristics of the patients
(n=7). |
Table I.
Characteristics of the patients
(n=7).
| Characteristic | Median (range) | n |
|---|
| Age, years | 50.57 (39–76) |
|
| Disease stage |
|
|
| Ia |
| 2 |
|
IIa |
| 3 |
|
IIb |
| 1 |
| IV |
| 1 |
| Radiotherapy
location |
|
|
| Right
breast |
| 4 |
| Left
breast |
| 3 |
| Type of
radiotherapy |
|
|
|
Postoperative |
| 4 |
|
Neoadjuvant |
| 2 |
|
Palliative |
| 1 |
| Surgical
treatment |
|
|
|
Yes |
| 5 |
| No |
| 2 |
| Plan target volume,
cm3 | 757.702
(500.37–1,063.08) |
|
CT simulation
All seven patients were fixed in position using
thermoplastic sheets or breast brackets. Subsequently, 3D-CT or
4D-CT scans were received sequentially with free breathing in the
supine position. For each patient, images were obtained using a
Philips Big Bore CT-Simulator (Philips Medical Systems, Inc.,
Bothell, WA, USA) with 5-mm slice thickness and a scan range from
the submentum to the subphrenic, including the heart, bilateral
breasts and bilateral lungs. All CT images were then uploaded and
reconstructed on the Monaco 5.11.01 radiation treatment planning
system (TPS) (ELEKTA Co., Sweden).
In addition, the 4D-CT scan was acquired using the
Cine model and supplemented by the real-time position management
(RPM) system (Philips Co., Holland) during breathing. Notably, the
scan time was >1 respiratory cycle. For each patient, the
respiratory cycle was evenly divided into ten respiration phases by
the RPM system. T00 was defined as the end of inhalation and T50
was defined as the end of exhalation. Furthermore, ten sets of
4D-CT images of the ten respiration phases were acquired, and the
MIP-CT and AIP-CT images of each patient were fused and
reconstructed.
Targets and OAR delineation, and dose
prescription
All acquired CT images were uploaded and rebuilt on
the Monaco 5.11.01 TPS. Clinical doctors delineated the outlines of
target areas and OAR, and medical physicists formulated
radiotherapy plans. In addition, all delineations and the five
types of plans (3D, T00, T50, MIP and AIP) were separately
implemented for each patient by the same skilled doctor and medical
physicist.
Target delineation
The clinical target volume (CTV) consisted of the
whole residual breast tissue. The upper and lower boundaries of the
CTV indicated the edges of breast tissue, the inner boundary
indicated the sternal line, and the outer boundary indicated the
anterior axillary line. The anterior boundary was 5 mm below the
skin surface and the posterior boundary was the ectopectoralis
fascia. In addition, the plan target volume (PTV) was attained by
adding 5-mm isotropic expansion of the CTV and the anterior
boundary was refined 3 mm below the skin surface
simultaneously.
OAR delineation
In the present study, the delineation method of the
contralateral breast (C-B) was similar to the aformentioned method
of the CTV. The heart was delineated from the right atrium and the
right ventricle to the cardiac apex, excluding the pulmonary trunk,
ascending aorta and vena cava. In addition, the right and left
lungs were delineated by the automatic function of the Monaco TPS
and manual modification. Furthermore, the spinal cord and bilateral
humeral heads were delineated on all layers of the CT scans.
Plan evaluation
The present study used a dose volume histogram (DVH)
to evaluate the quality of the radiation plan. For the CTV and PTV,
Dx represents the minimum dose delivered to
x% of the target volume and Vx represents
the volume receiving no less than x% of the prescription
dose (29,30). In addition, Dmin,
Dmax and Dmean of the CTV and
PTV represent the minimum, maximum and mean point dose of the
target volume, respectively.
The conformity index (CI) and the homogeneity index
(HI) of the PTV were automatically evaluated by the Monaco TPS to
assess the PTV coverage rate. The CI indicates the ratio between
the PTV and the irradiated volume at the prescription dose, and the
HI implies the uniformity of the dose distribution in the target
volume (31). The computational
formulas of the CI and HI were as follows:
CI=TV12/TV ×
VR1, where TV1 represents the
volume of the target that received the prescription dose, TV
represents the target volume and VR1 represents the total
volume of the prescription isodose. Notably, values of CI closer to
1.0 represent a better dose conformity of the PTV.
HI=Dmax/Dmin, where
Dmax represents the maximum point dose and
Dmin represents the minimum point dose of the
target volume. Notably, values of HI closer to 1.0 indicate a plan
with less heterogeneity. Definitions of Dx,
Dmin, Dmax and
Dmean for all OAR and Vx for
the C-B are similar to definitions for the target volume. Other
Vx represents the volume receiving no less than
x Gray (Gy) (29,30).
Dose prescription
Intensity-modulated radiotherapy (IMRT) plans were
performed with 6-mV x-ray, and 5–9 coplanar and isocenter radiation
treatment fields for five groups of each patient. Subsequently, a
dose of 50 Gy in 25 fractions of 2 Gy was prescribed to the PTV.
Notably, 95% of the target volume should be included by 95% of the
prescribed dose (4,750 centigray, cGy) and not >5% should be
encompassed by 105% of the prescribed dose (5,250 cGy). In the
present study, the dose limits of OAR were as follows: For the
ipsilateral lungs (I-L), V20<25% and
Dmean<15Gy; for the bilateral lungs,
V20<20%; and for the heart,
V30<10% and V40<5%.
Statistical analysis
The disease stage of patients was evaluated
according to the 7th American Association of Cancer (AJCC) staging
system (32). Dx,
Vx, CI and HI were extracted using the Monaco
system. All data were analysed using SPSS software (version 21.0;
IBM Corp., Armonk, NY, USA) with a randomised block design. The
Shapiro-Wilk test and Levene test were used to evaluate the
normality and homogeneity of data. Data that are normaly
distributed are expressed as mean ± standard deviation and
presented as bar plots; all other data are expressed as median
(interquartile range) and presented as box and whisker plots
(Figs. 1–9). For each evaluation index, analysis of
variance followed by a Least Significant Difference test were used
when data satisfied normal distribution and homoscedasticity.
Otherwise, a Friedman test and pairwise comparison were used.
P<0.05 was considered to indicate a statistically significant
difference.
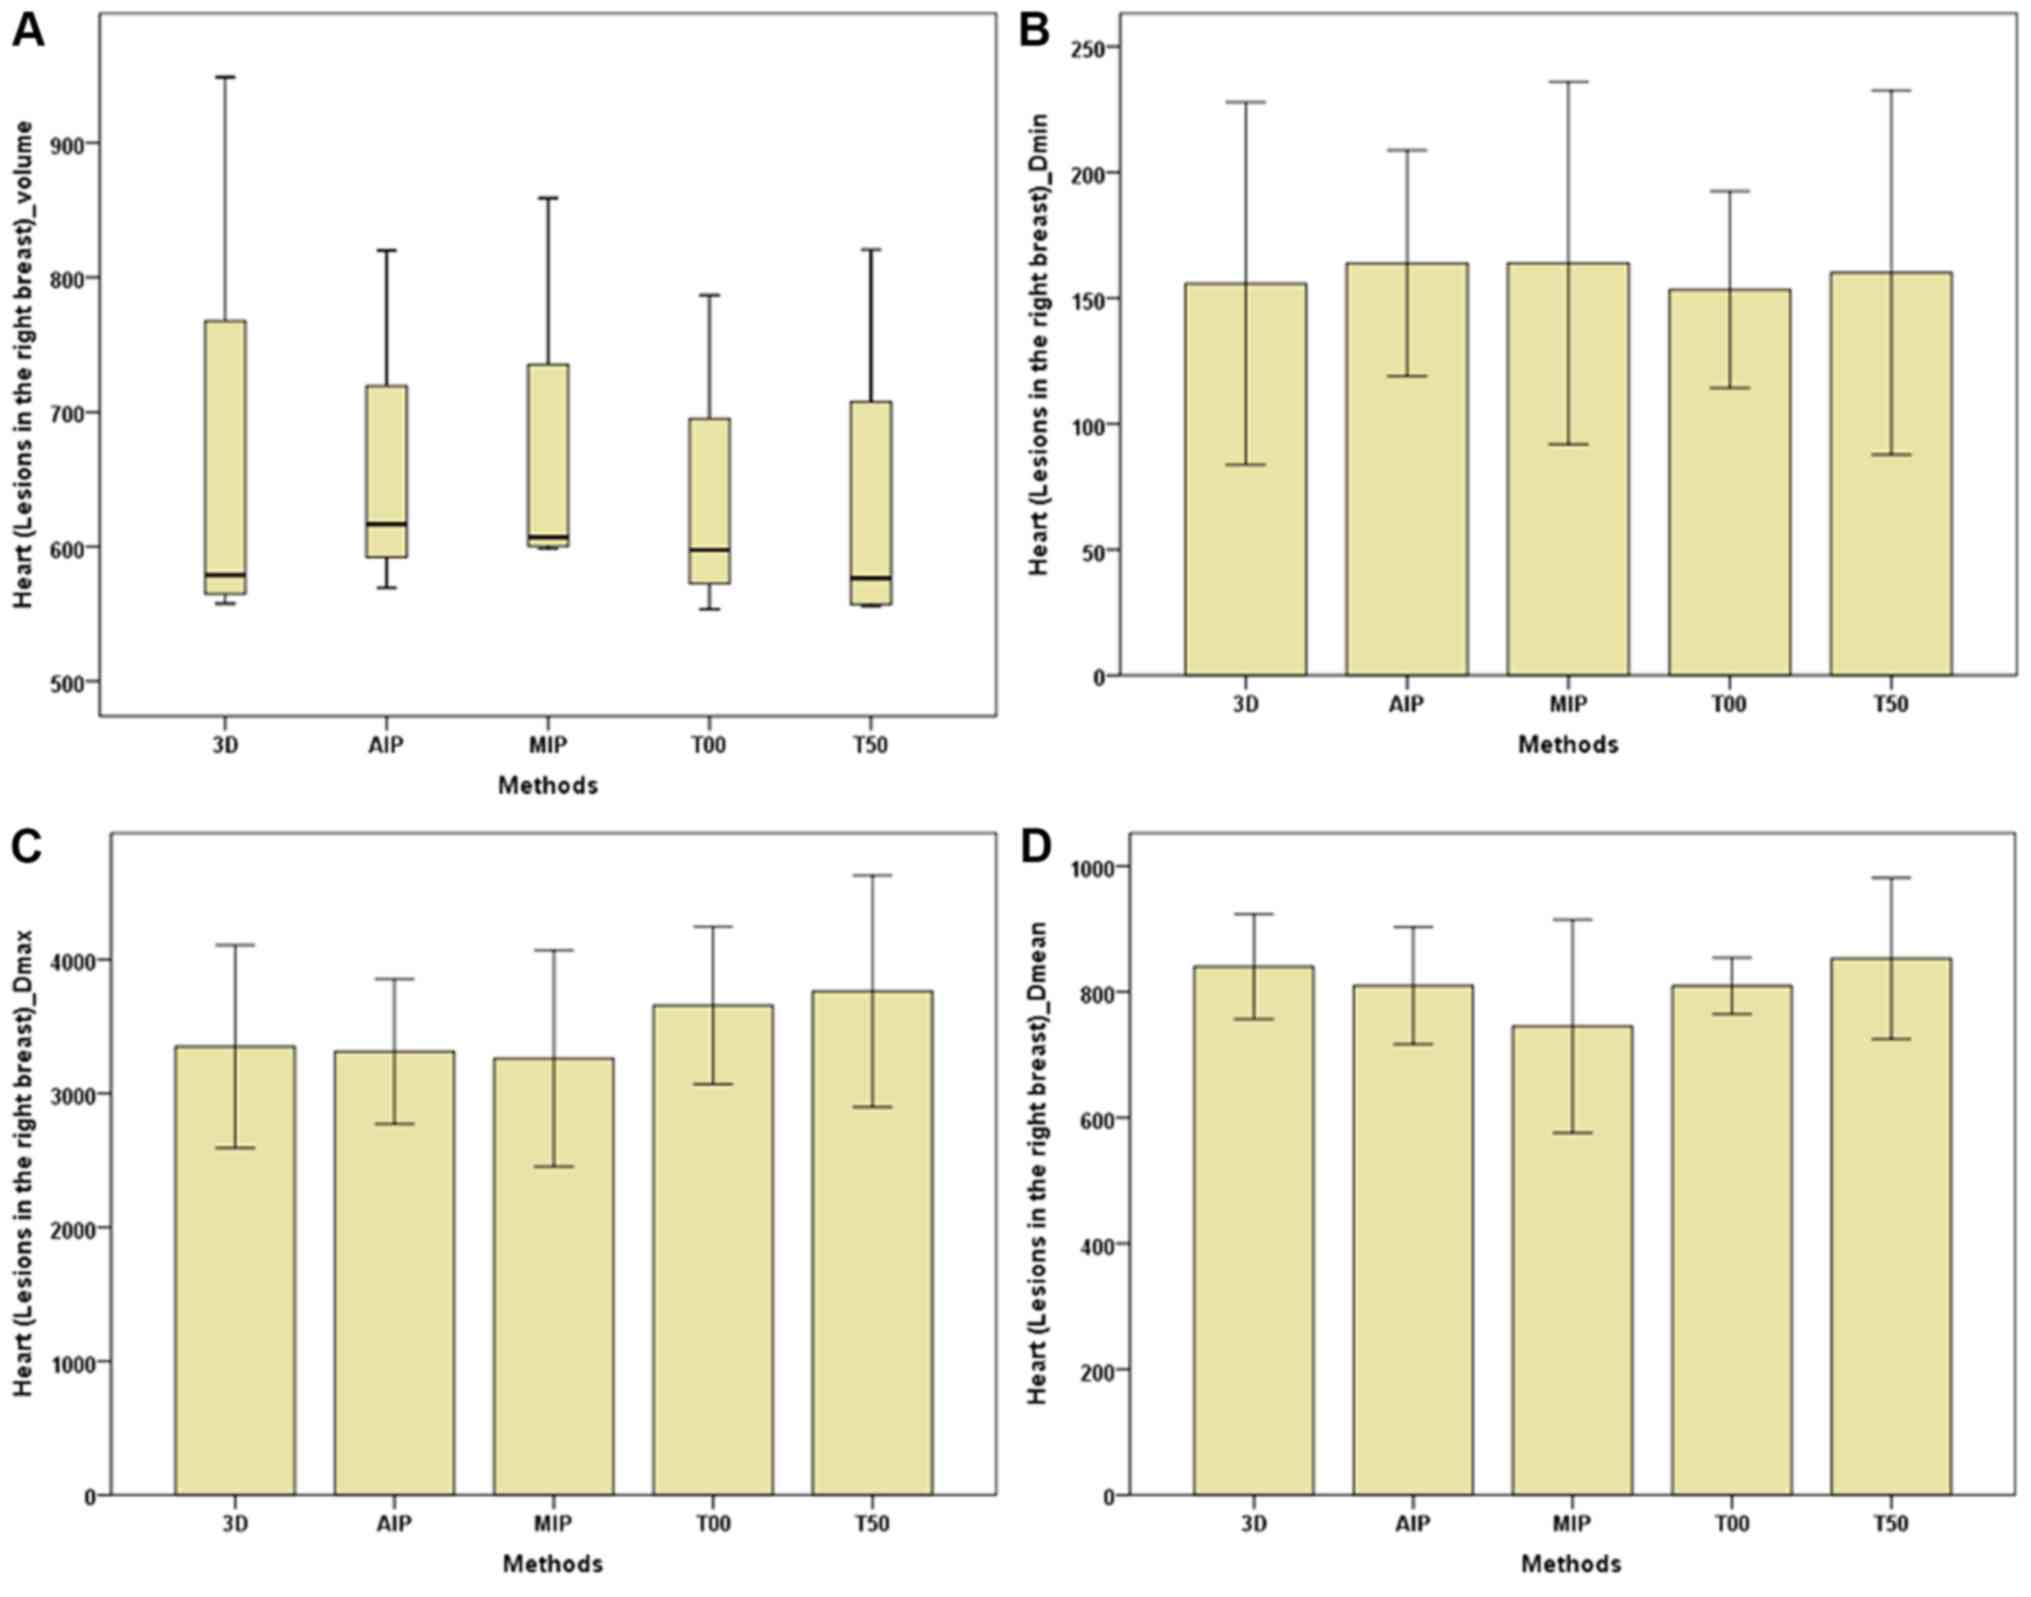 | Figure 9.Parameters of the heart (breast
lesions in the right) between the 3D and four-dimensional
computerised tomography plans in seven patients. (A) Heart (lesions
in the right breast)-Volume. (B) Heart (lesions in the right
breast)-Dmin. (C) Heart (lesions in the right
breast)-Dmax. (D) Heart (lesions in the right
breast)-Dmean. The horizontal axis represents the five
different plans and the vertical axis represents the mean or median
dose size. 3D, three-dimensional; AIP, average intensity
projection; MIP, maximal intensity projection; T00, end of
inhalation; T50, end of exhalation; Dx, the
minimum dose delivered to x% of the target volume;
Vx, represents the volume receiving no less than
x Gy; Dmax, maximum point dose;
Dmin, minimum point dose of the target volume;
Dmean, mean point dose of the target volume; Gy,
gray. |
Results
Dosage comparison of the CTV and PTV
between the 3D-CT plan and the 4D-CT plan
The present study compared the dosimetric
characteristics between the 3D-CT radiotherapy plan and four
different 4D-CT radiotherapy plans (AIP, MIP, T00 and T50) in the
same order for the seven patients with residual breast tissue. For
target dose parameters, no significant difference was observed in
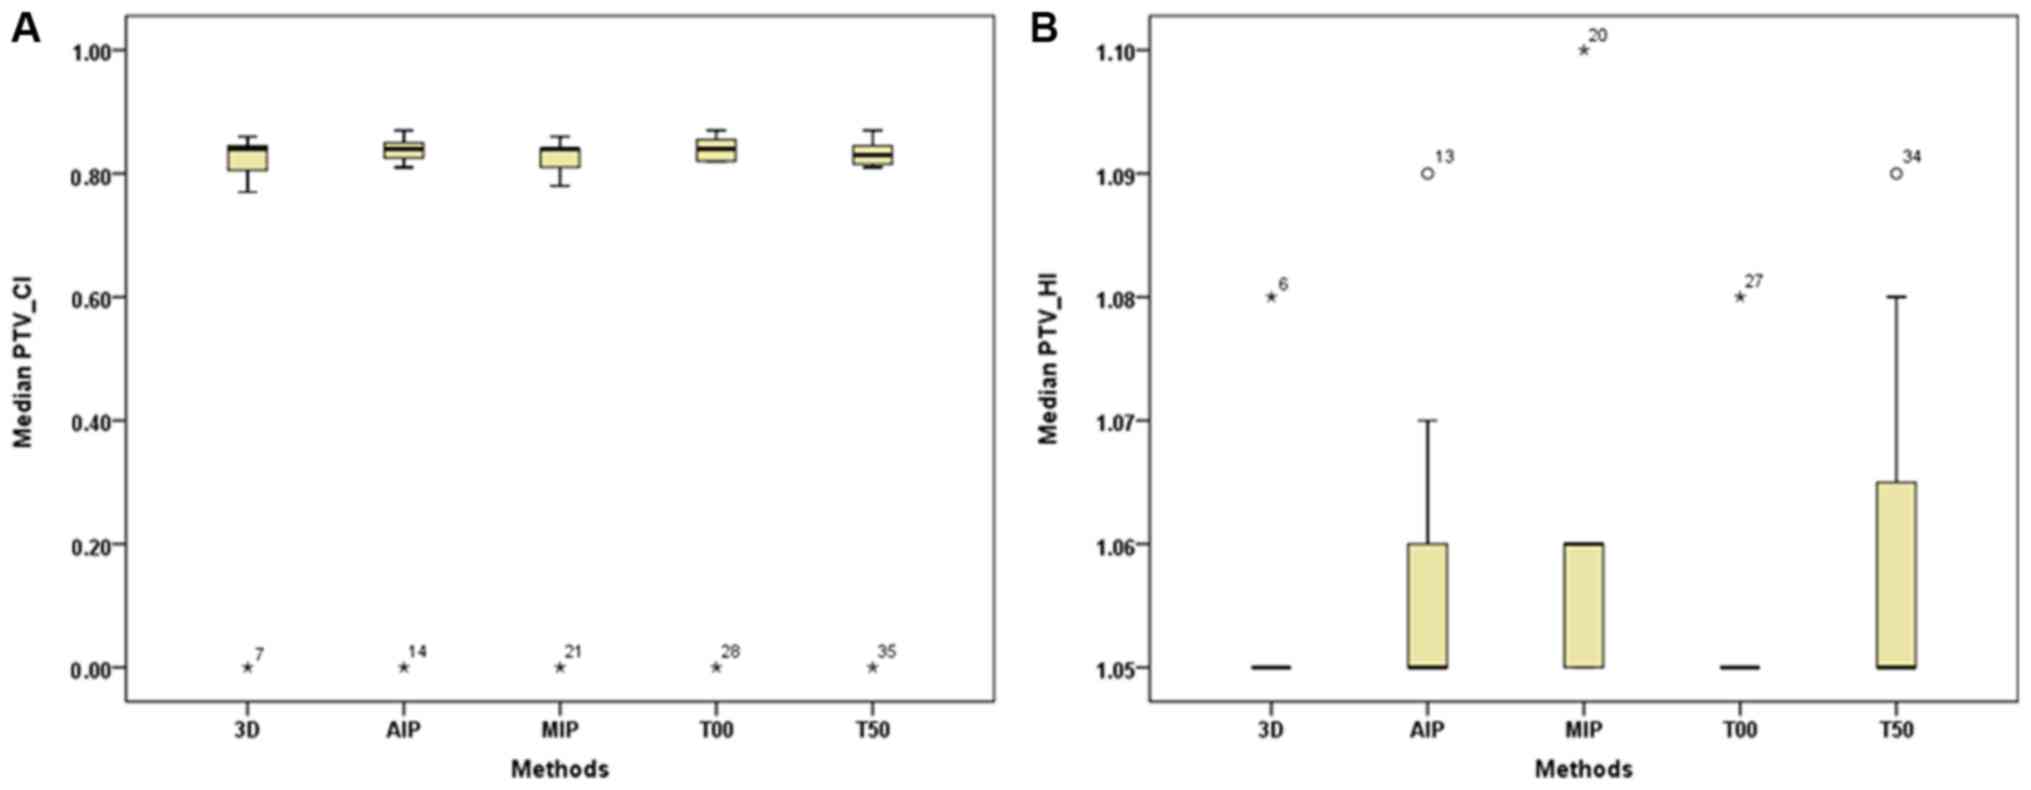
the CI and HI of the PTV between the 3D-CT and 4D-CT plans
(Table II; Fig. 1). In addition, target volumes
(including the total volume, V100,
V95, V90 and
V50) of the CTV and PTV of the 4D-CT plan were
slightly lower compared with the 3D-CT plan (Table II; Figs.
2 and 3). Furthermore,
Dmin, Dmax and
Dmean of the CTV and PTV in the MIP and AIP plans
were slightly higher compared with that of the 3D-CT plan (Table II; Figs.
2 and 3).
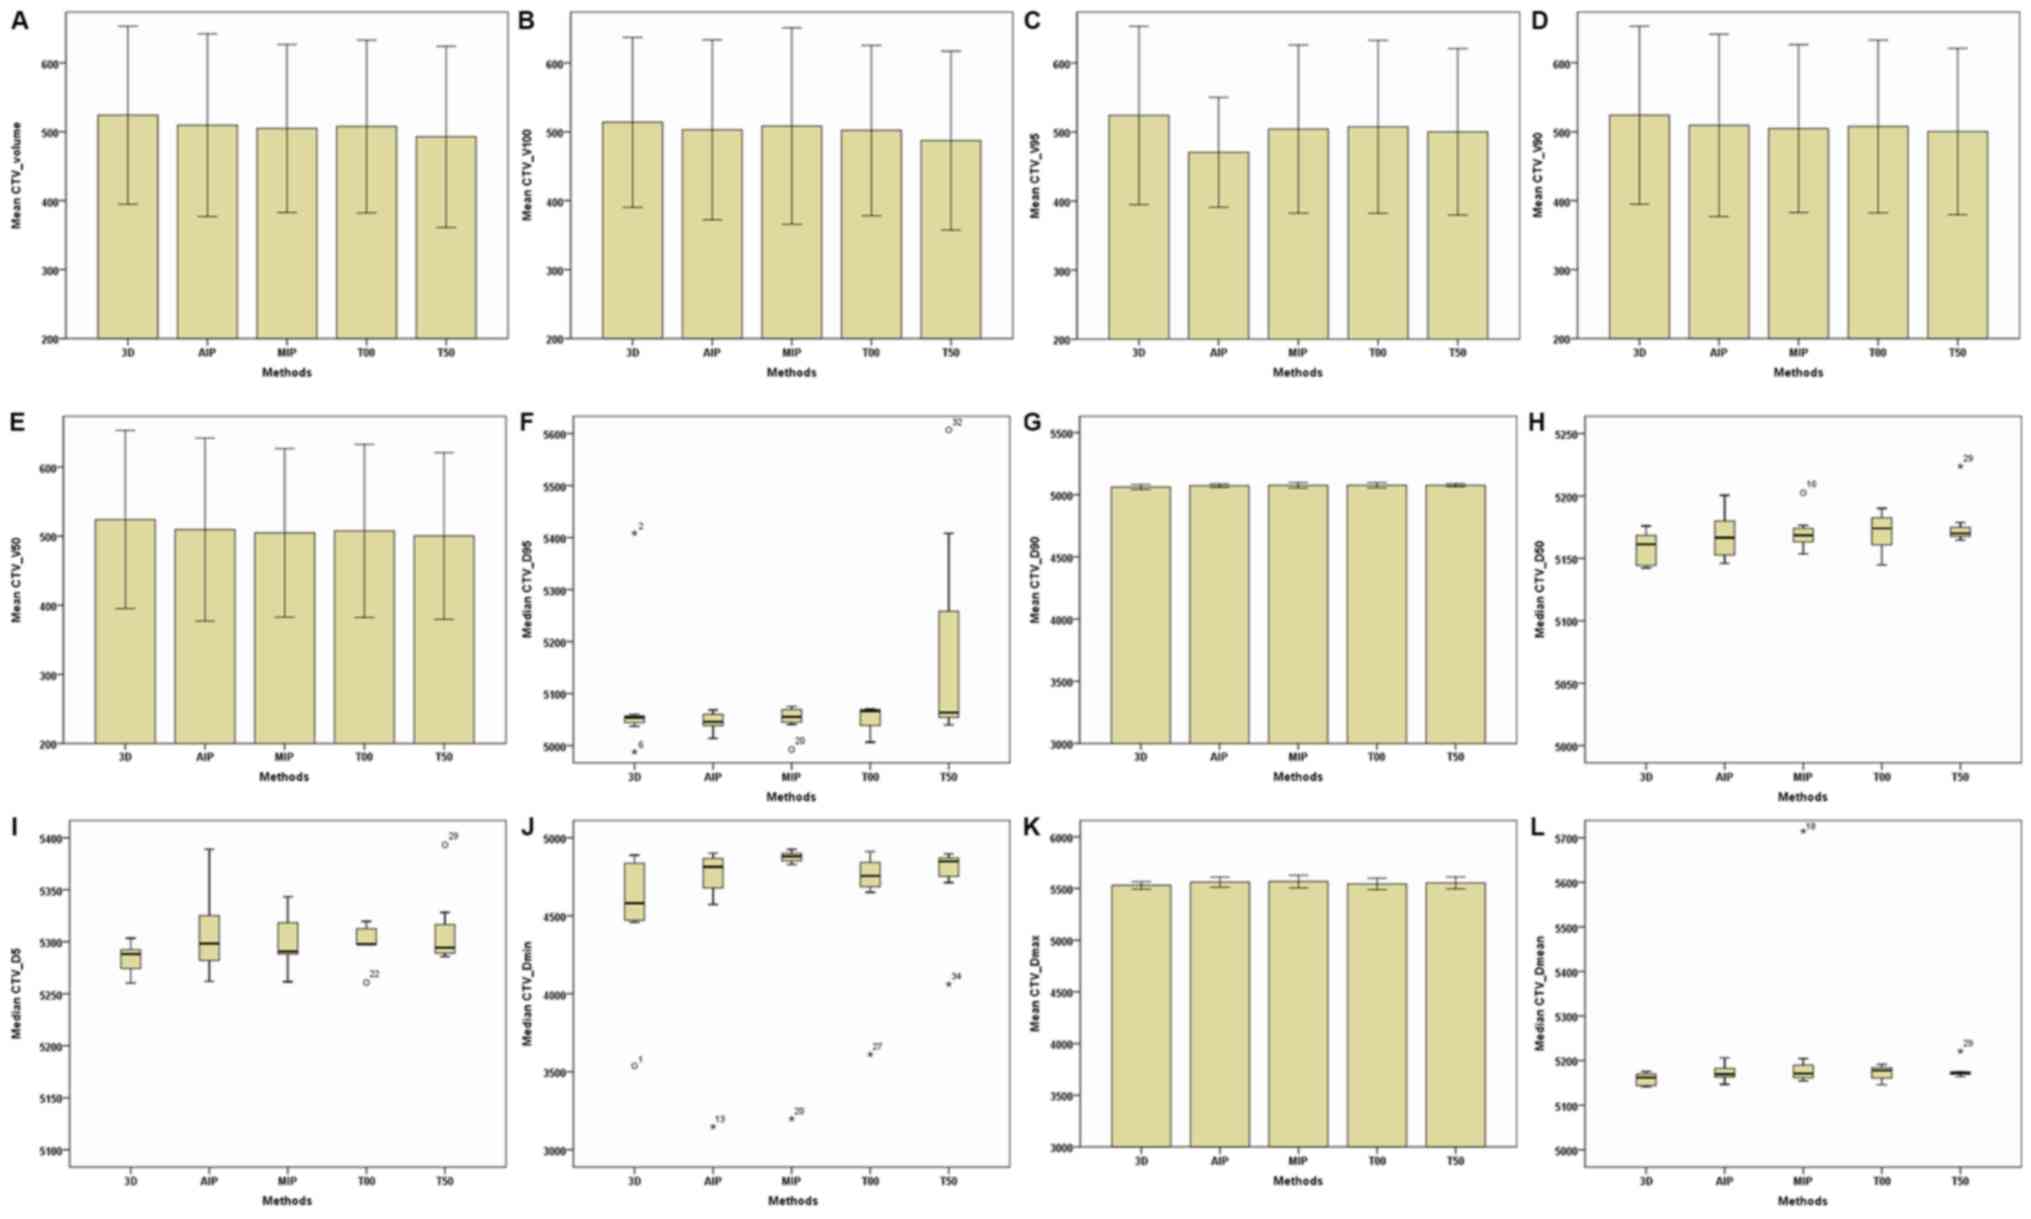 | Figure 2.Parameters of the CTV between the 3D
and four-dimensional computerised tomography plans in seven
patients. (A) CTV–Volume. (B) CTV–V100. (C)
CTV–V95. (D) CTV–V90. (E) CTV–V50.
(F) CTV-D95. (G) CTV-D90. (H)
CTV-D50. (I) CTV-D5. (J) CTV-Dmin.
(K) CTV-Dmax. (L) CTV-Dmean. The horizontal
axis represents five different plans and the vertical axis
represents the mean or median dose size. CTV, clinical target
volume; 3D, three-dimensional; AIP, average intensity projection;
MIP, maximal intensity projection; T00, end of inhalation; T50, end
of exhalation; Dx, the minimum dose delivered to
x% of the target volume; Vx, the volume
receiving no less than x% of the prescription dose;
Dmax, maximum point dose; Dmin,
minimum point dose of the target volume; Dmean,
mean point dose of the target volume; Gy, gray. |
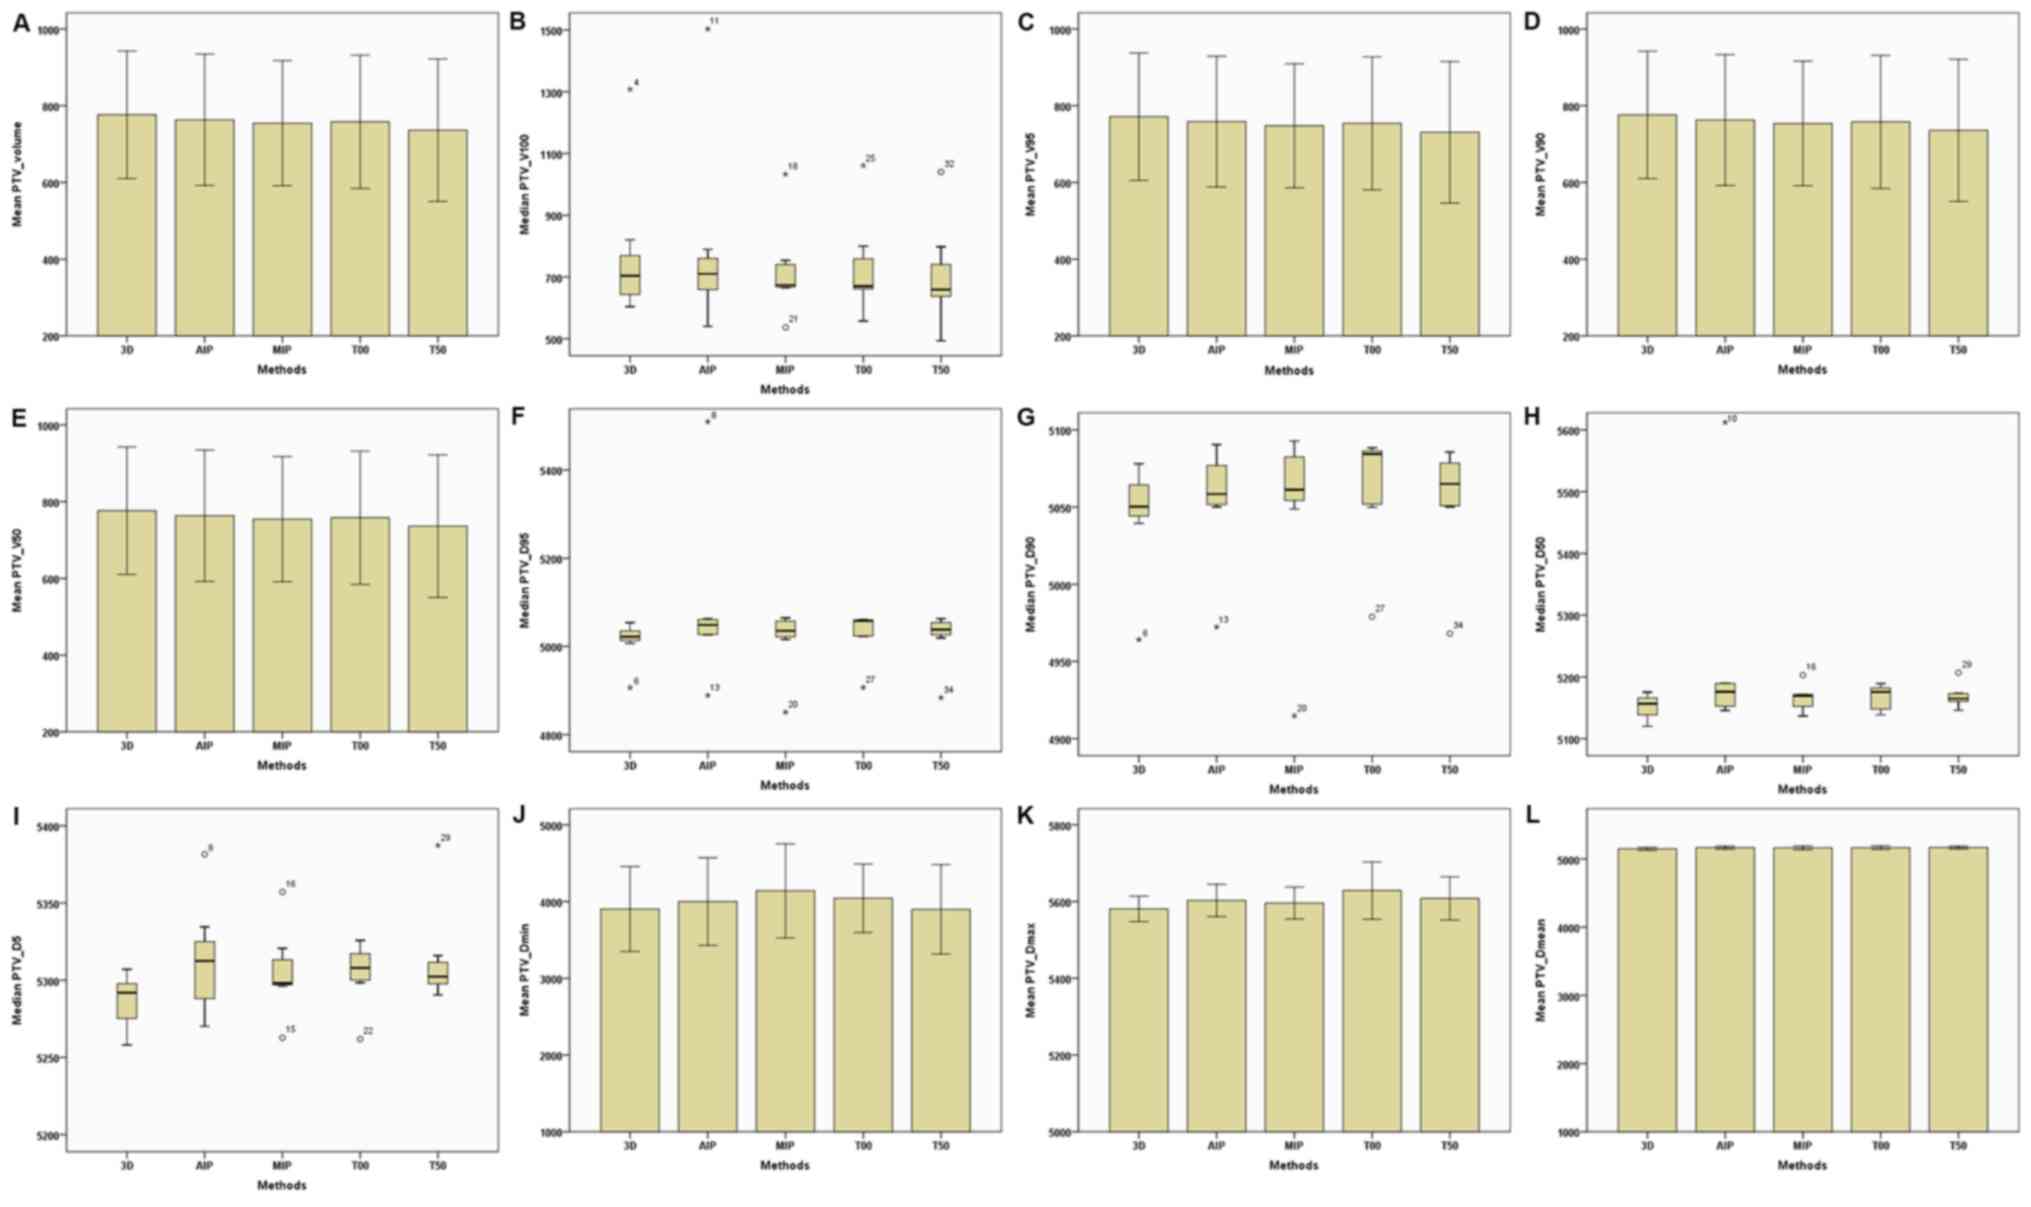 | Figure 3.Parameters of the PTV between the 3D
and four-dimensional computerised tomography plans in seven
patients. (A) PTV–Volume. (B) PTV–V100. (C)
PTV–V95. (D) PTV–V90. (E) PTV–V50.
(F) PTV-D95. (G) PTV-D90. (H)
PTV-D50. (I) PTV-D5. (J) PTV-Dmin.
(K) PTV-Dmax. (L) PTV-Dmean. The horizontal
axis represents the five different plans and the vertical axis
represents the mean or median dose size. PTV, plan target volume;
3D, three-dimensional; AIP, average intensity projection; MIP,
maximal intensity projection; T00, end of inhalation; T50, end of
exhalation; Dx, the minimum dose delivered to
x% of the target volume; Vx, the volume
receiving no less than x% of the prescription dose;
Dmax, maximum point dose; Dmin,
minimum point dose of the target volume; Dmean,
mean point dose of the target volume; Gy, gray. |
| Table II.Comparisons of the CTV and PTV
between the 3D-CT plan and 4D-CT plans. |
Table II.
Comparisons of the CTV and PTV
between the 3D-CT plan and 4D-CT plans.
| A, Comparisons of
the CTV between the 3D-CT plan and 4D-CT plans |
|---|
|
|---|
|
|
| 4D-CT |
|---|
|
|
|
|
|---|
| Dose
parameters | 3D-CT | AIP | MIP | T00 | T50 |
|---|
| Volume,
cm3 |
524.034±128.999 |
509.609±132.411 |
504.793±121.959 |
507.669±125.227 |
492.642±131.491 |
|
V100,
cm3 |
513.763±123.248 |
502.839±130.326 |
508.235±142.437 |
501.892±123.518 |
487.116±129.799 |
|
V95, cm3 |
523.997±128.984 | 470.608±79.413 |
504.319±121.564 |
507.525±125.144 |
500.237±120.540 |
|
V90, cm3 |
524.033±128.998 |
509.376±132.225 |
504.566±121.769 |
507.623±125.200 |
500.334±120.610 |
|
V50, cm3 |
524.034±128.999 |
509.610±132.409 |
504.793±121.959 |
507.669±125.227 |
500.357±120.627 |
|
D95, cGy | 5,053.800
(22.900) |
5,046.400±18.634 |
5,050.343±28.339 |
5,051.371±24.420 | 5,063.600
(359.900) |
|
D90, cGy |
5,061.614±19.707 |
5,072.657±14.535 |
5,075.471±22.474 |
5,076.157±21.694 |
5,075.214±12.667 |
|
D50, cGy |
5,157.857±13.989 |
5,168.357±20.056 |
5,171.300±15.592 |
5,170.800±16.469 | 5,170.100
(30.800) |
|
D5, cGy |
5,283.629±16.116 |
5,309.086±42.371 |
5,301.171±29.122 |
5,299.757±19.366 | 5,294.3
(41.800) |
|
Dmin, cGy | 4,580.300
(398.200) | 4,813.900
(295.200) | 4,881.100
(79.400) | 4,755.500
(211.500) | 4,848.700
(169.700) |
|
Dmax, cGy |
5,529.571±35.763 |
5,561.643±49.271 |
5,566.429±60.886 |
5,543.700±54.525 |
5,554.171±58.020 |
|
Dmean, cGy |
5,157.986±14.612 |
5,173.371±19.373 | 5,170.900
(43.700) |
5,172.243±16.606 | 5,171.700
(6.800) |
|
| B, Comparisons
of the PTV between the 3D-CT plan and 4D-CT plans |
|
|
|
| 4D-CT |
|
|
|
|
| Dose
parameters | 3D-CT | AIP | MIP | T00 | T50 |
|
| Volume,
cm3 |
776.249±166.189 |
763.390±171.117 |
754.455±162.964 |
758.134±173.683 |
736.284±185.678 |
|
V100,
cm3 | 703.954
(703.954) | 710.172
(147.870) |
722.857±152.885 |
732.503±161.832 |
706.833±172.300 |
|
V95, cm3 |
771.304±165.881 |
758.704±170.350 |
747.790±161.510 |
754.069±173.358 |
730.658±184.550 |
|
V90, cm3 |
776.115±166.052 |
762.838±170.593 |
753.770±162.274 |
757.892±173.439 |
735.909±185.307 |
|
V50, cm3 |
776.249±166.189 |
763.390±171.117 |
754.455±162.964 |
758.134±173.683 |
736.284±185.678 |
|
D95, cGy | 5,022.000
(28.600) | 5,048.700
(37.300) | 5,035.400
(46.100) | 5,058.100
(38.700) | 5,038.200
(43.2000) |
|
D90, cGy | 5,050.300
(26.600) | 5,058.400
(32.800) | 5,061.200
(36.700) | 5,084.400
(36.900) | 5,065.000
(35.100) |
|
D50, cGy |
5,151.614±19.883 | 5,176.000
(41.500) |
5,165.229±21.177 |
5,166.171±21.292 |
5,169.214±18.955 |
|
D5, cGy |
5,286.186±17.435 |
5,312.900±37.372 |
5,305.486±28.646 |
5,304.314±21.177 | 5,302.400
(21.400) |
|
Dmin, cGy |
3,902.786±553.158 |
3,999.829±570.432 |
4,139.871±612.871 |
4,043.829±445.634 |
3,898.843±583.582 |
|
Dmax, cGy |
5,580.943±32.960 |
5,602.914±42.095 |
5,596.357±41.632 |
5,628.786±74.522 |
5,608.300±56.299 |
|
Dmean, cGy |
5,149.371±23.292 |
5,165.586±23.352 |
5,162.686±26.861 |
5,165.514±25.106 |
5,167.086±21.546 |
| CI | 0.840 (0.080) | 0.840 (0.050) | 0.840 (0.060) | 0.840 (0.050) | 0.830 (0.040) |
| HI | 1.050 (0) | 1.050 (0.020) | 1.050 (0.010) | 1.050 (0) | 1.050 (0.030) |
Dosage comparison of OAR between the
3D-CT and 4D-CT plans
In the present study, the following comparisons of
dose parameters of OAR were made. For the C-B (Table III; Fig.
4), the total volume of the 4D-CT plan was markedly lower
compared with the 3D-CT plan. In addition, Dmin,
Dmax and Dmean of the AIP plan
were lower than those of 3D-CT and MIP plans. No marked differences
were observed in dose parameters between the MIP and AIP plans. For
the I-L (Table III; Fig. 5), volumes (including the total
volume, V30, V20, and
V10) of the T00 plan were the highest, followed
by the 3D-CT and AIP plans, and the volumes of the T50 and MIP
plans were the lowest. For the contralateral lungs (C-L) (Table III; Fig.
6), the total volumes of the MIP plan were markedly lower
compared with that of the 3D-CT, AIP and T00 plans; however, the
volume, of the T00 plan were higher compared with the T50 plan. For
the I-L and C-L (Table III;
Figs. 5 and 6), no statistical differences were observed
in the dosage among the five plans. In addition, for the
contralateral and ipsilateral humeral head (Table III; Fig.
7), no significant differences were observed in dose parameters
between the 3D-CT and 4D-CT plans. For the heart (Table III; Figs. 8 and 9), regardless of whether breast lesions
were in the right or left side, the volume of the MIP and AIP plans
were slightly higher compared with that of the 3D-CT plan, with no
significant difference in dose among the 3D-CT, MIP and AIP plans.
When breast lesions were on the left side, for the heart,
V40 and V30 of the MIP and AIP
plans were slightly lower compared with those of the 3D-CT plan
(Table III; Fig. 8).
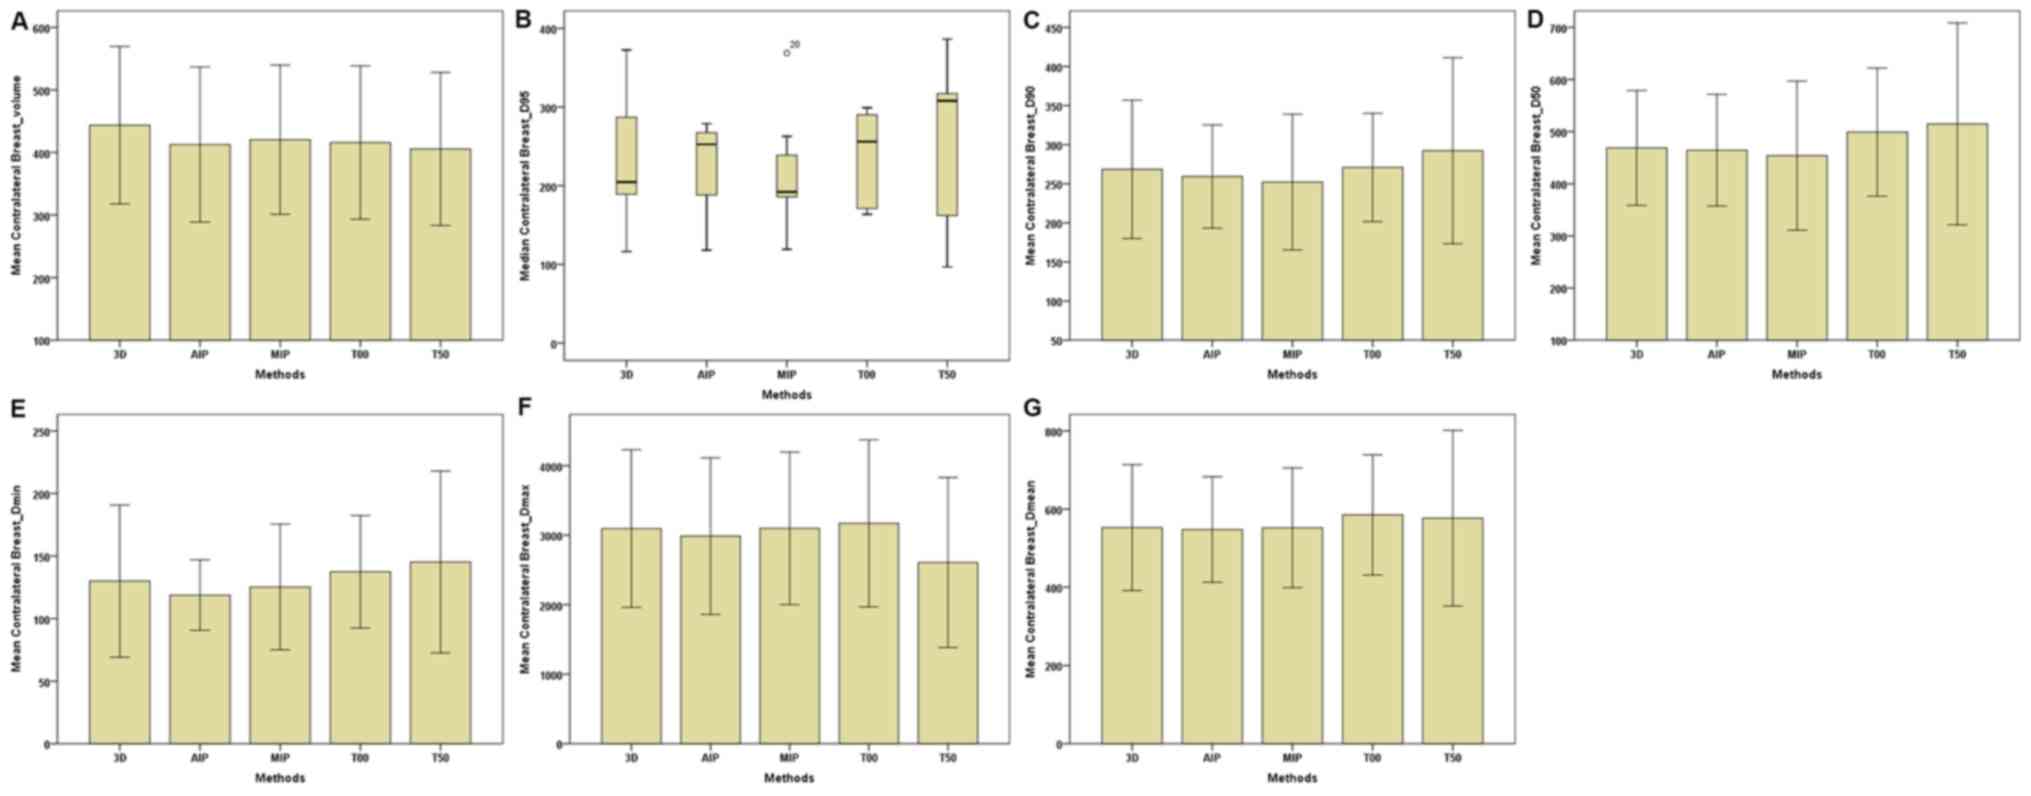 | Figure 4.Parameters of the contralateral
breast between the 3D and four-dimensional computerised tomography
plans in seven patients. (A) Contralateral Breast-Volume. (B)
Contralateral Breast-D95. (C) Contralateral
Breast-D90. (D) Contralateral Breast-D50. (E)
Contralateral Breast-Dmin. (F) Contralateral
Breast-Dmax. (G) Contralateral Breast-Dmean.
The horizontal axis represents the five different plans and the
vertical axis represents the mean or median dose size. 3D,
three-dimensional; AIP, average intensity projection; MIP, maximal
intensity projection; T00, end of inhalation; T50, end of
exhalation; Dx, the minimum dose delivered to
x% of the target volume; Vx, the volume
receiving no less than x% of the prescription dose;
Dmax, maximum point dose; Dmin,
minimum point dose of the target volume; Dmean,
mean point dose of the target volume; Gy, gray. |
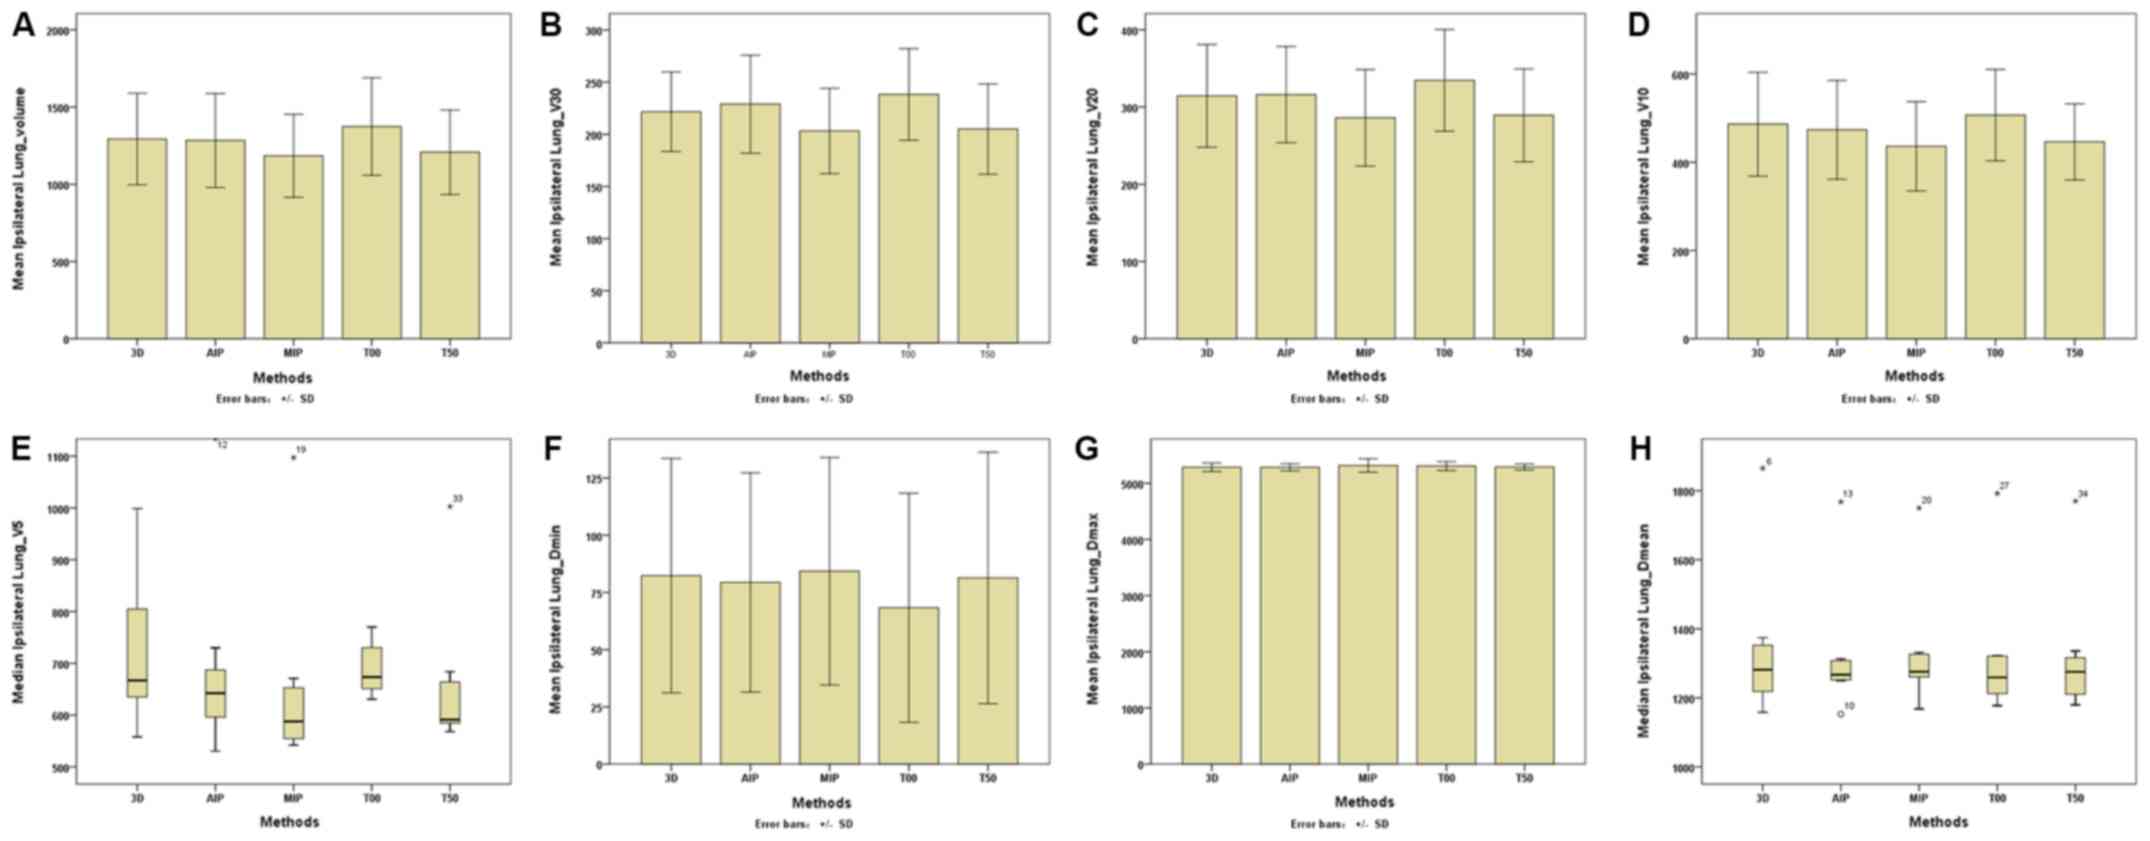 | Figure 5.Parameters of the ipsilateral lungs
between the 3D and four-dimensional computerised tomography plans
in seven patients. (A) Ipsilateral Lungs-Volume. (B) Ipsilateral
Lungs-V30. (C) Ipsilateral Lungs-V20. (D)
Ipsilateral Lungs-V10. (E) Ipsilateral
Lungs-V5. (F) Ipsilateral Lungs-Dmin. (G)
Ipsilateral Lungs-Dmax. (H) Ipsilateral
Lungs-Dmean. The horizontal axis represents the five
different plans and the vertical axis represents the mean or median
dose size. 3D, three-dimensional; AIP, average intensity
projection; MIP, maximal intensity projection; T00, end of
inhalation; T50, end of exhalation; Dx, the
minimum dose delivered to x% of the target volume;
Vx represents the volume receiving no less than
x Gy; Dmax, maximum point dose;
Dmin, minimum point dose of the target volume;
Dmean, mean point dose of the target volume; Gy,
gray. |
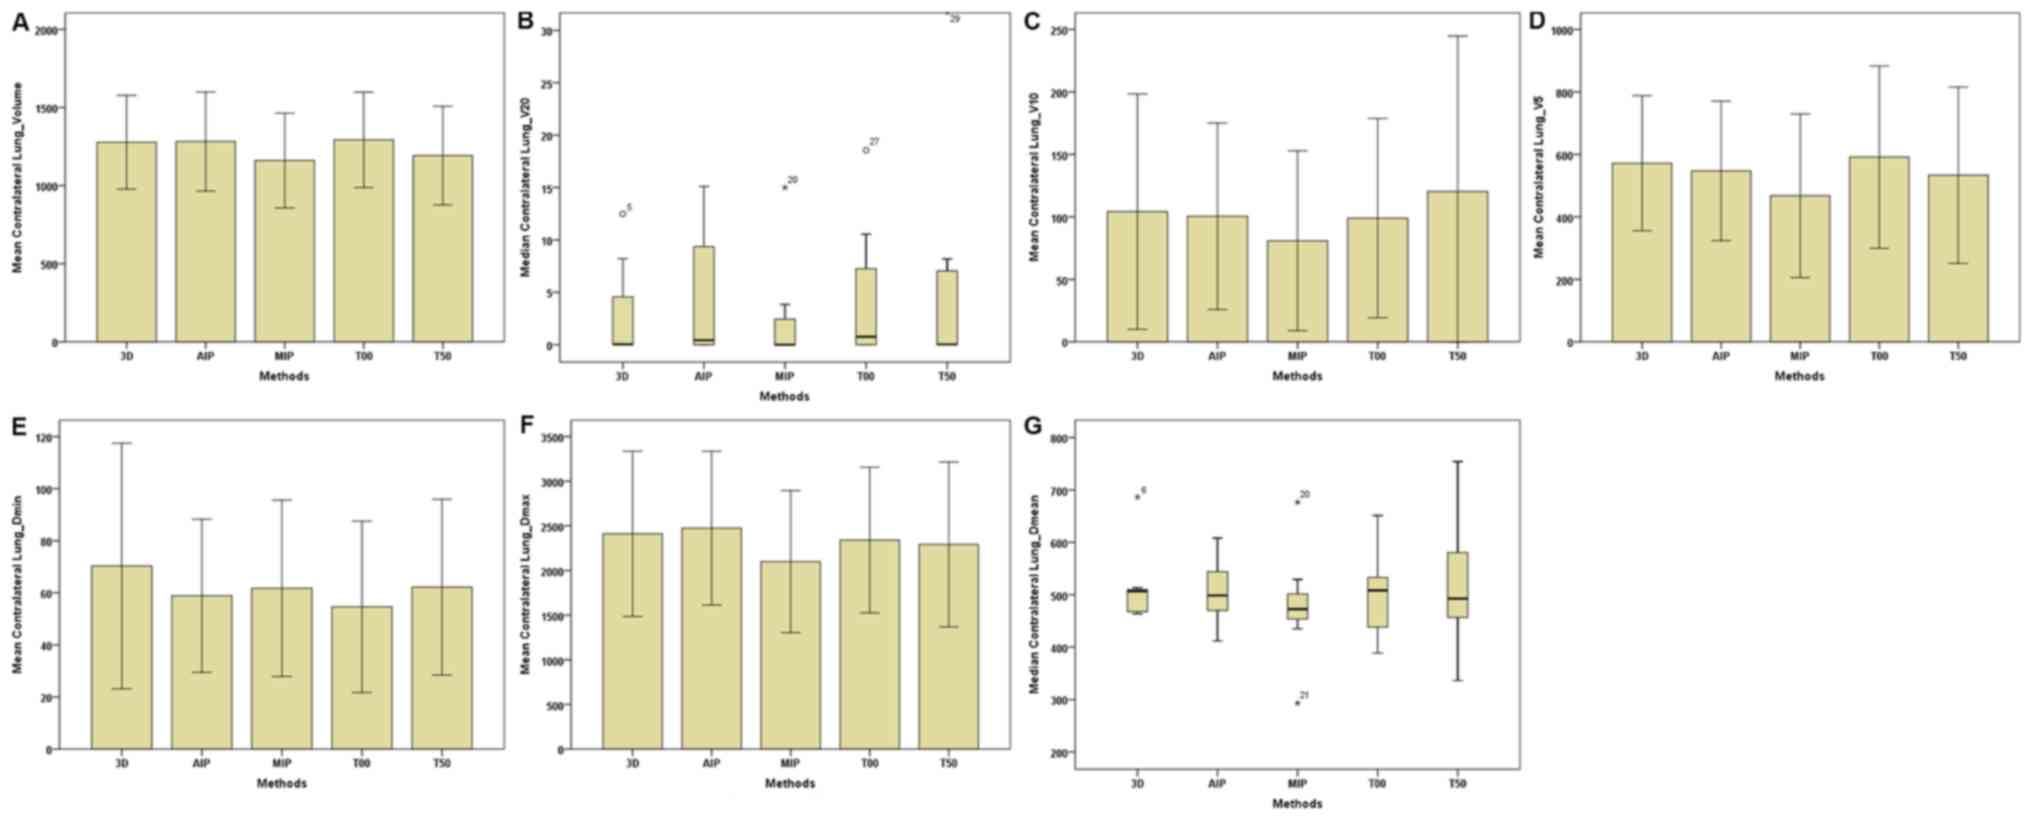 | Figure 6.Parameters of the contralateral lungs
between the 3D and four-dimensional computerised tomography plans
in seven patients. (A) Contralateral Lungs-Volume. (B)
Contralateral Lungs-V20. (C) Contralateral
Lungs-V10. (D) Contralateral Lungs-V5. (E)
Contralateral Lungs-Dmin. (F) Contralateral
Lungs-Dmax. (G) Contralateral Lungs-Dmean.
The horizontal axis represents the five different plans and the
vertical axis represents the mean or median dose size. 3D,
three-dimensional; AIP, average intensity projection; MIP, maximal
intensity projection; T00, end of inhalation; T50, end of
exhalation; Dx, the minimum dose delivered to
x% of the target volume; Vx, represents
the volume receiving no less than x Gy;
Dmax, maximum point dose; Dmin,
minimum point dose of the target volume; Dmean,
mean point dose of the target volume; Gy, gray. |
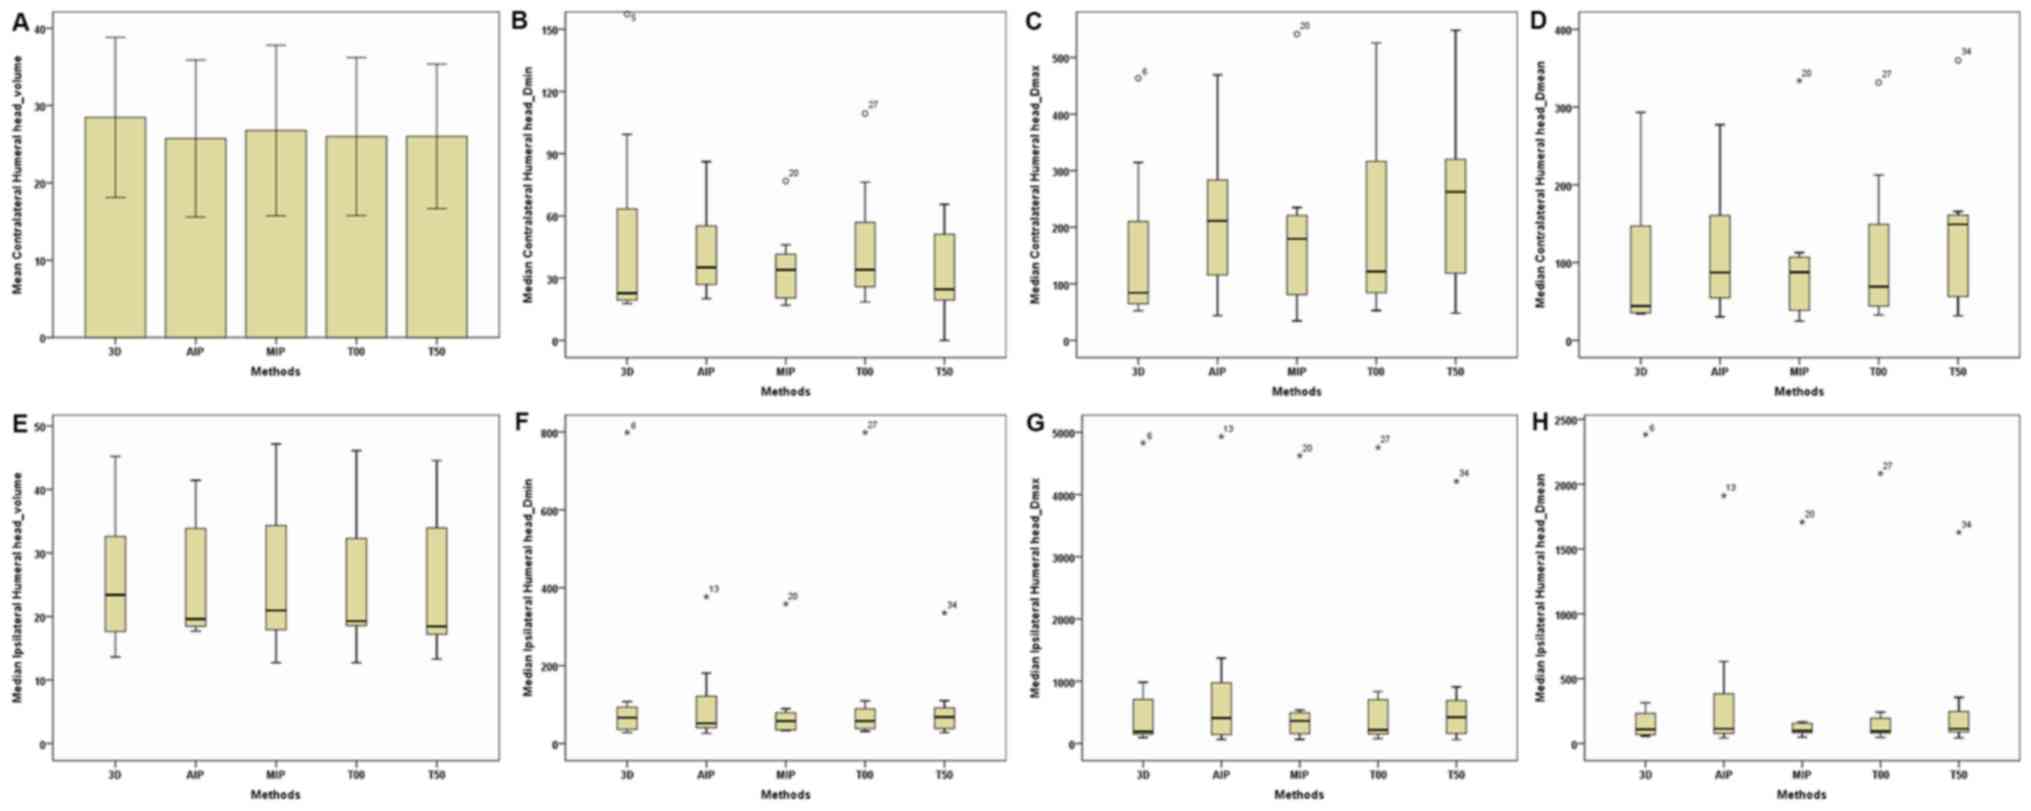 | Figure 7.Parameters of the contralateral and
ipsilateral humeral head between the 3D and four-dimensional
computerised tomography plans in seven patients. (A) Contralateral
Humeral Head-Volume. (B) Contralateral Humeral
Head-Dmin. (C) Contralateral Humeral
Head-Dmax. (D) Contralateral Humeral
Head-Dmean. (E) Ipsilateral Humeral Head-Volume. (F)
Ipsilateral Humeral Head-Dmin. (G) Ipsilateral Humeral
Head-Dmax. (H) Ipsilateral Humeral Head-Dmean. The
horizontal axis represents the five different plans and the
vertical axis represents the mean or median dose size. 3D,
three-dimensional; AIP, average intensity projection; MIP, maximal
intensity projection; T00, end of inhalation; T50, end of
exhalation; Dx, the minimum dose delivered to
x% of the target volume; Vx represents the
volume receiving no less than x Gy; Dmax,
maximum point dose; Dmin, minimum point dose of
the target volume; Dmean, mean point dose of the
target volume; Gy, gray. |
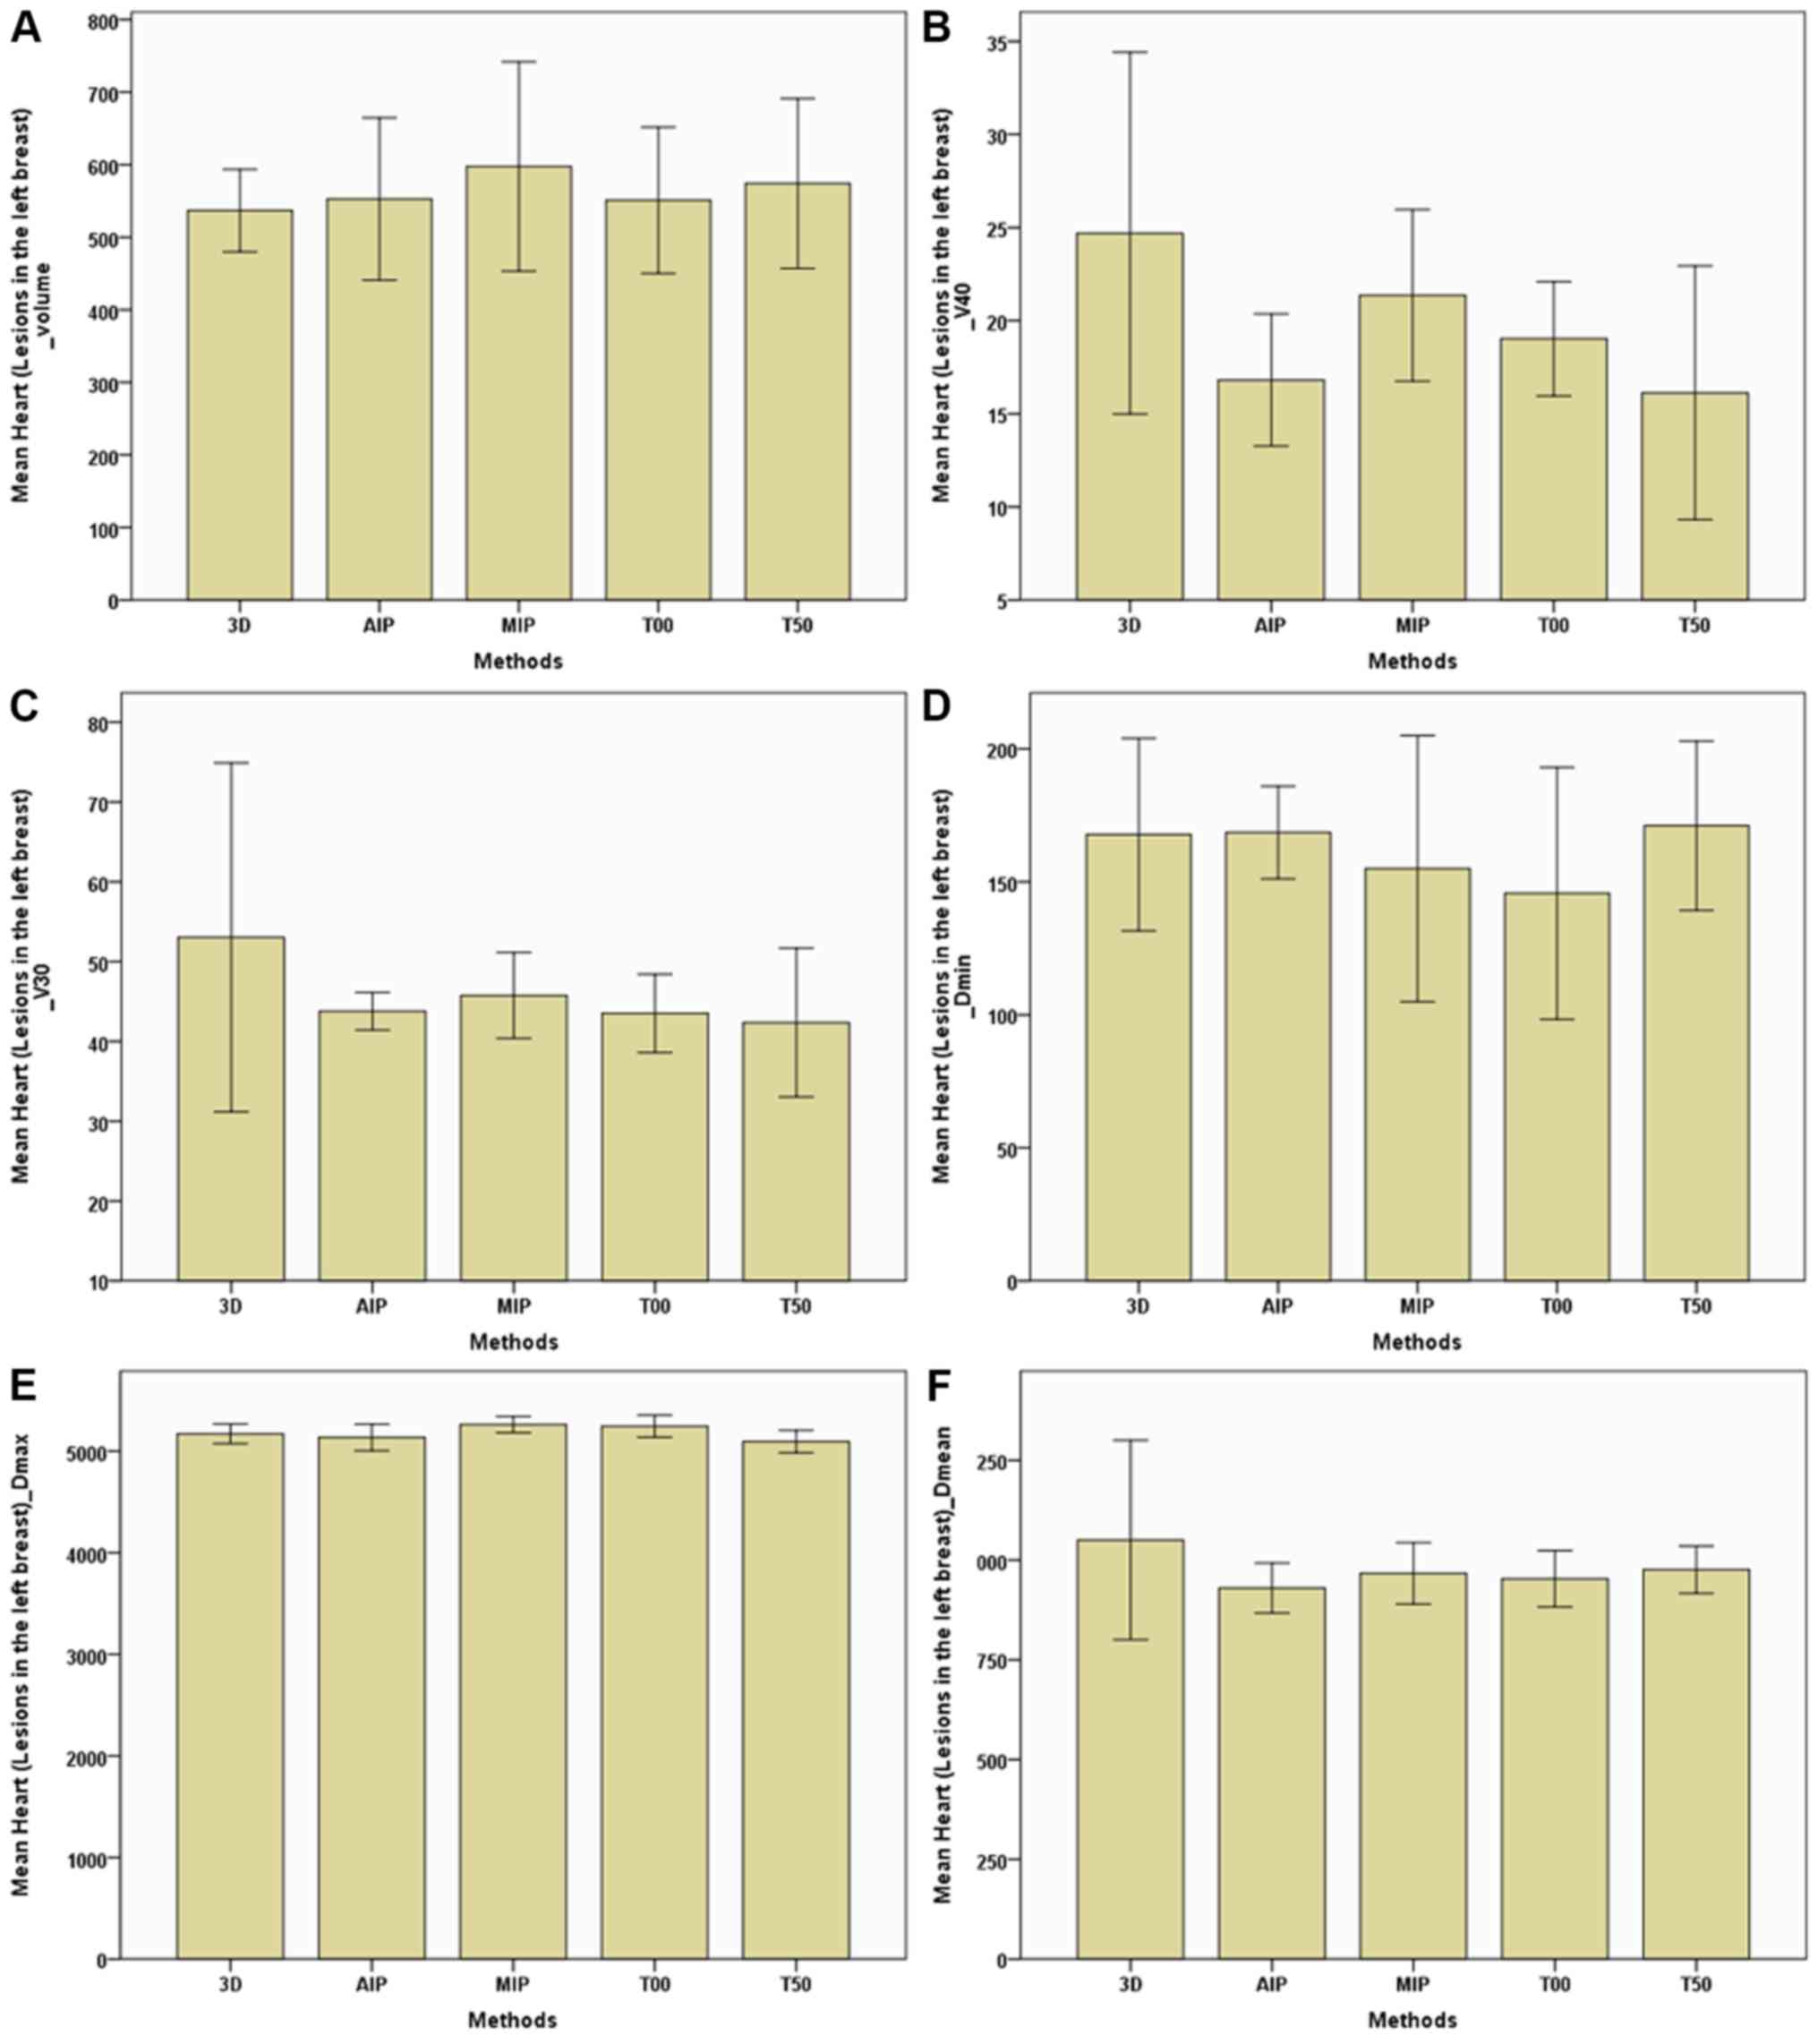 | Figure 8.Parameters of the heart (breast
lesions in the left) between the 3D and four-dimensional
computerised tomography plans in seven patients. (A) Heart (lesions
in the left breast)-Volume. (B) Heart (lesions in the left
breast)-V40. (C) Heart (lesions in the left
breast)-V30. (D) Heart (lesions in the left
breast)-Dmin. (E) Heart (lesions in the left
breast)-Dmax. (F) Heart (lesions in the left
breast)-Dmean. The horizontal axis represents the five
different plans and the vertical axis represents the mean or median
dose size. 3D, three-dimensional; AIP, average intensity
projection; MIP, maximal intensity projection; T00, end of
inhalation; T50, end of exhalation; Dx, the
minimum dose delivered to x% of the target volume;
Vx, represents the volume receiving no less than
x Gy; Dmax, maximum point dose;
Dmin, minimum point dose of the target volume;
Dmean, mean point dose of the target volume; Gy,
gray. |
| Table III.Comparison of organs at risk between
the 3D-CT plan and 4D-CT plans. |
Table III.
Comparison of organs at risk between
the 3D-CT plan and 4D-CT plans.
| A, Comparison of
contralateral breast between the 3D-CT plan and 4D-CT plans |
|---|
|
|---|
|
|
| 4D-CT |
|---|
| Dose
parameters | 3D-CT | AIP | MIP | T00 | T50 |
|---|
| Volume,
cm3 |
443.632±125.842bcde |
412.736±123.953a |
420.366±119.146a |
415.838±122.482a |
405.546±122.296a |
|
V100,
cm3 | 0 (0) | 0 (0) | 0 (0) | 0 (0) | 0 (0) |
|
V95, cm3 | 0 (0) | 0 (0) | 0 (0) | 0 (0) | 0 (0) |
|
V90, cm3 | 0 (0) | 0 (0) | 0 (0) | 0 (0) | 0 (0) |
|
V50, cm3 | 0.051 (2.025) | 0 (1.492) | 0 (2.918) | 1.079±1.355 | 0 (1.174) |
|
D95, cGy | 235.100±85.804 | 222.943±60.973 | 218.500±78.801 | 256 (127.100) |
249.943±109.144 |
|
D90, cGy | 268.471±88.399 | 259.257±65.953 | 252.157±86.770 | 270.857±69.291 |
292.329±118.998 |
|
D50, cGy |
468.743±110.044 |
464.371±107.091 |
453.971±143.022 |
499.000±123.028 |
514.757±193.549 |
|
Dmin, cGy | 130.000±60.833 | 118.757±28.180 | 125.257±50.198 | 137.414±44.952 | 145.243±72.691 |
|
Dmax, cGy |
3,095.100±1,134.238 |
2,985.429±1,126.133 |
3,097.929±1,097.616 |
3,169.829±1,202.651 |
2,606.800±1,223.300 |
|
Dmean, cGy |
552.814±160.896 |
548.000±135.008 |
552.214±153.072 |
585.171±153.823 |
576.814±224.615 |
|
| B, Comparison of
contralateral lungs between the 3D-CT plan and 4D-CT plans |
|
|
|
| 4D-CT |
|
|
|
|
| Dose
parameters | 3D-CT | AIP | MIP | T00 | T50 |
|
| Volume,
cm3 |
1,277.545±299.910c |
1,282.555±316.948c |
1,160.681±303.191abd |
1,292.970±305.323c |
1,192.409±315.200 |
|
V30, cm3 | 0 (0.028) | 0 (0.114) | 0 (0) | 0 (0.029) | 0 (0.046) |
|
V20, cm3 | 0.033 (8.205) | 0.430 (10.358) | 0 (3.852) | 0.767 (10.545) | 0.023 (8.181) |
|
V10, cm3 | 104.212±94.178 | 100.521±74.605 | 80.887±71.878 | 99.002±79.668 |
120.292±124.364 |
|
V5, cm3 |
571.566±215.984 |
547.182±223.574 |
467.601±261.863 |
591.245±291.803 |
533.447±282.082 |
|
Dmin, cGy | 70.314±47.183 | 58.886±29.400 | 61.743±33.861 | 54.614±32.909 | 62.186±33.771 |
|
Dmax, cGy |
2,411.371±926.260 |
2,475.143±861.417 |
2,098.871±796.763 |
2,340.914±815.578 |
2,291.971±923.247 |
|
Dmean, cGy | 506.500
(48.600) | 506.786±69.115 |
478.943±114.060 | 498.743±89.702 |
522.500±137.952 |
|
| C, Comparison of
ipsilateral lungs between the 3D-CT plan and 4D-CT plans |
|
|
|
| 4D-CT |
|
|
|
|
| Dose
parameters | 3D-CT | AIP | MIP | T00 | T50 |
|
| Volume,
cm3 |
1,293.366±296.783cde |
1,283.719±304.658cde |
1,184.856±269.076abd |
1,373.630±315.333abce |
1,207.775±273.286abd |
|
V30, cm3 |
221.643±38.121cde |
228.896±46.964ce |
203.222±40.910abd |
238.280±43.928ace |
205.054±43.384abd |
|
V20, cm3 |
314.498±66.481cde |
316.125±62.331ce |
286.039±62.517abd |
334.568±65.860ace |
289.286±60.105abd |
|
V10, cm3 |
486.178±117.650ce |
473.562±111.914 |
436.175±101.303ad |
506.874±103.594ce |
446.127±86.055ad |
|
V5, cm3 |
729.099±165.369c | 642.457
(174.459)e | 587.799
(125.114)ad | 673.485
(119.525)ce | 591.269
(101.470)bd |
|
Dmin, cGy | 82.371±51.204 | 79.386±47.893 | 84.300±49.682 | 68.314±50.053 | 81.357±54.990 |
|
Dmax, cGy |
5,284.614±76.128 |
5,283.543±62.539 |
5,315.743±120.179 |
5,305.214±79.738 |
5,288.486±53.484 |
|
Dmean, cGy | 1,281.600
(211.200) | 1,267.300
(63.000) | 1,275.700
(74.700) | 1,259.200
(143.300) | 1,275.400
(150.300) |
|
| D, Comparison of
contralateral humeral head between the 3D-CT plan and 4D-CT
plans |
|
|
|
| 4D-CT |
|
|
|
|
| Dose
parameters | 3D-CT | AIP | MIP | T00 | T50 |
|
| Volume,
cm3 | 28.462±10.357 | 25.734±10.141 | 26.783±11.037 | 25.989±10.215 | 26.011±9.347 |
|
V30, cm3 | 0 (0) | 0 (0) | 0 (0) | 0 (0) | 0 (0) |
|
V20, cm3 | 0 (0) | 0 (0) | 0 (0) | 0 (0) | 0 (0) |
|
V10, cm3 | 0 (0) | 0 (0) | 0 (0) | 0 (0) | 0 (0) |
|
V5, cm3 | 0 (0) | 0 (0) | 0 (0) | 0 (0) | 0 (0) |
|
Dmin, cGy | 22.800
(81.300) | 43.671±25.406 | 35.971±20.888 | 46.786±33.600 | 33.071±23.574 |
|
Dmax, cGy | 84.3 (251.200) |
217.500±146.926 |
194.157±170.316 |
214.600±181.153 |
248.014±171.875 |
|
Dmean, cGy | 44.300
(212.500) | 117.957±96.788 | 87.600
(75.500) | 69.200
(171.700) |
139.329±112.214 |
|
| E, Comparison of
Ipsilateral humeral head between the 3D-CT plan and 4D-CT
plans |
|
|
|
| 4D-CT |
|
|
|
|
| Dose
parameters | 3D-CT | AIP | MIP | T00 | T50 |
|
| Volume,
cm3 | 26.099±12.287 | 19.600
(21.870) | 26.470±13.640 | 25.693±12.298 | 25.506±12.668 |
|
V30, cm3 | 0 (0) | 0 (0) | 0 (0) | 0 (0) | 0 (0) |
|
V20, cm3 | 0 (0) | 0 (0) | 0 (0) | 0 (0) | 0 (0) |
|
V10, cm3 | 0 (0) | 0 (0) | 0 (0) | 0 (0) | 0 (0) |
|
V5, cm3 | 0 (4.104) | 0 (10.989) | 0 (0.103) | 0 (1.498) | 0 (4.481) |
|
Dmin, cGy | 66.3 (72.900) | 52.000
(145.500) | 57.900
(56.300) | 57.700
(77.200) | 68.000
(77.500) |
|
Dmax, cGy | 190.500
(873.600) | 408.200
(1230.20) | 363.300
(385.700) | 217.800
(690.300) | 420.800
(752.200) |
|
Dmean, cGy | 108.300
(253.000) | 113.100
(562.100) | 98.800
(96.400) | 95.400
(170.100) | 113.400
(285.000) |
|
| F, Comparison of
Heart (lesions in the left breast) between the 3D-CT plan and 4D-CT
plans |
|
|
|
| 4D-CT |
|
|
|
|
| Dose
parameters | 3D-CT | AIP | MIP | T00 | T50 |
|
| Volume,
cm3 | 536.802±57.042 |
552.668±111.836 |
597.627±144.324 |
550.867±100.890 |
574.107±117.065 |
|
V40, cm3 | 24.698±9.714 | 16.812±3.546 | 21.360±3.066 | 19.028±3.066 | 16.127±6.813 |
|
V30, cm3 | 53.045±21.852 | 43.779±2.348 | 45.758±5.379 | 43.508±4.896 | 42.364±9.319 |
|
Dmin, cGy | 167.767±36.235 | 168.533±17.404 | 154.933±49.980 | 145.667±47.388 | 171.067±31.825 |
|
Dmax, cGy |
5,171.133±97.184 |
5,135.067±129.853 |
5,262.267±80.123 |
5,246.333±109.470 |
5094.500±109.390 |
|
Dmean, cGy |
1,049.933±249.937 | 929.733±62.684 | 966.733±76.793 | 953.200±70.634 | 975.767±59.327 |
|
| G, Comparison of
Heart (lesions in the right breast) between the 3D-CT plan and
4D-CT plans |
|
|
|
| 4D-CT |
|
|
|
|
| Dose
parameters | 3D-CT | AIP | MIP | T00 | T50 |
|
| Volume,
cm3 | 579.013
(297.004) |
655.683±111.829 | 606.943
(197.833) |
633.784±104.173 | 576.575
(207.698) |
|
V40, cm3 | 0 (0.040) | 0 (0) | 0 (0) | 0 (0) | 0.051(0.281) |
|
V30, cm3 | 1.557±1.801 | 1.382±2.078 | 1.151±1.623 | 2.452±3.116 | 2.120±1.993 |
| Dmin,
cGy | 155.825±72.060 | 163.850±44.906 | 163.925±71.999 | 153.350±39.108 | 160.125±72.390 |
| VDmax,
cGy |
3,350.775±758.403 |
3,313.925±541.515 |
3,262.275±808.223 |
3,658.650±588.156 |
3,764.050±865.463 |
|
Dmean, cGy | 839.850±83.354 | 809.775±92.947 |
745.275±169.622 | 809.375±44.920 |
852.950±128.064 |
Discussion
Previous studies have established that radiotherapy
based on 4D-CT simulation enhances the accuracy of dosage and
determines the locations of tumour(s) and OAR in the chest and
abdomen (9–26,33).
Certain previous studies have compared the composite methods of
4D-CT radiotherapy for lung cancer and liver cancer (9,17,20,23–26,33);
however, at present, to the best of our knowldege, there is no
study that has been published in English, which has investigated
the same for breast cancer. To the best of the our knowledge, the
present study is the first to compare the target volume and
dosimetric differences between the 3D-CT radiotherapy plan and four
4D-CT radiotherapy plans (T00, T50, MIP and AIP plans) for whole
breast radiotherapy.
For dose parameters of targets, all target volumes
(including the total volume, V100,
V95, V90 and
V50) of the CTV and PTV in the 3D-CT plan were
slightly higher compared with four 4D-CT plans, with no difference
between the T00 and T50 plans. For the C-B, the total volume in the
3D-CT plan was markedly higher compared with the 4D-CT plan.
Therefore, it could be concluded that breast tissues exert little
impact on the respiration movement, which suggests that the volume
changes of the breasts should be ignored (34). In addition, differences in target
volumes between the 3D-CT and 4D-CT plans were not due to
respiration movement-caused displacement. In free breathing,
partial target areas of the 3D-CT plan were scanned recurrently or
missed due to uncertainty in the beginning time of the scan and the
whole scan time was longer compared with the 4D-CT scan; therefore,
4D-CT images evaluated the location, size and shape of targets more
precisely (35). However, Bedi et
al (36) reported no significant
differences in the left breast volume contoured on a 3D-CT scan
(1,005±559 cm3), 4D-CT scan with full inspiration phase
(1,019±563 cm3), 4D-CT scan with full expiration phase
(1,023±573 cm3) and 4D-CT scan derived by AIP (1023±573
cm3). The difference between the two studies could be
attributed to the following: i) Breast locations in western females
are more easily affected by the respiration movement, as the breast
size of western females is typically larger compared with Chinese
females; and ii) all breast lesions in the previous study by Bedi
et al (36) were in the left
chest where the impact of the cardiac motion could not be ignored;
however, in the present study, the number of lesions on the right
side was greater than that on the left side (right-to-left ratio,
4:3)
Respiration movements not only affect displacements
of target volumes but also exert a considerable impact on the
radiation dose distribution (37–39). In
the clinical setting, during the process of treatment, changes in
the dose distribution caused by target bias in the 3D-CT plan
cannot satisfy the treatment requirements, which may increase the
risk of local recurrence. In the present study,
Dmin, Dmax and
Dmean of the CTV and PTV in the MIP and AIP plans
were slightly higher compared with that of the 3D-CT plan. However,
Dmin, Dmax and
Dmean of the C-B in the 3D-CT and T00 plans were
the highest and those of the AIP and MIP plans were the lowest. In
addition, no marked difference was observed in dose parameters
between the MIP and AIP plans, indicating that the dose
distribution of the MIP and AIP plans is better compared with that
of the 3D-CT plan. In addition, this suggests that the MIP and AIP
plans can prevent and decrease radiation exposure to normal breast.
In the present study, no marked differences were observed in the CI
and HI between the 3D-CT and four 4D-CT plans. As the target
volumes in the five groups were similar, all plans were achieved by
IMRT with the same pattern. Reportedly, the IMRT technique achieved
improved CI and HI compared with 3D conformal radiotherapy, and
increased OAR sparing and decreased the late effects, which
enhanced the quality of life of the patients (31,40,41).
Previous studies have compared different composite
methods for lung cancer and liver cancer (21,23–28).
Zhao et al (27) reported
that lung volumes of the AIP plan were close to the 3D-CT volume in
lung cancer and that of the MIP plan was smaller compared with the
AIP plan by 11.4±2.3%. In addition, the DVH of the MIP plan
revealed that the MIP plan was less sensitive to breathing
movements (27). However, Simon
et al (28) reported that the
internal target volume of the MIP plan was closer to the actual
volume compared with that of the AIP plan. Similarly, a previous
study determined that the GTV of the MIP plan was markedly higher
compared with that of the AIP plan for stereotactic body
radiotherapy planning in lung cancer (20). The differences in the aforementioned
studies may have resulted from different evaluated standard and
research methods. MIP images are acquired by finding the maximum CT
value of images from all respiratory phases. A previous study
reported that MIP images include the motion and position extent of
a lung tumour as the density of a tumour was higher compared with
that of the surrounding normal lung tissue (42). However, Mohatt et al (25) reported that in clinical lung tumour
cases with displacements ranging between 0.1 and 2.2 cm, the MIP
plan typically underestimated target volumes and resulted in a PTV
ratio of 0.95±0.15. When tumours were located close to the chest
wall, MIP images were more easily affected by the surrounding
structures with high or equal density, including the cartilage
tissues and muscles, compared with AIP images (22,27).
Park et al (43) reported
that the MIP plan was markedly different from the ten-phase fusion
plan when breathing was irregular or a tumour was close to
similar-density tissues. However, in the present study, no marked
dosimetric difference was observed between the MIP and AIP plans,
which could be attributed to the fact that breast tissue movements
are less sensitive to breathing; therefore, the impact of MIP
images caused by surrounding structures was low.
In addition to improving the sparing of the C-B,
another objective of breast radiotherapy is to decrease the
irradiation dose and volume of the heart and bilateral lungs. In
the present study, for the I-L, marked differences were identified
in volumes (including the total volume, V30,
V20, V10 and
V5) among the five plans (3D-CT, T00, T50, MIP
and AIP). Additionally, volumes of the T00 plan were the highest,
followed by the 3D-CT and AIP plans, and those of the T50 and MIP
plans were the lowest. For the C-L, total volumes of the MIP plan
were markedly lower compared with those of the 3D-CT, AIP and T00
plans, and total volumes of the T00 plan were higher compared with
those of the T50 plan. Whether in the I-L or C-L, no statistical
difference of dosage was observed among the five plans, indicating
that in free breathing, although no apparent breast displacements
occurred between the two extreme respiratory phases, the
sufficiently apparent difference of bilateral lungs volumes
resulting from thoracic movements were easily observed. Total
volumes of the lungs in the MIP plan were easily affected by the
surrounding structures with high or equal density (22,27),
which induced smaller volumes in the MIP plan compared with others
and then induced the smallest V30,
V20, V10 and
V5. Therefore, the present study could not
completely establish that the MIP plan is superior to the others.
For the heart, dosimetric parameters of plans are affected not only
by respiratory movements but also by their own rhythm. In the
present study, whether breast lesions were in the right or left
side, heart volumes of the MIP and AIP plans were slightly higher
compared with that of the 3D-CT plan, with no marked differences in
dose among the 3D-CT, MIP and AIP plans. However, for hearts of
patients with lesions in the left breast, V40 and
V30 of the MIP and AIP plans were slightly lower
compared with that of the 3D-CT plan. These results indicated that
the MIP and AIP plans may improve sparing of the heart, particualy
lesions in the left side, and the I-L. However, Bedi et al
(36) reported that dosimetric
results for the heart and the I-L exhibited no statistically
significant differences between the 3D-CT and 4D-CT plans for
patients with left-sided breast cancer, and that improved sparing
of the heart and the lungs could only be attained by decreasing the
posterior margins of the breast target volumes. For contralateral
and ipsilateral humeral heads, no marked differences were observed
in dose parameters between the 3D-CT and 4D-CT plans as humeral
heads were far away from the targets and could not be affected by
therapy plans.
In conclusion, for whole breast radiotherapy of
breast cancer with residual tissues (including postoperative
radiotherapy, neoadjuvant radiotherapy and palliative
radiotherapy), 4D-CT radiotherapy techniques based on the MIP and
AIP plans provide a slightly smaller radiation area and slightly
higher radiotherapy dosage of the CTV and PTV compared with 3D-CT
radiotherapy. For the C-B, the dose distribution in the MIP and AIP
plans is better compared with the 3D-CT plan; therefore, MIP and
AIP plans prevent and reduce radiation exposure to normal breast.
The MIP and AIP plans also improve sparing of the heart
(particularly breast lesions in the left side) and the I-L.
Furthermore, the dosimetric differences between the MIP and AIP
plans are not significant. Therefore, these plans are worth
considering for whole breast radiotherapy.
Acknowledgements
Not applicable.
Funding
The present study was supported by the National
Natural Science Foundations of China (grant nos. 81772793/H1621,
31201060/C0709, 30973175/C1701 and 81172490/H1621), Programme for
New Century Excellent Talents in University (grant no.
NCET-12-0440), Scientific and Technological Research Foundation of
Shaanxi Province (grant no. 2012K13-01-06), Research Foundation of
Health Department of Shaanxi Province (grant no. 2010D41), Qing
Nian Jiao Shi Gen Zong Ji Hua of Xi'an Jiaotong University (‘The
Fundamental Research Funds for the Central Universities’ awarded to
to JR) and the Clinical Research Award of the First Affiliated
Hospital of Xi'an Jiaotong University (grant no.
XJTU1AHCR2014-041).
Availability of data and materials
All data generated or analysed during the present
study are included in this published article.
Authors' contributions
YY delineated the target area, performed the data
analysis and drafted the manuscript. ZLu, ZLi and WL participated
in the experiments, and performed the radiation plan and reviewing.
SS, LT, XM, JL and ED participated in data collection and reviewed
the manuscript. JR participated in experimental design,
experimental operation, helped to draft the manuscript and approved
the final version of the manuscript to be published.
Ethics approval and consent to
participate
The present study was approved by the Ethics
Committee of First Affiliated Hospital of Xi'an Jiaotong University
(Xi'an, China; approval no. 2015-101). Written informed consent was
obtained from all participants.
Patient consent for publication
Not applicable.
Competing interests
The authors declare that they have no competing
interests.
References
|
1
|
Kunkler IH, Williams LJ, Jack WJ, Cameron
DA and Dixon JM; PRIME II investigators, : Breast-conserving
surgery with or without irradiation in women aged 65 years or older
with early breast cancer (PRIME II): A randomised controlled trial.
Lancet Oncol. 16:266–273. 2015. View Article : Google Scholar : PubMed/NCBI
|
|
2
|
Chan TY, Tan PW and Tang JI:
Intensity-modulated radiation therapy for early-stage breast
cancer: Is it ready for prime time? Breast Cancer (Dove Med Press).
9:177–183. 2017.PubMed/NCBI
|
|
3
|
Keller LM, Sopka DM, Li T, Klayton T, Li
J, Anderson PR, Bleicher RJ, Sigurdson ER and Freedman GM:
Five-year results of whole breast intensity modulated radiation
therapy for the treatment of early stage breast cancer: The fox
chase cancer center experience. Int J Radiat Oncol. 84:881–887.
2012. View Article : Google Scholar
|
|
4
|
Castaneda SA and Strasser J: Updates in
the treatment of breast cancer with radiotherapy. Surg Oncol Clin N
Am. 26:371–382. 2017. View Article : Google Scholar : PubMed/NCBI
|
|
5
|
Poleszczuk J, Luddy K, Chen L, Lee JK,
Harrison LB, Czerniecki BJ, Soliman H and Enderling H: Neoadjuvant
radiotherapy of early-stage breast cancer and long-term
disease-free survival. Breast Cancer Res. 19:752017. View Article : Google Scholar : PubMed/NCBI
|
|
6
|
Coelho RC, Da Silva FDML, Do Carmo IML,
Bonaccorsi BV and Faroni LD: Neoadjuvant radiotherapy in locally
advanced breast cancer refractory to chemotherapy-a single
institution experience in Brazil. Ann Oncol. 26:30–31. 2015.
View Article : Google Scholar
|
|
7
|
Maher M, Campana F, Mosseri V, Dreyfus H,
Vilcoq JR, Gautier C, Asselain B and Fourquet A: Breast-cancer in
elderly women: A retrospective analysis of combined treatment with
tamoxifen and once-weekly irradiation. Int J Radiat Oncol Biol
Phys. 31:783–789. 1995. View Article : Google Scholar : PubMed/NCBI
|
|
8
|
Fakie N: Advanced breast cancer: A
retrospective review comparing two palliative radiotherapy
protocols used at Groote Schuur Hospital between 2010 and 2013.
University of Cape Town; 2016
|
|
9
|
Wu G, Lian J and Shen D: Improving
image-guided radiation therapy of lung cancer by reconstructing
4D-CT from a single free-breathing 3D-CT on the treatment day. Med
Phys. 39:7694–7709. 2012. View Article : Google Scholar : PubMed/NCBI
|
|
10
|
Tan Z, Liu C, Zhou Y and Shen W:
Preliminary comparison of the registration effect of 4D-CBCT and
3D-CBCT in image-guided radiotherapy of stage IA non-small-cell
lung cancer. J Radiat Res. 58:854–861. 2017. View Article : Google Scholar : PubMed/NCBI
|
|
11
|
Low D: 4D imaging and 4D radiation
therapy: A new era of therapy design and delivery. Front Radiat
Ther Oncol. 43:99–117. 2011. View Article : Google Scholar : PubMed/NCBI
|
|
12
|
Wang JZ, Li JB, Qi HP, Li YK, Wang Y,
Zhang YJ and Wang W: Effect of contrast enhancement in delineating
GTV and constructing IGTV of thoracic oesophageal cancer based on
4D-CT scans. Radiother Oncol. 119:172–178. 2016. View Article : Google Scholar : PubMed/NCBI
|
|
13
|
Li F, Li J, Xing J, Zhang Y, Fan T, Xu M,
Shang D, Liu T and Song J: Analysis of the advantage of individual
PTVs defined on axial 3D CT and 4D CT images for liver cancer. J
Appl Clin Med Phys. 13:40172012. View Article : Google Scholar : PubMed/NCBI
|
|
14
|
Huang TC, Hsiao CY, Chien CR, Liang JA,
Shih TC and Zhang GG: IMRT treatment plans and functional planning
with functional lung imaging from 4D-CT for thoracic cancer
patients. Radiat Oncol. 8:32013. View Article : Google Scholar : PubMed/NCBI
|
|
15
|
Hoang JK, Reiman RE, Nguyen GB, Januzis N,
Chin BB, Lowry C and Yoshizumi TT: Lifetime attributable risk of
cancer from radiation exposure during parathyroid imaging:
Comparison of 4D CT and parathyroid scintigraphy. AJR Am J
Roentgenol. 204:W579–W585. 2015. View Article : Google Scholar : PubMed/NCBI
|
|
16
|
Ding Y, Li J, Wang W, Wang S, Fan T, Xu M,
Shao Q and Ma Z: Displacement of the lumpectomy cavity defined by
surgical clips and seroma based on 4D-CT scan for external-beam
partial breast irradiation after breast-conserving surgery: A
comparative study. Br J Radiol. 86:201304162013. View Article : Google Scholar : PubMed/NCBI
|
|
17
|
Zhang S, Lin S, Yu H, Zhang H, Zhang G and
Han P: Application of AIP and MIP CT on individual GTV delineation
for tumor moving with respiration. International conference on
biomedical engineering and biotechnology. 736–739. 2012.
|
|
18
|
Park CK, Pritz J, Zhang GG, Forster KM and
Harris EE: Validating fiducial markers for image-guided radiation
therapy for accelerated partial breast irradiation in early-stage
breast cancer. Int J Radiat Oncol Biol Phys. 82:e425–e431. 2012.
View Article : Google Scholar : PubMed/NCBI
|
|
19
|
Wang S, Li J, Wang W, Zhang Y, Li F, Fan T
and Shang D: A study on the displacements of the clips in surgical
cavity for external-beam partial breast irradiation after
breast-conserving surgery based on 4DCT. J Radiat Res. 53:433–438.
2012. View Article : Google Scholar : PubMed/NCBI
|
|
20
|
Bradley JD, Nofal AN, El Naqa IM, Lu W,
Liu J, Hubenschmidt J, Low DA, Drzymala RE and Khullar D:
Comparison of helical, maximum intensity projection (MIP), and
averaged intensity (AI) 4D CT imaging for stereotactic body
radiation therapy (SBRT) planning in lung cancer. Radiother Oncol.
81:264–268. 2006. View Article : Google Scholar : PubMed/NCBI
|
|
21
|
Ezhil M, Vedam S, Balter P, Choi B,
Mirkovic D, Starkschall G and Chang JY: Determination of
patient-specific internal gross tumor volumes for lung cancer using
four-dimensional computed tomography. Radiat Oncol. 4:42009.
View Article : Google Scholar : PubMed/NCBI
|
|
22
|
Pan T, Sun X and Luo D: Improvement of the
cine-CT based 4D-CT imaging. Med Phys. 34:4499–4503. 2007.
View Article : Google Scholar : PubMed/NCBI
|
|
23
|
Lee SY, Lim S, Ma SY and Yu J: Gross tumor
volume dependency on phase sorting methods of four-dimensional
computed tomography images for lung cancer. Radiat Oncol J.
35:274–280. 2017. View Article : Google Scholar : PubMed/NCBI
|
|
24
|
Han CH, Sampath S, Schultheisss TE and
Wong JYC: Variations of target volume definition and daily target
volume localization in stereotactic body radiotherapy for
early-stage non-small cell lung cancer patients under abdominal
compression. Med Dosim. 42:116–121. 2017. View Article : Google Scholar : PubMed/NCBI
|
|
25
|
Mohatt DJ, Keim JM, Greene MC, Patel-Yadav
A, Gomez JA and Malhotra HK: An investigation into the range
dependence of target delineation strategies for stereotactic lung
radiotherapy. Radiat Oncol. 12:1662017. View Article : Google Scholar : PubMed/NCBI
|
|
26
|
Khamfongkhruea C, Thongsawad S, Tannanonta
C and Chamchod S: Comparison of CT images with average intensity
projection, free breathing, and mid-ventilation for dose
calculation in lung cancer. J Appl Clin Med Phys. 18:26–36. 2017.
View Article : Google Scholar : PubMed/NCBI
|
|
27
|
Zhao L, Sandison GA, Farr JB, Hsi WC and
Li XA: Dosimetric impact of intrafraction motion for
compensator-based proton therapy of lung cancer. Phys Med Biol.
53:3343–3364. 2008. View Article : Google Scholar : PubMed/NCBI
|
|
28
|
Simon L, Giraud P, Servois V and Rosenwald
JC: Initial evaluation of a four-dimensional computed tomography
system, using a programmable motor. J Appl Clin Med Phys. 7:50–65.
2006. View Article : Google Scholar : PubMed/NCBI
|
|
29
|
Deseyne P, Speleers B, De Neve W, Boute B,
Paelinck L, Van Hoof T, Van de Velde J, Van Greveling A, Monten C,
Post G, et al: Whole breast and regional nodal irradiation in prone
versus supine position in left sided breast cancer. Radiat Oncol.
12:892017. View Article : Google Scholar : PubMed/NCBI
|
|
30
|
Yin L, Wu H, Gong J, Geng JH, Jiang F, Shi
AH, Yu R, Li YH, Han SK, Xu B and Zhu GY: Volumetric-modulated arc
therapy vs. c-IMRT in esophageal cancer: A treatment planning
comparison. World J Gastroenterol. 18:5266–5275. 2012.PubMed/NCBI
|
|
31
|
Salimi M, Abi KST, Nedaie HA, Hassani H,
Gharaati H, Samei M, Shahi R and Zarei H: Assessment and comparison
of homogeneity and conformity indexes in step-and-shoot and
compensator-based intensity modulated radiation therapy (IMRT) and
Three-dimensional conformal radiation therapy (3D CRT) in prostate
cancer. J Med Signals Sens. 7:102–107. 2017.PubMed/NCBI
|
|
32
|
Lee JH, Eubank WB and Mankoff DA: Breast
Cancer. Nuclear Oncology. Strauss H, Mariani G, Volterrani D and
Larson S: Springer; New York, NY: pp. 363–382. 2013, View Article : Google Scholar
|
|
33
|
Xing J, Li JB, Zhang YJ, Li FX, Fan TY, Xu
M, Shang DP and Han JJ: Comparison of three methods to delineate
internal gross target volume of the primary hepatocarcinoma based
on four-dimensional CT simulation images. Zhonghua Zhong Liu Za
Zhi. 34:122–128. 2012.(In Chinese). PubMed/NCBI
|
|
34
|
Richter A, Sweeney R, Baier K, Flentje M
and Guckenberger M: Effect of breathing motion in radiotherapy of
breast cancer: 4D dose calculation and motion tracking via EPID.
Strahlenther Onkol. 185:425–430. 2009. View Article : Google Scholar : PubMed/NCBI
|
|
35
|
Persson GF, Nygaard DE, Munck Af
Rosenschöld P, Richter Vogelius I, Josipovic M, Specht L and
Korreman SS: Artifacts in conventional computed tomography (CT) and
free breathing four-dimensional CT induce uncertainty in gross
tumor volume determination. Int J Radiat Oncol Biol Phys.
80:1573–1580. 2011. View Article : Google Scholar : PubMed/NCBI
|
|
36
|
Bedi C, Kron T, Willis D, Hubbard P,
Milner A and Chua B: Comparison of radiotherapy treatment plans for
left-sided breast cancer patients based on three- and
four-dimensional computed tomography imaging. Clin Oncol (R Coll
Radiol). 23:601–607. 2011. View Article : Google Scholar : PubMed/NCBI
|
|
37
|
Frazier RC, Vicini FA, Sharpe MB, Yan D,
Fayad J, Baglan KL, Kestin LL, Remouchamps VM, Martinez AA and Wong
JW: Impact of breathing motion on whole breast radiotherapy: A
dosimetric analysis using active breathing control. Int J Radiat
Oncol Biol Phys. 58:1041–1047. 2004. View Article : Google Scholar : PubMed/NCBI
|
|
38
|
Ding MS, Li JS, Deng J, Fourkal E and Ma
CM: Dose correlation for thoracic motion in radiation therapy of
breast cancer. Med Phys. 30:2520–2529. 2003. View Article : Google Scholar : PubMed/NCBI
|
|
39
|
Yue NJ, Li X, Beriwal S, Heron DE, Sontag
MR and Huq MS: The intrafraction motion induced dosimetric impacts
in breast 3D radiation treatment: A 4DCT based study. Med Phys.
34:2789–2800. 2007. View Article : Google Scholar : PubMed/NCBI
|
|
40
|
Luxton G, Hancock SL and Boyer AL:
Dosimetry and radiobiologic model comparison of IMRT and 3D
conformal radiotherapy in treatment of carcinoma of the prostate.
Int J Radiat Oncol. 59:267–284. 2004. View Article : Google Scholar
|
|
41
|
Fisher J, Scott C, Stevens R, Marconi B,
Champion L, Freedman GM, Asrari F, Pilepich MV, Gagnon JD and Wong
G: Randomized phase III study comparing Best Supportive Care to
Biafine as a prophylactic agent for radiation-induced skin toxicity
for women undergoing breast irradiation: Radiation therapy oncology
group (RTOG) 97–13. Int J Radiat Oncol. 48:1307–1310. 2000.
View Article : Google Scholar
|
|
42
|
Cai J, Read PW and Sheng K: The effect of
respiratory motion variability and tumor size on the accuracy of
average intensity projection from four-dimensional computed
tomography: An investigation based on dynamic MRI. Med Phys.
35:4974–4981. 2008. View Article : Google Scholar : PubMed/NCBI
|
|
43
|
Park K, Huang L, Gagne H and Papiez L: Do
Maximum Intensity Projection Images Truly Capture Tumor Motion? Int
J Radiat Oncol Biol Phys. 73:618–625. 2009. View Article : Google Scholar : PubMed/NCBI
|