Introduction
Colorectal cancer (CRC) is the third most commonly
diagnosed cancer and the leading cause of cancer-associated
mortality worldwide (1). Traditional
chemotherapy remains one of the standard treatments of CRC. In
particular, oxaliplatin plus 5-fluorouracil (5-FU)-based regimens,
also known as FOLFOX, XELOX and SOX, are the first-line
chemotherapy regimens for patients with advanced CRC (aCRC);
however, the objective response rate of this regimen is estimated
to be ~50% (2). In addition,
numerous patients with CRC cannot benefit from chemotherapy due to
intrinsic or acquired chemotherapy resistance (3). It is therefore difficult for
oncologists to select the most suitable regimens for patients with
CRC. Determining effective and distinct biomarkers to characterize
patients who are intrinsically resistant to oxaliplatin plus 5-FU
regimens would have a significant influence in clinical
practice.
Several tumor molecular markers that can predict the
efficacy of 5-FU or oxaliplatin have been reported, including DNA
damage repair system genes, auch as X-ray repair cross
complementing 1 (4), ERCC excision
repair 1, endonuclease non-catalytic subunit (5) and ERCC excision repair 5 endonuclease
(6), certain key enzymes in the
chemotherapy-associated signaling pathway, such as thymidylate
synthase (7), and other molecules,
such as NKx2-3 and transforming growth factor-β1-induced transcript
1 (8), homeobox B8 and kallikrein
related-peptidase 11 (9). However,
the predictive value of a single molecular marker is limited due to
the participation of multiple genes and proteins, rather than a
single gene or protein, in the process of drug resistance. It is
therefore crucial to detect multiple genes and proteins, and
establish a predictive model that could determine the efficacy and
accuracy of the oxaliplatin plus 5-FU regimen in patients with aCRC
rather than using the predictive value of one molecular marker only
(10).
Previous studies reported that carcinoma-associated
fibroblasts (CAFs) are a pivotal part of the tumor microenvironment
and serve a crucial role in tumor drug resistance.
Gonçalves-Ribeiro et al (11)
reported that CAFs have a protective effect on CRC cells and could
be associated with chemotherapy resistance in patients with CRC.
Furthermore, CAFs can induce the translocation of AKT, survivin and
ERK to the nucleus of CRC cells, induce AKT and ERK
phosphorylation, and upregulate survivin expression. These
phenomena ensure correct DNA repair and accurate cell entrance and
exit from mitosis in the presence of chemotherapy. Oxaliplatin plus
5-FU regimen resistance is subsequently induced via the activation
of the PI3K/AKT, MAPK and Janus kinase/signal transducer and
activator of transcription (JAK-STAT) signaling pathways. In
addition, it has been reported that the MAPK (12–14) and
PI3K/AKT/mTOR (15–18) pathways serve key roles in drug
resistance, notably in CRC, and that PI3K/AKT signaling pathway
inhibition can reduce resistance to chemotherapeutic drugs. It was
also reported that survivin overexpression, which may be a
downstream effect of the MAPK or PI3K-AKT-mTOR signaling pathway
(19), is associated with drug
resistance in CRC. As all these findings focus on cellular and
molecular approaches, it is essential to verify whether they exist
in patients with CRC. The present study therefore investigated the
association between α-SMA, p-AKT, p-ERK and survivin expression and
oxaliplatin plus 5-FU chemotherapy efficacy in patients with aCRC.
Since chemotherapy resistance is a multifactorial process, the
present study aimed to establish a predictive model that could help
oncologists to screen patients with intrinsic resistance to
chemotherapeutic drugs.
Materials and methods
Patients and tissue samples
A total of 71 patients diagnosed with aCRC at the
Peking Union Medical College Hospital (Beijing, China) between June
2013 and February 2018 were enrolled in the present study. Tissue
samples were obtained from patients following radical CRC resection
or biopsy during colonoscopy. All patients provided written
informed consent. The inclusion criteria were as follows: i) All
patients were histologically diagnosed with aCRC and cancer stage
was evaluated according to the American Joint Committee on Cancer,
7th edition (20); ii) all patients
received oxaliplatin plus 5-FU regimens in accordance with the
National Comprehensive Cancer Network guideline (21), including mFOLFOX6, which consisted of
85 mg/m2 oxaliplatin on day 1, 400 mg/m2
leucovorin on day 1, 400 mg/m2 intravenous (IV) bolus
5-FU on day 1, and then 1,200 mg/m2/day for 48 h by
continuous IV infusion, repeating every 2 weeks and evaluated every
4 cycles using the Response Evaluation Criteria in Solid Tumors
(RECIST 1.1) (22), or XELOX, which
consists of 130 mg/m2 IV oxaliplatin on day 1 and 1,000
mg/m2 oral capecitabine twice daily for 14 days,
repeating every 3 weeks and evaluated every 2–3 cycles using
RECIST; iii) non-responders to chemotherapy (NRCs) included
patients with stage IV CRC who received first-line chemotherapy and
were identified as having progressive disease when evaluated the
first time (after 4 cycles of mFOLFOX6 or 2–3 cycles of XELOX), and
patients with stage III CRC who received adjuvant chemotherapy
following surgery and who relapsed within 6 months. Chemotherapy
responders (CRs) referred to patients with stage IV CRC who
received first-line chemotherapy and who were evaluated with
partial regression or complete regression at most. The chemotherapy
responses were evaluated independently in all patients by two
oncologists using RECIST. If their conclusions were different, a
third oncologist independently evaluated the case, and the three
oncologists consulted and obtained the final result together.
Patients with CRC who were identified as stable after chemotherapy
or as progressive disease following the first evaluation were
excluded from the present study.
Immunohistochemistry (IHC) staining
and scoring
IHC staining was performed on 4-µm thick sections of
paraffin-embedded tissue samples to detect the protein expression
levels of α-SMA, p-AKT, p-ERK and survivin. Briefly, sections were
deparaffinized with xylene, rehydrated in decreasing gradient of
alcohol and immersed in distilled water for 5 min. Sections were
then incubated with EDTA antigen retrieval buffer (pH 8.0) in a
microwave for 15 min. Sections were treated with 3% hydrogen
peroxide for 25 min at room temperature in the dark to block
endogenous peroxidase activity, washed with PBS three times for 5
min and blocked with 3% bovine serum albumin at room temperature
for 30 min. Sections were incubated with the following primary
antibodies at 4°C overnight: Mouse anti-human α-SMA (cat. no.
GB13044, 1:1,000; Servicebio), mouse anti-human p-ERK (cat. no.
GB13004; 1:1,000; Servicebio), rabbit anti-human p-AKT (cat. no.
GB13012-3; 1:100; Servicebio) and rabbit anti-human survivin (cat.
no. 10508-1-AP; 1:100; ProteinTech Group, Inc.). Sections were then
incubated with goat anti-mouse secondary antibody (cat. no.
GB23301; 1:200; Servicebio; Startech) or goat anti-rabbit secondary
antibody (cat. no. GB13044; 1:1,000; Servicebio; Startech) at room
temperature for 50 min. Sections were developed using
3,3′-diaminobenzidine and counterstained with hematoxylin at room
temperature for 5 min. Images were captured under light
microscopy.
All slides were independently evaluated by two
pathologists who had no knowledge of the clinical information. If
their conclusions were different, a third pathologist independently
evaluated the case, and the three pathologists discussed and
obtained the final result together. Positive α-SMA expression was
localized in the cytoplasm of CAFs; positive survivin expression
was localized in the cytoplasm of CRC cells; positive p-AKT and
p-ERK expression was localized in the nucleus of CRC cells due to
AKT and ERK nuclear translocation. The staining intensity of α-SMA
expression was visually scored and classified as follows: 0, no
staining; 1, light brown staining; and 2, brown staining. The
proportion of cells positively stained for α-SMA was graded as
follows: 0, no positively stained CAFs/total CAFs in high-power
fields (HPFs); 1, positively stained CAFs/total CAFs in HPFs
<10%; 2, positively stained CAFs/total CAFs in HPFs between 10
and 50%; and 3, positively stained CAFs/total CAFs in HPFs >50%.
The staining intensity of p-AKT, p-ERK and survivin was visually
scored and classified as follows: 0, no staining; 1, light brown
staining; and 2, brown staining. The proportion of cells positively
stained for p-AKT, p-ERK or survivin was graded as follows: 0, no
positively stained CRC cells/total CRC cells in HPFs; 1, positively
stained CRC cells/total CRC cells in HPFs <10%; 2, positively
stained CRC cells/total CRC cells in HPFs between 10 and 50%; 3,
positively stained CRC cells/total CRC cells in HPFs >50%. The
staining index (SI) of α-SMA, p-AKT, p-ERK and survivin was
calculated as follows: SI = staining intensity × proportion of
positive cells. The results were scored from 0 to 6. Low expression
was defined as an SI of 0 to 2 and high expression was defined as
an SI of 3 to 6 (23).
Follow-up of patient survival
Follow-ups were designed to assess the
progression-free survival (PFS), disease-free survival (DFS) and
overall survival (OS) of the patients. The latest follow-up of the
patients was performed on February 28, 2019.
Data analysis, modeling and
validation
Analysis of data characteristics
Expression levels of α-SMA, p-AKT, survivin and
p-ERK were used as features for this model and scored as 1 or 2
(low and high expression, respectively). First, the accuracy of
these four features as predictive biomarkers for chemotherapy
efficiency in patients with aCRC who were identified as NRCs or CRs
was analyzed. Subsequently, the two features of highest accuracy
were selected, integrated and their accuracy was analyzed. The
selection was then increased to three and four features in order to
analyze the predictive accuracy.
Probabilistic Neural Networks (PNN)
model
An artificial neural network is a type of artificial
intelligence; it has been recently widely used in numerous fields,
including clinical diagnosis, screening and prognosis prediction
(24). As PNNs use the advantages of
a radial basis network and classical probability density estimation
theory, they offer particularly significant advantages in pattern
classification. The PNN classification was therefore used in the
present study as the model for classification problem.
The MATLAB Neural Network tool cabinet provides the
function ‘newpnn’ to create probabilistic neural networks. Assuming
that the input vector is P and the target is T, a two-layer neural
network named ‘net’ can be created by using net = newpnn (P, T,
SPREAD), where P is a matrix of R feature quantities of the input
vector of the Q group, R rows and Q columns, T is a target matrix
of S rows and Q columns composed of Q group classification vectors,
S is a classification number, and S is 2 if it is a class 2
problem. If the sample of the Jth column belongs to the class i,
the element of the Jth column of the ith row of the matrix T is 1,
and the remaining columns of the row are ~0. SPREAD is the
spreading coefficient of the Gaussian radial basis function. The
default value is 0.1. If the SPREAD value is ~0, the created
probabilistic neural network can be used as the nearest neighbor
classifier.
The MATLAB tool cabinet provides the function y=sim
(net, q) by using the probabilistic neural network model created by
newpnn, which predicts the target value y of the input vector q
using the sim function. This function can therefore be used to
verify and check the network model.
The MATLAB tool cabinet also provides the function
plotconfusion (y, T), where y is the target output value predicted
by the network model and T is the known target value for
comparison. In case the target value has only two categories and
the function calculates the predictive values as 0 and 1, this
function will calculate the number of correct samples and false
samples, the accuracy and the error rate.
By using the three functions aforementioned provided
by the MATLAB tool cabinet, the classification problem of
predicting the target value of 1 (NRCs) or 0 (CRs) based on the
four eigenvalues of the provided cases can be accomplished.
The data from the 71 patients were first divided
into two parts as follows: 43 patients were used for modeling and
the remaining 28 were used for prediction. The data from the 43
patients were divided into two parts by 1, 3, 5 …, 2, 4, 6 …, each
of which is 22 lines and 21 lines, and the 22 lines were then
further interlaced to obtain two lines of 11, 11 of which were
combined with 21 rows into a 32-line dataset (74.4% of the total
samples) for modeling, and the remaining 11 patients (25.6% of the
total samples) were used for model validation.
Statistical analysis
The clinical and follow-up data were analyzed using
SPSS 24.0 (IBM Corp.). The χ2 test and Fisher's exact
test were used to assess the association between patient clinical
characteristics and the expression of α-SMA, p-AKT, p-ERK and
survivin. P<0.05 was considered to indicate a statistically
significant difference.
Results
Patient general characteristics
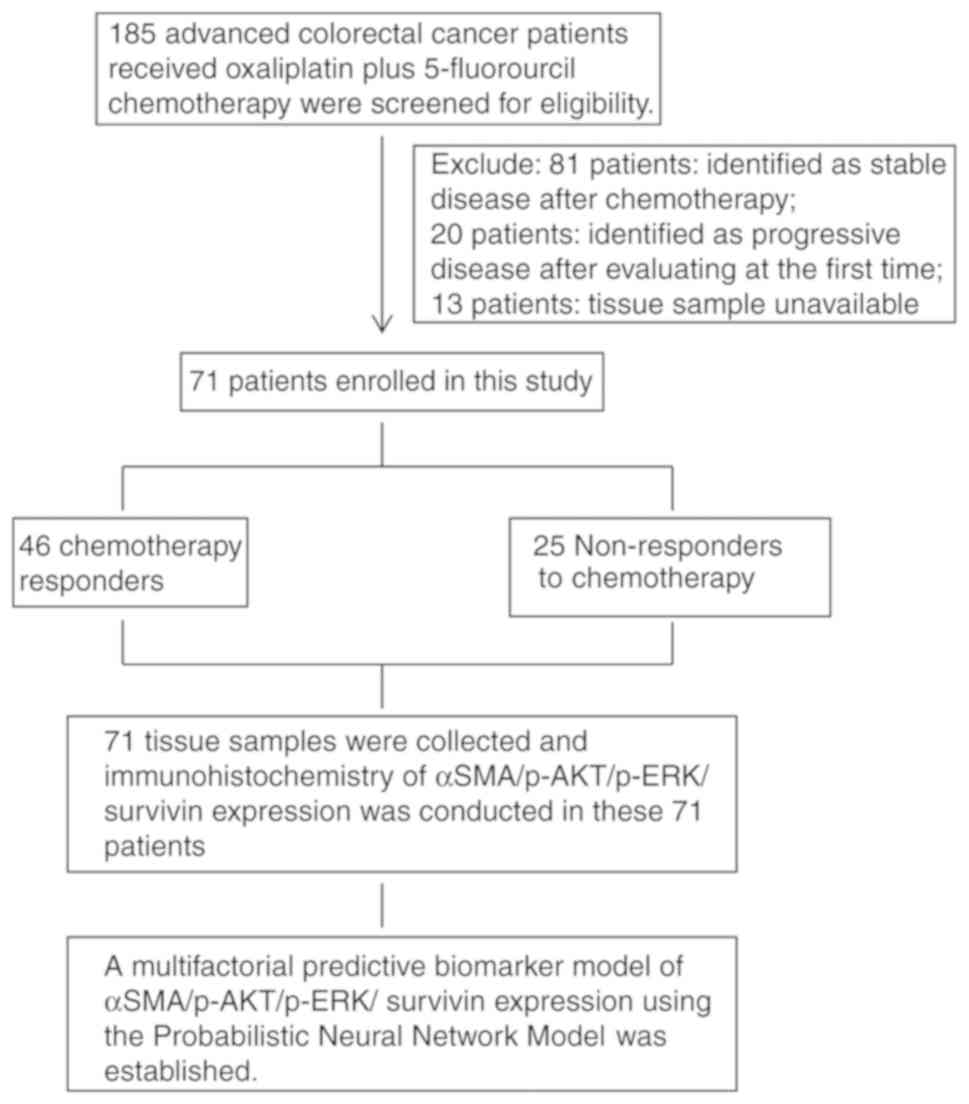
A total of 71 patients with pathologically confirmed
aCRC who received oxaliplatin plus 5-FU chemotherapy were enrolled
in the present study. Amongst them, 26 patients were defined as
NRCs and 45 patients were defined as CRs (Table I). There were 38 men and 33 women,
and the median age of these patients was 62 years old. There was no
significant difference between pathology type or primary tumor
location and the chemotherapy response (P=0.144 and P=0.853,
respectively). A flowchart describing the study design is presented
in Fig. 1.
 | Table I.Clinical and pathological
characteristics of the 71 patients with colorectal cancer who
received oxaliplatin plus 5-fluorouracil chemotherapy and were
classified as responders (n=46) and non-responders (n=25). |
Table I.
Clinical and pathological
characteristics of the 71 patients with colorectal cancer who
received oxaliplatin plus 5-fluorouracil chemotherapy and were
classified as responders (n=46) and non-responders (n=25).
| Patient
characteristics | Number of
patients | Chemotherapy
responders | Non-responders to
chemotherapy | P-value |
|---|
| Sex, n (%) |
|
|
|
|
|
Male | 38 (53.5) | 23 (50.0) | 15 (60.0) | 0.701 |
|
Female | 33 (46.5) | 23 (50.0) | 10 (40.0) |
|
| Mean age,
years | 62 | 62 | 62.5 | 0.163 |
| Pathological type,
n (%) |
|
|
|
|
| Highly
differentiated | 4
(5.6) | 1
(2.2) | 3
(12.0) | 0.144 |
| Middle
differentiated | 52 (73.2) | 34 (73.9) | 18 (72.0) |
|
| Poorly
differentiated | 10 (14.1) | 7 (15.2) | 3
(12.0) |
|
|
Undifferentiated | 5
(7.0) | 4
(8.7) | 1
(4.0) |
|
| Primary location, n
(%) |
|
|
|
|
| Left
colonic carcinoma | 51 (71.8) | 33 (71.7) | 18 (72.0) | 0.853 |
| Right
colonic carcinoma | 17 (23.9) | 11 (23.9) | 6
(24.0) |
|
| Left
and right colonic carcinoma | 3
(4.2) | 2
(4.3) | 1
(4.0) |
|
| α-SMA expression, n
(%) |
|
|
|
|
|
High | 36 (50.7) | 15 (32.6) | 21 (84.0) | <0.001 |
|
Low | 35 (49.3) | 31 (67.4) | 4
(16.0) |
|
| p-AKT expression, n
(%) |
|
|
|
|
|
High | 22 (31.0) | 10 (21.7) | 12 (48.0) | 0.023 |
|
Low | 49 (69.0) | 36 (78.3) | 13 (52.0) |
|
| Survivin
expression, n (%) |
|
|
|
|
|
High | 36 (50.7) | 16 (34.8) | 20 (80.0) | <0.001 |
|
Low | 35 (49.3) | 30 (65.2) | 5
(20.0) |
|
| p-ERK expression, n
(%) |
|
|
|
|
|
High | 23 (32.4) | 13 (28.3) | 10 (40.0) | 0.227 |
|
Low | 48 (67.6) | 33 (71.7) | 15 (60.0) |
|
Association between α-SMA, p-AKT,
p-ERK and survivin expression and the chemotherapy response
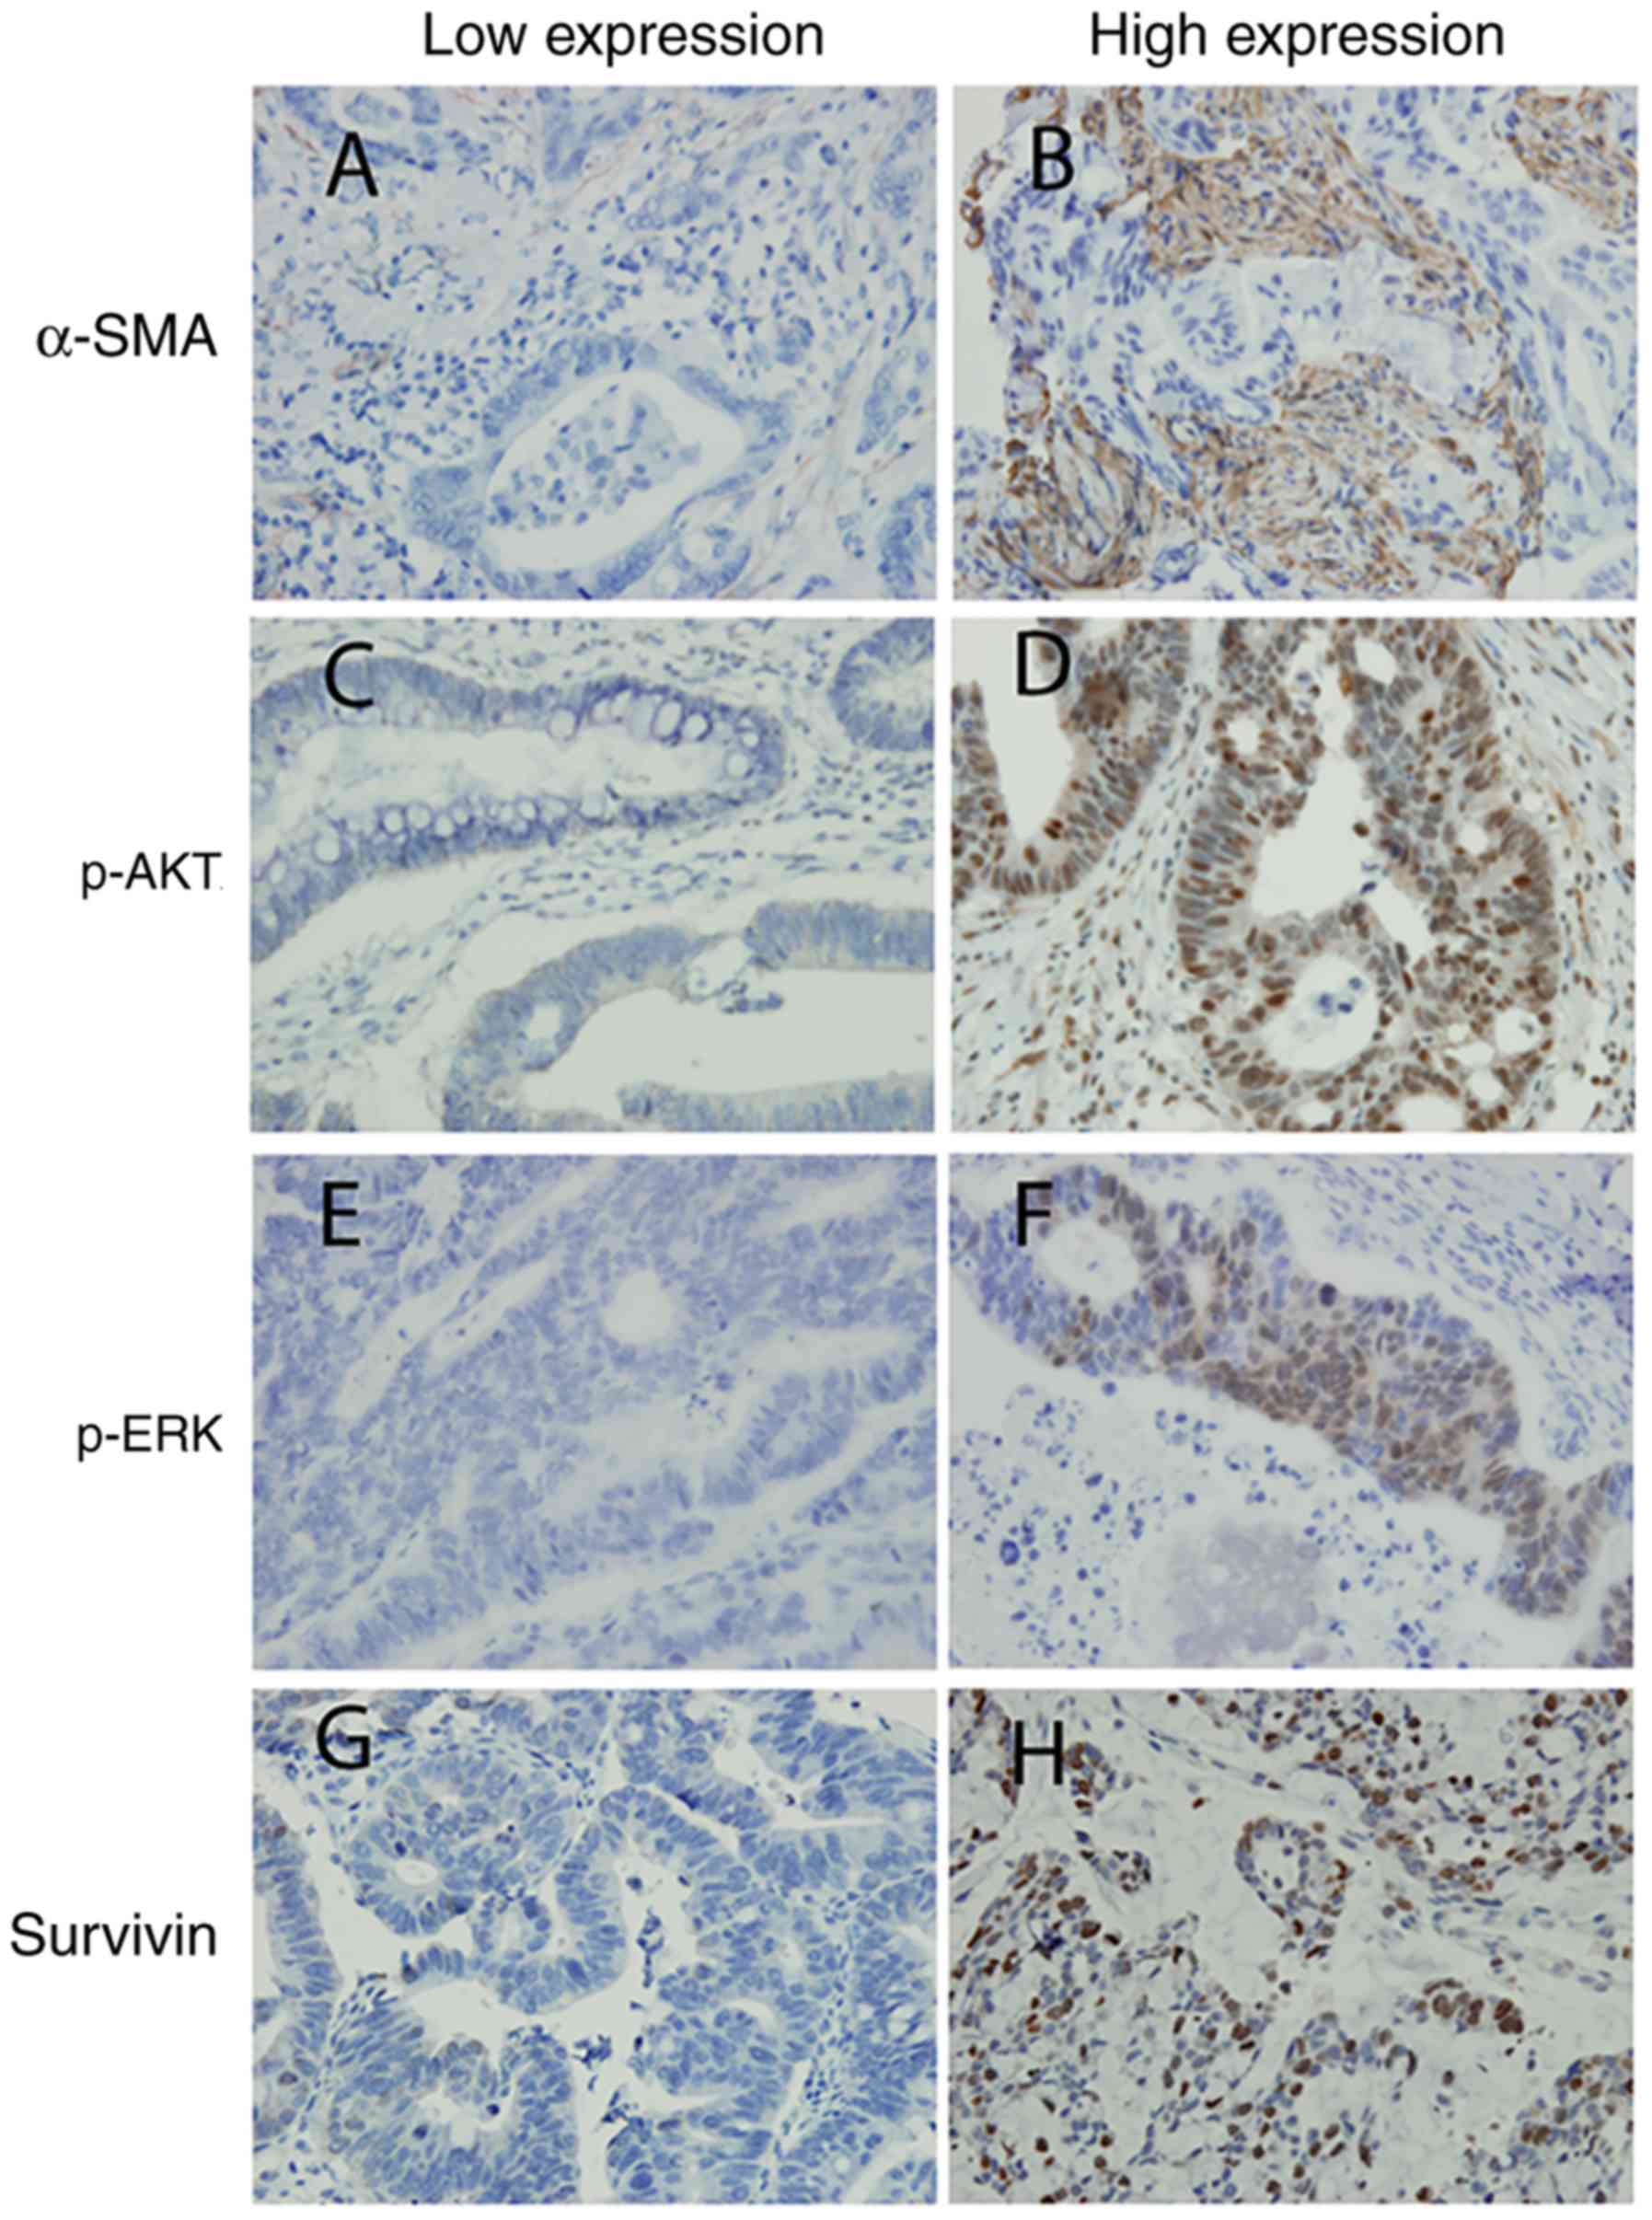
The expression of α-SMA, p-AKT, p-ERK and survivin
was analyzed by IHC in paraffin-embedded specimens from the
patients (Fig. 2). The results
detailed in Table I demonstrated
that the high expression levels of α-SMA, survivin and p-AKT in
patients with CRC were associated with oxaliplatin plus 5-FU
resistance (NCRs; P<0.001, P<0.001 and P=0.023,
respectively). There was no significant difference between p-ERK
expression and chemotherapy response (P=0.227).
Association between α-SMA, p-AKT,
p-ERK and survivin expression and patient PFS, DFS and OS
Among the 71 patients, there were 61 patients
(NRCs:CR ratio, 16:45) with stage IV CRC receiving oxaliplatin and
5-FU as first-line chemotherapy, and 10 patients (NRC:CR ratio,
9:1) with stage III with CRC receiving oxaliplatin and 5-FU as
adjuvant chemotherapy. Since stage IV patients with CRC and stage
III patients with CRC had different prognoses, the association
between PFS, DFS and OS and α-SMA, p-AKT, p-ERK and survivin
expression for these patients were separately analyzed using
Kaplan-Meier curves.
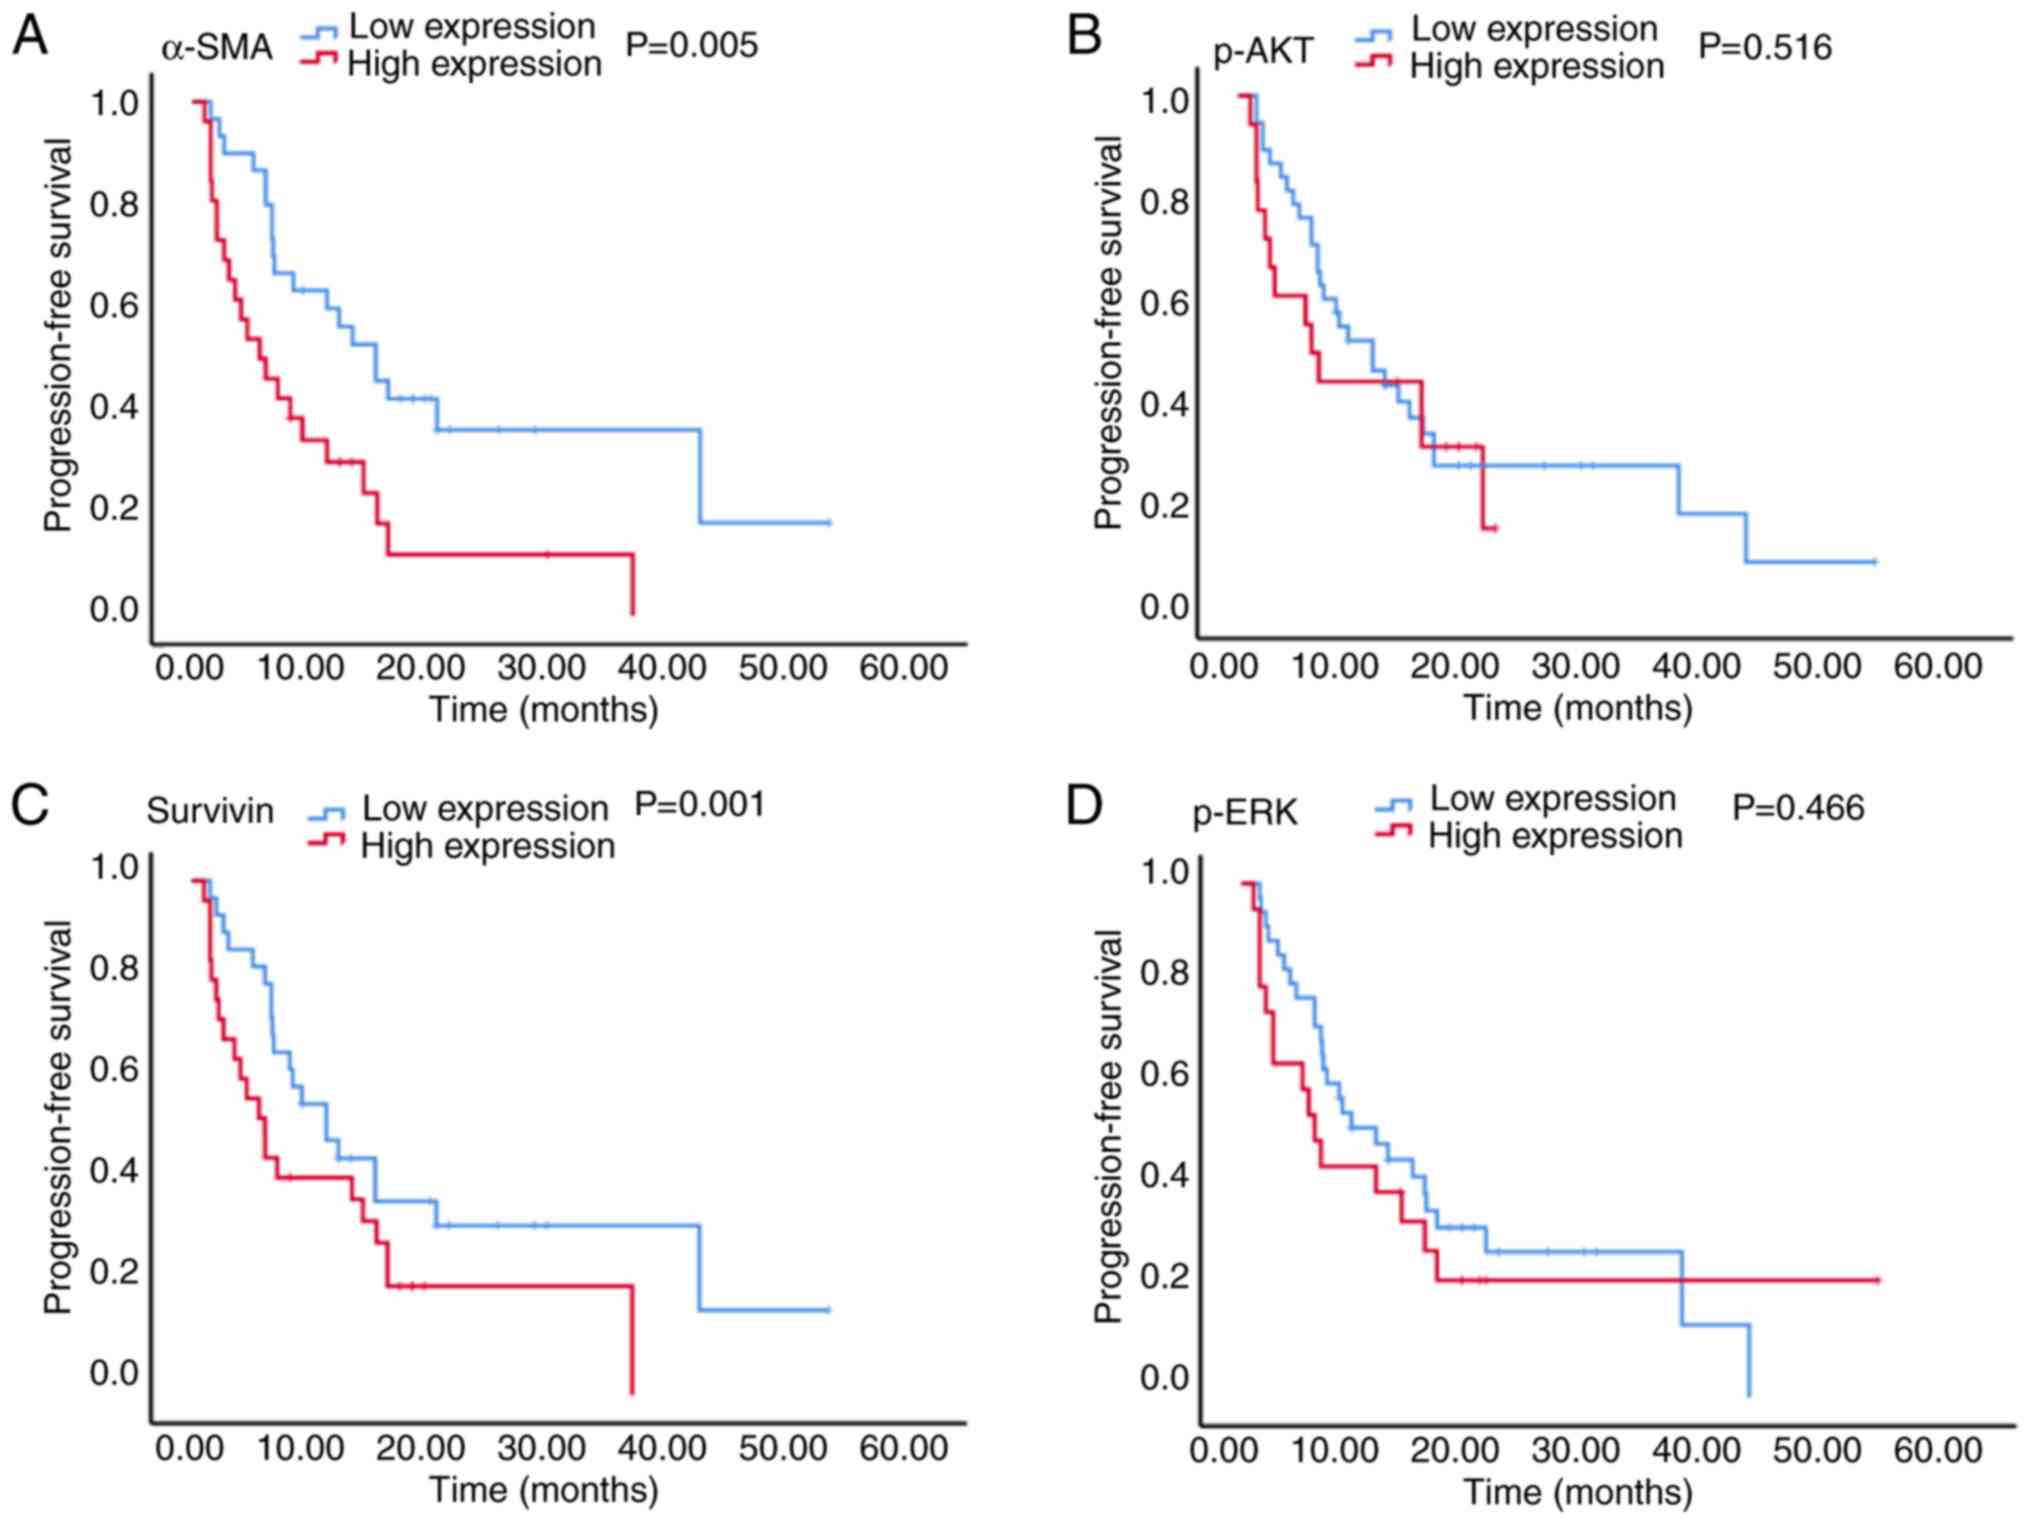
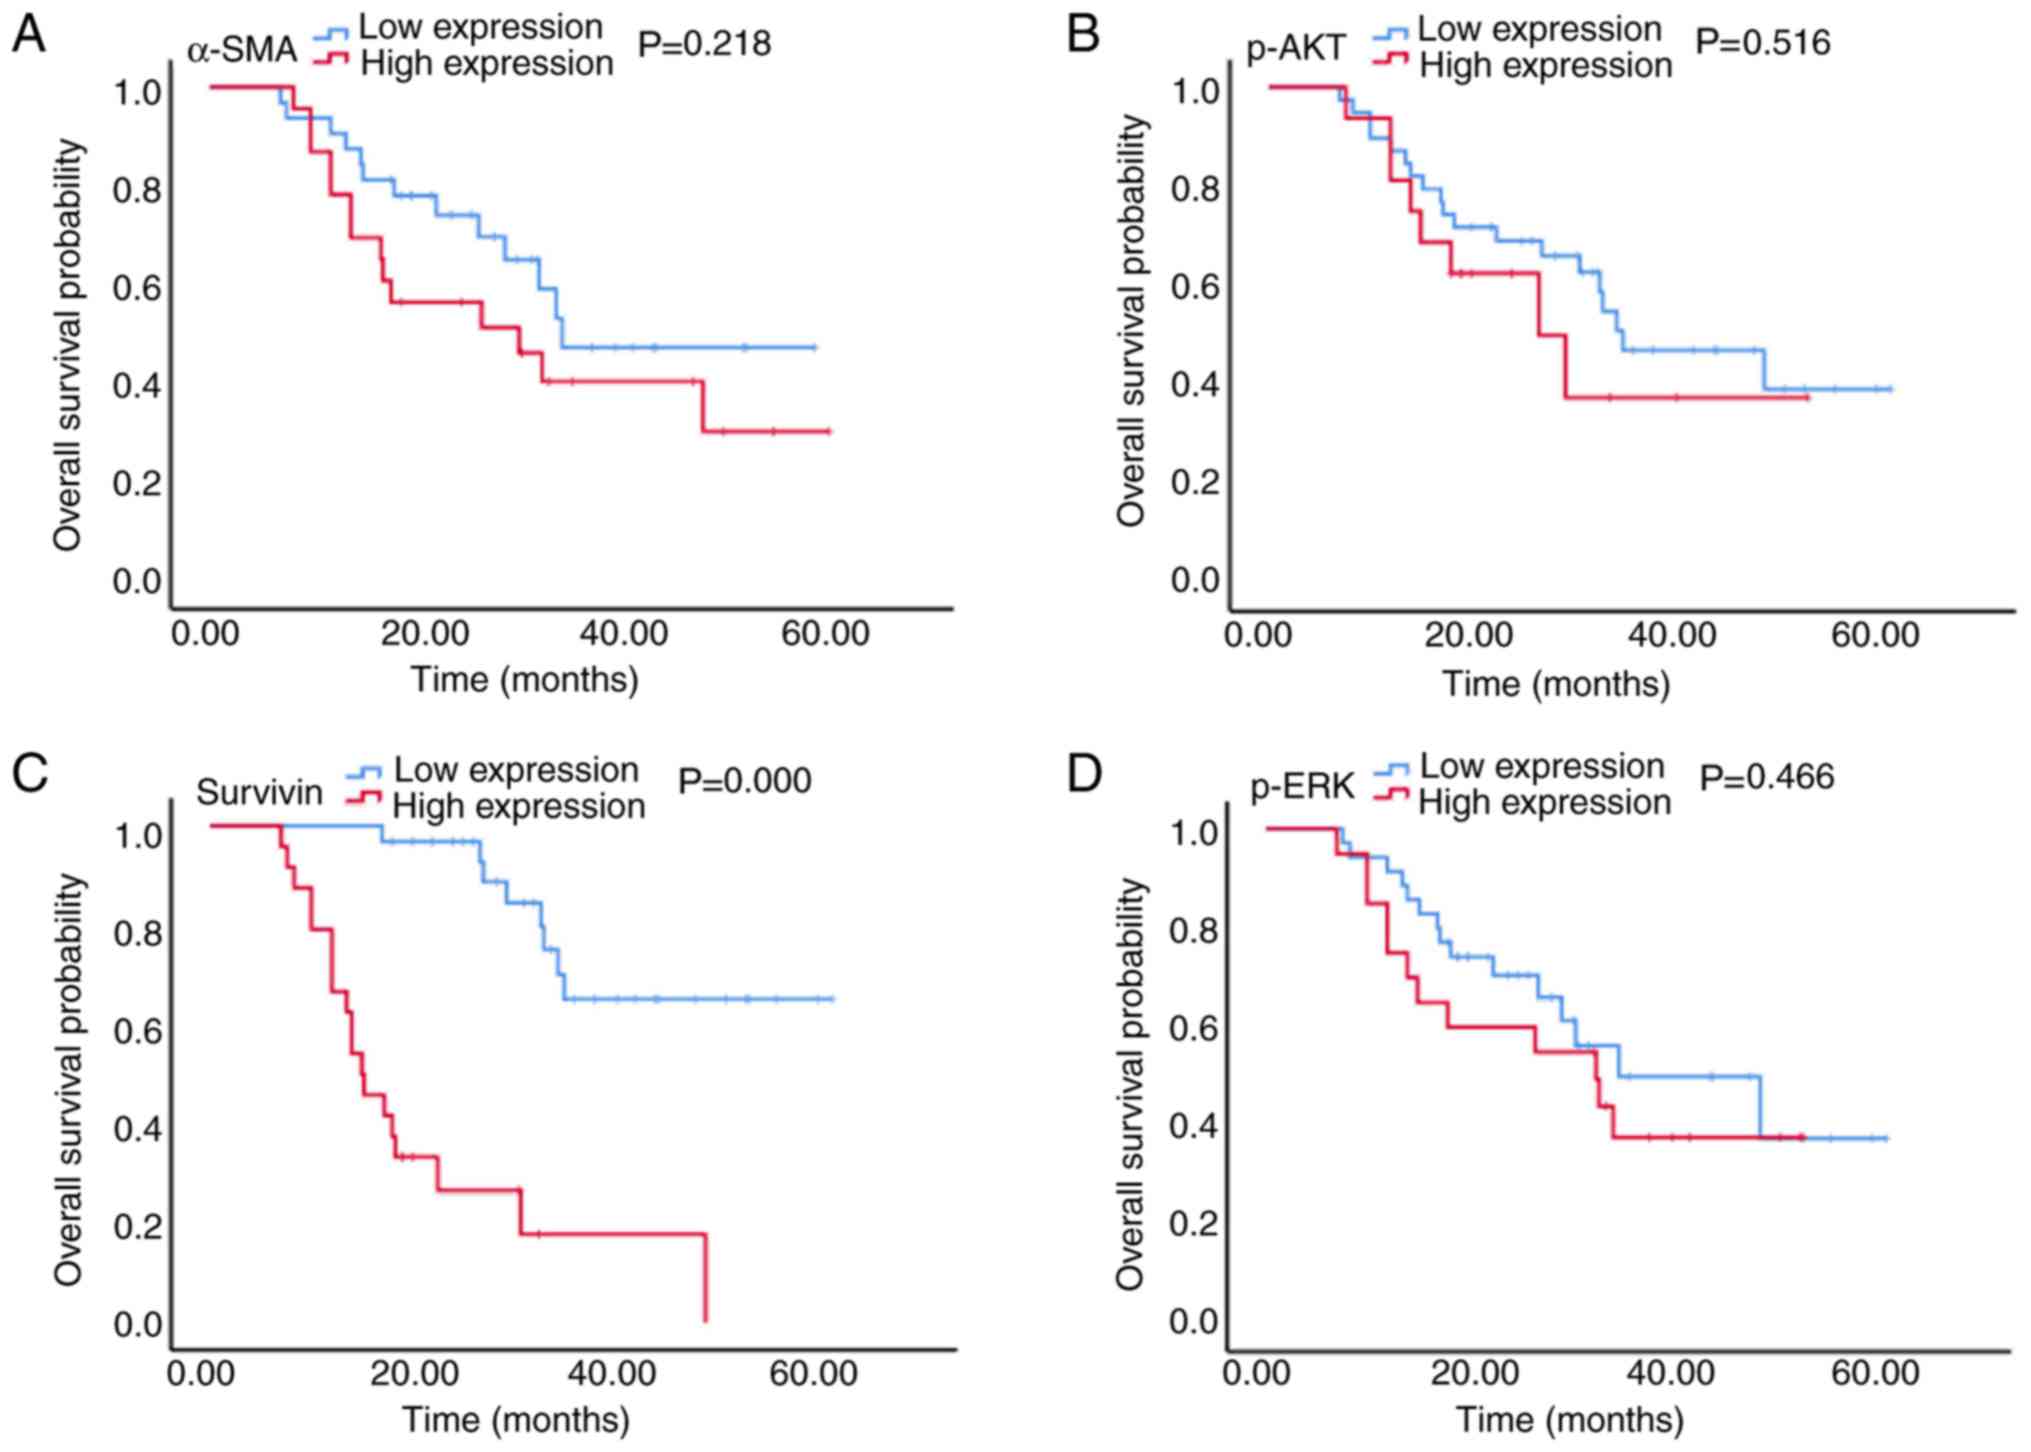
The results presented in Figs. 3 and 4
demonstrated that in patients with stage IV CRC, the high
expression of α-SMA was associated with a significantly reduced PFS
time (5.5 vs. 15.0 months; P=0.005; Fig.
3A), and although a shorter OS time was observed (30.7 vs. 35.0
months; P=0.218; Fig. 4A), this
difference was not statistically significant. Furthermore, high
survivin expression was associated with a significantly reduced PFS
time (5.5 vs. 15.0 months; P=0.001; Fig.
3C) and a significantly reduced OS time (15.0 vs. 50.0 months;
P<0.001; Fig. 4C). There was no
significant association between p-AKT and p-ERK expression and PFS
(6.0 vs. 11.0 months and 6.0 vs. 11.0 months; P=0.516 and P=0.466,
respectively; Fig. 3B and D) or OS
(26.7 vs. 35.0 months and 32.7 vs. 35.0 months; P=0.429 and
P=0.446, respectively; Fig. 4B and
D) times.
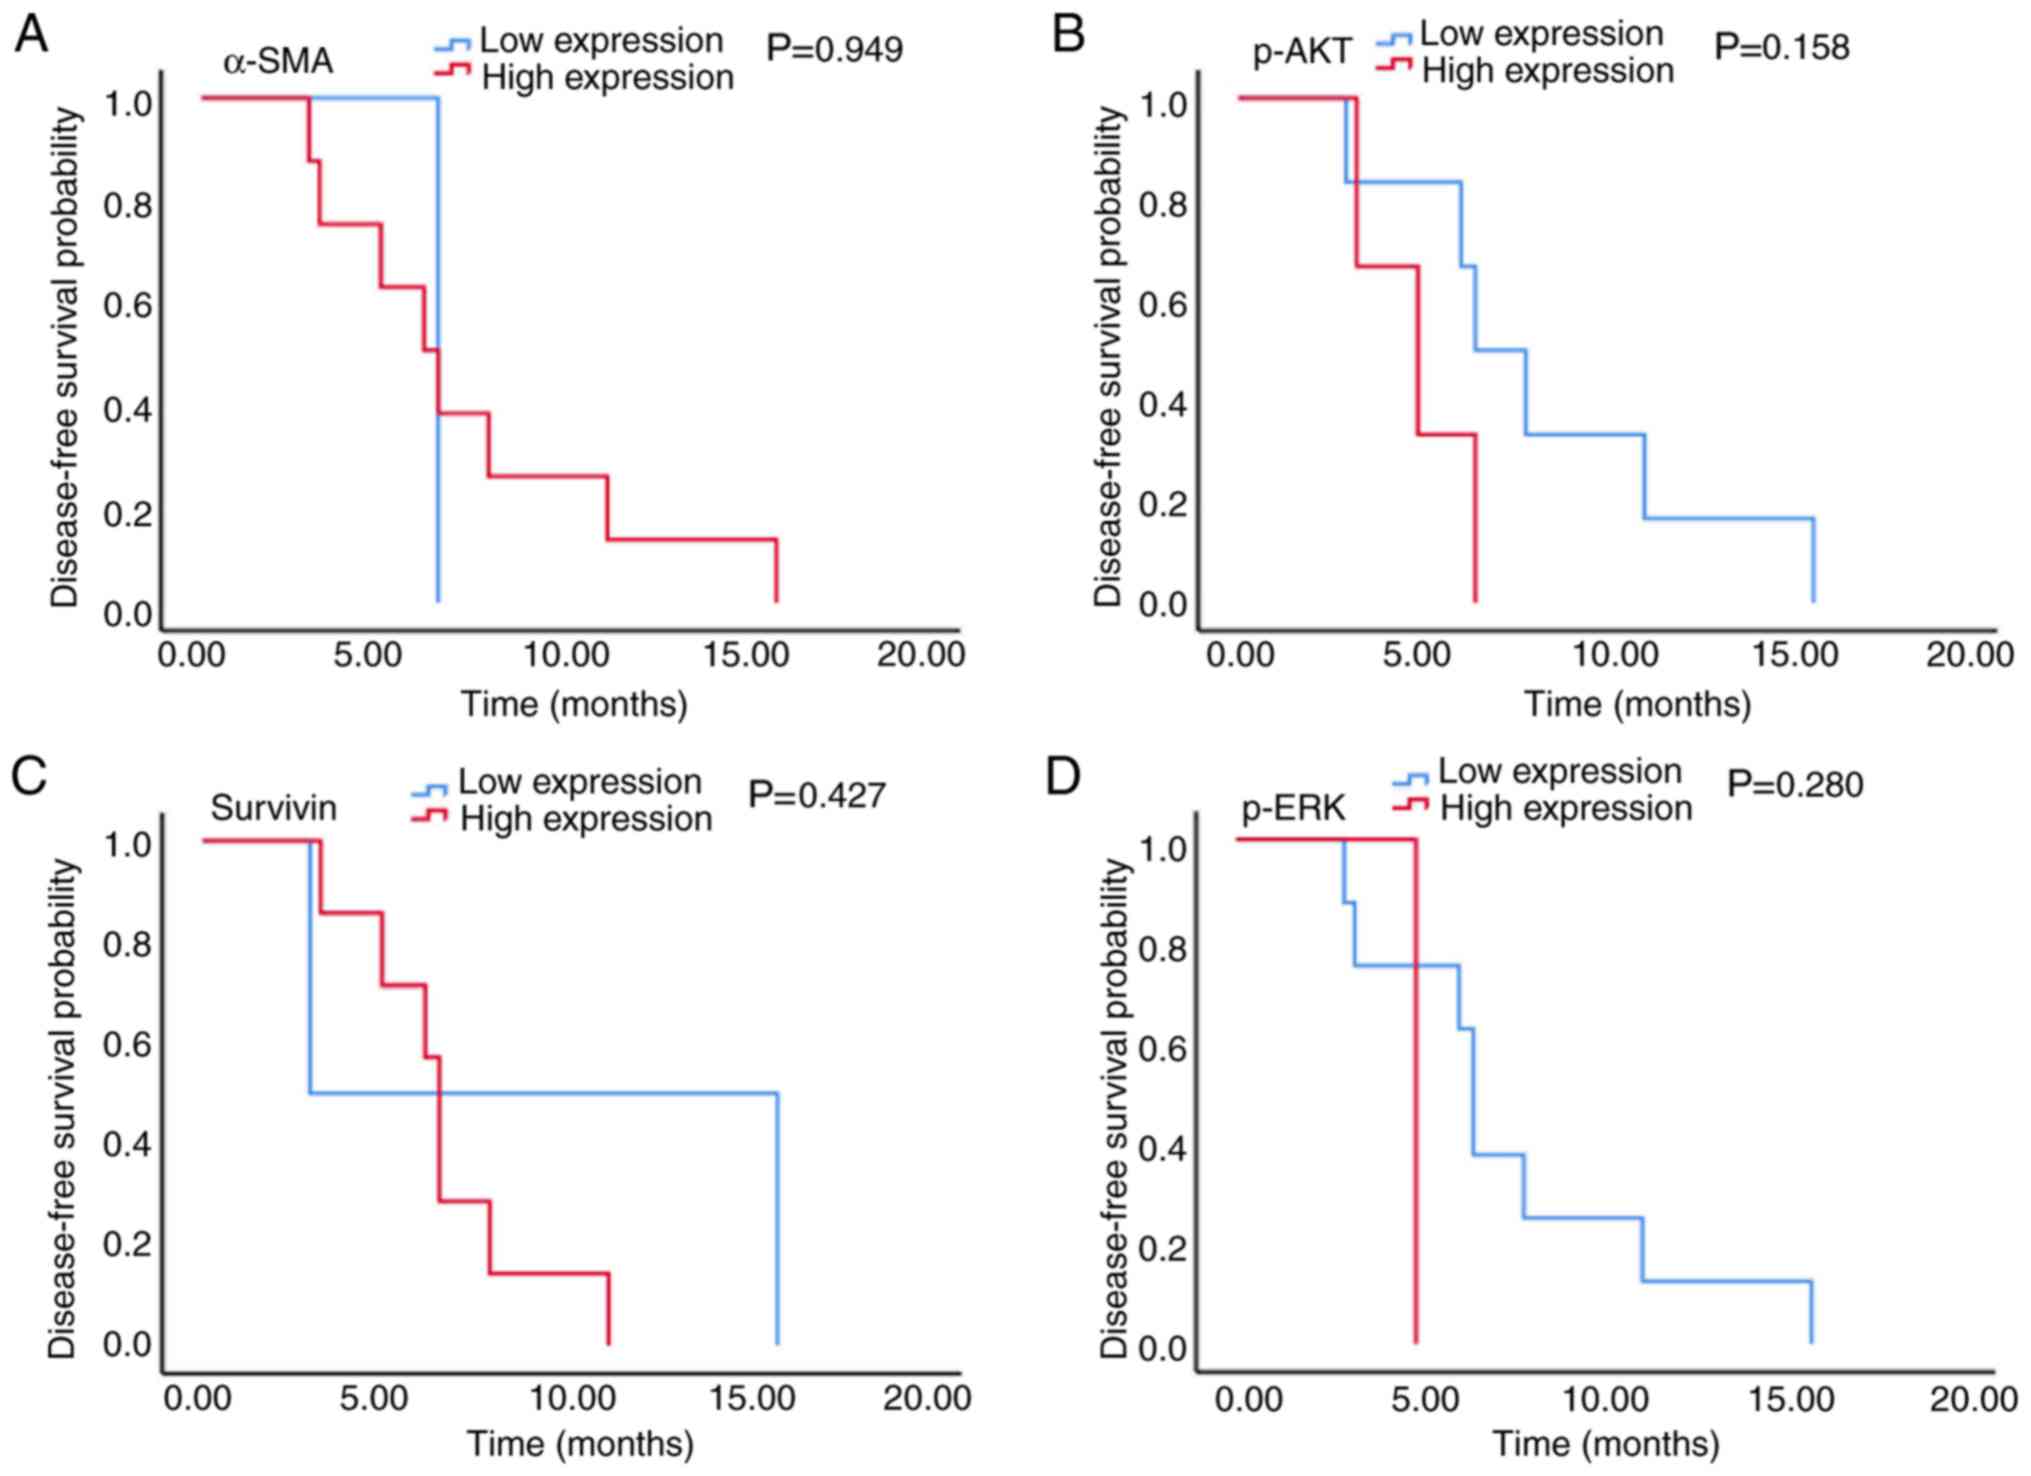
The results presented in Fig. 5 demonstrated that in patients with
stage III CRC, there was no significant association between α-SMA,
p-AKT, survivin and p-ERK expression and PFS time (6.2 vs. 6.6
months, 5.0 vs. 6.6 months, 6.6 vs. 3.0 months and 5.0 vs. 6.6
months; P=0.949, P=0.158, P=0.427 and P=0.280, respectively;
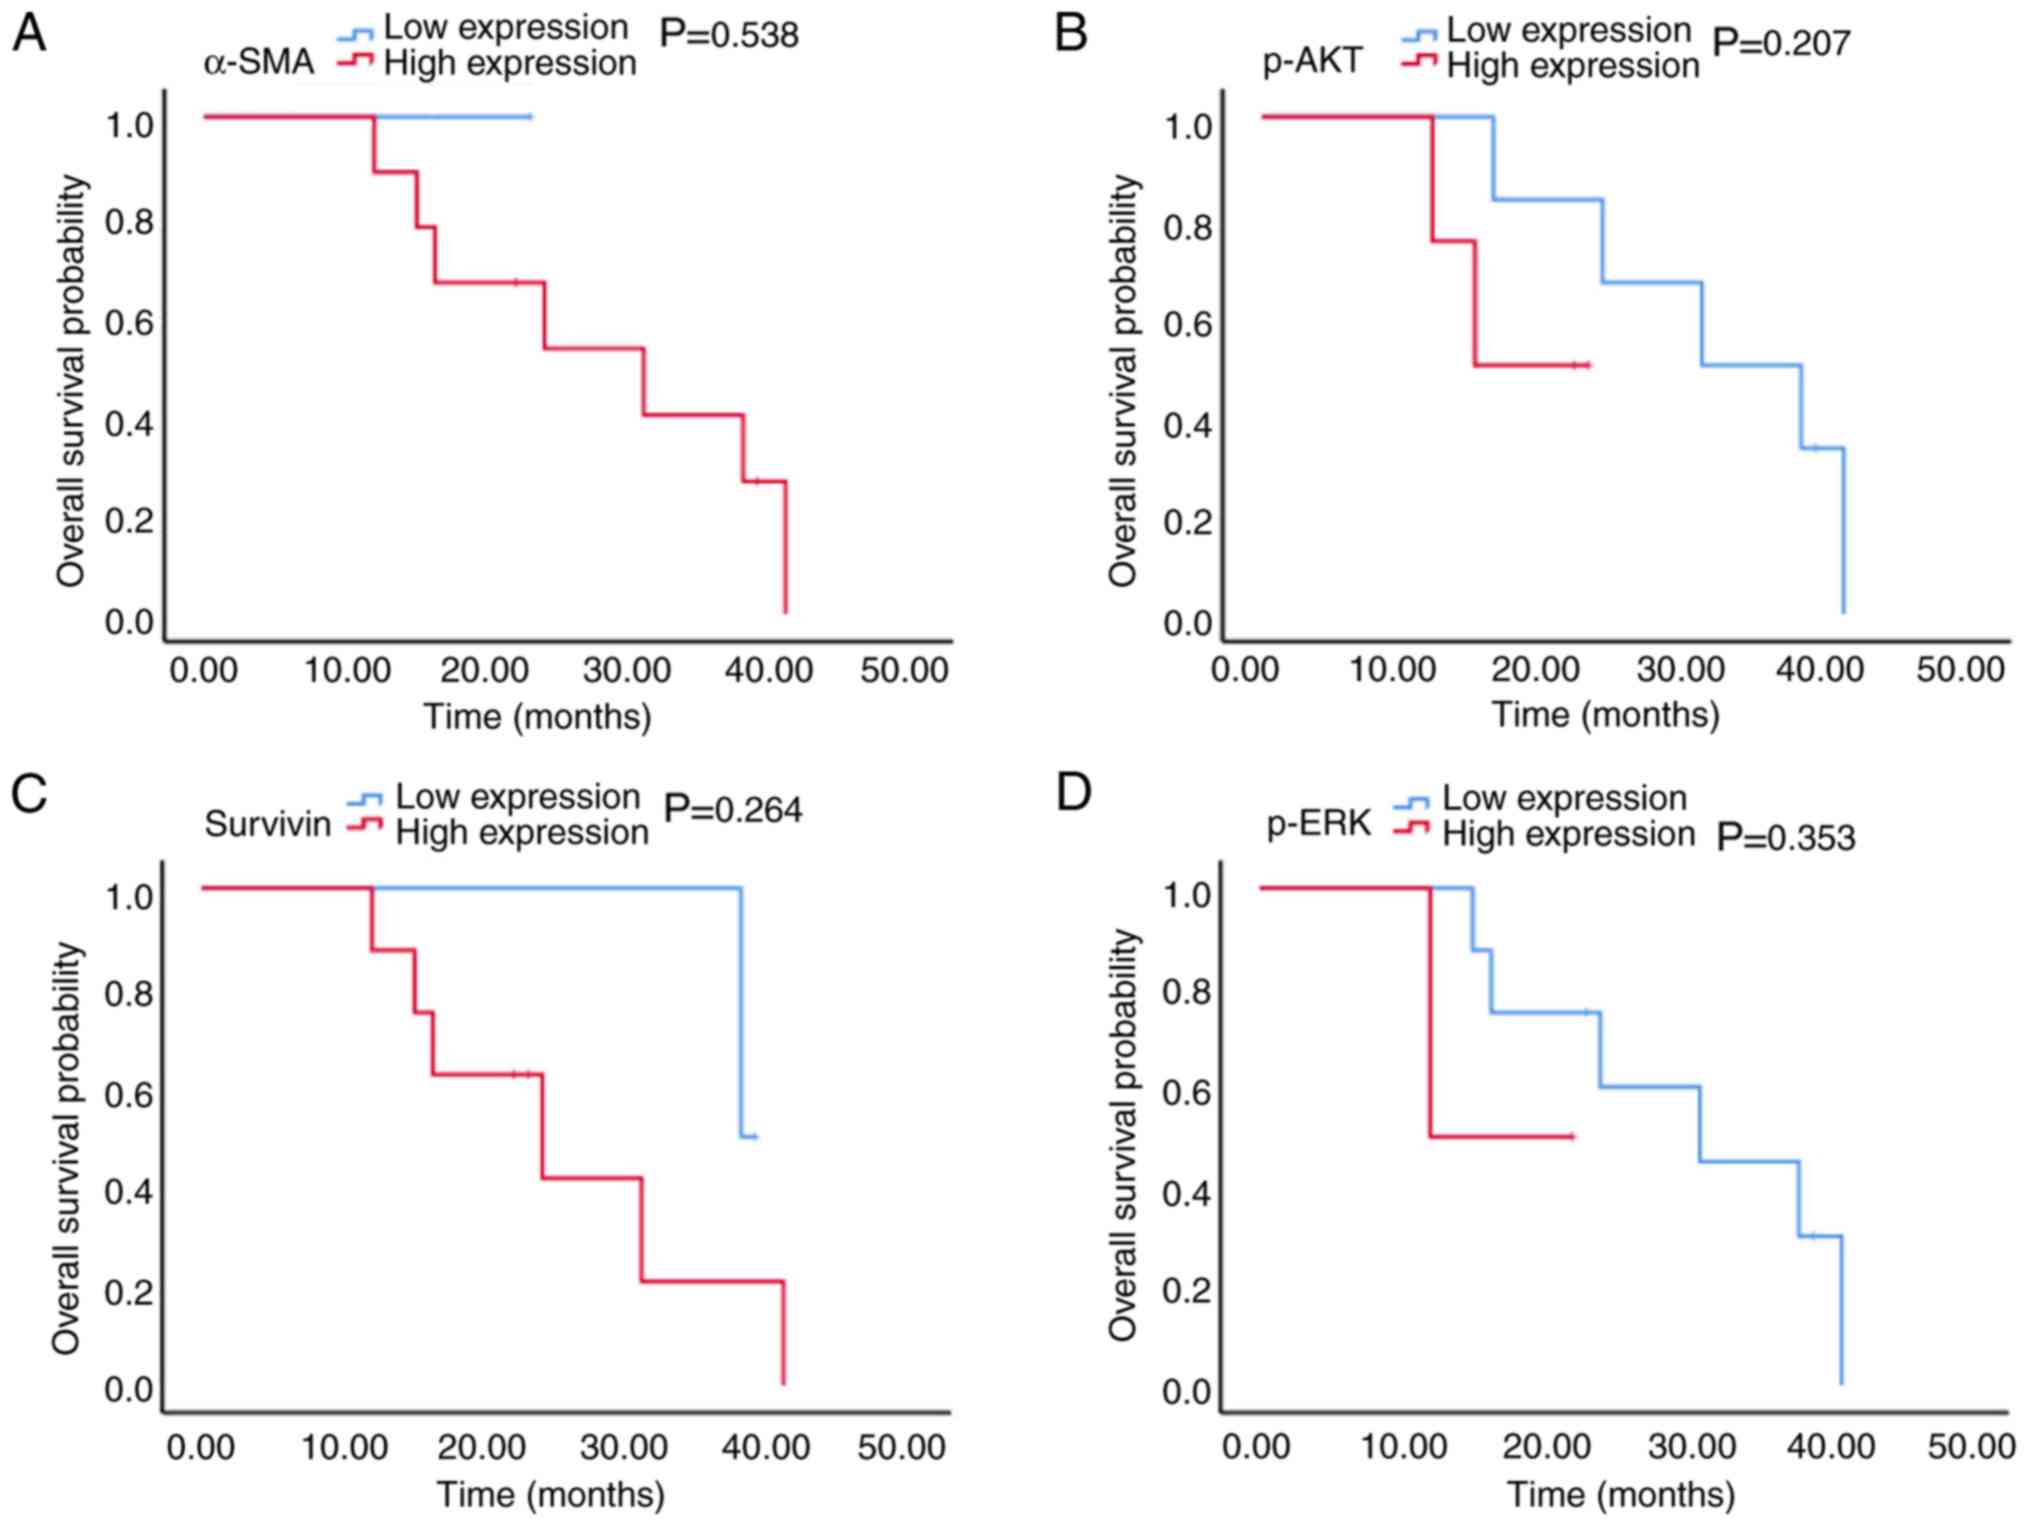
Fig. 5A-D). The results from
Fig. 6 also revealed that in
patients with stage III CRC, there was no significant association
between p-AKT, survivin and p-ERK expression and OS time (15.0 vs.
31.0 months, 24.0 vs. 38.0 months and 12.0 vs. 31.0 months;
P=0.207, P=0.264 and P=0.353, respectively; Fig. 6A-C). In patients with stage III CRC,
only 1 patient had high α-SMA expression (Fig. 6D) and since this patient was still
alive during the study, the association between α-SMA expression
and median OS could therefore not be determined.
Predictive model of α-SMA, p-AKT,
p-ERK and survivin expression for oxaliplatin plus 5-FU
chemotherapy response in patients with aCRC
The error rates of α-SMA, p-AKT, survivin and p-ERK
expressions were first analyzed as predictive biomarkers for
chemotherapy response in the 43 patients involved in this model.
The error rates of individual feature were 28, 35 and 30% for
α-SMA, p-AKT and survivin expression, whereas p-ERK expression did
not have discriminating ability (Table
II) and was not satisfactory for predicting chemotherapy
response. Two features with the lowest error rate, α-SMA and
survivin expression, were selected from the four features and were
used to detect the predictive accuracy of the integrated model. The
error rate of the combined model was 26% (Table III). When p-AKT expression was
added to this model, the error rate decreased to 21% (Table IV). When p-ERK expression was added
to this model, the error rate decreased to 16% and the accuracy was
>80% (Table V).
| Table II.Predictive potential of individual
features for chemotherapy response in patients with advanced
colorectal cancer.a |
Table II.
Predictive potential of individual
features for chemotherapy response in patients with advanced
colorectal cancer.a
| Protein | Classification of
each feature | Cases of
non-responders to feature chemoeach each feature | Cases of
chemotherapy responders, n | Error rate, % |
|---|
| α-SMA | 1 | 2 | 17 | 28 |
|
| 2 | 14 | 10 |
|
| p-AKT | 1 | 11 | 23 | 35 |
|
| 2 | 5 | 4 |
|
| Survivin | 1 | 2 | 16 | 30 |
|
| 2 | 14 | 11 |
|
| p-ERK | 1 | 11 | 15 | 53.5 |
|
| 2 | 5 | 12 |
|
| Table III.Predictive potential of the
combination of α-SMA expression and survivin expression for
chemotherapy response in patients with advanced colorectal
cancer.a |
Table III.
Predictive potential of the
combination of α-SMA expression and survivin expression for
chemotherapy response in patients with advanced colorectal
cancer.a
| Classification of
α-SMA expression | Classification of
survivin expression | Cases of
non-responders to chemotherapy, n | Cases of
chemotherapy responders, n | Error rate, % |
|---|
| 1 | 1 | 0 | 13 | 26 |
| 1 | 2 | 2 | 4 |
|
| 2 | 1 | 2 | 3 |
|
| 2 | 2 | 12 | 7 |
|
| Table IV.Predictive potential of the
combination of α-SMA, survivin and p-AKT expression for
chemotherapy response in patients with advanced CRC. |
Table IV.
Predictive potential of the
combination of α-SMA, survivin and p-AKT expression for
chemotherapy response in patients with advanced CRC.
| Classification of
α-SMA expression | Classification of
survivin expression | Classification of
p-AKT expression | Cases of
non-responders to chemotherapy, n | Cases of
chemotherapy responders, n | Error rate, % |
|---|
| 1 | 1 | 1 | 0 | 10 | 21 |
| 1 | 1 | 2 | 0 | 4 |
|
| 1 | 2 | 1 | 0 | 3 |
|
| 1 | 2 | 2 | 2 | 0 |
|
| 2 | 1 | 1 | 2 | 2 |
|
| 2 | 1 | 2 | 9 | 7 |
|
| 2 | 2 | 1 | 0 | 1 |
|
| 2 | 2 | 2 | 3 | 0 |
|
| Table V.Predictive potential of α-SMA,
survivin, p-AKT and p-ERK expression for chemotherapy response in
patients with advanced colorectal cancer.a |
Table V.
Predictive potential of α-SMA,
survivin, p-AKT and p-ERK expression for chemotherapy response in
patients with advanced colorectal cancer.a
| Classification of
α-SMA expression | Classification of
survivin expression | Classification of
p-AKT expression | Classification of
p-ERK expression | Cases of no
responders to chemotherapy, n | Cases of
chemotherapy responders, n | Error rate, % |
|---|
| 1 | 1 | 1 | 1 | 0 | 4 | 16 |
| 1 | 1 | 1 | 2 | 0 | 6 |
|
| 1 | 1 | 2 | 1 | 0 | 2 |
|
| 1 | 1 | 2 | 2 | 0 | 2 |
|
| 1 | 2 | 1 | 1 | 0 | 1 |
|
| 1 | 2 | 1 | 2 | 0 | 2 |
|
| 1 | 2 | 2 | 1 | 2 | 0 |
|
| 1 | 2 | 2 | 2 | / | / |
|
| 2 | 1 | 1 | 1 | 0 | 2 |
|
| 2 | 1 | 1 | 2 | 2 | 0 |
|
| 2 | 1 | 2 | 1 | 8 | 6 |
|
| 2 | 1 | 2 | 2 | 1 | 1 |
|
| 2 | 2 | 1 | 1 | / | / |
|
| 2 | 2 | 1 | 2 | 0 | 1 |
|
| 2 | 2 | 2 | 1 | 1 | 0 |
|
| 2 | 2 | 2 | 2 | 2 | 0 |
|
Based on these results, the PNN module of the MATLAB
tool cabinet was used to establish the model regarding the
classification problems. The data from 32 patients were used for
modeling, the data from 11 patients were used for validation and
the data from 28 patients were used for prediction. The results of
modeling, validation and prediction are presented in Table VI. The results demonstrated that the
modeling accuracy involving a single feature was ~70%. When the
features number increased to 4, the modeling accuracy was 83.7%,
the validation accuracy was 92.9% and the prediction accuracy was
85.7%.
| Table VI.Results of modeling, verification and
prediction of 4 features for chemotherapy response in patients with
advanced colorectal cancer. |
Table VI.
Results of modeling, verification and
prediction of 4 features for chemotherapy response in patients with
advanced colorectal cancer.
| Features | Modeling accuracy,
% | Validation
accuracy, % | Prediction
accuracy, % | Total modeling and
validation, % |
|---|
| α-SMA | 72.1 | 78.6 | 85.7 | 82.1 |
| α-SMA,
survivin | 72.1 | 78.6 | 85.7 | 82.1 |
| α-SMA, survivin,
p-AKT | 79.1 | 78.6 | 78.6 | 78.6 |
| α-SMA, survivin,
p-AKT, p-ERK | 83.7 | 92.9 | 85.7 | 89.3 |
Discussion
The first-line chemotherapy used for patients with
aCRC is an oxaliplatin plus 5-FU regimen; however, the response
rate is limited. It is therefore necessary to identify biomarkers
that could help oncologists to accurately select patients who can
benefit from this specific regimen.
As illustrated in the ‘seed and soil’ hypothesis,
supportive tumor stroma (the soil) is important for tumor cell (the
seed) progression (25,26). CAFs are large and spindle-shaped
mesenchymal cells that represent the major components of tumor
stroma. Numerous studies have demonstrated that CAFs serve crucial
roles in cancer progression and resistance to chemotherapeutic
agents (27,28). However, the association between CAFs
and traditional chemotherapy in CRC remains unclear. Previous
studies reported that cytokines secreted by CAFs, including
interleukin (IL)-8, IL-1β, vascular endothelial growth factor,
TNF-α, IL-17 and IL-6, can predict a poor response to chemotherapy
in CRC cells (29).
Gonçalves-Ribeiro et al (11)
revealed that CAFs have a protective effect on CRC cells. It has
also been reported that the expression of CAFs-associated
fibronectin 1 and collagen 3A1 can predict the absence of response
to neoadjuvant treatment in locally advanced rectal carcinoma
(30). The potential mechanisms
involved are as follows: i) CAFs can secrete collagen type I, which
can decrease chemotherapeutic drug uptake in tumors and then induce
drug resistance (31,32); ii) soluble factors secreted by CAFs
can induce the activation of PI3K/AKT/survivin and JAK/STAT
pathways, which may provide protection from cell death, ensure
correct DNA repair and eventually induce resistance to oxaliplatin
and 5-FU; and iii) chemotherapy-treated CAFs can secrete specific
cytokines and chemokines, including IL-17A, which may promote
cancer-initiating cell self-renewal and tumor resistance (33).
Increasing evidence has demonstrated that
chemotherapy resistance may be associated with the activation of
two important Ras downstream pathways, the MAPK and the
PI3K-AKT-mTOR signaling pathways (12–14). The
MAPK pathway regulates numerous physiological processes in cancer
cells, including cell proliferation, metastasis and chemoresistance
(34). Previous studies revealed
that MAPK signaling pathway activation serves key roles in drug
resistance, notably in gastric cancer, breast cancer, prostate
cancer and CRC. The PI3K/AKT/mTOR pathway also regulates cancer
progression and is recognized as a major cause of multidrug
resistance in various types of cancer (15–18).
This pathway has also been identified as a potent contributor to
drug resistance in CRC, particularly resistance to 5-FU and
oxaliplatin (35). Inhibition of the
PI3K/AKT signaling pathway can reduce insulin-induced
chemotherapeutic drug resistance. AKT phosphorylation serves a
pivotal part in the activation of the PI3K/AKT/mTOR signaling
pathway (36,37).
Survivin is a member of the inhibitor of apoptosis
proteins family. Numerous studies have demonstrated that survivin
overexpression is associated with drug resistance in different
cancer types (19,38–40). The
potential mechanisms involved in survivin overexpression-induced
drug resistance are as follows: i) Nuclear survivin serves a
pivotal role in the formation of spindle fiber assembly via
stabilization of microtubule formation leading to cell growth
(41); ii) survivin can upregulate
the molecular sensor of DNA damage named ku70 and subsequently
enhance the repair of DNA double-stranded breaks (42); and iii) survivin can interact with
the apoptosis-inducing molecules caspase-3 and casapase-9 and
inhibit their apoptotic function (43). Additional evidence has revealed that
regulation of survivin expression may be a downstream effect of the
MAPK (44–46) or PI3K-AKT-mTOR signaling pathways
(45) in different types of
cancer.
Based on this evidence, the present study
established a predictive model of α-SMA, p-AKT, p-ERK and survivin
expression in patients with CRC in order to anticipate the
potential intrinsic resistance to the oxaliplatin plus 5-FU
regimen. The results from this study demonstrated that α-SMA and
survivin overexpression in patients with CRC was significantly
associated with oxaliplatin plus 5-FU resistance, which was not the
case for p-AKT and p-ERK overexpression; this result was in
agreement with previous studies and hypotheses (19,43–45).
From these different patterns, the model comprising α-SMA, p-AKT,
p-ERK and survivin overexpression was the best predictive pattern.
The predictive model of α-SMA, p-AKT, p-ERK and survivin
overexpression was of great efficacy (81.3%) and accuracy (81.8%),
and could aid oncologists in determining whether an individual
could benefit from the oxaliplatin plus 5-FU chemotherapy
regimen.
In conclusion, the multifactorial predictive
biomarker model of α-SMA, p-AKT, p-ERK and survivin expression in
patients with CRC used to predict intrinsic resistance to the
oxaliplatin plus 5-FU regimen in the present study was efficient
and accurate. These results suggested that patients with high
expression of this predictive model may be intrinsically resistant
to an oxaliplatin plus 5-FU regimen. This predictive model may be
of great help to screen cancer patients who have intrinsic
chemoresistance and to prescribe them personalized treatments.
Acknowledgements
Not applicable.
Funding
This study was supported by the National Natural
Science Foundation of China (grant nos. 81472785 and 61435001) and
the CA MS Innovation Fund for Medical Sciences (grant no.
2016-12M-1-001).
Availability of data and materials
The datasets used and/or analyzed during the current
study are available from the corresponding author on reasonable
request.
Authors' contributions
JG made substantial contributions to conception and
design, acquisition of data, analysis and interpretation of data
and drafting of the manuscript. ZL made substantial contributions
to acquisition of data. JZ made substantial contributions to
conception and design of the study and acquisition of data. ZS made
substantial contributions to conception and design, analysis and
interpretation of data, drafting the manuscript and revising it
critically for important intellectual content. CB made substantial
contributions to conception and design, interpretation of data, and
revised the manuscript critically for important intellectual
content. All authors read and approved the final manuscript.
Ethics approval and consent to
participate
This study was performed in accordance with the
Declaration of Helsinki and was approved by the Peking Union
Medical College Hospital Ethics Committee (no. ZS-1358). All
patients were informed about the use of their tissue samples for
biological research and provided written informed consent prior to
the study.
Patient consent for publication
Not applicable.
Competing interests
The authors declare that they have no competing
interests.
References
|
1
|
Siegel RL, Miller KD and Jemal A: Cancer
statistics, 2015. CA Cancer J Clin. 65:5–29. 2015. View Article : Google Scholar : PubMed/NCBI
|
|
2
|
Kap EJ, Seibold P, Richter S, Scherer D,
Habermann N, Balavarca Y, Jansen L, Becker N, Pfütze K, Popanda O,
et al: Genetic variants in DNA repair genes as potential predictive
markers for oxaliplatin chemotherapy in colorectal cancer.
Pharmacogenomics J. 15:505–512. 2015. View Article : Google Scholar : PubMed/NCBI
|
|
3
|
Napolitano S, Martini G, Rinaldi B,
Martinelli E, Donniacuo M, Berrino L, Vitagliano D, Morgillo F,
Barra G, De Palma R, et al: Primary and acquired resistance of
colorectal cancer to anti-EGFR monoclonal antibody can be overcome
by combined treatment of regorafenib with cetuximab. Clin Cancer
Res. 21:2975–2983. 2015. View Article : Google Scholar : PubMed/NCBI
|
|
4
|
Ye F, Liu Z, Tan A, Liao M, Mo Z and Yang
X: XRCC1 and GSTP1 polymorphisms and prognosis of oxaliplatin-based
chemotherapy in colorectal cancer: A meta-analysis. Cancer
Chemother Pharmacol. 71:733–740. 2013. View Article : Google Scholar : PubMed/NCBI
|
|
5
|
Noda E, Maeda K, Inoue T, Fukunaga S,
Nagahara H, Shibutani M, Amano R, Nakata B, Tanaka H, Muguruma K,
et al: Predictive value of expression of ERCC 1 and GST-p for
5-fluorouracil/oxaliplatin chemotherapy in advanced colorectal
cancer. Hepatogastroenterology. 59:130–133. 2012. View Article : Google Scholar : PubMed/NCBI
|
|
6
|
Chen J, Xie F, Chen K, Wang D, Jiang H, Li
J, Pan F, Chen S, Zhang Y, Ruan Z, et al: ERCC5 promoter
polymorphisms at −763 and +25 predict the response to
oxaliplatin-based chemotherapy in patients with advanced colorectal
cancer. Cancer Biol Ther. 8:1424–1430. 2009. View Article : Google Scholar : PubMed/NCBI
|
|
7
|
Fariña-Sarasqueta A, van Lijnschoten G,
Rutten HJ and van den Brule AJ: Value of gene polymorphisms as
markers of 5-FU therapy response in stage III colon carcinoma: A
pilot study. Cancer Chemother Pharmacol. 66:1167–1171. 2010.
View Article : Google Scholar : PubMed/NCBI
|
|
8
|
Li S, Lu X, Chi P and Pan J:
Identification of Nkx2-3 and TGFB1I1 expression levels as potential
biomarkers to predict the effects of FOLFOX4 chemotherapy. Cancer
Biol Ther. 13:443–449. 2012. View Article : Google Scholar : PubMed/NCBI
|
|
9
|
Li S, Lu X, Chi P and Pan J:
Identification of HOXB8 and KLK11 expression levels as potential
biomarkers to predict the effects of FOLFOX4 chemotherapy. Future
Oncol. 9:727–736. 2013. View Article : Google Scholar : PubMed/NCBI
|
|
10
|
Schetter AJ, Leung SY, Sohn JJ, Zanetti
KA, Bowman ED, Yanaihara N, Yuen ST, Chan TL, Kwong DL, Au GK, et
al: MicroRNA expression profiles associated with prognosis and
therapeutic outcome in colon adenocarcinoma. JAMA. 299:425–436.
2008. View Article : Google Scholar : PubMed/NCBI
|
|
11
|
Gonçalves-Ribeiro S, Díaz-Maroto NG,
Berdiel-Acer M, Soriano A, Guardiola J, Martínez-Villacampa M,
Salazar R, Capellà G, Villanueva A, Martínez-Balibrea E and Molleví
DG: Carcinoma-associated fibroblasts affect sensitivity to
oxaliplatin and 5FU in colorectal cancer cells. Oncotarget.
7:59766–59780. 2016. View Article : Google Scholar : PubMed/NCBI
|
|
12
|
West KA, Castillo SS and Dennis PA:
Activation of the PI3K/Akt pathway and chemotherapeutic resistance.
Drug Resist Update. 5:234–248. 2002. View Article : Google Scholar
|
|
13
|
McCubrey JA, Steelman LS, Chappell WH,
Abrams SL, Wong EW, Chang F, Lehmann B, Terrian DM, Milella M,
Tafuri A, et al: Roles of the RAF/MEK/ERK pathway in cell growth,
malignant transformation and drug resistance. Biochim Biophys Acta.
1773:1263–1284. 2007. View Article : Google Scholar : PubMed/NCBI
|
|
14
|
Pritchard AL and Hayward NK: Molecular
pathways: mitogen-activated protein kinase pathway mutations and
drug resistance. Clin Cancer Res. 19:2301–2309. 2013. View Article : Google Scholar : PubMed/NCBI
|
|
15
|
Zhao H, Zhao D, Jin H, Li H, Yang X,
Zhuang L and Liu T: Bufalin reverses intrinsic and acquired drug
resistance to cisplatin through the AKT signaling pathway in
gastric cancer cells. Mol Med Rep. 14:1817–1822. 2016. View Article : Google Scholar : PubMed/NCBI
|
|
16
|
LoPiccolo J, Blumenthal GM, Bernstein WB
and Dennis PA: Targeting the PI3K/Akt/mTOR pathway: Effective
combinations and clinical considerations. Drug Resist Updat.
11:32–50. 2008. View Article : Google Scholar : PubMed/NCBI
|
|
17
|
Sun L, Liu L, Liu X, Wang Y, Li M, Yao L,
Yang J, Ji G, Guo C, Pan Y, et al: MGr1-Ag⁄37LRP induces cell
adhesion-mediated drug resistance through FAK⁄PI3K and MAPK pathway
in gastric cancer. Cancer Sci. 105:651–659. 2014. View Article : Google Scholar : PubMed/NCBI
|
|
18
|
Jin W, Wu L, Liang K, Liu B, Lu Y and Fan
Z: Roles of the PI-3K and MEK pathways in Ras-mediated
chemoresistance in breast cancer cells. Br J Cancer. 89:185–191.
2003. View Article : Google Scholar : PubMed/NCBI
|
|
19
|
Nam K, Son SH, Oh S, Jeon D, Kim H, Noh
DY, Kim S and Shin I: Binding of galectin-1 to integrin β1
potentiates drug resistance by promoting survivin expression in
breast cancer cells. Oncotarget. 8:35804–35823. 2017. View Article : Google Scholar : PubMed/NCBI
|
|
20
|
Hari DM, Leung AM, Lee JH, Sim MS, Vuong
B, Chiu CG and Bilchik AJ: AJCC Cancer Staging Manual 7th edition
staging criteria for colon cancer: do the complex modifications
improve prognostic assessment? J Am Coll Surg. 217:181–190. 2013.
View Article : Google Scholar : PubMed/NCBI
|
|
21
|
Benson AB III, Venook AP, Cederquist L,
Chan E, Chen YJ, Cooper HS, Deming D, Engstrom PF, Enzinger PC,
Fichera A, et al: Colon cancer, version 1.2017,NCCN clinical
practice guidelines in oncology. J Natl Compr Canc Netw.
15:370–398. 2017. View Article : Google Scholar : PubMed/NCBI
|
|
22
|
Eisenhauer EA, Therasse P, Bogaerts J,
Schwartz LH, Sargent D, Ford R, Dancey J, Arbuck S, Gwyther S,
Mooney M, et al: New response evaluation criteria in solid tumours:
Revised RECIST guideline (version 1.1). Eur J Cancer. 45:228–247.
2009. View Article : Google Scholar : PubMed/NCBI
|
|
23
|
Cai J, Guan H, Fang L, Yang Y, Zhu X, Yuan
J, Wu J and Li M: MicroRNA-374a activates Wnt/β-catenin signaling
to promote breast cancer metastasis. J Clin Invest. 12:566–579.
2013.
|
|
24
|
Spech DF: Probabilistic neural networks.
Neural Networks. 3:109–118. 1990. View Article : Google Scholar
|
|
25
|
Mueller MM and Fusenig NE: Friends or
foes-bipolar effects of the tumour stroma in cancer. Nat Rev
Cancer. 4:839–849. 2004. View
Article : Google Scholar : PubMed/NCBI
|
|
26
|
Paget S: The distribution of secondary
growths in cancer of the breast. 1989. Cancer Metastasis Rev.
8:98–101. 1889.
|
|
27
|
Mei L, Du W and Ma WW: Targeting stromal
microenvironment in pancreatic ductal adenocarcinoma: Controversies
and promises. J Gastrointest Oncol. 7:487–494. 2016. View Article : Google Scholar : PubMed/NCBI
|
|
28
|
Rachel JB and Sun YO: Breast
cancer-associated fibroblasts: Where we are and where we need to
go. Cancers (Basel). 8(pii): E192016.PubMed/NCBI
|
|
29
|
Nagasaki T, Hara M, Nakanishi H, Takahashi
H, Sato M and Takeyama H: Interleukin-6 released by colon
cancer-associated fibroblasts is critical for tumour angiogenesis:
Anti-interleukin-6 receptor antibody suppressed angiogenesis and
inhibited tumour-stroma interaction. Br J Cancer. 110:469–478.
2014. View Article : Google Scholar : PubMed/NCBI
|
|
30
|
Goncalves-Ribeiro S, Sanz-Pamplona R,
Vidal A, Sanjuan X, Guillen Díaz-Maroto N, Soriano A, Guardiola J,
Albert N, Matinez-Villacampa M, Lopez I, et al: Prediction of
pathological response to neoadjuvant treatment in rectal cancer
with a two-protein immunohistochemical score derived from stromal
gene-profiling. Ann Oncol. 28:2160–2168. 2017. View Article : Google Scholar : PubMed/NCBI
|
|
31
|
Loeffler M, Krüger JA, Niethammer AG and
Reisfeld RA: Targeting tumor-associated fibroblasts improves cancer
chemotherapy by increasing intratumoral drug uptake. J Clin Invest.
116:1955–1962. 2006. View
Article : Google Scholar : PubMed/NCBI
|
|
32
|
Mao Y, Keller ET, Garfield DH, Shen K and
Wang J: Stromal cells in tumor microenvironment and breast cancer.
Cancer Metastasis Rev. 32:303–315. 2013. View Article : Google Scholar : PubMed/NCBI
|
|
33
|
Lotti F, Jarrar AM, Pai RK, Hitomi M,
Lathia J, Mace A, Gantt GA Jr, Sukhdeo K, DeVecchio J, Vasanji A,
et al: Chemotherapy activates cancer-associated fibroblasts to
maintain colorectal cancer-initiating cells by IL-17A. J Exp Med.
210:2851–2872. 2013. View Article : Google Scholar : PubMed/NCBI
|
|
34
|
Das Thakur M and Stuart DD: Molecular
pathways: Response and resistance to BRAF and MEK inhibitors in
BRAF(V600E) tumors. Clin Cancer Res. 20:1074–1080. 2014. View Article : Google Scholar : PubMed/NCBI
|
|
35
|
Chen J, Shao R, Li F, Monteiro M, Liu JP,
Xu ZP and Gu W: PI3K/Akt/mTOR pathway dual inhibitor BEZ235
suppresses the stemness of colon cancer stem cells. Clin Exp
Pharmacol Physiol. 42:1317–1326. 2015. View Article : Google Scholar : PubMed/NCBI
|
|
36
|
Xu J, Zhang SR, Wang R, Wu X, Zeng L and
Fu Z: Knockdown of PRDX2 sensitizes colon cancer cells to 5-FU by
suppressing the PI3K/AKT signaling pathway. Biosci Rep. 37(pii):
BSR201604472017. View Article : Google Scholar : PubMed/NCBI
|
|
37
|
Danielsen SA, Eide PW, Nesbakken A, Guren
T, Leithe E and Lothe RA: Portrait of the PI3K/AKT pathway in
colorectal cancer. Biochim Biophys Acta. 1855:104–121.
2015.PubMed/NCBI
|
|
38
|
Cheung CH, Huang CC, Tsai FY, Lee JY,
Cheng SM, Chang YC, Huang YC, Chen SH and Chang JY:
Survivin-biology and potential as a thera-peutic target in
oncology. Onco Targets Ther. 6:1453–1462. 2013. View Article : Google Scholar : PubMed/NCBI
|
|
39
|
Zaffaroni N and Daidone MG: Survivin
expression and resistance to anticancer treatments: Perspectives
for new therapeutic interventions. Drug Resist Updat. 5:65–72.
2002. View Article : Google Scholar : PubMed/NCBI
|
|
40
|
Coumar MS, Tsai FY, Kanwar JR, Sarvagalla
S and Cheung CH: Treat cancers by targeting survivin: Just a dream
or future reality? Cancer Treat Rev. 39:802–811. 2013. View Article : Google Scholar : PubMed/NCBI
|
|
41
|
Li F, Yang J, Ramnath N, Javle MM and Tan
D: Nuclear or cytoplasmic expression of survivin: What is the
significance? Int J Cancer. 114:509–512. 2005. View Article : Google Scholar : PubMed/NCBI
|
|
42
|
Jiang G, Ren B, Xu L, Song S, Zhu C and Ye
F: Survivin may enhance DNA double-strand break repair capability
by up-regulating Ku70 in human KB cells. Anticancer Res.
29:223–228. 2009.PubMed/NCBI
|
|
43
|
Shin S, Sung BJ, Cho YS, Kim HJ, Ha NC,
Hwang JI, Chung CW, Jung YK and Oh BH: An anti-apoptotic protein
human survivin is a direct inhibitor of caspase-3 and −7.
Biochemistry. 40:1117–1123. 2001. View Article : Google Scholar : PubMed/NCBI
|
|
44
|
Zhuo W, Zhang L, Zhu Y, Zhu B and Chen Z:
Fisetin, a dietary bioflavonoid, reverses acquired
Cisplatin-resistance of lung adenocarcinoma cells through
MAPK/Survivin/Caspase pathway. Am J Transl Res. 7:2045–2052.
2015.PubMed/NCBI
|
|
45
|
Tsubaki M, Takeda T, Ogawa N, Sakamoto K,
Shimaoka H, Fujita A, Itoh T, Imano M, Ishizaka T, Satou T and
Nishida S: Overexpression of survivin via activation of ERK1/2,
Akt, and NF-kB plays a central role in vincristine resistance in
multiple myeloma cells. Leuk Res. 39:445–452. 2015. View Article : Google Scholar : PubMed/NCBI
|
|
46
|
Zhang Y, Chen HX, Zhou SY, Wang SX, Zheng
K, Xu DD, Liu YT, Wang XY, Wang X, Yan HZ, et al: Sp1 and c-Myc
modulate drug resistance of leukemia stem cells by regulating
survivin expression through the ERK-MSK MAPK signaling pathway. Mol
Cancer. 14:562015. View Article : Google Scholar : PubMed/NCBI
|