Open Access

Exploration of the hub genes and miRNAs in lung adenocarcinoma

  • Authors:
    • Yuanyuan Zhai
    • Yingli Chen
    • Qianzhong Li
    • Luqiang Zhang
  • View Affiliations

  • Published online on: June 14, 2019     https://doi.org/10.3892/ol.2019.10478
  • Pages: 1713-1722
  • Copyright: © Zhai et al. This is an open access article distributed under the terms of Creative Commons Attribution License.

Metrics: Total Views: 0 (Spandidos Publications: | PMC Statistics: )
Total PDF Downloads: 0 (Spandidos Publications: | PMC Statistics: )


Abstract

In order to investigate the oncogenic mechanisms of lung adenocarcinoma (LUAD), hub genes can be identified by constructing co‑expression networks, and the potential linkages between hub genes, transcription factors (TFs) and microRNAs (miRNAs/miRs) can be visualized and identified. In the present study, a total of 12 co‑expressed modules were constructed, and 9 of these were significantly correlated with clinical traits in LUAD. The differentially expressed genes and differentially expressed miRNAs were determined, and the targets of differentially expressed miRNA were identified from the hub genes or TFs. The results of the present study demonstrated that 10 hub genes and 12 TFs are the predicted targets for the 5 and 8 differentially expressed miRNAs, respectively. Genes in pink and red modules, which have a high correlation with the clinical trait of days to death, are significantly enriched in ‘nucleosome assembly’ and ‘microtubule‑based process’, respectively. These results indicated that miR‑206, miR‑137, miR‑153, hub genes and enriched TFs in the pink and red modules exert a potentially pivotal function in the development of LUAD.

Introduction

Lung cancer, a disease with a complex molecular network, is the most commonly occurring cancer and the leading cause of cancer-associated mortality worldwide (1). Lung adenocarcinoma (LUAD) is a type of non-small cell lung cancer that accounts for ~80% of all lung cancer cases. Although considerable progress has been made in the treatment of LUAD, including surgical resection, chemotherapy, radiation therapy or a combination of these methods, the 5-year survival rate for the patients is still <15% (2). The low rate is partly due to the fact that >50% of cases are diagnosed at a late stage of disease (3). Therefore, there is an urgent requirement to identify novel diagnostic and prognostic biomarkers associated with the development and metastasis of LUAD. It is well known that the biological system, such as the transcriptional regulatory system, is a complex network, so the expression of genes is regulated by numerous factors, such as miRNA and transcription factors (TF) (4,5). With the development of high-throughput technology, the amount of LUAD data is increasing, which allows further examination of the molecular mechanisms of the disease. However, traditional clustering methods are usually subjective and often ignore the detailed relationships among genes, resulting in less useful information in the clustering results (6). To solve this problem, researchers have generated a gene co-expression network based on gene expression profiles. Weighted gene co-expression network analysis (WGCNA) is one of the most representative methods, and has been successfully applied in a variety of biological contexts, including mouse genetics, yeast genetics and the analysis of brain imaging data (79). The study by Udyavar et al (10) identified spleen tyrosine kinase as a candidate biomarker to stratify patients with small cell lung cancer and as a potential therapeutic target. Tian et al (11) revealed that dysregulated genes, such as cystic fibrosis transmembrane conductance regulator (CFTR), secretin receptor (SCTR) and vascular endothelial growth factor D (VEGFD), may be involved in the pathology of lung squamous cell carcinoma (LSCC) metastasis, and these genes may be used as potential diagnostic biomarkers or therapeutic targets for LSCC. A study by Guo and Xing (12) identified seven hub genes, namely Cftr, Hip1, Tbl1×, Ephx1, Cbr3, Antxr2 and Ccnd2, which may become valuable biomarkers and therapeutic targets for lung cancer risk assessment.

In the present study, WGCNA was applied to investigate the association between co-expression patterns and clinical traits in a systems level, while functional enrichment analysis was performed on modules that were significantly associated with clinical traits and the hub genes of these modules were analyzed. The present study also identified the targets of the differentially expressed miRNAs. The results indicate that the hub genes, important miRNAs and enriched TFs may serve as biomarkers for diagnosis and prognosis, and exhibit a regulatory asssociation between miRNAs and TFs (or hub genes) in LUAD.

Materials and methods

RNA-seq and miRNA-seq

High-throughput data were downloaded from the The Cancer Genome Atlas (TCGA) Data Portal (http://cancergenome.nih.gov/). The RNA-seq data included 45 normal and 45 LUAD samples (Table I). miRNA-seq data was obtained from the corresponding samples and also included 45 normal and 45 LUAD samples (Table I). These data were downloaded in the htseq.counts format. The clinical traits of each corresponding sample, including primary diagnosis, tumor stage, age at diagnosis, vital status, days until patient succumbed, sex, race, ethnicity, cigarettes/day and smoking duration (years) were also downloaded.

Table I.

The dataset numbers of RNA-seq and miRNA-seq.

Table I.

The dataset numbers of RNA-seq and miRNA-seq.

RNA-seqNormal
TCGA-44-2668-11A-01R-1758-07, TCGA-55-6982-11A-01R-1949-07,
TCGA-44-6145-11A-01R-1858-07, TCGA-55-6983-11A-01R-1949-07, TCGA-50-5930-11A-01R-1755-07,
TCGA-50-5936-11A-01R-1628-07, TCGA-55-6970-11A-01R-1949-07, TCGA-44-6146-11A-01R-1858-07,
TCGA-91-6849-11A-01R-1949-07, TCGA-55-6972-11A-01R-1949-07, TCGA-49-6744-11A-01R-1858-07,
TCGA-50-5935-11A-01R-1858-07, TCGA-91-6831-11A-02R-1858-07, TCGA-50-5931-11A-01R-1858-07, TCGA-38-4627-11A-01R-1758-07,
TCGA-91-6829-11A-01R-1858-07, TCGA-44-2655-11A-01R-1758-07, TCGA-49-6743-11A-01R-1858-07, TCGA-44-6148-11A-01R-1858-07,
TCGA-55-6969-11A-01R-1949-07, TCGA-55-6978-11A-01R-1949-07, TCGA-91-6836-11A-01R-1858-07, TCGA-38-4626-11A-01R-1758-07,
TCGA-55-6981-11A-01R-1949-07, TCGA-38-4625-11A-01R-1758-07, TCGA-44-2665-11A-01R-1758-07, TCGA-49-4490-11A-01R-1858-07,
TCGA-49-6761-11A-01R-1949-07, TCGA-44-5645-11A-01R-1628-07, TCGA-49-6745-11A-01R-1858-07, TCGA-55-6968-11A-01R-1949-07,
TCGA-55-6979-11A-01R-1949-07, TCGA-50-5932-11A-01R-1755-07, TCGA-44-6147-11A-01R-1858-07, TCGA-55-6971-11A-01R-1949-07,
TCGA-49-4512-11A-01R-1858-07, TCGA-50-5933-11A-01R-1755-07, TCGA-91-6847-11A-01R-1949-07, TCGA-38-4632-11A-01R-1755-07,
TCGA-44-6776-11A-01R-1858-07, TCGA-91-6835-11A-01R-1858-07, TCGA-44-3396-11A-01R-1758-07, TCGA-44-2657-11A-01R-1758-07,
TCGA-44-2661-11A-01R-1758-07, TCGA-44-6144-11A-01R-1755-07
Cancer
TCGA-55-7570-01A-11R-2039-07, TCGA-55-7726-01A-11R-2170-07,
TCGA-44-7661-01A-11R-2066-07, TCGA-44-7662-01A-11R-2066-07, TCGA-55-7910-01A-11R-2170-07, TCGA-44-2665-01A-01R-0946-07,
TCGA-44-7669-01A-21R-2066-07, TCGA-55-7725-01A-11R-2170-07, TCGA-44-7671-01A-11R-2066-07, TCGA-55-7724-01A-11R-2170-07,
TCGA-50-5930-01A-11R-1755-07, TCGA-49-6745-01A-11R-1858-07, TCGA-50-5933-01A-11R-1755-07, TCGA-44-6778-01A-11R-1858-07,
TCGA-78-7163-01A-12R-2066-07, TCGA-50-7109-01A-11R-2039-07, TCGA-55-7283-01A-11R-2039-07, TCGA-44-7659-01A-11R-2066-07,
TCGA-55-7574-01A-11R-2039-07, TCGA-44-7670-01A-11R-2066-07, TCGA-44-7667-01A-31R-2066-07, TCGA-55-7914-01A-11R-2170-07,
TCGA-55-7911-01A-11R-2170-07, TCGA-44-7672-01A-11R-2066-07, TCGA-44-7660-01A-11R-2066-07, TCGA-86-7713-01A-11R-2066-07,
TCGA-49-6742-01A-11R-1858-07, TCGA-78-7540-01A-11R-2066-07, TCGA-49-6743-01A-11R-1858-07, TCGA-69-7980-01A-11R-2187-07,
TCGA-44-A4SS-01A-11R-A24X-07, TCGA-55-8092-01A-11R-2241-07, TCGA-44-2659-01A-01R-0946-07, TCGA-86-7711-01A-11R-2066-07,
TCGA-86-7953-01A-11R-2187-07, TCGA-55-6985-01A-11R-1949-07, TCGA-67-6217-01A-11R-1755-07, TCGA-78-7536-01A-11R-2066-07,
TCGA-97-A4M5-01A-11R-A24X-07, TCGA-86-8279-01A-11R-2287-07, TCGA-44-2655-01A-01R-0946-07, TCGA-44-6777-01A-11R-1858-07,
TCGA-93-7348-01A-21R-2039-07, TCGA-55-7576-01A-11R-2066-07, TCGA-55-7903-01A-11R-2170-07
miRNA-seqNormal
TCGA-44-2668-11A-01R-1757-13, TCGA-93-7348-11A-01H-2038-13,
TCGA-55-7576-11A-01H-2065-13, TCGA-55-7903-11A-01H-2169-13, TCGA-55-7726-11A-01H-2169-13, TCGA-50-5932-11A-01H-2169-1,
TCGA-44-7661-11A-01H-2065-13, TCGA-44-6776-11A-01H-2169-13, TCGA-44-7662-11A-01H-2065-13, TCGA-55-7910-11A-01H-2169-13,
TCGA-91-6835-11A-01H-2169-13, TCGA-55-7570-11A-01H-2038-13, TCGA-44-2665-11A-01R-1757-13, TCGA-44-3396-11A-01R-1757-13,
TCGA-44-7669-11A-01H-2065-13, TCGA-55-7725-11A-01H-2169-13, TCGA-44-7671-11A-01H-2065-13, TCGA-55-7724-11A-01H-2169-13,
TCGA-50-5930-11A-01H-2169-13, TCGA-50-5933-11A-01H-2169-13, TCGA-44-2657-11A-01R-1757-13, TCGA-44-6778-11A-01H-2169-13,
TCGA-49-6745-11A-01H-2169-13, TCGA-78-7163-11A-01H-2065-13, TCGA-50-7109-11A-01H-2038-13, TCGA-55-7283-11A-01H-2038-13,
TCGA-44-7659-11A-01H-2065-13, TCGA-44-2661-11A-01R-1757-13, TCGA-55-7574-11A-01H-2038-13, TCGA-44-7670-11A-01H-2065-13,
TCGA-44-7667-11A-01H-2065-13, TCGA-55-7914-11A-01H-2169-13, TCGA-44-7672-11A-01H-2065-13, TCGA-55-7911-11A-01H-2169-13,
TCGA-44-7660-11A-01H-2065-13, TCGA-86-7713-11A-01H-2065-13, TCGA-49-6742-11A-01H-2169-13, TCGA-44-6144-11A-01H-2169-13,
TCGA-78-7540-11A-01H-2065-13, TCGA-49-6743-11A-01H-2169-13, TCGA-86-7711-11A-01H-2065-13, TCGA-49-6744-11A-01H-2169-13,
TCGA-44-2655-11A-01R-1757-13, TCGA-91-6836-11A-01H-2169-13, TCGA-44-6777-11A-01H-2169-13,
Cancer
TCGA-55-6982-01A-11H-1948-13, TCGA-50-5935-01A-11H-1754-13,
TCGA-91-6831-01A-11H-1857-13, TCGA-50-5931-01A-11H-1754-13, TCGA-38-4627-01A-01T-1207-13, TCGA-91-6829-01A-21H-1857-13,
TCGA-44-2655-01A-01T-0947-13, TCGA-49-6743-01A-11H-1857-13, TCGA-44-6148-01A-11H-1754-13, TCGA-55-6969-01A-11H-1948-13,
TCGA-55-6978-01A-11H-1948-13, TCGA-44-6145-01A-11H-1754-13, TCGA-38-4626-01A-01T-1207-13, TCGA-55-6981-01A-11H-1948-13,
TCGA-38-4625-01A-01T-1207-13, TCGA-44-2665-01A-01T-0947-13, TCGA-49-4490-01A-21H-1857-13, TCGA-49-6761-01A-31H-1948-13,
TCGA-44-5645-01A-01T-1627-13, TCGA-49-6745-01A-11H-1857-13, TCGA-55-6968-01A-11H-1948-13, TCGA-55-6979-01A-11H-1948-13,
TCGA-55-6983-01A-11H-1948-13, TCGA-44-6147-01A-11H-1754-13, TCGA-55-6971-01A-11H-1948-13, TCGA-49-4512-01A-21H-1857-13,
TCGA-50-5933-01A-11H-1754-13, TCGA-91-6847-01A-11H-1948-13, TCGA-38-4632-01A-01T-1754-13, TCGA-69-7980-01A-11H-2186-13,
TCGA-44-A4SS-01A-11H-A24S-13, TCGA-55-7727-01A-11H-2169-13, TCGA-44-2659-01A-01T-0947-13, TCGA-50-5930-01A-11H-1754-13,
TCGA-86-7953-01A-11H-2186-13, TCGA-55-6985-01A-11H-1948-13, TCGA-67-6217-01A-11H-1754-13, TCGA-78-7536-01A-11H-2065-13,
TCGA-97-A4M5-01A-11H-A24S-13, TCGA-86-8279-01A-11H-2286-13, TCGA-50-5936-01A-11H-1627-13, TCGA-55-6970-01A-11H-1948-13,
TCGA-44-6146-01A-11H-A279-13, TCGA-91-6849-01A-11H-1948-13, TCGA-55-6972-01A-11H-1948-13
DEG and miRNA screening

The DEGs and miRNAs between the normal and LUAD group were identified using the DESeq package (13). Genes with |log2(fold-change)|≥1 and padj≤0.01 (n=4,176) and miRNAs with |log2(fold-change)|≥1 and padj≤0.005 (n=15) were selected for subsequent analyses. Herein, fold-change refers to the ratio (the mean normalized counts from condition LUAD/the mean normalized counts from condition normal), padj refers to the adjusted P-values, and the P-values were calculated using unpaired Students t-test.

Construction of weighted gene co-expression network

The co-expression networks were constructed using the WGCNA package (14). First, the gene co-expression similarity matrix Sij=cor(i,j) was constructed, where i and j represent the expression levels of the i-th and j-th genes, respectively. Next, the similarity matrix was transformed into an adjacency matrix by using a power function aij=|Sij|β, which represents the connection strengths. Here, β is ‘soft’ power and was chosen by using the scale-free network criterion. These connection strengths were used to calculate the topology overlap matrix (TOM), which measures the connectivity of a pair of genes. The hierarchical clustering tree was built by using the dissimilarity dissTOM=1-TOM, which groups genes with similar expression patterns. In addition, for each module, module eigengene (ME) was defined, which represents the first principal component of the module. Module membership (MM) was defined using the correlation of the ME and the gene expression profile in a given module.

Function annotation of the co-expressed modules

Gene Ontology (GO) enrichment and Kyoto Encyclopedia of Genes and Genomes pathway analysis for modules were performed using the Database for Annotation, Visualization and Integrated Discovery (DAVID) (https://david.ncifcrf.gov/) (15). TF binding site information was retrieved from DAVID for discovering potential common TFs that may regulate the transcription of genes in a module.

Identification of potential targets for differentially expressed miRNAs

The targets of differentially expressed miRNAs were identified using miRWalk2.0 (16) and miRTarBase (17). In the present study, six prediction programs including miRanda, miRDB, miRWalk, RNA22, PicTar2 and TargetScan in the miRwalk2.0 were used. For genes that were not available in these two databases, multiple literature searches in PubMed using the name of the gene and the name of each differentially expressed miRNA as a key were conducted.

Module visualization

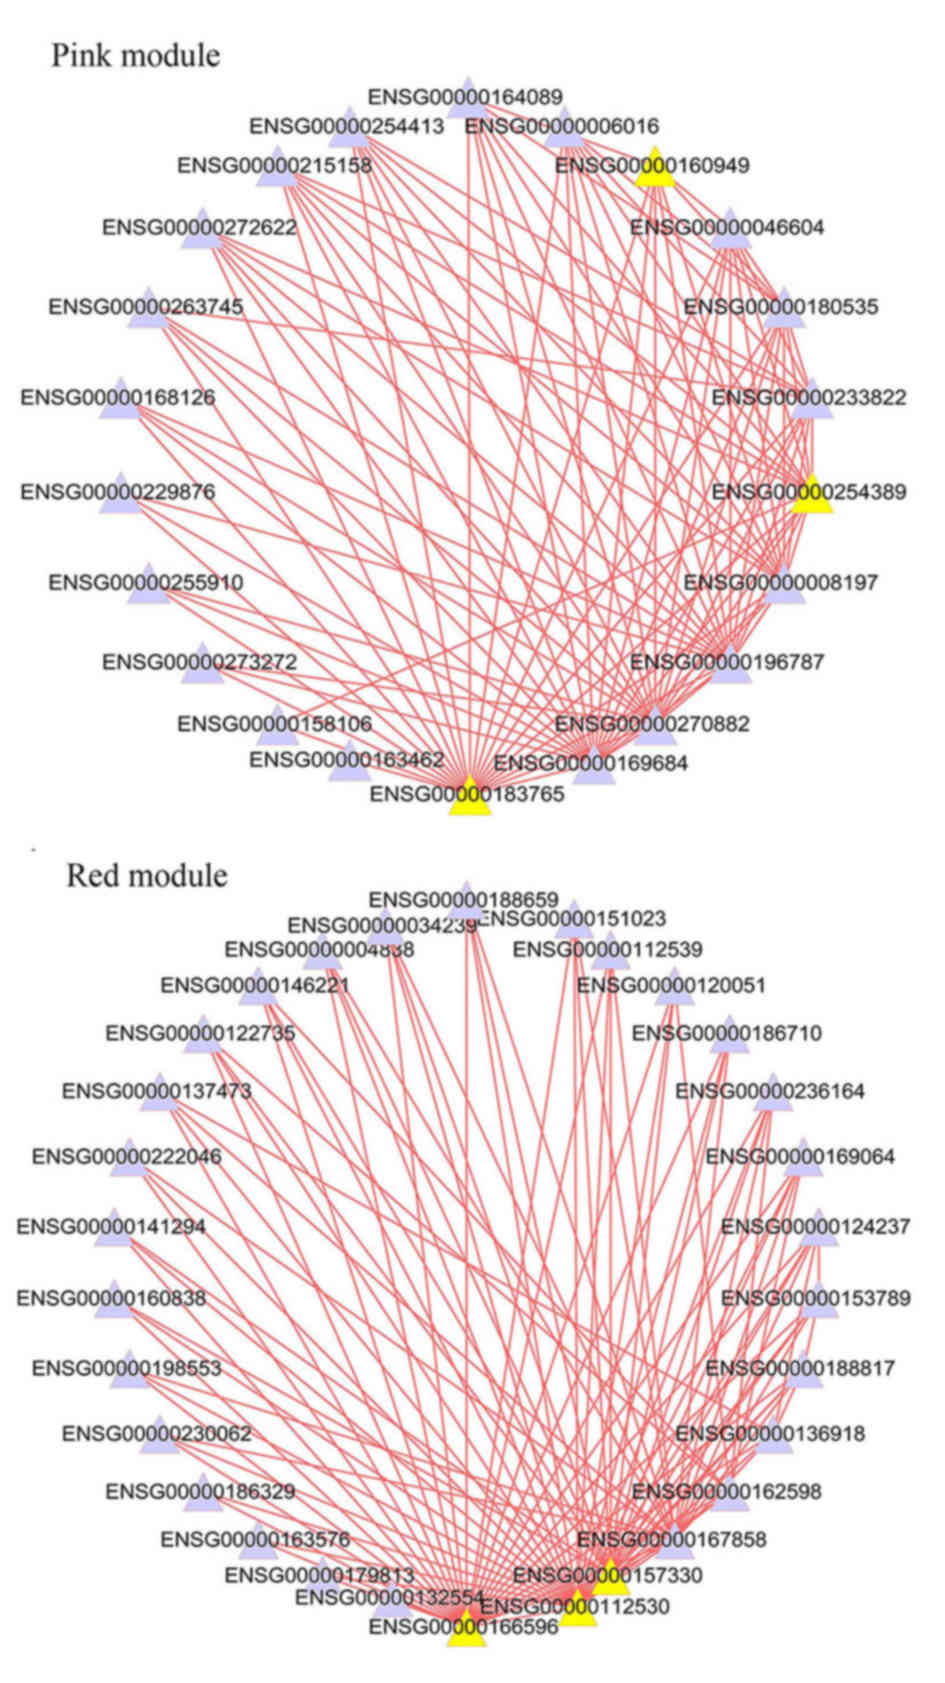
Cytoscape software (3.2.0) was used to visualize the pair-wise associations between genes (18). The top 30 genes were selected based on the MM value in each module and the top 100 pairs of genes with strong connections were depicted.

Results

Identification of trait-specific co-expression module in LUAD

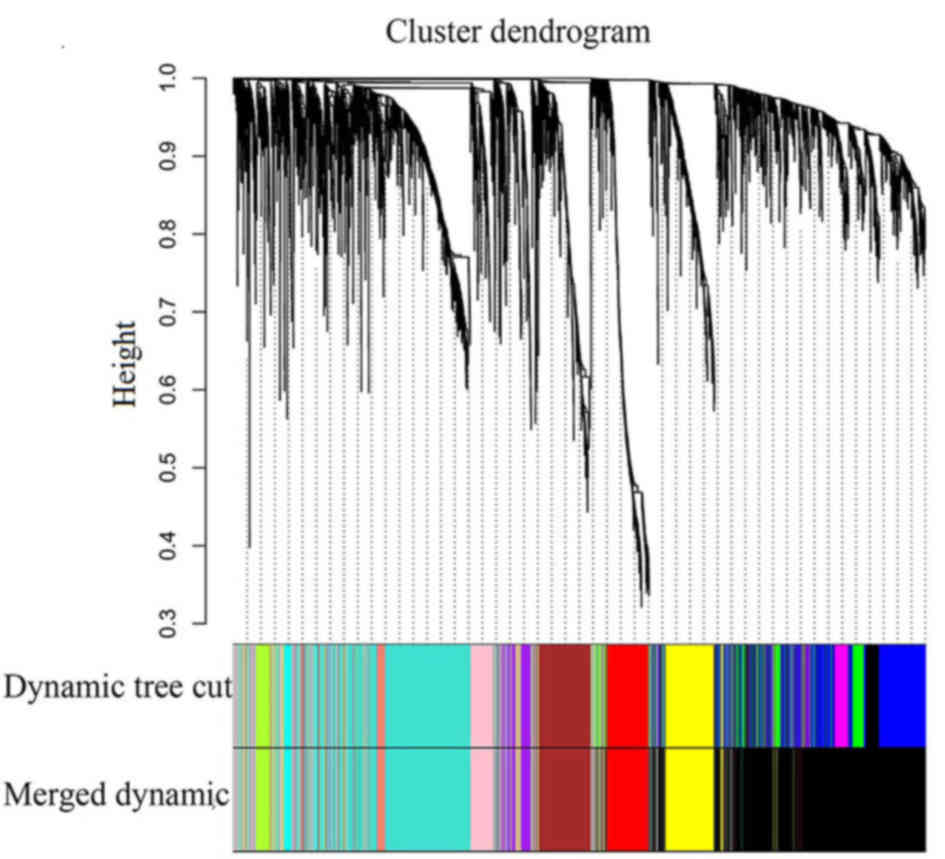
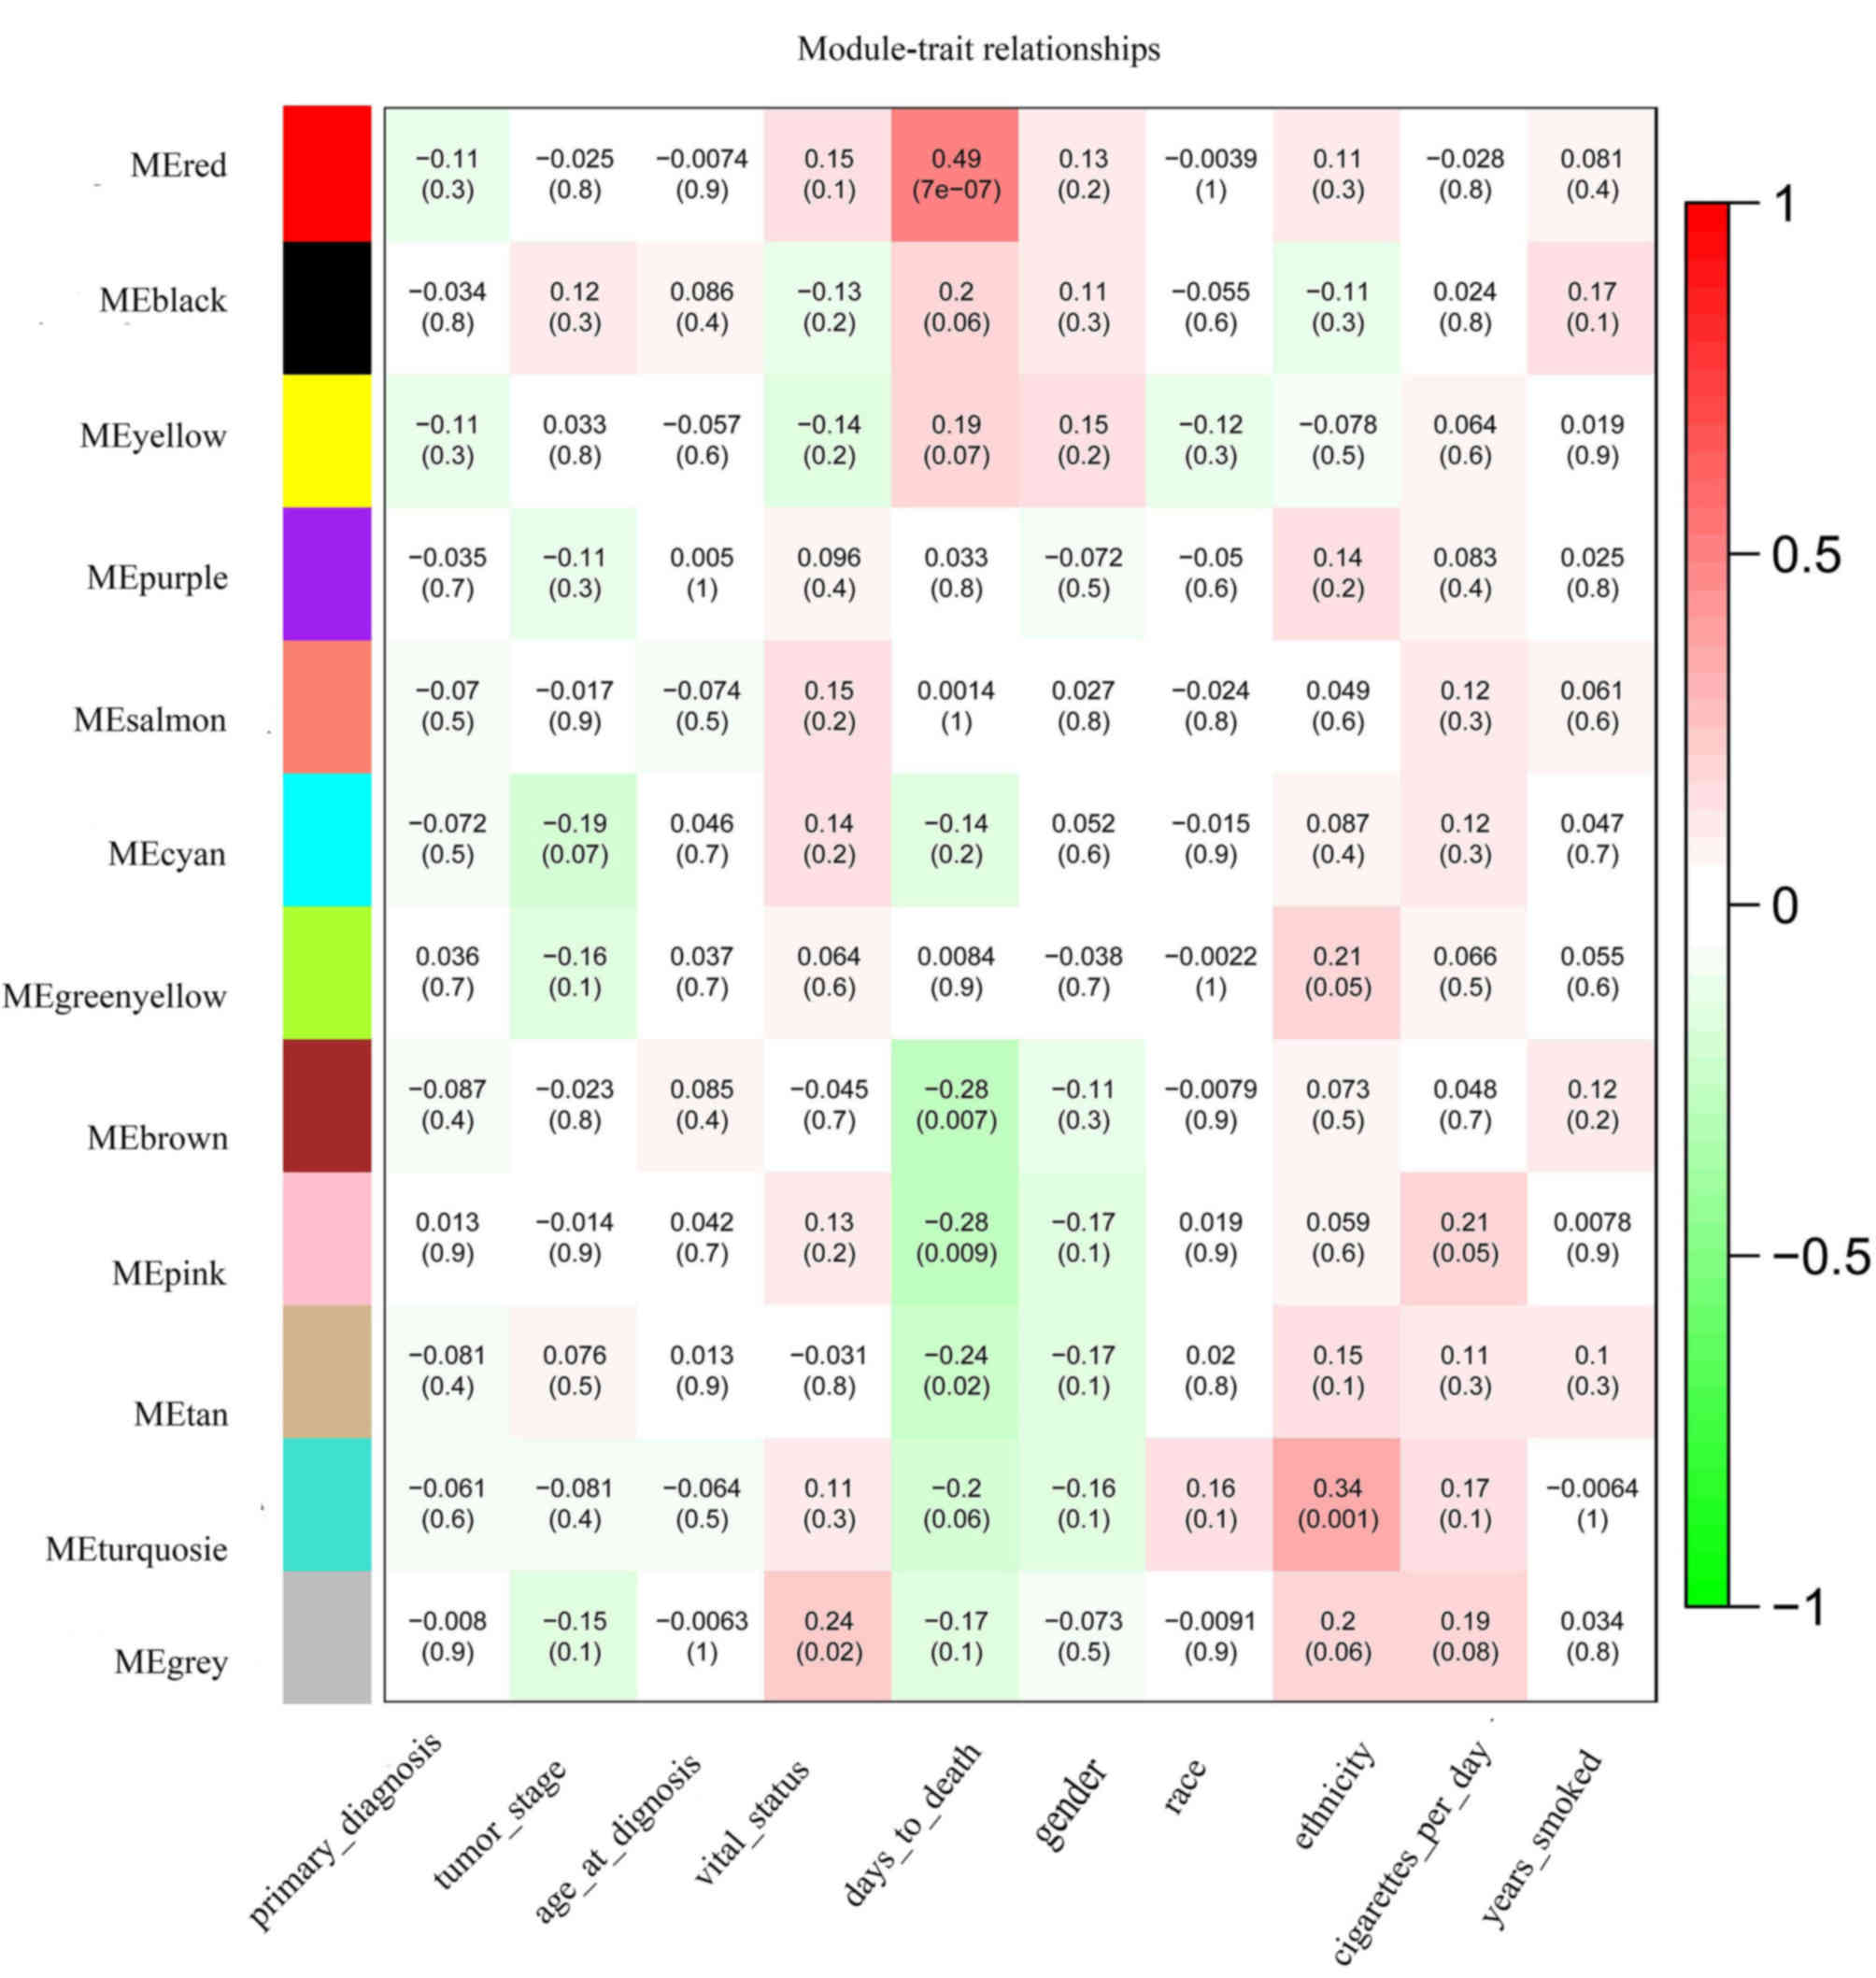
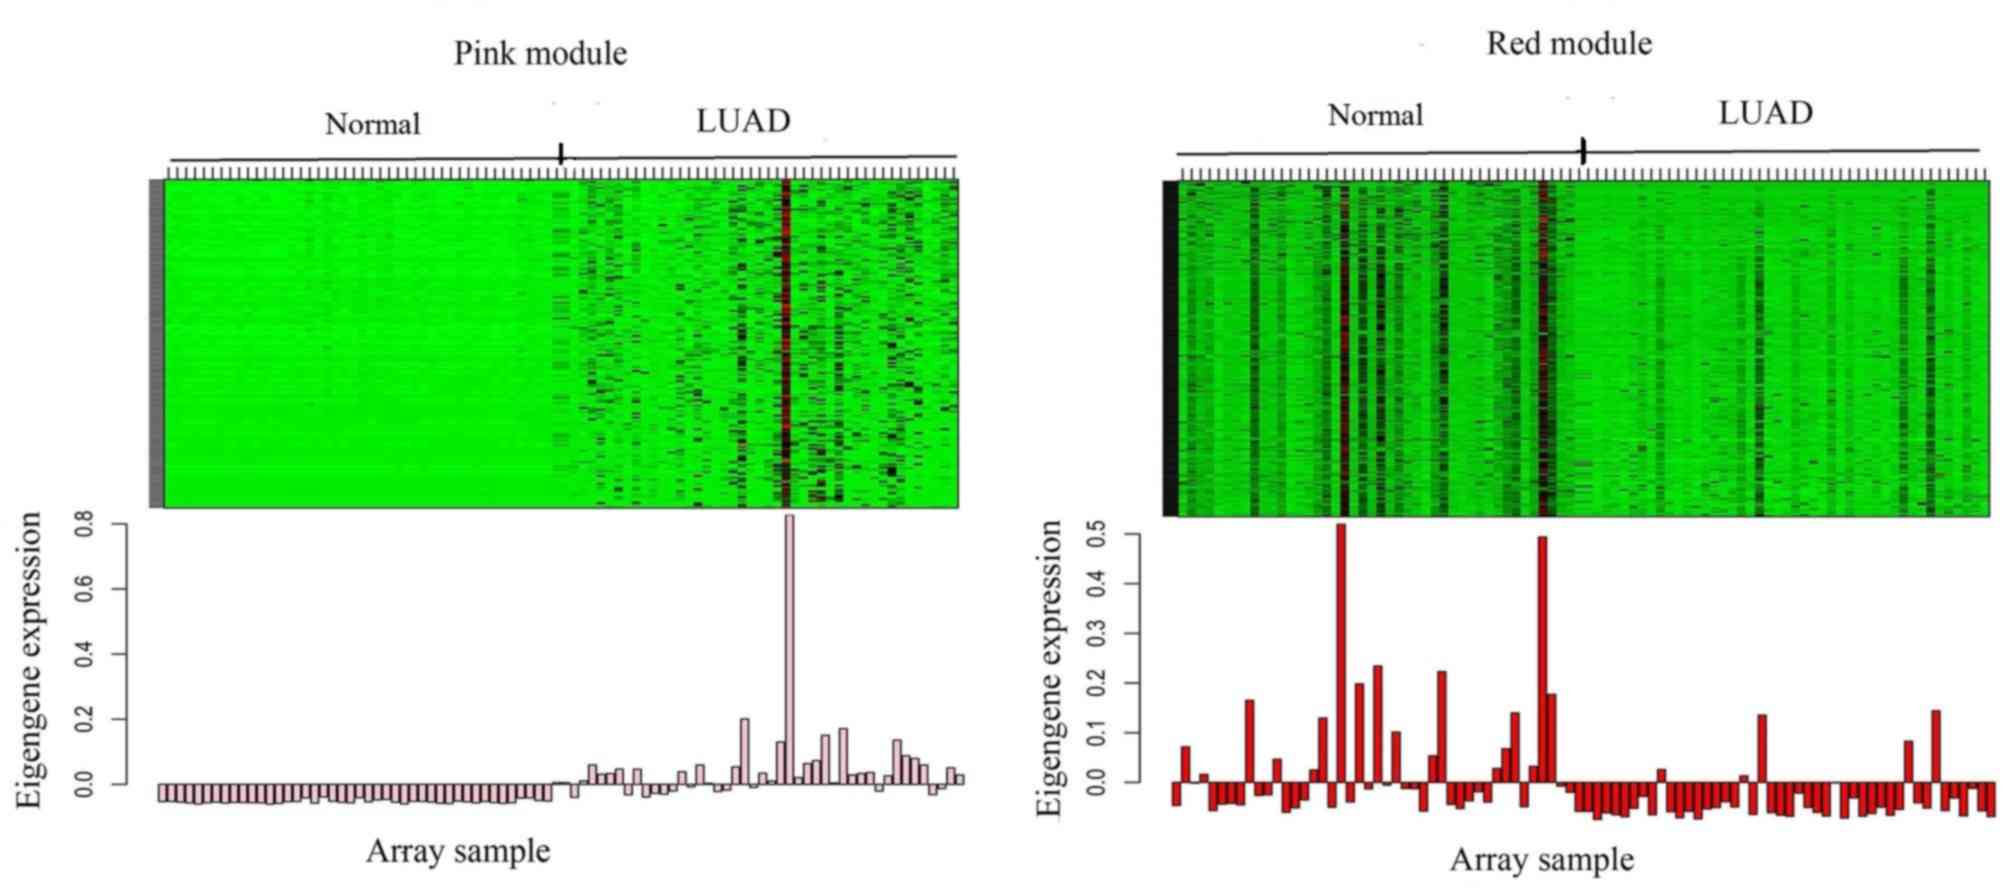
A total of 4,176 DEGs between the LUAD and normal samples were used to construct the gene co-expression networks. The ‘dynamicTreeCut’ function in the WGCNA package was used for branch cutting, with the following parameters: β=9, miModuleSize=30, deepSplit=2 and MEDissThres=0.2. A total of 2 modules were constructed (Fig. 1). To distinguish between different modules, each module was assigned a color, where the grey module was used to store unassigned genes. The aim was to identify the modules that were significantly associated with the aforementioned clinical traits of LUAD. Therefore, the Pearson correlation coefficients between ME and external traits were calculated, before finally, 9 modules significantly associated with clinical traits (P<0.1) were obtained, and the P-values were calculated using Students t-test (Fig. 2). The red, black, yellow, brown, pink, tan and turquoise modules are correlated with the trait of days to death (the number of days between the initial diagnosis and the individual succumbed), while the green-yellow and turquoise modules were revealed to be correlated with the trait of ethnicity. The pink module was also linked to the trait of cigarettes per day, and the cyan module was associated with the trait of tumor stage. The heatmap of the pink and red module, and the histogram of the expression level of ME, are presented in Fig. 3 (other modules are not displayed). The results indicate that the expression levels of ME for each module are highly associated with the expression levels of the gene in the corresponding module.

Enrichment analysis of gene modules

The present study used GO functional enrichment analysis and pathway enrichment to identify the significantly enriched biological terms and pathways for the molecules of interest. This process was performed using DAVID. The enrichment results of the interested modules are presented in Table II. For example, the biological processes of ‘nucleosome assembly’ (P=5.7×10⁻⁸) and ‘chromatin assembly (P=7.3×10⁻⁸)’ are significantly associated with the pink module, and the ‘microtubule-based process’ (P=8.8×10⁻⁵) and ‘microtubule-based movement’ (P=1.2×10⁻²) are significantly associated with the red module.

Table II.

Functional annotation of the molecule of interest.

Table II.

Functional annotation of the molecule of interest.

ModuleBiological processP-valuePathwayP-valueTFP-valueHub gene
Black
Cell adhesion 3.2×10⁻¹⁴Neuroactive ligand-receptor interaction5.2 ×10−7HFH3 1.3×10⁻¹⁷ARHGAP6
Biological adhesion
3.4×10⁻¹Vascular smooth muscle contraction2.9 ×10−6NF1 1.7×10⁻¹⁶FHL1
Wound healing 5.6×10⁻¹⁰Complement and coagulation cascades1.6 ×10−4STAT 2.5×10⁻¹⁶LDB2
BrownImmune response 1.2×10⁻⁴Systemic lupus erythematosus 2.9×10⁻²ZIC1 1.6×10⁻²MZB1
Nucleosome assembly 4.3×10⁻⁴Maturity onset diabetes of the young 6.7×10⁻²NFKAPPAB50 4.2×10⁻²FCRL5
Chromatin assembly 4.9×10⁻⁴Alanine, aspartate and glutamate metabolism 8.2×10⁻²HNF4 8.9×10⁻² ENSG00000224220.1
Cyan
Lipid transport 2.7×10⁻²   O-Glycan biosynthesis 2.5×10⁻³MEIS1 3.0×10⁻⁴HS3ST1
Lipid localization 3.1×10−2 LHX3 4.3×10⁻³LYPD1
Protein amino acid O-linked glycosylation 4.3×10⁻² AREB6 5.4×10⁻³CCNE1
Greenyellow
Biopolymer glycosylation 4.2×10⁻⁴Glycosphingolipid biosynthesis 1.7×10⁻⁴NFE2 6.7×10⁻³B3GNT3
Protein amino acid glycosylation 4.2×10⁻⁴ AP1 2.4×10⁻²ARHGEF16
Glycosylation 4.2×10⁻⁴ BACH2 4.8×10⁻²FUT3
Pink
Nucleosome assembly 5.7×10⁻⁸Systemic lupus erythematosus 1.5×10−4PAX3 3.0×10⁻⁴CHEK2
Chromatin assembly 7.3×10−8 PAX4 6.7×10⁻⁴RHPN1-AS1
Protein-DNA complex assembly 9.9×10⁻⁸ ATF6 2.2×10⁻³TONSL
Red
Microtubule-based process 8.8×10⁻⁵Neuroactive ligand-receptor interaction 8.9×10−3RFX1 9.9×10⁻⁴CFAP52
Microtubule-based movement 1.2×10⁻² STAT5B 5.1×10⁻³PACRG
Microtubule cytoskeleton organization 2.4×10⁻² HSF2 10.0×10⁻³C1orf158
Tan
Cell fate commitment 1.1×10⁻³ STAT3 1.9×10⁻²ALS2CR11
Forebrain development 1.4×10⁻³ ER 4.3×10⁻²SGO2
Regulation of neuron differentiation 1.6×10⁻² CDPCR3HD 4.3×10⁻² ENSG00000232615.4
TurquoiseM phase 1.0×10−59Cell cycle 3.8×10⁻²¹E2F 1.1×10⁻⁷DTL
Cell cycle phase 7.2×10−59Oocyte meiosis 1.8×10⁻⁸NFY 3.0×10⁻⁵TRAIP
Cell cycle 1.8×10−56 Progesterone-mediated oocyte maturation 1.3×10⁻⁴SP1 3.4×10⁻⁴NUSAP1
YellowImmune response 6.0×10⁻¹⁷PPAR signaling pathway 3.5×10⁻³ DOK2
Defense response 1.5×10⁻¹⁴Hematopoietic cell lineage 8.9×10⁻³ SPL1
Inflammatory response 4.8×10⁻¹⁰Chemokine signaling pathway 2.1×10⁻² NLRC4

[i] TF, transcription factor.

Identification of the hub genes and over-represented TFs

One of the aims of WGCNA is to identify the hub genes associated with clinical traits. It has previously been suggested that hub genes may serve crucial roles in pneumocyte senescence (19) and plasmodium falciparum (20). This indicates that the hub genes may serve as candidate biomarkers and therapeutic targets for disease. Previous studies have demonstrated that MM is used to measure the importance of a node (gene) within a network (14,19). Therefore, the present study screened the hub genes based on the MM values. Genes in co-expression networks have similar expression patterns, which may be due to the regulation of one or more common TFs. For example, DTL, TRAIP and NUSAP1 are hub genes in the turquoise module, and the genes in this module are significantly involved in the biological process of the cell cycle. The TFs that are commonly overrepresented in this module are E2F, NFY and SP1. The top 3 hub genes and commonly overrepresented TFs in each module are summarized in Table II. The top 100 pairs of genes with strong connections in the pink and red module were visualized, and are presented in Fig. 4. The network visualizations of other significant modules are not shown.

Hub genes or TFs as miRNA targets

miRNAs are small, non-coding RNAs ~22 nucleotides in length, that regulate >50% of the genes in human cells (21). Over half of identified human miRNA genes are located in cancer-associated genomic regions or fragile sites (22). The present study constructed the LUAD network, and identified the hub genes and TFs in each module of interest (Table II). Exploring which differentially expressed miRNAs can affect the development of LUAD by targeted hub genes or TFs is very important. The focus of the present study was on the 15 significantly different expressed miRNAs, 27 hub genes and 24 TFs in the modules of interest. The results indicated that 10 of the 27 hub genes were the predicted targets for 5 differentially expressed miRNAs (Table III). In addition, 12 of the 24 overrepresented TFs were the predicted targets for 8 differentially expressed miRNAs (Table III).

Table III.

Obtained miRNA-gene pairs.

Table III.

Obtained miRNA-gene pairs.

ModulemiRNA:hub genesmiRNA:TFs
Black ARHGAP6:hsa-miR-184; ARHGAP6:hsa-miR-137NF1:hsa-miR-137; NF1:hsa-miR-144; NF1:hsa-miR-153
BrownFCRL5:hsa-miR-153; FCRL5:hsa-miR-184ZIC1:hsa-miR-206; ZIC1:hsa-miR-144
CyanLYPD1:hsa-miR-206; CCNE1:hsa-miR-137; CCNE1:hsa-miR-144MEIS1:hsa-miR-144; MEIS1:hsa-miR-206; MEIS1:hsa-miR-1293; LHX3:hsa-miR-196a; LHX3:hsa-miR-147b
Green-yellow FUT3:hsa-miR-206BACH2:hsa-miR-144; BACH2:hsa-miR-206; BACH2:hsa-miR-137; BACH2:hsa-miR-153; BACH2:hsa-miR-196a; BACH2:hsa-miR-147b; BACH2:hsa-miR-1293
PinkCHEK2:hsa-miR-153; TOSNL:hsa-miR-153PAX3:hsa-miR-206; PAX3:hsa-miR-144; PAX3:hsa-miR-137; PAX4:hsa-miR-144; PAX4:hsa-miR-153; PAX4:hsa-miR-1293
Red PACRG:hsa-miR-153RFX1:hsa-miR-184; FX1:hsa-miR-1293; STAT5B:hsa-miR-153; SF2:hsa-miR-144
Tan STAT3:hsa-miR-196a
TurquoiseDTL:hsa-miR-137; DTL:hsa-miR-206; NUSAP1:hsa-miR-153SP1:hsa-miR-137; SP1:hsa-miR-144; SP1:hsa-miR-206
Yellow

[i] miRNA, microRNA; TF, transcription factor.

Discussion

Surgical treatment of stage I lung cancer has been demonstrated to be beneficial for survival (23). Therefore, it is essential to identify early diagnostic biomarkers for lung cancer. WGCNA was used in the present study to identify clusters (modules) of highly correlated genes, summarizing such clusters using the module eigengene or intramodular hub genes, associating modules to one another and external sample traits, and calculating module membership measures.

Using the WGCNA algorithm, the present study constructed the gene modules and identified the hub genes that may serve crucial roles in a specific context. For example, CHEK2, RHPN1-AS1 and TONSL are hub genes of the pink module (Table II). The protein encoded by CHEK2 is a cell cycle checkpoint regulator that can cause arrest or apoptosis in response to DNA damage (24). Previous studies have demonstrated that mutations in the CHEK2 tumor suppressor gene are associated with multi-organ cancer susceptibility (2527). TONSL, the protein encoded by this gene, may bind NF-κB complexes and trap them in the cytoplasm, preventing them from entering the nucleus and interacting with the DNA (28). The study by Piwko et al (29) examined the role of MMS22L-TONSL in DNA recombination. RHPN1-AS1 is a non-coding RNA whose function is currently unclear. GO functional enrichment analysis indicated that the biological processes of ‘nucleosome assembly’ and ‘chromatin assembly’ are significantly associated with the pink module. Therefore, it was hypothesized that the biological function of RHPN1-AS1 is associated with nucleosome assembly. The biological function of new genes can be speculated using WGCNA. The enriched TFs of the pink module were paired box PAX3, PAX4 and ATF6 (Table II). The target of miR-206 was shown to be PAX3 (Table III). Previous studies have demonstrated that the tumor tissues from patients with LUAD exhibited a decrease in the expression of miR-206, and the overexpression of miR-206 resulted in a significant suppression of cell viability and migration in LUAD cells in vitro (30,31). According to the analysis of the present study, miR-206 is downregulated 13.8-fold when compared with level in the normal samples, which may contribute to the occurrence of LUAD. These results indicate that miR-206 can act as a potential tumor suppressor and can serve as a therapeutic target for patients with LUAD. The target of miR-137 is also PAX3 (Table III), and data from TCGA revealed that higher expression of miR-137 led to a poorer survival in 458 patients with LUAD (32). Consistent with previous studies, miR-137 in LUAD was upregulated 22.6-fold compared with the level in the normal sample in the present study (33,32). Therefore, miR-137 may be an excellent diagnostic marker and an ideal therapeutic target for chemotherapy in patients with LUAD. The targets of miR-153 in the pink module were CHEK2, TOSNL and PAX4 (Table III). Several studies have shown that the expression of miR-153 in non-small cell lung cancer is significantly lower than that of the adjacent tissues (34,35). However, in the present analysis, miR-153 in LUAD was 21.1-fold upregulated compared with that in the normal samples. Therefore, we speculate that miR-153 may promote the occurrence of LUAD. PAX3 and PAX4 are members of the PAX family of TFs and play critical roles during fetal development. Mutations in PAX3 are associated with Waardenburg syndrome, craniofacial-deafness-hand syndrome and alveolar rhabdomyosarcoma (36). Although no experiments were performed to verify the role of PAX3 and PAX4 in LUAD, the present analysis predicts that PAX3 and PAX4 may be involved in the development of LUAD.

The enriched TFs of the red module were found to be RFX1, STAT5B and HSF2 (Table II), and the results demonstrated that the target of miR-153 was STAT5B (Table III). The protein encoded by STAT5B is a member of the STAT family, and STAT5B serves an important role in the progression of lung cancer (37,38). The hub genes are CFAP52, PACRG and C1orf158. It has been reported that CFAP52 protein is highly expressed in human hepatocellular carcinoma and is involved in cell proliferation (39). RNA-seq analysis of tissue samples from 95 individuals revealed that the expression of CFAP52 is tissue-specific in the testes (RPKM 8.3), lungs (RPKM 3.0), brain (RPKM 0.6) and endometrium (RPKM 0.5) (40). The PACRG protein is associated with ciliary motion and anchored to the axonemal doublet microtubules (41). A previous study demonstrated that mRNA and protein levels of PARK2 and PACRG are significantly downregulated in clear-cell renal cell carcinoma when compared with those in non-malignant tissues (42). Fagerberg et al (40) reported that C1orf158 was only expressed in the lungs (RPKM 1.5) and testes (RPKM 23.3) among 27 investigated tissues.

The analysis of the present study demonstrated that the hub genes and the enriched TFs in the pink and red modules have either been experimentally verified to be involved in the development of LUAD or participated in biological processes associated with cancer development. In addition, differentially expressed miR-206, miR-137 and miR-153 interacting with hub genes or enriched TFs in the pink and red modules have been shown to be involved in the occurrence of LUAD. The pink and red modules are highly correlated with the trait of days to death, and this indicates that the disordered hub genes, TFs and miRNAs may affect the survival time of patients. In addition, other DEGs also serve important roles in the pathogenesis of LUAD. For example, FOXM1, RPLP0P2, RAC3 and BRCA1 are differentially expressed genes in the turquoise module, and all of these genes have been demonstrated to be involved in LUAD.

The present study used a systems biology approach to examine LUAD. It is helpful to reduce the complexity of multivariate datasets and allow investigators to gain insights into the expression patterns of mRNAs. Furthermore, by considering the biological function of the module, the function of novel genes can be hypothesized. The comprehensive analysis of miRNA and gene expression profiles indicates that the occurrence of LUAD is associated with interactions between mRNA and miRNA. miRNAs may affect LUAD by regulating the overrepresented TFs, as well as hub genes, in these modules. Those essential genes can serve as the diagnostic and prognostic biomarkers for LUAD. However, there are limitations to the present study, including the fact that it focuses on discussing the pink and red modules associated with the clinical trait of days to death, and other modules associated with the clinical traits require subsequent analysis. In future study studies, a multi-factorial integrative analysis will be performed, taking into account, for example, various epigenetic factors. In summary, the present analysis may provide new insights into the different regulatory mechanisms of LUAD and help to identify specific transcriptional networks that may be involved in the development and progression of LUAD.

Acknowledgements

Not applicable.

Funding

The present study was supported by the National Natural Science Foundation of China (grant nos. 61861035, 31870838, 31460234 and 11747315).

Availability of data and material

The datasets generated and analyzed during the present study are available in the TCGA repository [http://cancergenome.nih.gov/].

Authors' contributions

YZ collected, analyzed and interpreted the data, and wrote the manuscript. YC and QL conceive the idea and were involved in study discussion and writing of the manuscript. LZ participated in the analysis of the data. All authors read and approved the final manuscript.

Ethics approval and consent to participate

Not applicable.

Patient consent for publication

Not applicable.

Competing interests

The authors declare that they have no competing interests.

References

1 

Chen W, Zheng R, Baade PD, Zhang S, Zeng H, Bray F, Jemal A, Yu XQ and He J: Cancer statistics in China, 2015. CA Cancer J Clin. 66:115–132. 2016. View Article : Google Scholar : PubMed/NCBI

2 

Youlden DR, Cramb SM and Baade PD: The international epidemiology of lung cancer: Geographical distribution and secular trends. J Thorac Oncol. 8:819–831. 2008. View Article : Google Scholar

3 

Siegel RL, Miller KD and Jemal A: Cancer statistics, 2016. CA Cancer J Clin. 66:7–30. 2016. View Article : Google Scholar : PubMed/NCBI

4 

Mullany LE, Herrick JS, Wolff RK, Stevens JR, Samowitz W and Slattery ML: MicroRNA-transcription factor interactions and their combined effect on target gene expression in colon cancer cases. Genes Chromosomes Cancer. 57:192–202. 2018. View Article : Google Scholar : PubMed/NCBI

5 

Fang X, Sastry A, Mih N, Kim D, Tan J, Yurkovich JT, Lloyd CJ, Gao Y, Yang L and Palsson BO: Global transcriptional regulatory network for Escherichia coli robustly connects gene expression to transcription factor activities. Proc Natl Acad Sci USA. 114:10286–10291. 2017. View Article : Google Scholar : PubMed/NCBI

6 

Ruan J, Dean AK and Zhang W: A general co-expression network-based approach to gene expression analysis: Comparison and applications. BMC Syst Biol. 4:82010. View Article : Google Scholar : PubMed/NCBI

7 

Miller JA, Horvath S and Geschwind DH: Divergence of human and mouse brain transcriptome highlights Alzheimer disease pathways. Proc Natl Acad Sci USA. 107:12698–12703. 2010. View Article : Google Scholar : PubMed/NCBI

8 

Carlson MR, Zhang B, Fang Z, Mischel PS, Horvath S and Nelson SF: Gene connectivity, function, and sequence conservation: Predictions from modular yeast co-expression networks. BMC Genomics. 7:402006. View Article : Google Scholar : PubMed/NCBI

9 

Oldham MC, Konopka G, Iwamoto K, Langfelder P, Kato T, Horvath S and Geschwind DH: Functional organization of the transcriptome in human brain. Nat Neurosci. 11:1271–1282. 2008. View Article : Google Scholar : PubMed/NCBI

10 

Udyavar AR, Hoeksema MD, Clark JE, Zou Y, Tang Z, Li Z, Li M, Chen H, Statnikov A, Shyr Y, et al: Co-expression network analysis identifies SpleenTyrosine Kinase (SYK) as a candidate oncogenic driver in a subset of small-cell lung cancer. BMC Syst Bio. 5 (Suuppl):S12013. View Article : Google Scholar

11 

Tian F, Zhao J, Fan X and Kang Z: Weighted gene co-expression network analysis in identification of metastasis-related genes of lung squamous cell carcinoma based on the Cancer Genome Atlas database. J Thorac Dis. 9:42–53. 2017. View Article : Google Scholar : PubMed/NCBI

12 

Gou Y and Xing Y: Weighted gene co-expression network analysis of pneumocytes under exposure to a carcinogenic dose of chloroprene. Life Sci. 151:339–347. 2016. View Article : Google Scholar : PubMed/NCBI

13 

Anders S and Huber W: Differential expression analysis for sequence count data. Genome Biol. 11:R1062010. View Article : Google Scholar : PubMed/NCBI

14 

Langfelder P and Horvath S: WGCNA: An R package for weighted correlation network analysis. BMC Bioinformatics. 9:5592008. View Article : Google Scholar : PubMed/NCBI

15 

Huang DW, Sherman BT, Tan Q, Kir J, Liu D, Bryant D, Guo Y, Stephens R, Baseler MW, Lane HC and Lempicki RA: DAVID Bioinformatics Resources: Expanded annotation database and novel algorithms to better extract biology from large gene lists. Nucleic Acids Res. 35:W169–W175. 2007. View Article : Google Scholar : PubMed/NCBI

16 

Dweep H, Sticht C, Pandey P and Gretz N: miRWalk-database: Prediction of possible miRNA binding sites by ‘walking’ the genes of three genomes. J Biomed Inform. 5:839–847. 2011. View Article : Google Scholar

17 

Chou CH, Shrestha S, Yang CD, Chang NW, Lin YL, Liao KW, Huang WC, Sun TH, Tu SJ, Lee WH, et al: miRTarBase update 2018: A resource for experimentally validated microRNA-target interactions. Nucleic Acids Res. 46:D296–D302. 2018. View Article : Google Scholar : PubMed/NCBI

18 

Shannon P, Markiel A, Ozier O, Baliga NS, Wang JT, Ramage D, Amin N, Schwikowski B and Ideker T: Cytoscape: A software environment for integrated models of biomolecular interaction networks. Genome Res. 13:2498–2504. 2003. View Article : Google Scholar : PubMed/NCBI

19 

Xing Y, Zhang J, Lu L, Li D, Wang Y, Huang S, Li C, Zhang Z, Li J and Meng A: Identification of hub genes of pneumocyte senescence induced by thoracic irradiation using weighted gene coexpression network analysis. Mol Med Rep. 13:107–116. 2016. View Article : Google Scholar : PubMed/NCBI

20 

Subudhi AK, Boopathi PA, Pandey I, Kaur R, Middha S, Acharya J, Kochar SK, Kochar DK and Das A: Disease specific modules and hub genes for intervention strategies: A co-expression network based approach for Plasmodium falciparum clinical isolates. Infect Genet Evol. 35:96–108. 2015. View Article : Google Scholar : PubMed/NCBI

21 

Ha M and Kim VN: Regulation of microRNA biogenesis. Nat Rev Mol Cell Biol. 15:509–524. 2014. View Article : Google Scholar : PubMed/NCBI

22 

Calin GA, Sevignani C, Dumitru CD, Hyslop T, Noch E, Yendamuri S, Shimizu M, Rattan S, Bullrich R, Negrini M and Croce CM: Human microRNA genes are frequently located at fragile sites and genomic regions involved in cancers. Proc Natl Acad Sci USA. 101:2999–3004. 2004. View Article : Google Scholar : PubMed/NCBI

23 

Hong QY, Wu GM, Qian GS, Hu CP, Zhou JY, Chen LA, Li WM, Li SY, Wang K, Wang Q, et al: Prevention and management of lung cancer in China. Cancer. 121 (Suppl 17):S3080–S3088. 2015. View Article : Google Scholar

24 

Al-Rakan MA, Hendrayani SF and Aboussekhra A: CHEK2 represses breast stromal fibroblasts and their paracrine tumor-promoting effects through suppressing SDF-1 and IL-6. BMC Cancer. 16:5752016. View Article : Google Scholar : PubMed/NCBI

25 

Wang Y, McKay JD, Rafnar T, Wang Z, Timofeeva MN, Broderick P, Zong X, Laplana M, Wei Y, Han Y, et al: Rare variants of large effect in BRCA2 and CHEK2 affect risk of lung cancer. Nat Genet. 46:736–741. 2014. View Article : Google Scholar : PubMed/NCBI

26 

Siołek M, Cybulski C, Gąsior-Perczak D, Kowalik A, Kozak-Klonowska B, Kowalska A, Chłopek M, Kluźniak W, Wokołorczyk D, Pałyga I, et al: CHEK2 mutations and the risk of papillary thyroid cancer. Int J Cancer. 137:548–552. 2015. View Article : Google Scholar : PubMed/NCBI

27 

Leedom TP, LaDuca H, McFarland R, Li S, Dolinsky JS and Chao EC: Breast cancer risk is similar for CHEK2 founder and non-founder mutation carriers. Cancer Genet. 209:403–407. 2016. View Article : Google Scholar : PubMed/NCBI

28 

Nquyen MH, Ueda K, Nakamura Y and Daigo Y: Identification of a novel oncogene, MMS22L, involved in lung and esophageal carcinogenesis. Int J Oncol. 4:1285–1296. 2012.

29 

Piwko W, Mlejnkova LJ, Mutreja K, Ranjha L, Stafa D, Smirnov A, Brodersen MM, Zellweger R, Sturzenegger A, Janscak P, et al: The MMS22L-TONSL heterodimer directly promotes RAD51-dependent recombination upon replication stress. EMBO J. 35:2584–2601. 2016. View Article : Google Scholar : PubMed/NCBI

30 

Chen X, Tong ZK and Zhou JY, Yao YK, Zhang SM and Zhou JY: MicroRNA-206 inhibits the viability and migration of human lung adenocarcinoma cells partly by targeting MET. Oncol Lett. 12:1171–1177. 2016. View Article : Google Scholar : PubMed/NCBI

31 

Chen QY, Jiao DM, Yan L, Wu YQ, Hu HZ, Song J, Yan J, Wu LJ, Xu LQ and Shi JG: Comprehensive gene and microRNA expression profiling reveals miR-206 inhibits MET in lung cancer metastasis. Mol Biosyst. 11:2290–2302. 2015. View Article : Google Scholar : PubMed/NCBI

32 

Su TJ, Ku WH, Chen HY, Hsu YC, Hong QS, Chang GC, Yu SL and Chen JJ: Oncogenic miR-137 contributes to cisplatin resistance via repressing CASP3 in lung adenocarcinoma. Am J Cancer Res. 6:1317–1330. 2016.PubMed/NCBI

33 

Chang TH, Tsai MF, Gow CH, Wu SG, Liu YN, Chang YL, Yu SL, Tsai HC, Lin SW, Chen YW, et al: Upregulation of microRNA-137 expression by Slug promotes tumor invasion and metastasis of non-small cell lung cancer cells through suppression of TFAP2C. Cancer Lett. 402:190–202. 2017. View Article : Google Scholar : PubMed/NCBI

34 

Chen WJ, Zhang EN, Zhong ZK, Jiang MZ, Yang XF, Zhou DM and Wang XW: MicroRNA-153 expression and prognosis in non-small cell lung cancer. Int J Clin Exp Pathol. 8:8671–8675. 2015.PubMed/NCBI

35 

Shan N, Shen L, Wang J, He D and Duan C: MiR-153 inhibits migration and invasion of human non-small-cell lung cancer by targeting ADAM19. Biochem Biophys Res Commun. 456:385–391. 2015. View Article : Google Scholar : PubMed/NCBI

36 

Boudjadi S, Chatterjee B, Sun W, Vemu P and Barr FG: The expression and function of PAX3 in development and disease. Gene. 666:145–157. 2018. View Article : Google Scholar : PubMed/NCBI

37 

Pastuszak-Lewandoska D, Domańska D, Czarnecka KH, Kordiak J, Migdalska-Sęk M, Nawrot E, Kiszałkiewicz J, Antczak A, Górski P and Brzeziańska E: Expression of STAT5, COX-2 and PIAS3 in correlation with NSCLC histhopathological features. PLoS One. 9:e1042652014. View Article : Google Scholar : PubMed/NCBI

38 

Cao S, Yan Y, Zhang X, Zhang K, Liu C, Zhao G, Han J, Dong Q, Shen B, Wu A and Cui J: EGF stimulates cyclooxygenase-2 expression through the STAT5 signaling pathway in human lung adenocarcinoma A549 cells. Int J Oncol. 39:383–391. 2011.PubMed/NCBI

39 

Silva FP, Hamamoto R and Nakamura Y: WDRPUH, a novel WD-repeat-containing protein, is highly expressed in human hepatocellular carcinoma and involved in cell proliferation. Neoplasia. 7:348–355. 2005. View Article : Google Scholar : PubMed/NCBI

40 

Fagerberg L, Hallström BM, Oksvold P, Kampf C, Djureinovic D, Odeberg J, Habuka M, Tahmasebpoor S, Danielsson A, Edlund K, et al: Analysis of the human tissue-specific expression by genome-wide integration of transcriptomics and antibody-based proteomics. Mol Cell Proteomics. 13:397–406. 2014. View Article : Google Scholar : PubMed/NCBI

41 

Loucks CM, Bialas NJ, Dekkers MP, Walker DS, Grundy LJ, Li C, Inglis PN, Kida K, Schafer WR, Blacque OE, et al: PACRG, a protein linked to ciliary motility, mediates cellular signaling. Mol Biol Cell. 27:2133–2144. 2016. View Article : Google Scholar : PubMed/NCBI

42 

Toma MI, Wuttig D, Kaiser S, Herr A, Weber T, Zastrow S, Koch R, Meinhardt M, Baretton GB, Wirth MP and Fuessel S: PARK2 and PACRG are commonly downregulated in clear-cell renal cell carcinoma and are associated with aggressive disease and poor clinical outcome. Gene Chromosome Canc. 3:265–273. 2013. View Article : Google Scholar

Related Articles

Journal Cover

August-2019
Volume 18 Issue 2

Print ISSN: 1792-1074
Online ISSN:1792-1082

Sign up for eToc alerts

Recommend to Library

Copy and paste a formatted citation
x
Spandidos Publications style
Zhai Y, Chen Y, Li Q and Zhang L: Exploration of the hub genes and miRNAs in lung adenocarcinoma. Oncol Lett 18: 1713-1722, 2019
APA
Zhai, Y., Chen, Y., Li, Q., & Zhang, L. (2019). Exploration of the hub genes and miRNAs in lung adenocarcinoma. Oncology Letters, 18, 1713-1722. https://doi.org/10.3892/ol.2019.10478
MLA
Zhai, Y., Chen, Y., Li, Q., Zhang, L."Exploration of the hub genes and miRNAs in lung adenocarcinoma". Oncology Letters 18.2 (2019): 1713-1722.
Chicago
Zhai, Y., Chen, Y., Li, Q., Zhang, L."Exploration of the hub genes and miRNAs in lung adenocarcinoma". Oncology Letters 18, no. 2 (2019): 1713-1722. https://doi.org/10.3892/ol.2019.10478