Introduction
Primary hepatocellular carcinoma (HCC) is one of the
most common malignancies and the third leading cause of
cancer-related death worldwide (1).
The recurrence rate of HCC 5-years after surgery is >60% in
Japan (2). Studies have found that
tumor heterogeneity, high degree of differentiation, large size,
multicentricity, microvascular invasion, intraoperative extrusion
of the tumor, postoperative intervention, macroscopic or
microscopic portal venous tumor extension and intrahepatic
metastasis were risk factors indicative of poor prognosis after
surgery (3–5). Magnetic resonance imaging (MRI)
provides valuable imaging information for the preoperative and
postoperative evaluation of HCC (6).
Gadolinium-ethoxybenzyl diethylenetriamine
pentaacetic (Gd-EOB-DTPA)-enhanced MRI has been widely used in the
evaluation of HCC, as it aids in the differential diagnosis,
grading and final diagnosis process (7–9). The
uptake of Gd-EOB-DTPA in HCC is determined by the expression of
organic anion transporter polypeptide 1B1 (OATP1B1) and OATPIB3,
and their activity can predict the signal intensity of
Gd-EOB-DTPA-MRI (10). A previous
study found that dysplastic nodules (DN) reduced the uptake of
Gd-EOB-DTPA and that the enhancement rate of DN in the
hepatobiliary phase was higher compared with that in the moderately
and poorly differentiated HCC (11).
The advantage of Gd-EO-DTPA is that it is taken up by hepatocytes,
resulting in the maximal enhancement of normal liver parenchyma in
the hepatobiliary phase (HBP) 20 min after injection of the
contrast agent (12), thus improving
the detection rate of the lesion. A previous study by Zeng et
al (13) found that
Gd-EOB-DTPA-MRI significantly improved the diagnostic and accuracy
rates of the liver focal lesions compared with multislice computed
tomography and MRI non-specific gadolinium contrast. However,
Gd-EOB-DTPA-MRI is inadequate to detect HCC for clinical treatment.
Hence, evaluating the liver background and grading of the tumor are
crucial factors for a better treatment. A previous study proved
that dynamic contrast-enhanced (DCE)-MRI with Gd-EOB-DTPA as a
liver-specific MR contrast agent can improve the sensitivity and
accuracy in the detection of small HCC (14). In addition, An et al (9) reported that the enhanced degree of HCC
on the early arterial phase was correlated with its
histopathological grade by using multi-parameter quantitative
analysis based on Gd-EOB-DTPA-enhanced MRI and diffusion-weighted
imaging (DWI). However, the specificity of these multi-parameter
methods for grading HCC in the aforementioned studies was not
significant. T1 mapping based on Gd-EOB-DTPA-enhanced
MRI has been increasingly used for qualitatively diagnosing
diseases of hepatic fibrosis and liver function, and it has
achieved good efficiency for discriminating between different
degrees of liver fibrosis (15–17).
Previous studies found that it was valuable to evaluate
T1 mapping quantitatively at 5-, 10- and 20-min HBP
after contrast enhancement for distinguishing interhepatic focal
lesions (16,18–20).
Previously, retrospective studies demonstrated that T1
mapping before and after Gd-EOB-DTPA administration can benefit HCC
grading, since T1 mapping could reflect the microscopic
changes associated with the tumor to a certain extent (16,18–20).
Up to now, there have been few T1 mapping
studies on HCC grading focusing on the association between
T1 mapping and HCC recurrence (21). The aim of the present study was to
investigate the correlation between T1 mapping and the
histopathological grade of HCC, which subsequently provides more
preoperative diagnostic information by calculating the
T1 value to predict the recurrence of HCC.
Materials and methods
Patients
Retrospective data collection and analysis was
approved by the Institutional Review Board of The First Affiliated
Hospital of Guangxi Medical University (Nanning, China). A total of
75 consecutive patients who were diagnosed with primary HCC,
confirmed by histopathological examination, between September 2015
and March 2017, were enrolled for the present study. All patients
underwent a hepatectomy within 2 weeks of Gd-EOB-DTPA-enhanced MRI.
Inclusion criteria were as follows: i) Patients who underwent
Gd-EOB-DTPA-enhanced MRI before hepatectomy or liver biopsy; ii)
patients who underwent surgical resection treatment; and iii)
patients who were confirmed to have primary HCC by
histopathological staining. Exclusion criteria were as follows: i)
Tumor size >1 cm; ii) previous interventional treatment; iii)
metastasis; and iv) diffuse-type HCC. Recurrence was defined as a
new lesion that was observed by two experienced radiologists on
imaging (CT, MRI and ultrasound) or confirmed by pathology after
rehepatectomy. All the patients were followed up until September
30, 2018, or until mortality. For patients who were unable to
undergo reexamination in person at The First Affiliated Hospital of
Guangxi Medical University, follow-up was performed 3 months after
surgery, via telephone. Written informed consent was obtained from
all patients with HCC. For the histopathological examination, the
HCC tissues and corresponding non-cancerous were fixed in 4%
neutral formaldehyde at 65°C for 2 h and subsequently the
paraffin-embedded tissues were cut into 4 µm sections. Following
which hematoxylin and eosin staining was performed for 1 h at room
temperature. Pathological sections were observed under an Olympus
BX53 light microscope (magnification, ×100 and ×200) and the
features of HCC were observed as follows: The hepatocytes were
polygonal or round, and arranged as nests or cables; the nuclei
were enlarged and its nucleolus was deeply stained and there was an
abundance of blood sinuses in the cancer nests.
MRI protocols
All MR scans were conducted on a 3T MRI scanner
(Magnetom Verio; Siemens Healthineers) with an 8-channel
phased-array body coil. Half-fourier acquisition single-shot turbo
spin echo sequence, axial turbo spin echo T2-weighted free
breathing with fat suppression sequence, and breath-hold axial
single-shot echo planar imaging DWI fat-suppressed sequence were
performed prior to contrast enhancement. An axial
T1-weighted three-dimensional spoiled gradient echo
volume interpolated body examination fat-suppressed sequence was
performed to acquire DCE-MRI data. A bolus of 0.025 mmol/kg
Gd-EOB-DTPA (Bayer AG) was injected at a rate of 2 ml/sec through
the cubital vein, followed by a 20-ml saline flush at the same
rate. T1 mapping was performed before and at the 5, 10
and 20 min delay phases after Gd-EOB-DTPA administration. The
sequence parameters used are listed in Table I.
 | Table I.Magnetic resonance imaging sequences
used in the present study. |
Table I.
Magnetic resonance imaging sequences
used in the present study.
| Sequences | Repetition time,
msec | Echo time,
msec | Flip angle, ° | Slice thickness,
mm | Matrix | Field of view,
mm |
|---|
| Plain scan |
|
|
|
|
|
|
| T1WI,
tra | 3.96 | 1.41 | 9 | 4.5 | 224×320 | 350×350 |
|
In/outphase | 171 | 2.31 | 70 | 6 | 192×256 | 380×380 |
| T2WI,
tra | 2,930 | 89 | 133 | 6 | 240×320 | 400×400 |
| T2WI,
cro | 1,800 | 95 | 160 | 6 | 224×320 | 380×380 |
| VIBE-T1
mapping | 3.96 | 1.41 | 2/15 | 4.5 | 224×320 | 350×350 |
|
DWI | 9,200 | 66 |
| 6 | 118×148 | 420×420 |
| Dynamic
contrast-enhanced |
|
|
|
|
|
|
| T1WI,
tra | 4.56 | 1.48 | 30 | 4.5 | 224×320 | 350×350 |
| T1WI,
cor | 3.32 | 1.17 | 9 | 4 | 216×288 | 350×350 |
| VIBE-T1
mapping | 3.96 | 1.41 | 2/15 | 4.5 | 224×320 | 350×350 |
T1 value measurement
All MRI data obtained from the patients were
analyzed to measure T1 relaxation time using
operator-defined regions of interest (ROI). The ROI with an area of
1–1.2 cm2 was drawn manually on the lesion and
non-tumorous liver parenchyma (1–2 cm distant from the margin of
the tumor) by two experienced radiologists, respectively, who were
blinded to the histopathological information, and each ROI was
taken three times to measure the mean T1 values for
further analysis. In case of conflicts, the decision was
negotiated. All measurements were performed to avoid bile duct,
hemorrhage, necrosis, cystic, fat, blood vessels and bile ducts,
artifacts, selecting the maximum tumor cross-sectional area
(Fig. 1). Subsequently, the average
values were calculated and the T1 value was expressed as
the mean ± standard deviation (SD). The increasing rate of
T1 value in the HCC lesion [T1(L-H)/H (%)]
was calculated using the following equation: T1(L-H)/H
(%)=(T1L-T1H)/T1H ×100, where L
indicates the lesion and H indicates the hepatic parenchyma. The
T1(L-H)/H (%) values before and at the 5-, 10- and
20-min HBP after Gd-EOB-DTPA administration for each patient were
respectively calculated by the aforementioned equation.
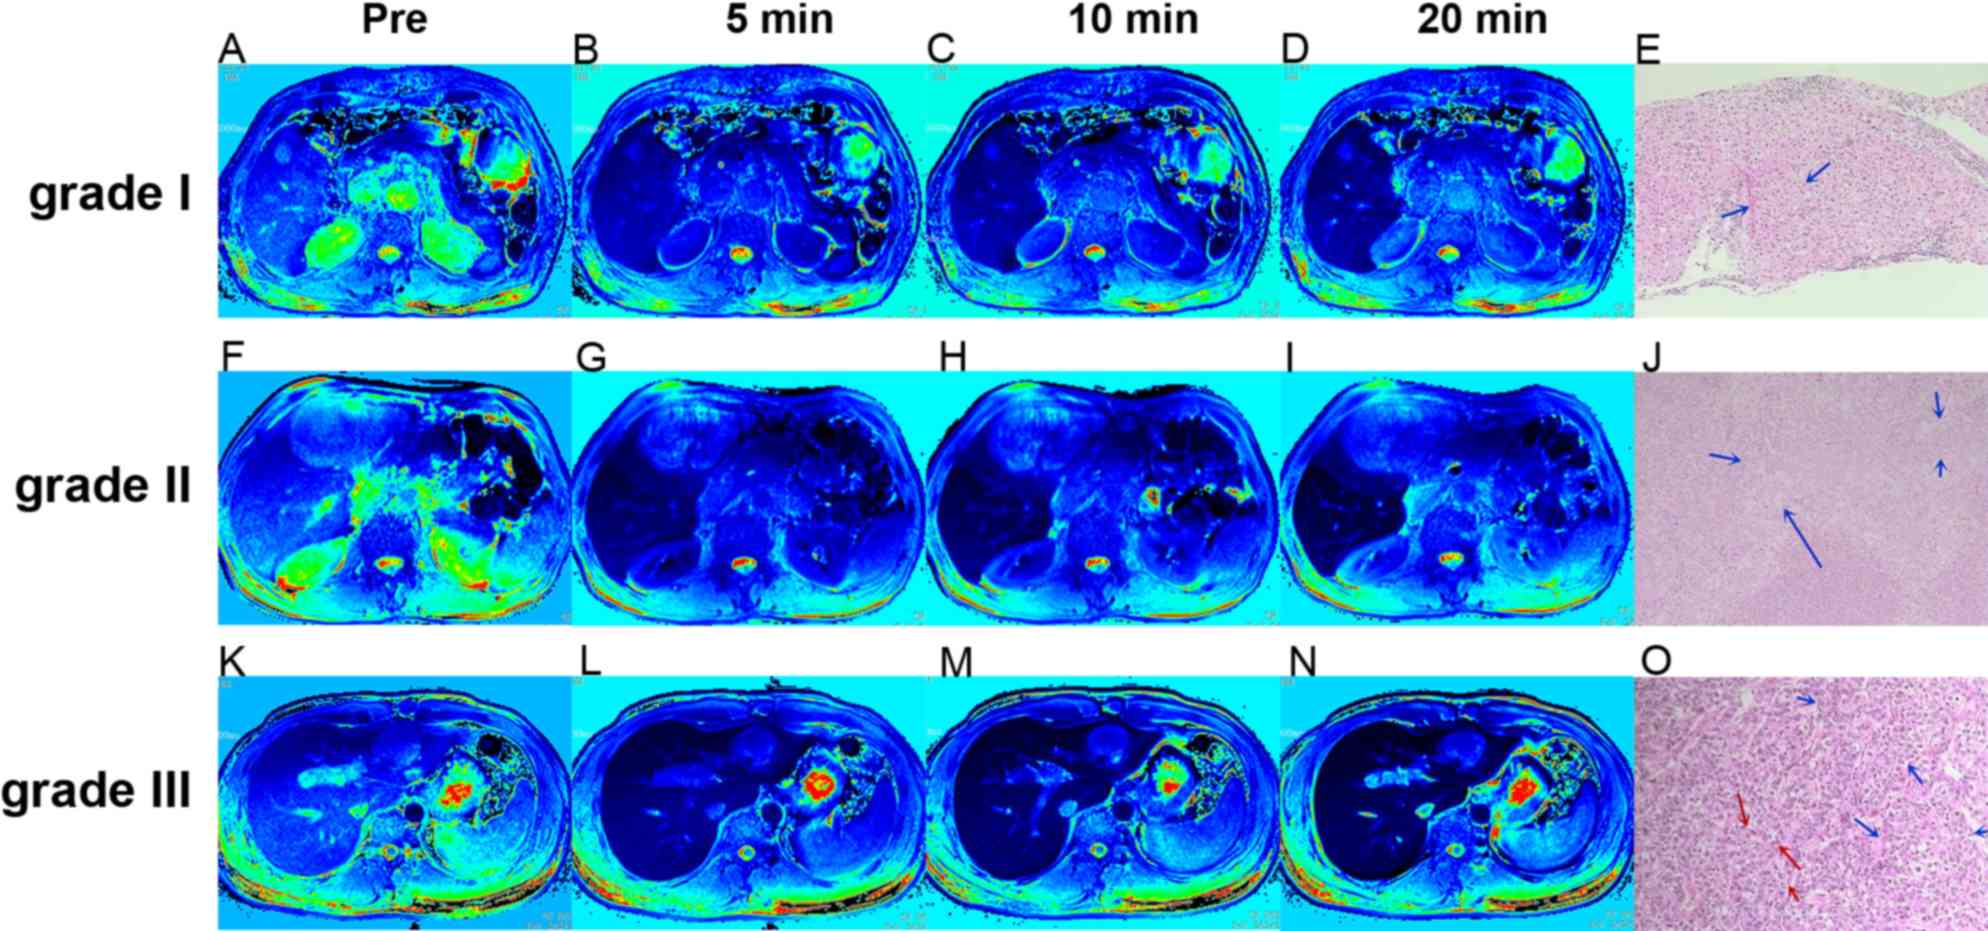 | Figure 1.Regions of interest in tumor and
non-tumor liver parenchyma at different time points after HBP
enhancement in 3 representative patients with Edmondson-Steiner
grade I, II and III HCC. (A-D) T1 mapping of a 78-year
old male patient with HCC grade I at (A) pre-contrast and at (B) 5,
(C) 10 and (D) 20 min after administration of Gd-EOB-DTPA,
respectively. (F-I) T1 mapping of a 62-year old male
patient with HCC grade II at (F) pre-contrast and at (G) 5, (H) 10
and (I) 20 min after administration of Gd-EOB-DTPA, respectively.
(K-N) T1 mapping of a 30-year old male patient with HCC
grade III at (K) pre-contrast and at (L) 5, (M) 10 and (N) 20 min
after administration of Gd-EOB-DTPA, respectively. (E, J and O)
Hematoxylin and eosin staining images of grades I, II and III of
HCC. (E) Grade I HCC at ×100 magnification. The tumor cells are
arranged into irregular thick lines, which are more than three
layers, indicated by the blue arrows. (J) Grade II HCC at ×200
magnification. The tumor cells are arranged in a disorderly manner
with less atypia, as indicated by the blue arrows. (O) Grade III
HCC at ×100 magnification, The lines of cancer cells were markedly
thickened, as indicated by the blue arrows, and the atypical cancer
cells showed enlarged nuclei with deeply stained nucleoli, as
indicated by the red arrows. Pre, pre-contrast; HHC, hepatocellular
carcinoma; Gd-EOB-DTPA, gadolinium-ethoxybenzyl diethylenetriamine
pentaacetic acid. |
Statistical analysis
Analyses were performed using SPSS software (version
22.0; IBM Corp.). Statistical charts were created using GraphPad
Prism v5.01 (Graphpad Software, Inc.). Descriptive statistics (mean
± SD), such as mean diameter were provided when no quantifiable
data was available. One-way analysis of variance with the least
significant difference test were used to compare the differences in
the increment rate of the T1 value in the lesions
relative to non-tumorous liver parenchyma [T1(L-H)/H
(%)] among different grades of HCC. Spearman's correlation analysis
was used to evaluate the correlation between the increasing rate of
T1 values and HCC grading. Patients who were lost to
follow-up or died (due to an accident unrelated to HCC or from
postoperative complications) during the follow-up period were
censored. Receiver operating characteristic (ROC) curve analyses
were conducted for T1(L-H)/H (%) of grade I, II and III
HCC. The cut-off values of T1(L-H)/H (%) between grades
I and II, grades II and III HCC were obtained, respectively; and
then the cumulative recurrence rates of the three groups rearranged
by these two cut-off values of T1(L-H)/H (%) were also
evaluated using Kaplan-Meier method and log-rank test. P<0.05
was considered to indicate a statistically significant
difference.
Results
Patient characteristics
A total of 75 patients (66 men and 9 women; mean
age, 52.89 years; age range, 23–79 years) with 81 lesions were
included in the present study. According to the Liver Disease
Symposium on Barcelona Clinic Liver Cancer (BCLC) staging system
for hepatocellular carcinoma (22),
the HCC cases were classified as BCLC stage A, B, C and D. A total
of 81 lesions with a mean diameter of 4.13±0.32 cm (range 1.2–15
cm) were measured. Pathological diagnosis and grading were made
according to the Edmondson-Steiner grading system (23). Due to research population
restrictions, Edmondson-Steiner grade IV of HCC was not included in
the present study. In our study, 19 patients with 21 lesions
(25.93%) were classified as grade I, 37 patients with 40 lesions
(49.38%) as grade II and 19 patients with 20 lesions (24.69%) as
grade III. Recurrence of HCC was observed in 41 (54.67%) out of 75
patients during the follow-up period (median, 639.00 days; range,
42.00–973.00 days), and 1 patient was lost to follow-up after 490
days from the last reexamination. A total of 3 patients (2 HCC
grade II and 1 HCC grade III) died 369, 195 and 398 days,
respectively, after hepatectomy. The 41 recurrence cases [grade I
(n=5), grade II (n=23), and grade III (n=13)] were verified by
imaging (CT, MRI and ultrasound) or reoperation. The baseline
characteristics of the patients are shown in Table II.
| Table II.Clinical characteristics of the 75
patients with primary hepatocellular carcinoma. |
Table II.
Clinical characteristics of the 75
patients with primary hepatocellular carcinoma.
| Characteristic | Value |
|---|
| Age,
yearsa | 52.89±1.38 |
| Sex, n (%) |
|
|
Male | 66 (88.00) |
|
Female | 9 (12.00) |
| Mean size,
cma | 4.13±0.32 |
| Underlying disease,
n (%) |
|
|
HBV | 66 (88.00) |
|
HCV | 8 (10.67) |
| HBV +
HCV | 8 (10.67) |
|
Clonorchis | 9 (12.00) |
|
Cirrhosis | 44 (58.67) |
| Child-Pugh
classificationb, n
(%) |
|
| A | 70 (93.33) |
| B | 5 (6.67) |
| BCLC stage, n
(%) |
|
| A | 52 (69.33) |
| B | 17 (22.67) |
| C | 6 (8.00) |
| D | 0 (0.00) |
| AFP, n (%) |
|
| Normal
<20 ng/ml | 27 (36.00) |
|
Abnormal ≥20 ng/ml | 48 (64.00) |
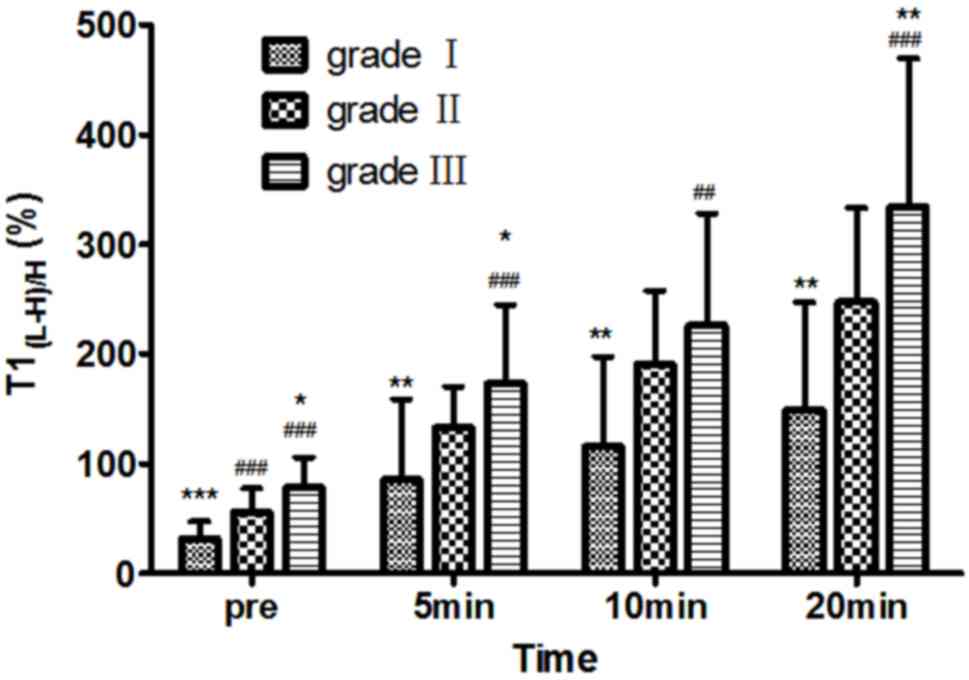
Comparison of T1 mapping of
different grades of HCC at different time points
On pre-contrast, T1(L-H)/H (%) values for
grade I, II and III HCC were 31.42±15.77, 56.07±21.42 and
78.21±27.68, respectively; at 5 min after enhancement,
T1(L-H)/H (%) values were 85.48±73.06, 132.63±37.27 and
172.82±71.48, respectively; at 10 min after enhancement,
T1(L-H)/H (%) values were 115.43±82.25, 190.81±66.58 and
226.13±101.49, respectively; and at 20 min after enhancement,
T1(L-H)/H (%) values were 149.46±97.32, 247.59±85.16 and
333.95±134.99, respectively. T1(L-H)/H (%) was
moderately correlated with Edmondson-Steiner HCC grading both at
pre-contrast, and at 5, 10 and 20 min after administration of
Gd-EOB-DTPA, respectively (r=0.637, r=0.554, r=0.499 and r=0.560,
respectively; P<0.001). On pre-contrast and on post-contrast at
the 5- and 20-min HBP, multiple comparisons of T1(L-H)/H
(%) in the three groups of HCC were significantly different
(P<0.05). On post-contrast at 10 min, the differences in
T1(L-H)/H (%) value between grades I and II, and grades
I and III were statistically significant (P<0.05), while
T1(L-H)/H (%) values between grades II and III showed no
significant differences (P>0.05). The T1(L-H)/H (%)
value markedly increased for each grade of HCC at each time point
and the T1(L-H)/H (%) of different HCC grades increased
after enhancement compared with pre-enhancement (Fig. 2).
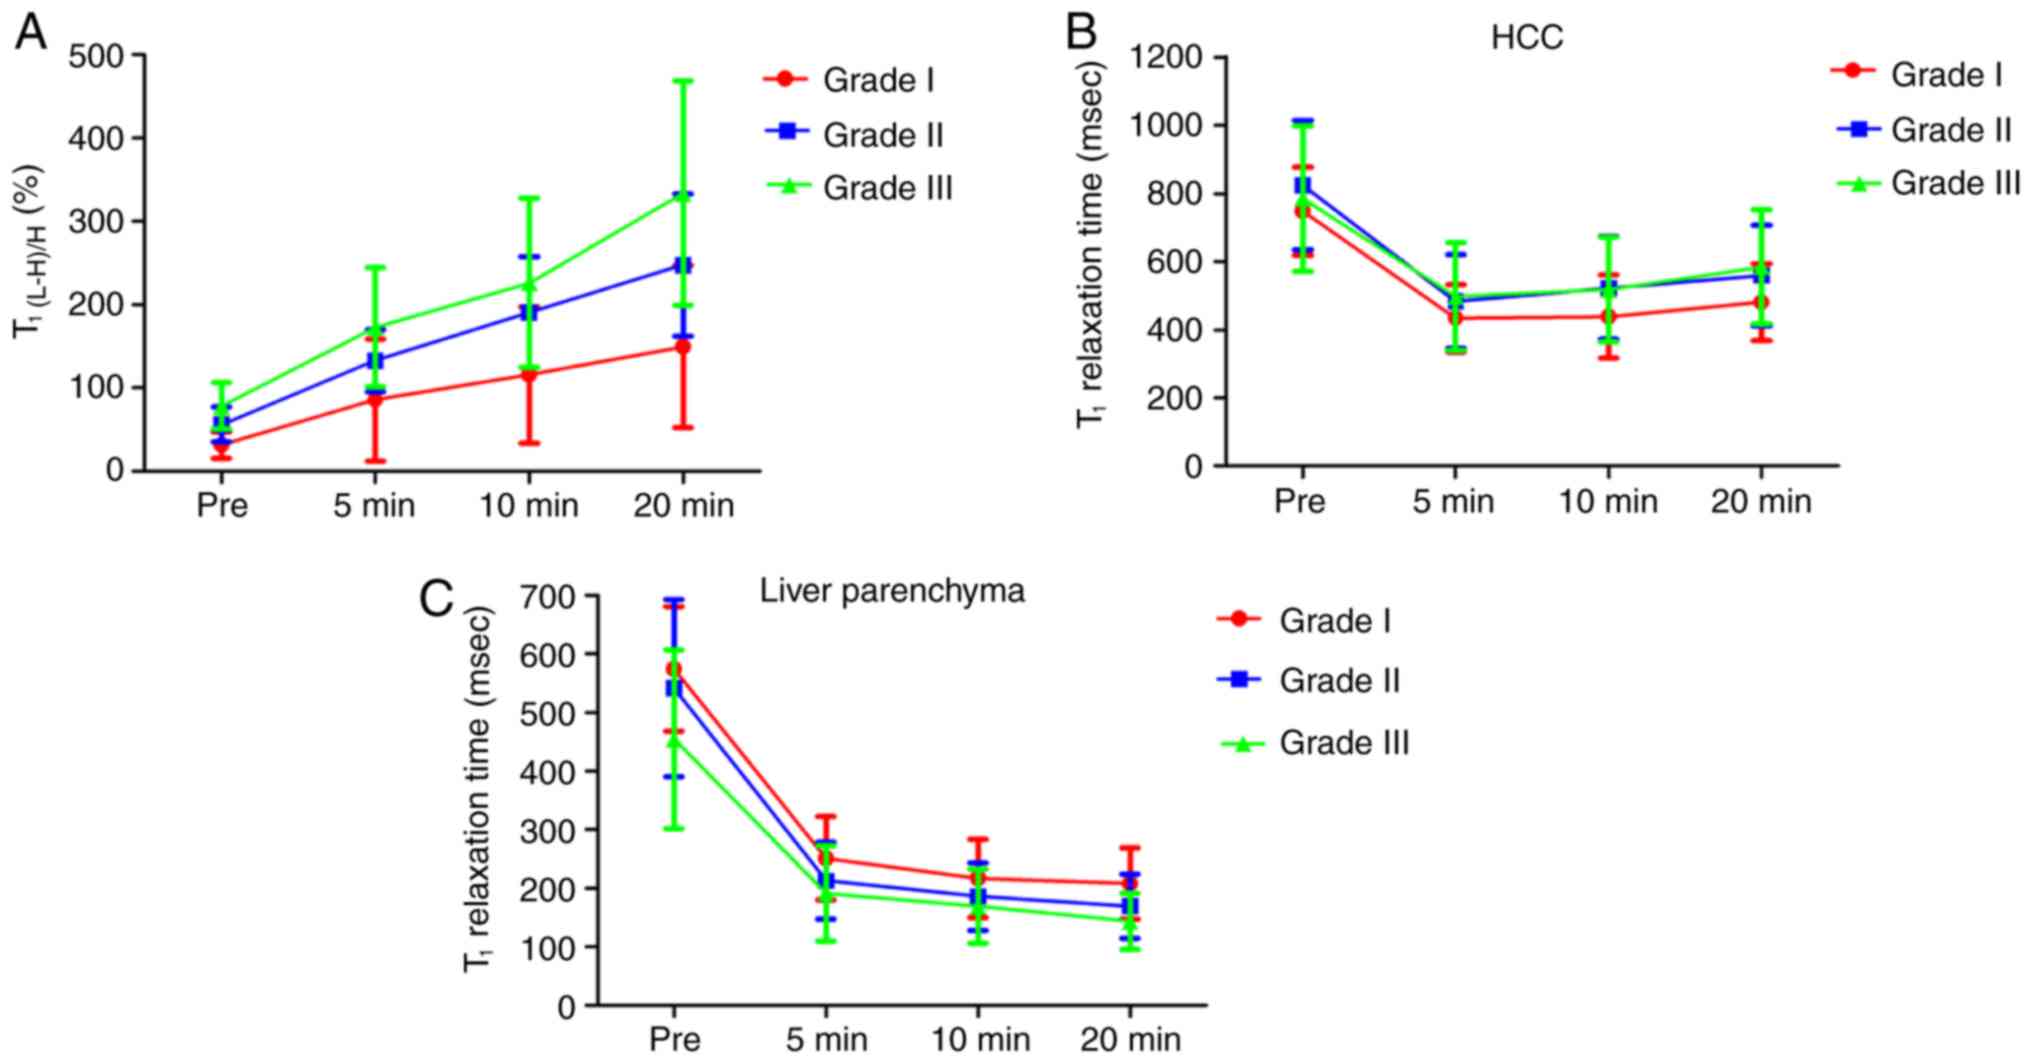
Variation of T1(L-H)/H (%)
and the T1 relaxation time at each time point
The variation trend of T1(L-H) /H (%) and
the T1 relaxation time in HCC lesions and non-tumorous
liver parenchyma of differentiation grades at each time point are
shown in Fig. 3. The value of
T1(L-H)/H (%) after enhancement was higher compared with
that pre-contrast, and T1(L-H)/H (%) was significantly
increased with increasing delay time after contrast medium
administration, with the most significant difference observed at
the 20-min HBP (P<0.05). For HCC lesions, the T1
value was lowest at 5 min, but increased gradually from 10 to 20
min, with overlapping results for grades II and III. For liver
parenchyma, the higher the malignancy degree of HCC the lower the
T1 value, particularly in the pre-contrast imaging. The
T1 value of liver parenchyma decreased quickly from
pre-contrast to 10 min post-enhancement, and then slowly from the
10- to 20-min HBP, for the three grades of HCC. However, the
T1 value of non-tumorous liver parenchyma at each time
point showed no statistical differences among the different grades
of HCC (P>0.05).
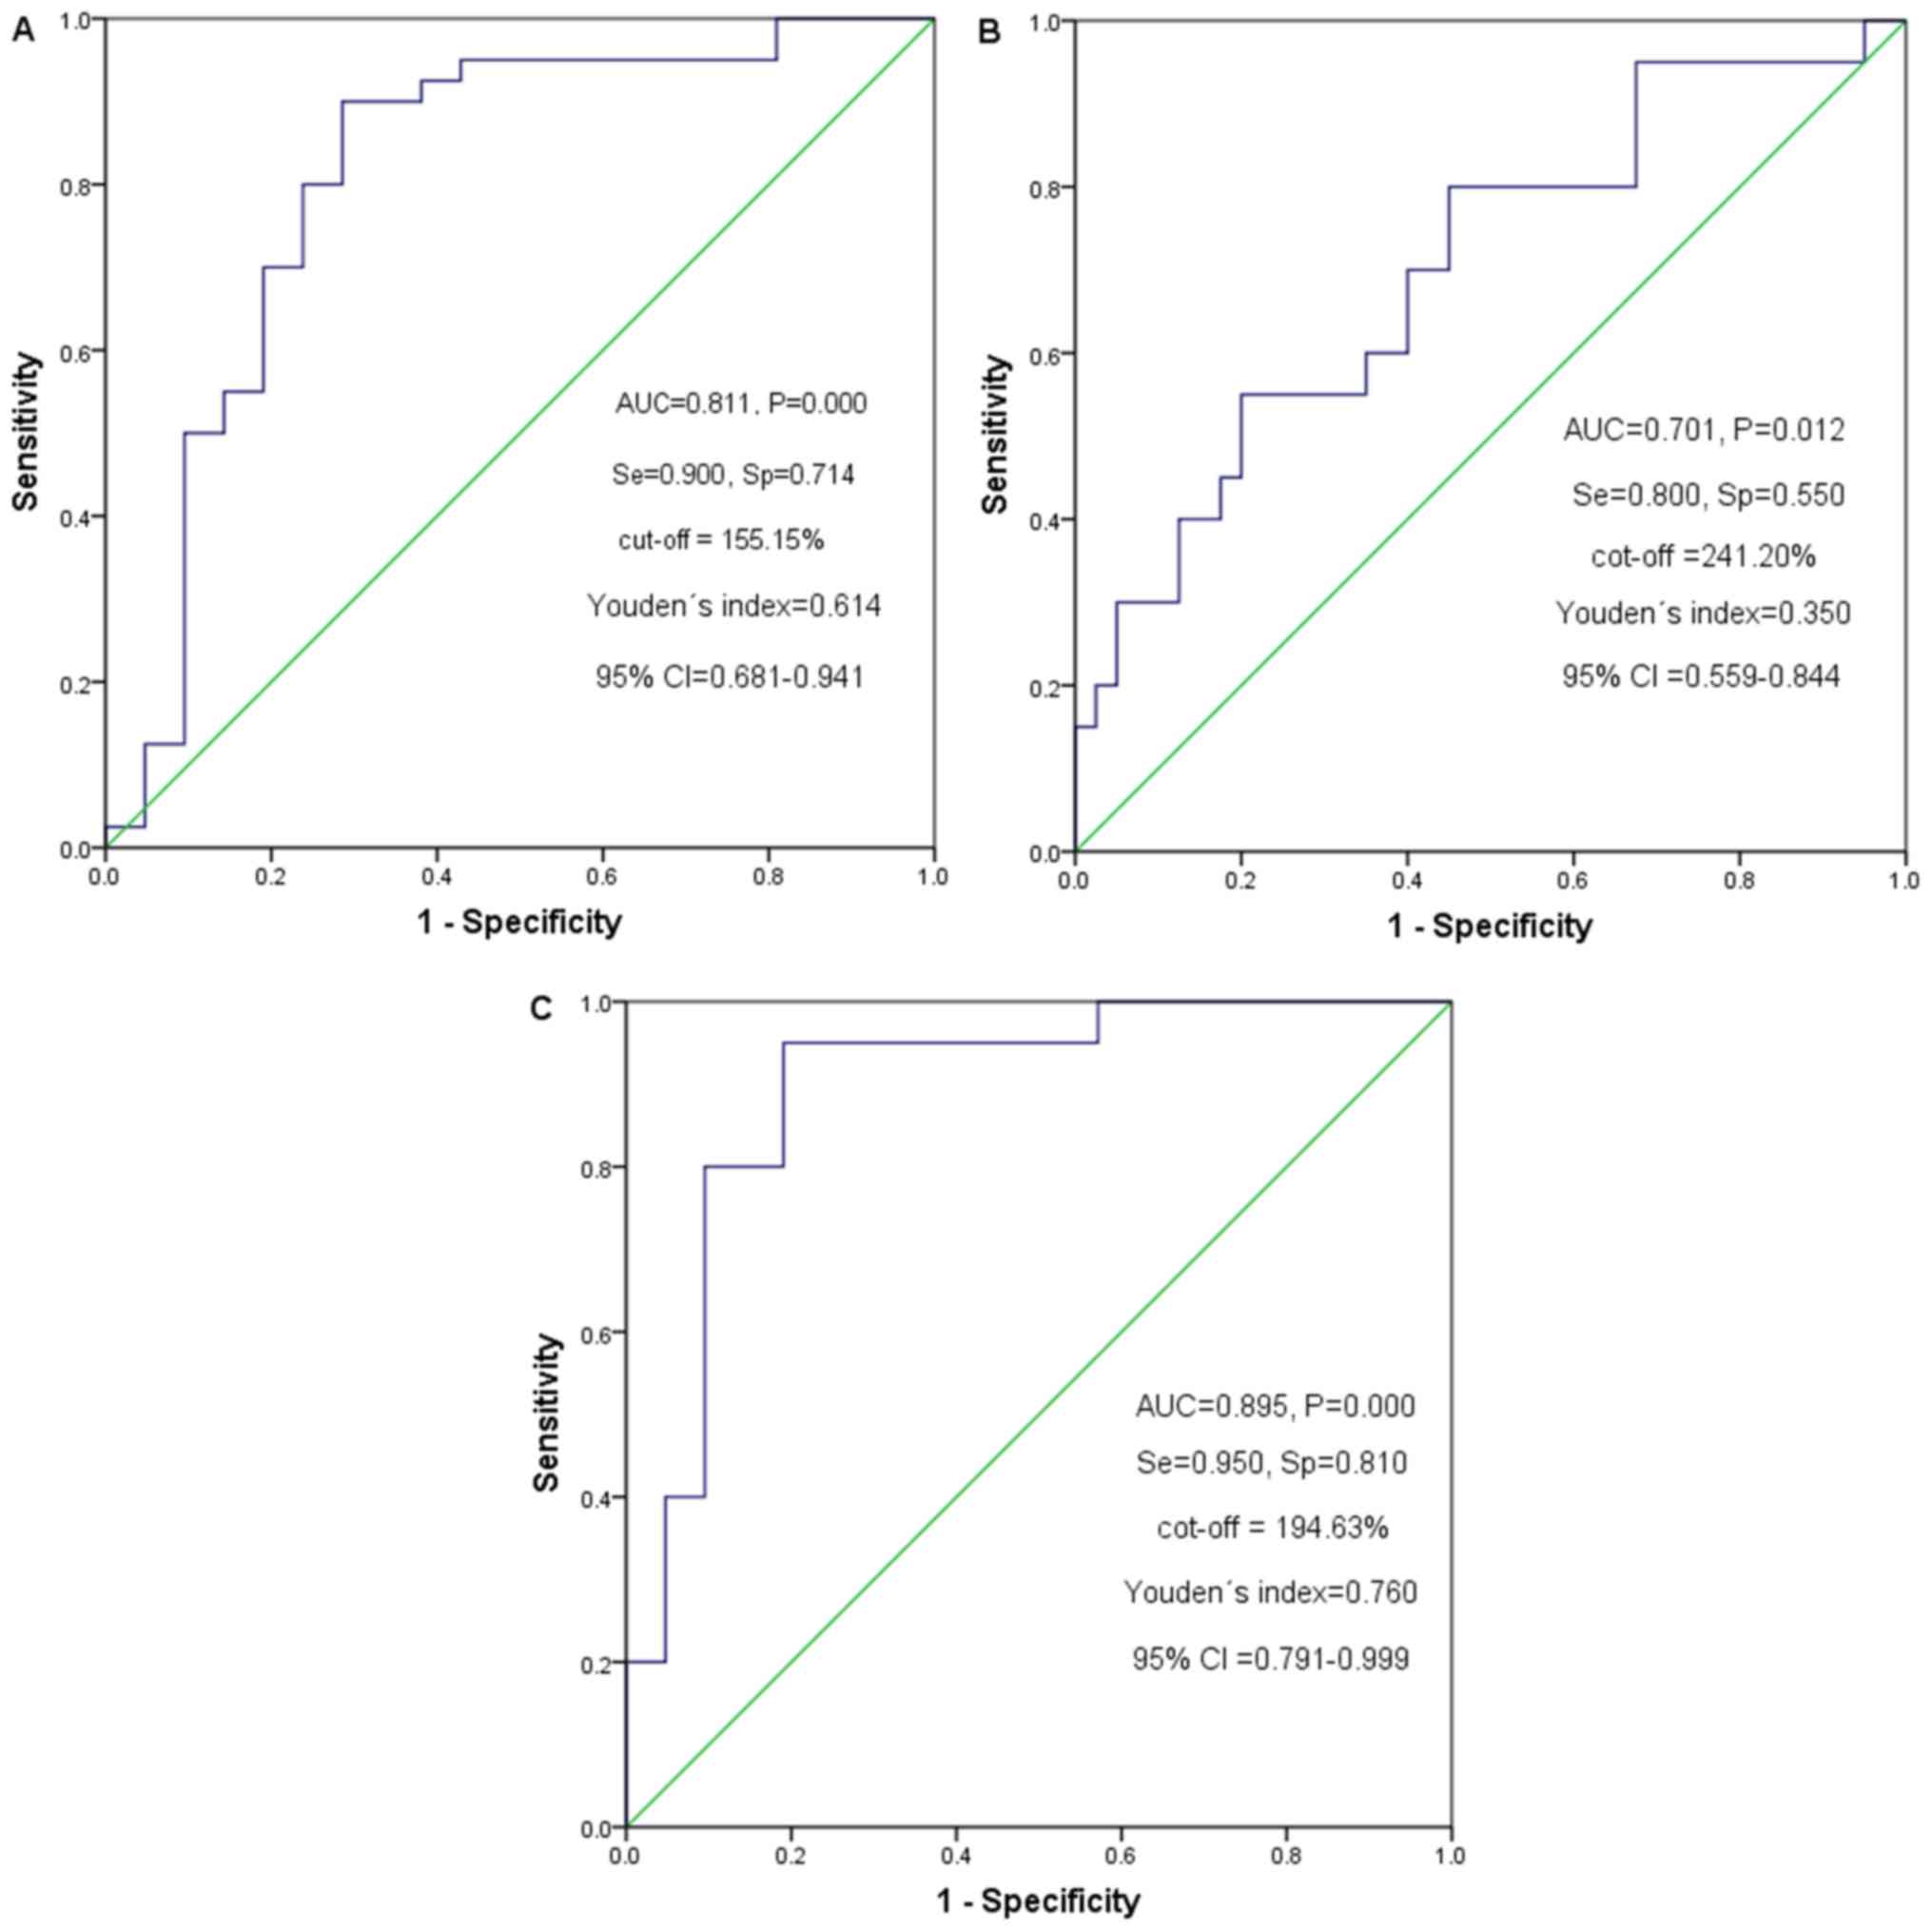
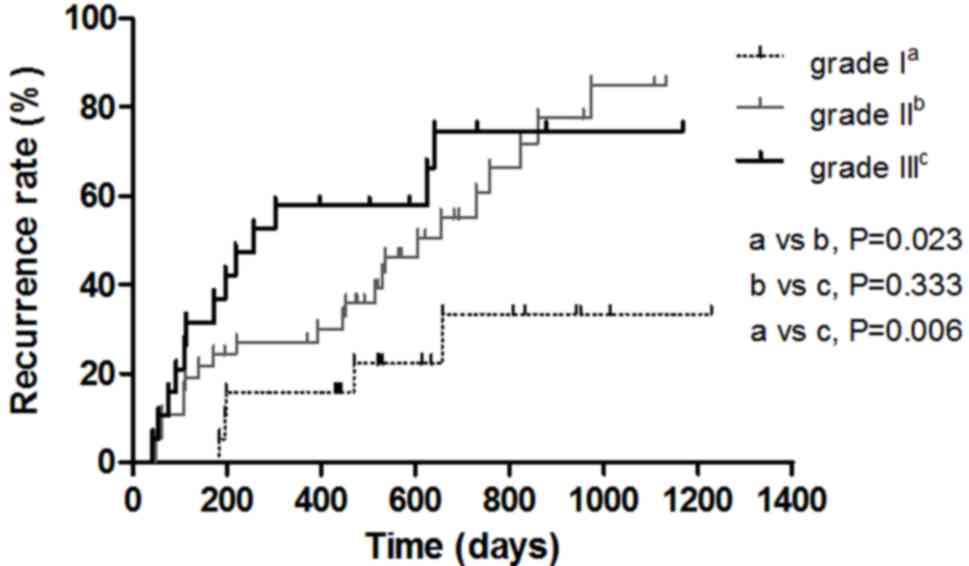
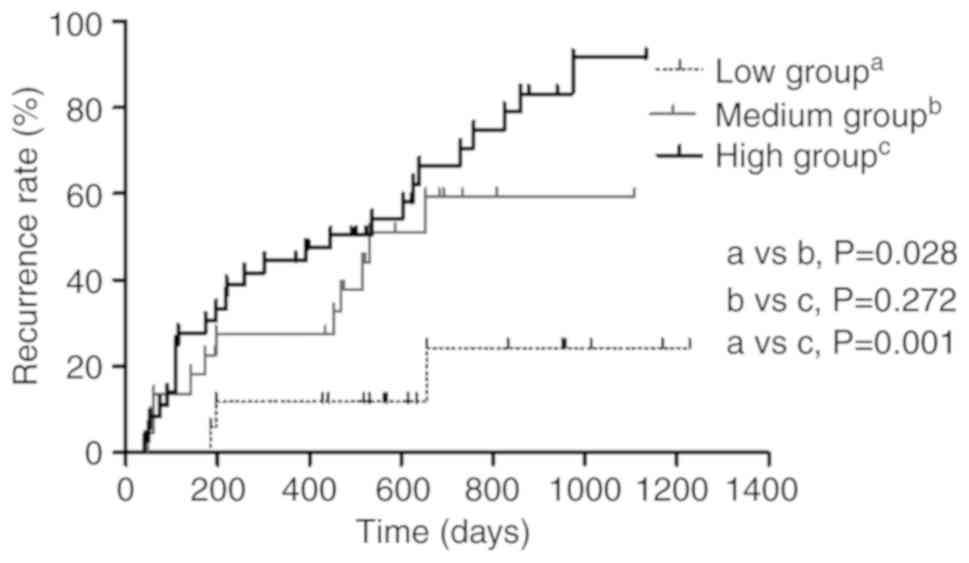
Survival analysis for 3 groups of
patients with HCC
At the 20-min HBP, the optimal cut-off point for the
T1(L-H)/H (%) of grade I and II, II and III HCC based on
the ROC curve analysis were 155.15 and 241.20%, respectively
(Fig. 4). The patients were
subsequently classified into a low group (T1(L-H)/H (%)
≤155.15%), a medium group (T1(L-H)/H (%) >155.15% and
T1(L-H)/H (%) ≤ 241.20%) and a high group
(T1(L-H)/H (%) >241.20%). During the follow-up
period, 41 out of 75 patients developed recurrence; 5 cases (5/19)
were Edmondson-Steiner grade I, 23 cases (23/37) were grade II and
13 cases (13/19) were grade III HCC, and their median recurrence
times were undefined, 605 days and 258 days, respectively. The
recurrence rates of patients with grade II and grade III HCC were
significantly higher compared with that of patients with grade I
HCC (P<0.05) (Fig. 5). The median
recurrence time of the low T1(L-H)/H (%) value group
(n=17), the medium group (n=22) and the high group (n=37) were
undefined, 530 days and 447 days, respectively. Recurrence rates
also increased with increasing T1(L-H)/H (%) from the
low group to the medium and from the low to the high groups in the
20-min HBP (P<0.05). The patients with HCC classified with low
T1(L-H)/H (%) values had lower cumulative recurrence
rates compared with that in patients classified as medium and high
value groups (P=0.028 and P=0.001, respectively). The cumulative
recurrence rates of the patients with medium T1(L-H)/H
(%) values were lower compared with that of the high value group,
but the results were not significantly different (P>0.05)
(Fig. 6).
Discussion
In the present study, Gd-EOB-DTPA-enhanced
T1 mapping was used to quantitatively evaluate HCC. The
results demonstrated that T1(L-H)/H (%) was positively
correlated with the Edmondson-Steiner grade of HCC.
Gd-EOB-DTPA-enhanced T1 relaxation time-based parameter
performed accurate diagnostic grading of HCC. Gd-EOB-DTPA has a
T1 shortening effect and highlights the lesions in the
liver. T1 relaxation time is an objective quantitative
parameter. The T1 relaxation time was measured on the
basis of the MR relaxation technique and is directly correlated
with the concentration of Gd-EOB-DTPA (24). In the present study, the majority of
patients with HCC had a history of chronic liver disease. The
increment rate of the T1 value, which increased in the
lesions relative to the non-tumorous liver parenchyma
[T1(L-H)/H (%)], reflects the true T1
relaxation time of the lesion. T1(L-H)/H (%) was
positively correlated with the Edmondson-Steiner grade of HCC. Due
to the higher grade of HCC, the differences in liver function
between tumor and normal liver parenchyma were more visible and the
differences in the concentration of the Gd-EOB-DTPA in the tissue
were markedly visible in the three grades of HCC at 5 min, 10 min
and 20 min HBP after enhancement, respectively, leading to a higher
rate-of-change of T1 values in the lesions when compared
with that in non-tumorous liver parenchyma. Kogita et al
(11) also confirmed that the
concentration of Gd-EOB-DTPA uptake in HCC was positively
associated with the degree of HCC differentiation. Moreover, the
T1(L-H)/H (%) was highest at the 20 min HBP in the
present study, as the concentration of Gd-EOB-DTPA reached a peak
value at 20 min after enhancement, while the concentration of the
contrast agent in HCC cells remained lower.
In the present study, the T1 value of the
non-tumorous liver parenchyma, especially on pre-contrast, was
lower with a higher malignant degree of HCC (P<0.05) and reached
a peak at 20 min, which was similar to the result found in a
previous study (11). The
T1 value of grade I HCC was lowest at 5 min, and
increased gradually at 10 and 20 min, with partly overlapping
values in grade II and grade III HCC; however, the
T1(L-H)/H (%) of the three grades of HCC showed
significant differences at pre-contrast, 5 min, and 20 min HBP,
respectively. This result might be due to the liver background
affecting the T1 value of the tumor. These results
suggest that higher grades of HCC will uptake smaller amounts of
Gd-EOB-DTPA, and that the absorption rate of the contrast agent is
significantly different between HCC and non-tumorous liver
parenchyma at different time points. This may be due to the absence
of normal liver function for patients with HCC and due to the fact
that Gd-EOB-DTPA is mainly observed in the extracellular space and
intravascular area at the beginning of enhancement. Furthermore,
the HCC cells uptake the contrast agents slowly, resulting in less
uptake of the contrast agents into the cells, and the concentration
of Gd-EOB-DTPA in the intracellular area increases gradually
post-contrast. By contrast, the non-tumorous liver parenchyma
uptakes Gd-EOB-DTPA faster than HCC, leading to two types of
T1 value-time curves (Fig. 3B
and C).
With a higher degree of malignancy, new blood
vessels are formed, which are more likely to invade the surrounding
liver parenchyma, leading to recurrence (25). Previous studies have reported that
HCC recurrence is related to heterogeneity, multicentric type and
expression of vascular endothelial growth factor of the tumor
(26,27). In the present study, the patients
with a higher grade of HCC had a higher recurrence rate. Patients
with grade I HCC had the lowest cumulative recurrence rates
compared with patients with grade II and III HCC. Patients with
grade III HCC had a higher but indistinctive recurrence rate
compared with that in patients with grade II HCC, which was ~800
days after resection. We hypothesized that the absence of a
significant difference may be due to the small sample size for
grade III HCC compared with that of grade II HCC, therefore,
studies with a larger sample size are required in the future. This
may also be due to tumorous microvascular invasion and the
histological grade of the cirrhosis (28). It is possible that the recurrent
tumor may invade the surrounding liver parenchyma, promote cellular
density and increase the formation of new vessels. If the tumor
invades the microvasculature of the surrounding liver parenchyma
and local liver function is damaged, the excretion of Gd-EOB-DTPA
can be blocked (29,30). In addition, Zhou et al
(4) reported that the
Edmondson-Steiner grade of HCC was an independent risk factor for
recurrence after resection. Mori et al (31) also demonstrated that poorly
differentiated HCC was more likely to have intrahepatic metastasis
and recurrence compared with well-/moderately differentiated HCC.
The results from the present study revealed that the HCC patients
with lower T1(L-H)/H (%) values had lower cumulative
recurrence rates compared with those patients with higher
T1(L-H)/H (%) values at the 20-min HBP. Shen et
al (32) also recently found
that a poorly differentiated tumor had a negative impact on the
recurrence and long-term survival of patients with solitary
HBV-associated HCCs after curative hepatectomy. This suggests that
the lower the differentiation of HCC is, the more likely it is to
recur, which was partly consistent with the study by Shen et
al (32). Hence, if
Gd-EOB-DTPA-enhanced MRI could be used to detect small lesions with
high sensitivity, and grade HCC with Gd-EOB-DTPA-MRI T1
mapping before surgery, it will contribute to a more appropriate
therapy for patients with HCC. Precise preoperative information
regarding the characterization, prognosis and staging of HCC is
essential.
However, the present study has several limitations.
Firstly, the sample size is small, particularly for well- and
poorly differentiated HCC. A further study with a larger sample
size and longer follow-up time is required. Secondly, due to the
small number of recurrent HCC patients, the effect of liver
function, liver fibrosis and other liver backgrounds on the
recurrence of HCC were not analyzed.
In conclusion, the parameters of T1
mapping, T1(L-H)/H (%) are positively correlated with
the degree of malignancy of HCC. Higher grade HCC has a higher
recurrence rate. The recurrence rate of HCC patients with high
T1(L-H)/H (%) was consistently significantly higher
compared with that of patients with low T1(L-H)/H (%).
Although a larger-scale prospective study is required to confirm
these findings, the results showed that T1 mapping on
Gd-EOB-DTPA-enhanced MRI was beneficial in HCC applications and
provided valuable information for HCC grading and recurrence
prediction.
Acknowledgements
Not applicable.
Funding
The present study was funded by the National Natural
Science Foundation of China (grant no. 81260214).
Availability of data and materials
All data generated or analyzed during this study are
included in this published article.
Authors' contributions
TFY conceived the study design and drafted the
manuscript. ZKH provided the concept of the study and reviewed the
manuscript. YJG collected the samples and researched the
literature. XLQ was involved in data acquisition, statistical
analysis, manuscript preparation and editing. ZPZ participated in
the data analysis. WML, MZW and XYZ interpreted the data and
revised the manuscript. LLL made substantial contributions to
conception and design and guaranteed that any questions related to
the accuracy or integrity of any part of the work were
appropriately investigated and resolved. All the authors have read
and approved the final manuscript.
Ethics approval and consent to
participate
Retrospective data and tissue collection and
analysis were approved by the Institutional Review Board of The
First Affiliated Hospital of Guangxi Medical University (approval
no. 2012-KY-223).
Patient consent for publication
Not applicable.
Competing interests
The authors declare that they have no competing
interests.
Glossary
Abbreviations
Abbreviations:
|
HCC
|
hepatocellular carcinoma
|
|
Gd-EOB-DTPA
|
gadolinium-ethoxybenzyl
diethylenetriamine pentaacetic acid
|
|
MRI
|
magnetic resonance imaging
|
|
HBP
|
hepatobiliary phase
|
|
DWI
|
diffusion weighted imaging
|
|
ROI
|
region of interest
|
|
ROC
|
receiver operating characteristic
|
References
|
1
|
Hu Y, Wu J, Li S and Zhao X: Correlation
between CT features and liver function and p53 expression in
hepatitis, cirrhosis and hepatocellular carcinoma. Oncol Lett.
16:4297–4302. 2018.PubMed/NCBI
|
|
2
|
Imamura H, Matsuyama Y, Tanaka E, Ohkubo
T, Hasegawa K, Miyagawa S, Sugawara Y, Minagawa M, Takayama T,
Kawasaki S and Makuuchi M: Risk factors contributing to early and
late phase intrahepatic recurrence of hepatocellular carcinoma
after hepatectomy. J Hepatol. 38:200–207. 2003. View Article : Google Scholar : PubMed/NCBI
|
|
3
|
Ariizumi S, Kitagawa K, Kotera Y,
Takahashi Y, Katagiri S, Kuwatsuru R and Yamamoto M: A non-smooth
tumor margin in the hepatobiliary phase of gadoxetic acid disodium
(Gd-EOB-DTPA)-enhanced magnetic resonance imaging predicts
microscopic portal vein invasion, intrahepatic metastasis, and
early recurrence after hepatectomy in patients with hepatocellular
carcinoma. J Hepatobiliary Pancreat Sci. 18:575–585. 2011.
View Article : Google Scholar : PubMed/NCBI
|
|
4
|
Zhou L, Rui JA, Zhou WX, Wang SB, Chen SG
and Qu Q: Edmondson-Steiner grade: A crucial predictor of
recurrence and survival in hepatocellular carcinoma without
microvascular invasio. Pathol Res Pract. 213:824–830. 2017.
View Article : Google Scholar : PubMed/NCBI
|
|
5
|
Nathan H, Schulick RD, Choti MA and Pawlik
TM: Predictors of survival after resection of early hepatocellular
carcinoma. Ann Surg. 249:799–805. 2009. View Article : Google Scholar : PubMed/NCBI
|
|
6
|
Kim JH, Min YW, Gwak GY, Paik YH, Choi MS,
Lee JH, Koh KC and Paik SW: The utility of gadoxetic acid-enhanced
magnetic resonance imaging in the surveillance for postoperative
recurrence of hepatocellular carcinoma. Medicine (Baltimore).
95:e56662016. View Article : Google Scholar : PubMed/NCBI
|
|
7
|
Peng Z, Jiang M, Cai H, Chan T, Dong Z,
Luo Y, Li ZP and Feng ST: Gd-EOB-DTPA-enhanced magnetic resonance
imaging combined with T1 mapping predicts the degree of
differentiation in hepatocellular carcinoma. BMC Cancer.
16:6252016. View Article : Google Scholar : PubMed/NCBI
|
|
8
|
Chang WC, Chen RC, Chou CT, Lin CY, Yu CY,
Liu CH, Chou JM, Hsu HH and Huang GS: Histological grade of
hepatocellular carcinoma correlates with arterial enhancement on
gadoxetic acid-enhanced and diffusion-weighted MR images. Abdom
Imaging. 39:1202–1212. 2014. View Article : Google Scholar : PubMed/NCBI
|
|
9
|
An C, Park MS, Jeon HM, Kim YE, Chung WS,
Chung YE, Kim MJ and Kim KW: Prediction of the histopathological
grade of hepatocellular carcinoma using qualitative
diffusion-weighted, dynamic, and hepatobiliary phase MRI. Eur
Radiol. 22:1701–1708. 2012. View Article : Google Scholar : PubMed/NCBI
|
|
10
|
Nassif A, Jia J, Keiser M, Oswald S,
Modess C, Nagel S, Weitschies W, Hosten N, Siegmund W and Kuhn JP:
Visualization of hepatic uptake transporter function in healthy
subjects by using gadoxetic acid-enhanced MR imaging. Radiology.
264:741–750. 2012. View Article : Google Scholar : PubMed/NCBI
|
|
11
|
Kogita S, Imai Y, Okada M, Kim T, Onishi
H, Takamura M, Fukuda K, Igura T, Sawai Y, Morimoto O, et al:
Gd-EOB-DTPA-enhanced magnetic resonance images of hepatocellular
carcinoma: Correlation with histological grading and portal blood
flow. Eur Radiol. 20:2405–2413. 2010. View Article : Google Scholar : PubMed/NCBI
|
|
12
|
Lee SA, Lee CH, Jung WY, Lee J, Choi JW,
Kim KA and Park CM: Paradoxical high signal intensity of
hepatocellular carcinoma in the hepatobiliary phase of Gd-EOB-DTPA
enhanced MRI: Initial experience. Magn Reson Imaging. 29:83–90.
2011. View Article : Google Scholar : PubMed/NCBI
|
|
13
|
Zeng MS, Ye HY, Guo L, Peng WJ, Lu JP,
Teng GJ, Huan Y, Li P, Xu JR, Liang CH and Breuer J:
Gd-EOB-DTPA-enhanced magnetic resonance imaging for focal liver
lesions in Chinese patients: A multicenter, open-label, phase III
study. Hepatobiliary Pancreat Dis Int. 12:607–616. 2013. View Article : Google Scholar : PubMed/NCBI
|
|
14
|
Park JH, Kang JH, Lee YJ, Kim KI, Lee TS,
Kim KM, Park JA, Ko YO, Yu DY, Nahm SS, et al: Evaluation of
diethylnitrosamine- or hepatitis B virus X gene-induced
hepatocellular carcinoma with 18F-FDG PET/CT: A preclinical study.
Oncol Rep. 33:347–353. 2015. View Article : Google Scholar : PubMed/NCBI
|
|
15
|
Haimerl M, Verloh N, Zeman F, Fellner C,
Muller-Wille R, Schreyer AG, Stroszczynski C and Wiggermann P:
Assessment of clinical signs of liver cirrhosis using T1 mapping on
Gd-EOB-DTPA-enhanced 3T MRI. PLoS One. 8:e856582013. View Article : Google Scholar : PubMed/NCBI
|
|
16
|
Zhou ZP, Long LL, Qiu WJ, Cheng G, Huang
LJ, Yang TF and Huang ZK: Comparison of 10- and 20-min
hepatobiliary phase images on Gd-EOB-DTPA-enhanced MRI T1 mapping
for liver function assessment in clinic. Abdom Radiol (NY).
42:2272–2278. 2017. View Article : Google Scholar : PubMed/NCBI
|
|
17
|
Ding Y, Rao SX, Zhu T, Chen CZ, Li RC and
Zeng MS: Liver fibrosis staging using T1 mapping on gadoxetic
acid-enhanced MRI compared with DW imaging. Clin Radiol.
70:1096–1103. 2015. View Article : Google Scholar : PubMed/NCBI
|
|
18
|
Yoshimura N, Saito K, Saguchi T, Funatsu
T, Araki Y, Akata S and Tokuuye K: Distinguishing hepatic
hemangiomas from metastatic tumors using T1 mapping on
gadoxetic-acid-enhanced MRI. Magn Reson Imaging. 31:23–27. 2013.
View Article : Google Scholar : PubMed/NCBI
|
|
19
|
Zhou ZP, Long LL, Qiu WJ, Cheng G, Huang
LJ, Yang TF and Huang ZK: Evaluating segmental liver function using
T1 mapping on Gd-EOB-DTPA-enhanced MRI with a 3.0 Tesla. BMC Med
Imaging. 17:202017. View Article : Google Scholar : PubMed/NCBI
|
|
20
|
Peng Z, Li C, Chan T, Cai H, Luo Y, Dong
Z, Li ZP and Feng ST: Quantitative evaluation of Gd-EOB-DTPA uptake
in focal liver lesions by using T1 mapping: Differences between
hepatocellular carcinoma, hepatic focal nodular hyperplasia and
cavernous hemangioma. Oncotarget. 8:65435–65444. 2017.PubMed/NCBI
|
|
21
|
Wang WT, Zhu S, Ding Y, Yang L, Chen CZ,
Ye QH, Ji Y, Zeng MS and Rao SX: T1 mapping on gadoxetic
acid-enhanced MR imaging predicts recurrence of hepatocellular
carcinoma after hepatectomy. Eur J Radiol. 103:25–31. 2018.
View Article : Google Scholar : PubMed/NCBI
|
|
22
|
Llovet JM, Fuster J and Bruix J: Prognosis
of hepatocellular carcinoma. Hepatogastroenterology. 49:7–11.
2002.PubMed/NCBI
|
|
23
|
Edmondson HA and Steiner PE: Primary
carcinoma of the liver: A study of 100 cases among 48,900
necropsies. Cancer. 7:462–503. 1954. View Article : Google Scholar : PubMed/NCBI
|
|
24
|
Bae KE, Kim SY, Lee SS, Kim KW, Won HJ,
Shin YM, Kim PN and Lee MG: Assessment of hepatic function with
Gd-EOB-DTPA-enhanced hepatic MRI. Dig Dis. 30:617–622. 2012.
View Article : Google Scholar : PubMed/NCBI
|
|
25
|
Zhang W, Tan Y, Jiang L, Yan L, Li B, Wen
T and Yang J: Liver resection associated with better outcomes for
single large hepatocellular carcinoma located in the same section.
Medicine (Baltimore). 96:e62462017. View Article : Google Scholar : PubMed/NCBI
|
|
26
|
Liu K, Hao M, Ouyang Y, Zheng J and Chen
D: CD133(+) cancer stem cells promoted by VEGF accelerate the
recurrence of hepatocellular carcinoma. Sci Rep. 7:414992017.
View Article : Google Scholar : PubMed/NCBI
|
|
27
|
Barreto SG, Brooke-Smith M, Dolan P,
Wilson TG, Padbury RT and Chen JW: Cirrhosis and microvascular
invasion predict outcomes in hepatocellular carcinoma. ANZ J Surg.
83:331–335. 2013. View Article : Google Scholar : PubMed/NCBI
|
|
28
|
Park YK, Kim BW, Wang HJ and Kim MW:
Hepatic resection for hepatocellular carcinoma meeting Milan
criteria in Child-Turcotte-Pugh class a patients with cirrhosis.
Transplant Proc. 41:1691–1697. 2009. View Article : Google Scholar : PubMed/NCBI
|
|
29
|
Tsuda N and Matsui O: Cirrhotic rat liver:
Reference to transporter activity and morphologic changes in bile
canaliculi-gadoxetic acid-enhanced MR imaging. Radiology.
256:767–773. 2010. View Article : Google Scholar : PubMed/NCBI
|
|
30
|
Norén B, Dahlström N, Forsgren MF,
Dahlqvist Leinhard O, Kechagias S, Almer S, Wirell S, Smedby Ö and
Lundberg P: Visual assessment of biliary excretion of Gd-EOB-DTPA
in patients with suspected diffuse liver disease-A biopsy-verified
prospective study. Eur J Radiol Open. 2:19–25. 2015. View Article : Google Scholar : PubMed/NCBI
|
|
31
|
Mori Y, Tamai H, Shingaki N, Hayami S,
Ueno M, Maeda Y, Moribata K, Deguchi H, Niwa T, Inoue I, et al:
Hypointense hepatocellular carcinomas on apparent diffusion
coefficient mapping: Pathological features and metastatic
recurrence after hepatectomy. Hepatol Res. 46:634–641. 2016.
View Article : Google Scholar : PubMed/NCBI
|
|
32
|
Shen J, Liu J, Li C, Wen T, Yan L and Yang
J: The impact of tumor differentiation on the prognosis of
HBV-associated solitary hepatocellular carcinoma following
hepatectomy: A propensity score matching analysis. Dig Dis Sci.
63:1962–1969. 2018. View Article : Google Scholar : PubMed/NCBI
|
|
33
|
Kok B and Abraldes JG: Child-pugh
classification: Time to abandon? Semin Liver Dis. 39:96–103. 2019.
View Article : Google Scholar : PubMed/NCBI
|