Introduction
Human nasopharyngeal carcinoma (NPC) is an invasive
and metastatic head and neck cancer, which was reported to be
prevalent in Southeast Asia, particularly in the south of China
(1). It originates from the
nasopharynx epithelium and has a complicated pathogenesis (2). Certain geographical locations,
including southern China, and ethnic groups, including Asian, have
been reported to affect the predisposition of the populace to NPC
(3). It has been reported that
factors, including the Epstein-Barr virus (EBV) infection, an
unhealthy diet and smoking, may contribute to the incidence of NPC
(4,5). Although treatments of radio and
adjuvant chemotherapy for NPC can prolong the lifespan of patients,
further research and therapeutic methods pertaining to NPC are
required.
Circulating tumor cells (CTCs), which were first
identified in 1869 by Ashworth (6),
flow into the peripheral blood system from original and metastatic
tumors, and lay the foundation for tumor metastasis (7). To undertake tumor development, CTCs
undergo a process termed epithelial-mesenchymal transition (EMT),
which serves a key role in tumor metastasis (8,9). CTCs
are generally classified into three varieties: Epithelial CTCs,
mesenchymal CTCs and hybrid CTCs (10). Of these subtypes, the most migratory
and invasive of these CTCs are the mesenchymal CTCs (11). Therapeutically, CTCs are frequently
defined as a ‘liquid biopsy’ specimen, which is a snapshot of tumor
cells in the circulation at a specific point in time (12). The presence and detection of CTCs are
able to offer significant information regarding the diagnosis and
treatment of certain types of cancer with low survival rates
(13–19). Nevertheless, there is a lack of
sufficient research regarding CTCs of NPC.
N-cadherin is a hemophilic transmembrane cell
adhesion molecule (20). The
inappropriate expression of N-cadherin is an indicator of EMT,
which is associated with tumor malignancy and metastasis (21). According to a study by Nieman et
al (22), N-cadherin contributes
to enhanced tumor cell survival, migration and invasion. Although
there is an increasing amount of evidence that supports the
association between N-cadherin level and cancer progression
(23–25), to the best of our knowledge, the role
of N-cadherin on tumor metastasis has not been comprehensively
examined.
The Wnt/β-catenin signaling pathway serves an
important role in the self-renewal and differentiation of cancer
cells (26–28); however whether Wnt/β-catenin
signaling in NPC cells has a role in the effect observed when
cisplatin is combined with paclitaxel therapy requires further
investigation.
The progressive CanPatrol™ CTC-enrichment technique
and classical in situ hybridization (ISH) assay were
utilized to isolate and identify CTCs from patients with NPC.
Subsequently, the correlation between multifold CTCs and the
clinical stages, clinical parameters, N-cadherin gene and
Wnt/β-catenin signaling of NPC cells was investigated.
Materials and methods
Materials
KHCO3, ethylene diamine tetraacetic acid
(EDTA), formaldehyde, NH4Cl and Tris-HCl were provided
by Sinopharm Chemical Reagent Co., Ltd (Shanghai, China). Horse
serum, PBS, DAPI, 0.1X SSC and SDS were purchased from
Sigma-Aldrich (Merck KGaA, Darmstadt, Germany). Protease was
derived from Qiagen GmbH (Hilden, Germany). The 24-well plates were
from Thermo Fisher Scientific, Inc. (Waltham, MA, USA). β-catenin
inhibitor XAV939 was obtained from MedChemExpress (Princeton, NJ,
USA). Cell Counting kit-8 was acquired from Beyotime Institute of
Biotechnology (Shanghai, China). EBV nucleic acid quantitative
detection reagent kit was from Beijing SinoMDgene Technology Co.,
Ltd., Beijing, China. Total caspase-3 (cat. no. BS9865M), active
caspase-3 (cat. no. BS9872M), B-cell lymphoma 2 (Bcl2; cat. no.
BS1511), β-catenin (cat. no. BS3603), c-Myc (cat. no.
BS1245) and GAPDH (cat. no. AP0066) primary antibodies, and
horseradish peroxidase-conjugated goat anti-rabbit secondary
antibodies (cat. no. BS13278) were obtained from Bioworld
Technology, Inc. (St. Louis Park, MN, USA).
Patient samples
The People's Hospital of Gaozhou (Gaozhou, China)
recruited 60 patients with NPC for the present study between March
2015 and August2016. Individuals were removed if they had a
previous history of cancer or had undergone radiotherapy or
chemotherapy at diagnosis. The 60 patients were aged >18 years.
Among the patients, there were 50 males and 10 females. From these,
45 people were >50 years old and 15 people were ≤50 years old,
with a median age of 42 years (range, 35–67 years). The mean age of
all patients at diagnosis was 50.8±11.3 years. Additionally, a
total of 18 healthy volunteers acted as controls and comprised of 9
males and 9 females. From these, 11 people (5 males and 4 females)
were ≥50 years old and 7 people were ≤50 years, with a median age
of 41 years (range, 33–64 years). In order to prevent underlying
skin cell contamination from the venipuncture for patients with NPC
and healthy volunteers, the first 2 ml of blood samples were not
used, and 5 ml peripheral blood samples with anticoagulant EDTA
(1.4 mg/l) were gathered. Experiments were performed within 4 h
following the collection of blood samples. Samples were collected
three times: Prior to therapy, during therapy and post-therapy.
Volunteers only donated samples once.
Ethics approval and informed
consent
The present study was approved by the Ethical
Committee of The People's Hospital of Gaozhou. The patients with
NPC and healthy volunteers provided written informed consent for
inclusion in the present study.
Isolation of CTCs by size
The principle of adopting the CanPatrol
CTC-enrichment technique to isolate CTCs is based on the
attestation from Wu et al (29,30).
Briefly, a filtration method (29)
was employed utilizing a standard membrane with 8-µm diameter pores
(EMD Millipore, Billerica, MA, USA). To augment the efficiency of
filtration, a system was recruited, which was composed of four
parts: A filtration tube including the membrane (SurExam Bio-tech,
Guangzhou, China), an E-Z 96 vacuum manifold (Omega Bio-Tek, Inc.,
Norcross, GA, USA), a manifold vacuum plate with valve settings
(SurExam Bio-tech) and a vacuum pump (Auto Science, Tianjin,
China). In order to prepare for filtration, firstly, the red blood
cell lysis buffer (the water solution of 154 mM NH4Cl,
10 mM KHCO3 and 0.1 mM EDTA) was utilized to remove
erythrocytes. Secondly, PBS including 4% formaldehyde was employed
to resuspend the remaining cells, for 5 min at 4°C. The cell
suspension was then placed into the filtration tube, and the pump
valve and the manifold vacuum plate valve were turned on in turn.
To evaluate if CTCs could be predictors of PFS, the PFS of 60
patients was determined by Kaplan-Meier analysis following a median
follow-up time of 8 months (range, 5–21 months).
Tri-color RNA ISH assay
Branched DNA (bDNA) signal amplification technology,
which is increasingly used in molecular diagnostics, achieves its
goal by signal amplification on the bDNA probe following direct
binding of a large hybridization complex to a target sequence
(31,32). In brief, it is a compound of
multi-step nucleic acid hybridization. Firstly, the target
sequences are captured by capture probes, which combine with the
bDNA signal amplification probes, and serve a role as a bridge
between target sequences and amplification probes. As a result, a
branched structure is produced. Finally, fluorescent dye-combined
label probes are used to bind to bDNA molecule amplification probes
by hybridization (30). Using bDNA
signal amplification technology, the present study utilized the
RNA-ISH method to detect the target sequence. According to the
study by Wu et al (30),
there are numerous types of biomarkers for the three types CTCs. In
the present study, cytokeratin 18 (CK18; epithelial biomarker),
Twist (mesenchymal biomarker) and cluster of differentiation 45
(CD45; leukocyte biomarker) were utilized to distinguish
epithelial, mesenchymal and hybrid CTCs. The capture probes
sequences for the CK18, Twist and CD45 genes (listed in Table I) and the sequences for the bDNA
signal amplification probes (listed in Table II) were purchased from Invitrogen
(Thermo Fisher Scientific, Inc.).
 | Table I.Capture probe sequences for the CK18,
Twist, CD45 and N-cadherin genes. |
Table I.
Capture probe sequences for the CK18,
Twist, CD45 and N-cadherin genes.
| Gene | Sequences
(5′-3′) |
|---|
| CK18 |
AGAAAGGACAGGACTCAGGC |
|
|
GAGTGGTGAAGCTCATGCTG |
|
|
TCAGGTCCTCGATGATCTTG |
|
|
CAATCTGCAGAACGATGCGG |
|
|
AAGTCATCAGCAGCAAGACG |
|
|
CTGCAGTCGTGTGATATTGG |
| Twist |
ACAATGACATCTAGGTCTCC |
|
|
CTGGTAGAGGAAGTCGATGT |
|
|
CAACTGTTCAGACTTCTATC |
|
|
CCTCTTGAGAATGCATGCAT |
|
|
TTTCAGTGGCTGATTGGCAC |
|
|
TTACCATGGGTCCTCAATAA |
| CD45 |
TCGCAATTCTTATGCGACTC |
|
|
TGTCATGGAGACAGTCATGT |
|
|
GTATTTCCAGCTTCAACTTC |
|
|
CCATCAATATAGCTGGCATT |
|
|
TTGTGCAGCAATGTATTTCC |
|
|
TACTTGAACCATCAGGCATC |
| N-cadherin |
TGCATAATGCGATTTCACCA |
|
|
ACATTGAGAAGAGGCTGTCC |
|
|
GCTTCAGGCTCAATTTTACT |
|
|
TTCACTGACTCCTCAGTTAA |
|
|
GCTTACTGAATTGTCTTGGG |
|
|
TGGAGTTTTCTGGCAAGTTG |
| Table II.Sequences for the bDNA signal
amplification probes. |
Table II.
Sequences for the bDNA signal
amplification probes.
|
| Function
(copies) | Sequence
(5′-3′) | Complement
(copies) |
|---|
| bDNA probes for
CK18 | Capture probe tail
(1) |
CTACAAACAAACAATATT | Preamplifier leader
(1) |
|
| Preamplifier repeat
(5) | CGCAGCCTCAGCC | Amplifier leader
(1) |
|
| Amplifier repeat
(5) | CCCAGACCCTACC | Label probe
(1) |
| bDNA probes for
Twist | Capture probe tail
(1) |
CTTCTCAATAACTAACAT | Preamplifier leader
(1) |
|
| Preamplifier repeat
(5) | GACGGTCGGCGTT | Amplifier leader
(1) |
|
| Amplifier repeat
(5) | GTCACCGCTCCAC | Label probe
(1) |
| bDNA probes for
CD45 | Capture probe tail
(1) |
CTTTATACCTTTCTTTCA | Preamplifier leader
(1) |
|
| Preamplifier repeat
(5) | GCGCGCTGTAGGG | Amplifier leader
(1) |
|
| Amplifier repeat
(5) | AGGCGAGGGGAGA | Label probe
(1) |
| bDNA probes for
N-cadherin | Capture probe tail
(1) |
AGCTCTTGAGGAAAAGGTCC | Preamplifier leader
(1) |
|
| Preamplifier repeat
(5) | ACACTGTACCGCA | Amplifier leader
(1) |
|
| Amplifier repeat
(5) | GTGCCAAGGTCGA | Label probe
(1) |
The abbreviated process of the RNA-ISH assay was as
follows: In a 24-well plate, the cells were treated with protease
at 4°C for 15 min in order to assist with to reconciling between
capture probes and target sequences prior to hybridization.
Following hybridization, the cells were incubated at 42°C for 2 h,
followed by removing the unbound probes by washing with 1,000 µl
wash buffer (0.1X SSC; Sigma-Aldrich; Merck KGaA) at 45°C for 5 min
(three times). Subsequently, to achieve the signal amplification
goal, the sample was incubated with 100 µl preamplifier solution
[30% horse serum, 1.5% SDS, 3 mM Tris-HCl (pH 8.0) and 0.5 fmol of
preamplifier (sequences are listed in Table II)] at 42°C for 20 min. Following
another wash with 1,000 µl buffer (0.1X SSC) three times, the
samples were subsequently incubated with 100 µl amplifier solution
[30% horse serum, 1.5% SDS, 3 mM Tris-HCl (pH 8.0) and 1 fmol of
the amplifier (Table II)]. The
fluorescently-labeled probes from the APEX™ Alexa Fluor™ Labeling
kit (Invitrogen; Thermo Fisher Scientific, Inc.), which had been
combined with the fluorescent dyes Alexa Fluor 594 (CK18), Alexa
Fluor 488 (Twist), Alexa Fluor 647 (CD45) and Alexa Fluor 555
(N-cadherin), were added and incubated at 42°C for an additional 20
min. Following washing with 0.1X SSC two times and staining with
DAPI in turn for 5 min at 36°C, the samples were analyzed with a
fluorescence microscope (magnification, ×100; Olympus BX53; Olympus
Corporation, Tokyo, Japan). The current study defined low, medium
and high N-cadherin expression according to the following: i) Low
N-cadherin expression, 1< fluorescent intensity of indicated
group/fluorescent intensity of control group ≤1.8; ii) medium
N-cadherin expression, 1.8<fluorescent intensity of indicated
group/fluorescent intensity of control group ≤2.2; and iii) high
N-cadherin expression, 2.2< fluorescent intensity of indicated
group/fluorescent intensity of control group.
Cell culture
The NPC cell line C666-1 was obtained from American
Type Culture Collection (Manassas, VA, USA), and was cultured in
Dulbecco's modified Eagle medium (DMEM; 5.5 mM glucose) with 10%
(v/v) fetal bovine serum (Gibco; Thermo Fisher Scientific, Inc.),
100 U/ml penicillin and 100 U/ml streptomycin (Invitrogen; Thermo
Fisher Scientific, Inc.). The culture medium was replaced daily
until the cells grew to 80% confluency.
Detection of EBV DNA
C666-1 (5×10⁴ cells/well) cells were
seeded in 6-well plates and cultured at 37°C in an atmosphere
containing 5% CO2 for 24 h. C666-1 cells were then
treated with 1 µmol/l XAV949 or 4 mg/l paclitaxel combined with 8
mg/l cisplatin for 48 h. Subsequently, cells were analyzed with the
EBV-DNA assay kit. The EBV-DNA assay was conducted according to the
manufacturer's protocols of the associated ELISA kit (cat. no.
YM-S0533; Yuanmu, Shanghai, China) and EBV nucleic acid
quantitative detection reagent kit.
Cell viability assay
C666-1 (1×10⁴ cells/well) cells were seeded in
96-well plates and cultured at 37°C in an atmosphere containing 5%
CO2 for 24 h. C666-1 cells were then treated with 1
µmol/l XAV949 or 4 mg/l paclitaxel combined with 8 mg/l cisplatin
for 48 h at 37°C. Subsequently, 20 µl MTT solution (5 mg/ml) was
added into each well and was incubated for 4 h at 37°C. Following
this, 150 µl/well dimethyl sulfoxide was added to dissolve
associated crystals. The plate was read with a scanning multi-well
spectrophotometer at 570 nm.
Western blot analysis
C666-1 cells (5×10⁴ cells/well) were
seeded in 6-well plates and cultured at 37°C in an atmosphere
containing 5% CO2 for 24 h. Protein lysates were
collected with a Membrane and Cytosol Protein Extraction kit
(Beyotime Institute of Biotechnology) according to the
manufacturer's protocol. Total protein was quantified using a
bicinchoninic acid assay and 25 µg proteins in each group were
separated by 10% SDS-PAGE electrophoresis and were transferred onto
polyvinylidene difluoride membranes (EMD Millipore). TBS containing
5% skimmed milk and 0.05% Tween-20 were applied to block the
membranes at 37°C for 2.5 h. Finally, membranes were incubated with
the primary antibodies (total caspase-3, active caspase-3,
β-catenin, c-Myc and GAPDH) at 4°C for 14 h (1:500 dilution).
Membranes were then incubated with the goat anti-rabbit secondary
antibodies at 37°C for 2 h (1:1,000 dilution). The indicated
protein bands were analyzed with a ChemiDoc XRS system (Bio-Rad
Laboratories, Inc., Hercules, CA, USA) and quantified using Image J
5.0 software (National Institutes of Health, Bethesda, MD,
USA).
Statistical analysis
One-way analysis of variance, followed by Dunnett's
multiple-comparisons test, was utilized to analyze differences
among groups. The association between two variables was examined by
the Spearman's rank correlation test. Kaplan-Meier analysis was
used to assess the survival function. Log-rank test was used to
obtain P-values of Kaplan-Meier curves. P<0.05 was considered to
indicate a statistically significant difference. Data are presented
as the mean ± standard error of the mean. All statistical analysis
was performed using SPASS statistical analysis software version
19.0 (swMATH, Berlin, Germany).
Results
Detection of CTCs in NPC
A total of 60 patients who met the inclusion and
exclusion criteria were enrolled in the present study. The
CanPatrol™ CTC-enrichment technique was applied to isolate and
analyze CTCs collected from 5 ml peripheral blood samples of
patients. During the analyses, samples were collected to analyze at
different times. The number of CTCs at the first detection was
classified as the baseline. At the baseline, CTCs were identified
in 86.7% (52/60) of all patients, in which CTCs were detected in
100 (5/5), 88.9 (16/18) and 83.8% (31/37) of the patients with
stage II, III and IV disease, respectively. The positive ratio of
mesenchymal CTCs of all patients was 50% (30/60), while the ratios
were 60 (3/5), 33.3 (6/18) and 56.8% (21/37) in patients with stage
II, III and IV disease, respectively. Furthermore, the median and
mean number of CTCs present in the samples of all patients was 4
and 9, respectively (Table III).
Collectively, these results indicated that CTCs could be readily
detected in NPC, particularly in patients with stage II disease,
demonstrating that the number of CTCs may be increased in the early
stages of tumor metastasis. Nearly half of the patients expressed
mesenchymal CTCs, whose positive ratio was increased.
| Table III.Detection of CTCs in nasopharyngeal
carcinoma. |
Table III.
Detection of CTCs in nasopharyngeal
carcinoma.
|
|
CTC+ | Mesenchymal
CTC+ |
|
|
|
|---|
|
|
|
|
|
|
|
|---|
| Clinical
stagea | Number | PR, % | Number | PR, % | Median number of
CTCs | Mean number of
CTCs | SD |
|---|
| II (n=5) | 5 | 100 | 3 | 60.0 | 14 | 18 | 17 |
| III (n=18) | 16 | 88.9 | 6 | 33.3 | 4 | 7 | 9 |
| IV (n=37) | 31 | 83.8 | 21 | 56.8 | 5 | 8 | 10 |
| Total (n=60) | 52 | 86.7 | 30 | 50.0 | 4 | 9 | 10 |
Association of CTCs and clinical
indexes
To investigate the correlation between CTCs level
and clinical indexes, Spearman's ρ was used for analysis. Firstly,
the present study demonstrated that the number of CTCs was not
associated with Tumor-Node-Metastasis (TNM) stage (33), histopathological type and grade
(34), lymph node metastasis,
distant metastasis, carcinoembryonic antigen (CEA) and Eastern
Cooperative Oncology Group (ECOG) score (35) prior to and following therapy (data
not shown). Secondly, EBV infection demonstrated a positive
correlation with the total number of CTCs in NPC (ρ=0.303,
P<0.05; Table IV). Furthermore,
hybrid CTCs were positively associated with EBV infection (ρ=0.402,
P<0.01; Table IV). Negative
correlations between EBV infection and epithelial and mesenchymal
CTCs were detected, however, these were not significant. Thirdly,
ECOG score was demonstrated to be significantly associated with
mesenchymal CTCs (ρ=0.258, P<0.05) and the proportion of
mesenchymal CTCs in total CTCs following therapy (ρ=0.422,
P<0.01) (Table V). Negative
correlations between ECOG score and total, epithelial, and hybrid
CTCs were observed, however, these were not significant.
Collectively, patients with EBV infection positive NPC were more
likely to possess CTCs, particularly hybrid CTCs (Table IV). While ECOG score was positively
correlated with mesenchymal CTCs following therapy (ECOG score vs.
number of CTCs; P=0.046; Table
V).
| Table IV.Correlation between CTCs and EBV
prior to therapy. |
Table IV.
Correlation between CTCs and EBV
prior to therapy.
| Variable | Spearman's ρ | Total CTCs | Epithelial
CTCs | Hybrid CTCs | Mesenchymal
CTCs |
|---|
| EBV | ρ | 0.303 | −0.008 | 0.402 | −0.056 |
|
| P-value | 0.024a | 0.956 | 0.002b | 0.683 |
| Patient samples,
n |
| 55 | 55 | 55 | 55 |
| Table V.Correlation between CTCs and ECOG
score following therapy. |
Table V.
Correlation between CTCs and ECOG
score following therapy.
| Variable | Spearman's ρ | Total CTCs | Epithelial
CTCs | Hybrid CTCs | Mesenchymal
CTCs | PR of mesenchymal
CTCs |
|---|
| ECOG score | ρ | −0.023 | −0.013 | −0.116 | 0.258 | 0.422 |
|
| P-value | 0.864 | 0.922 | 0.378 | 0.046a | 0.003b |
| Patient
samples |
| 60 | 60 | 60 | 60 | 60 |
Correlation with response to the
therapy
To assess the effect of treatment by detecting CTCs,
60 patients were recruited, 36 of which received chemotherapy
treatment with cisplatin and paclitaxel, while 18 patients were
treated with cisplatin and fluoride, and 6 patients underwent
radiotherapy. The treatment effects were as follows: 2/60 cases
with complete response (CR), 43/60 cases with partial response
(PR), 2/60 cases with stable disease (SD), 11/60 cases with
progressive disease (PD) and 2/60 cases of unknown treatment
effects.
In these 58 patients whose treatment effect was
identifiable, 43/58 (74.1%) cases exhibited a treatment effect
associated with the changing of the number of CTCs. These included
4 cases with PD where the number of CTCs increased, 2 cases with SD
where the number of CTCs did not change, 35 cases with PR where the
number of CTCs were decreased or did not change, and 2 cases with
CR where the number of CTCs were decreased. Similarly, 38/58
(65.5%) cases exhibited a treatment effect associated with the
change in the number of mesenchymal CTCs. For patients who were
treated with cisplatin and paclitaxel, the effective rate was 76.5
and 70.6% for total and mesenchymal CTCs, respectively (data not
shown). In 34/36 patients who exhibited a identifiable treatment
effect, the changing number of CTCs during treatment and
mesenchymal CTCs following therapy demonstrated a negative
correlation with the treatment effect (ρ=−0.347, P<0.05; and
ρ=−0.494, P<0.01, respectively) (Table VI). However, no significant
association between therapeutic effect and number of total CTCs,
epithelial CTCs or hybrid CTCs was identified in patients with NPC.
Also, no significant association between therapeutic effect and
change of hybrid CTCs, epithelial CTCs or mesenchymal CTCs was
identified in patients with NPC. For patients who were treated with
cisplatin and fluoride, the effective rate was 66.7 and 61.1% for
total and mesenchymal CTCs, respectively (data not shown).
| Table VI.Correlation between CTCs and
therapeutic effect following treatment with cisplatin and
paclitaxel. |
Table VI.
Correlation between CTCs and
therapeutic effect following treatment with cisplatin and
paclitaxel.
| Variable | Spearman's ρ | Total CTCs | Epithelial
CTCs | Hybrid CTCs | Mesenchymal
CTCs | Total CTCs
change | Epithelial CTCs
change | Hybrid CTCs
change | Mesenchymal CTCs
change |
|---|
| Therapeutic
effect | ρ | −0.319 | 0.019 | −0.308 | −0.494 | −0.347 | −0.025 | −0.292 | −0.279 |
|
| P-value | 0.066 | 0.913 | 0.076 | 0.003b | 0.044a | 0.890 | 0.094 | 0.110 |
| Patient
samples |
| 34 | 34 | 34 | 34 | 34 | 34 | 34 | 34 |
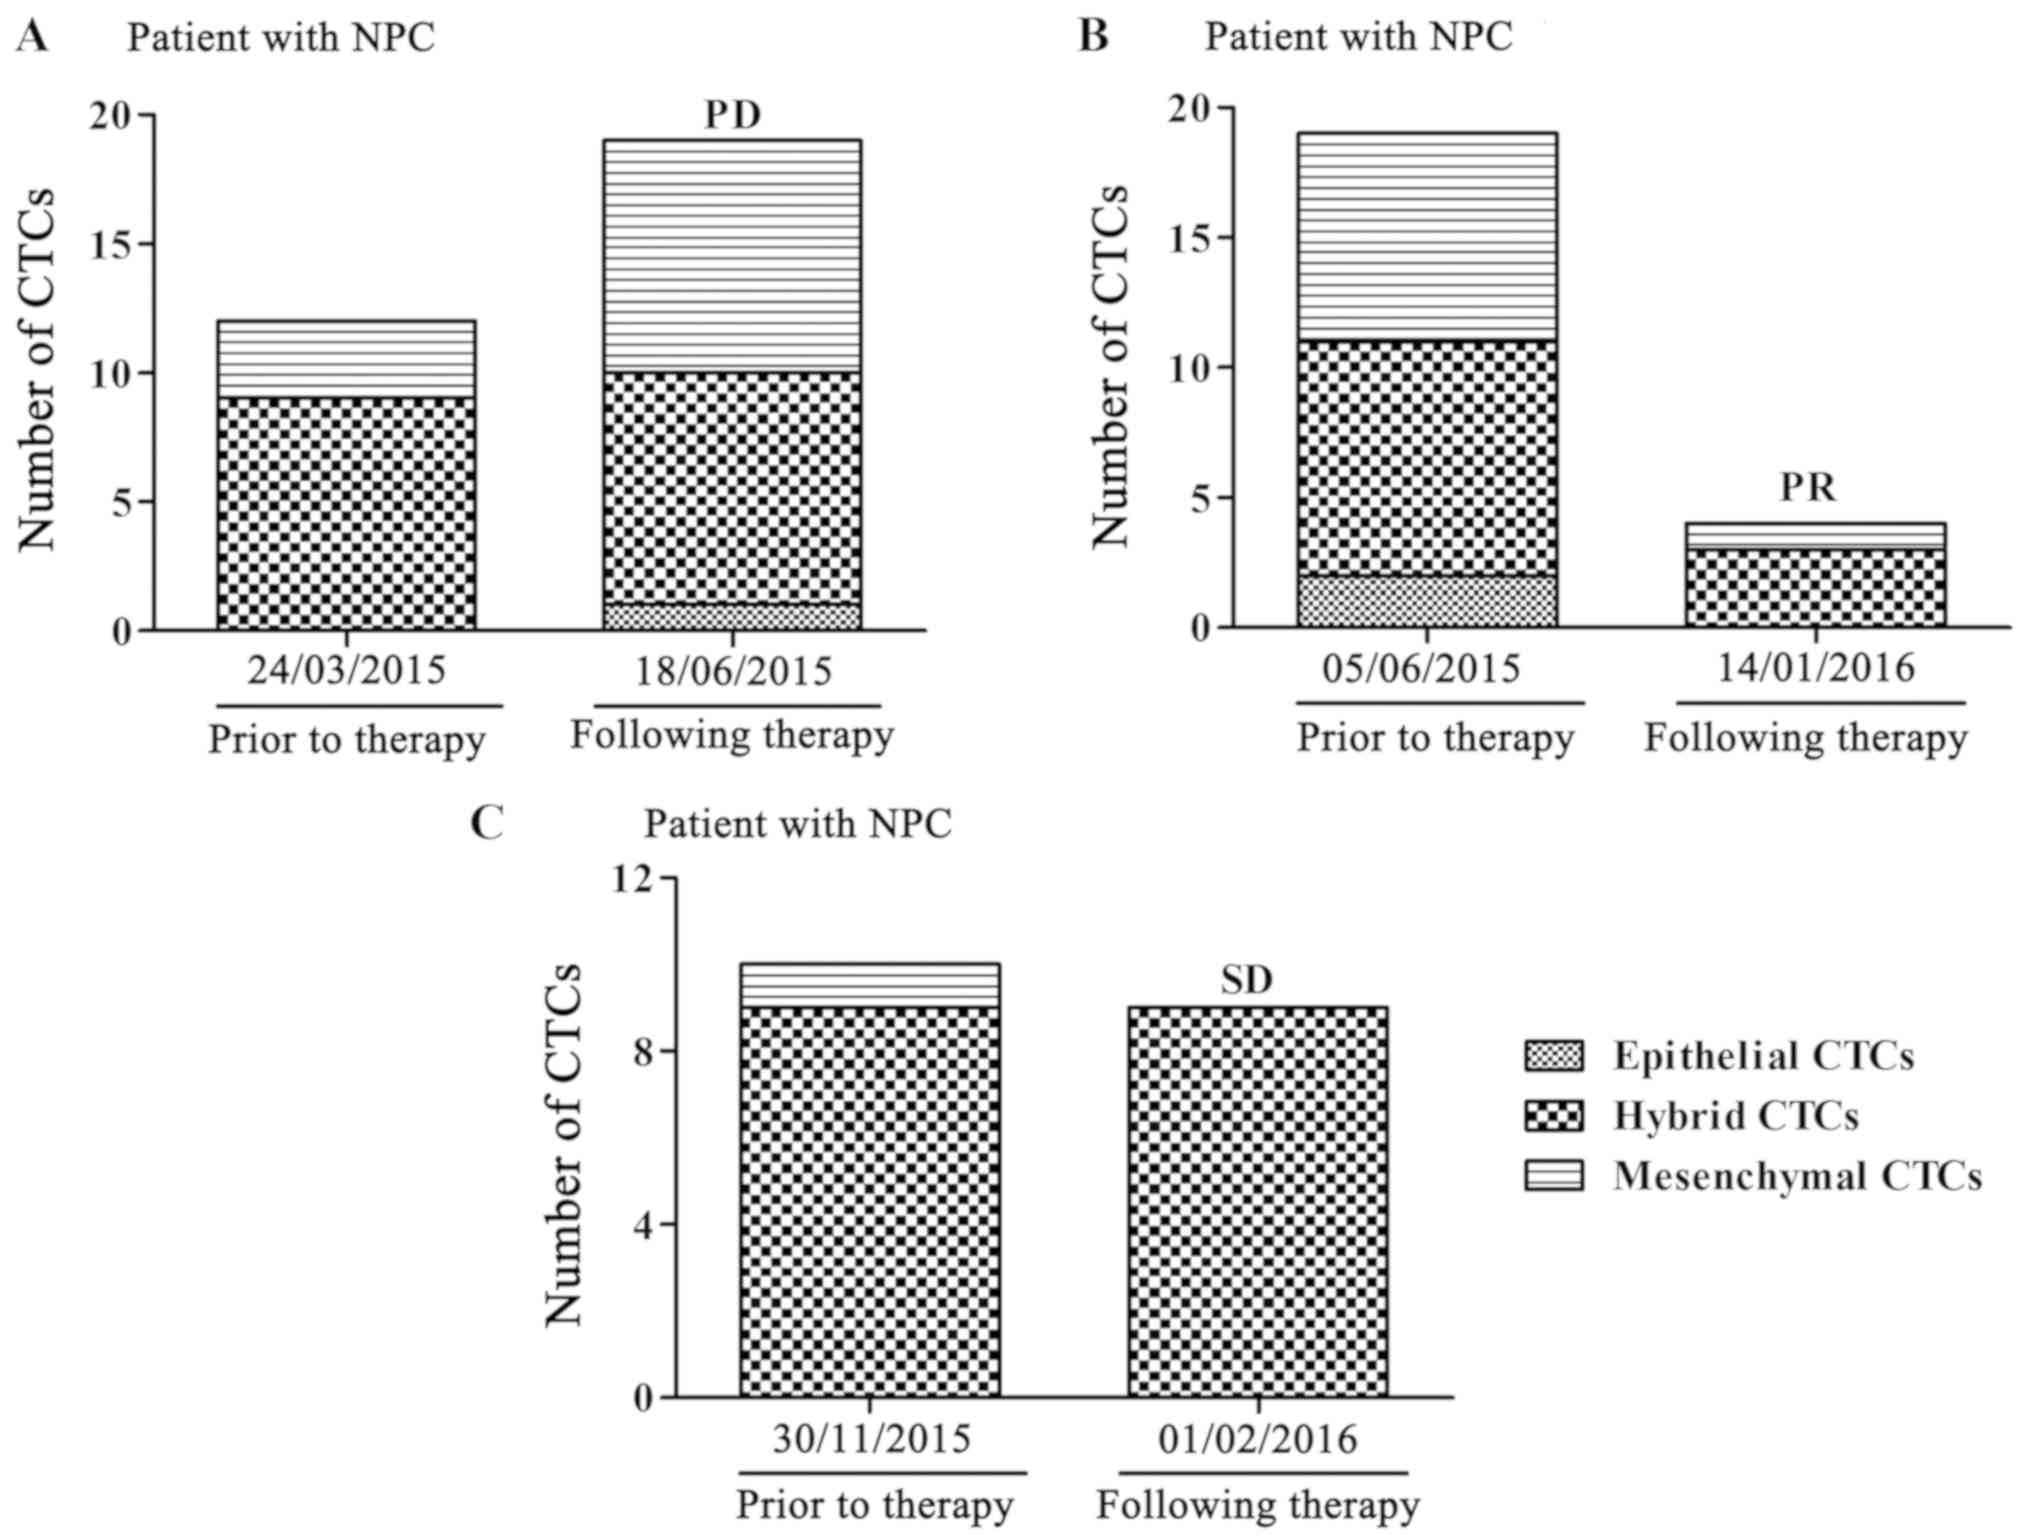
A total of three typical cases are presented to
support the results. Blood samples from three patients were
collected and analyzed prior to and following treatment with
cisplatin and paclitaxel. A patient with stage IVa disease, whose
total and mesenchymal CTCs were increased, had a PD following
therapy (Fig. 1A), while another
patient with stage IVa disease had a PR when the total and
mesenchymal CTCs were decreased (Fig.
1B). Furthermore, a patient with stage IVb disease, whose total
and mesenchymal CTCs were not significantly altered, had SD
following therapy (Fig. 1C). These
analyses indicated that a reduction of CTCs, particularly
mesenchymal CTCs, demonstrate a curative effect.
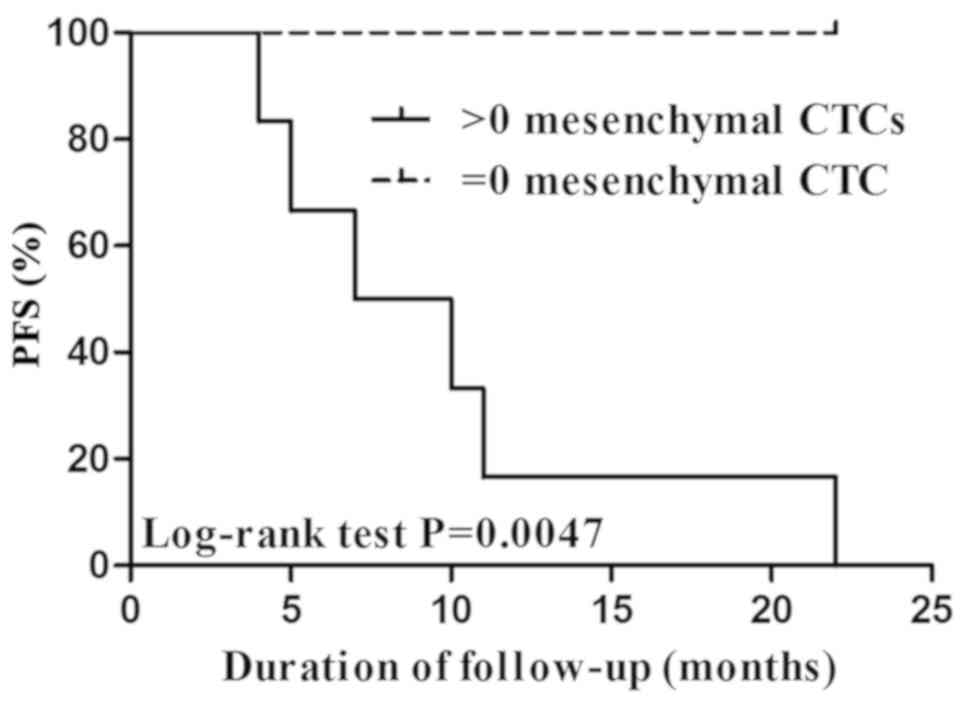
Correlation between CTCs and
progression-free survival (PFS)
No notable association was demonstrated between CTCs
following therapy and PFS without considering the therapeutic
schedule or in patients treated with cisplatin and fluoride (data
not shown). However, a significant correlation was illustrated
between mesenchymal CTCs following therapy and PFS in 36 patients
treated with cisplatin and paclitaxel (data not shown). The PFS of
patients without mesenchymal CTCs (CTC=0) was significantly
increased, compared with patients with >0 mesenchymal CTCs
(P=0.0047; Fig. 2).
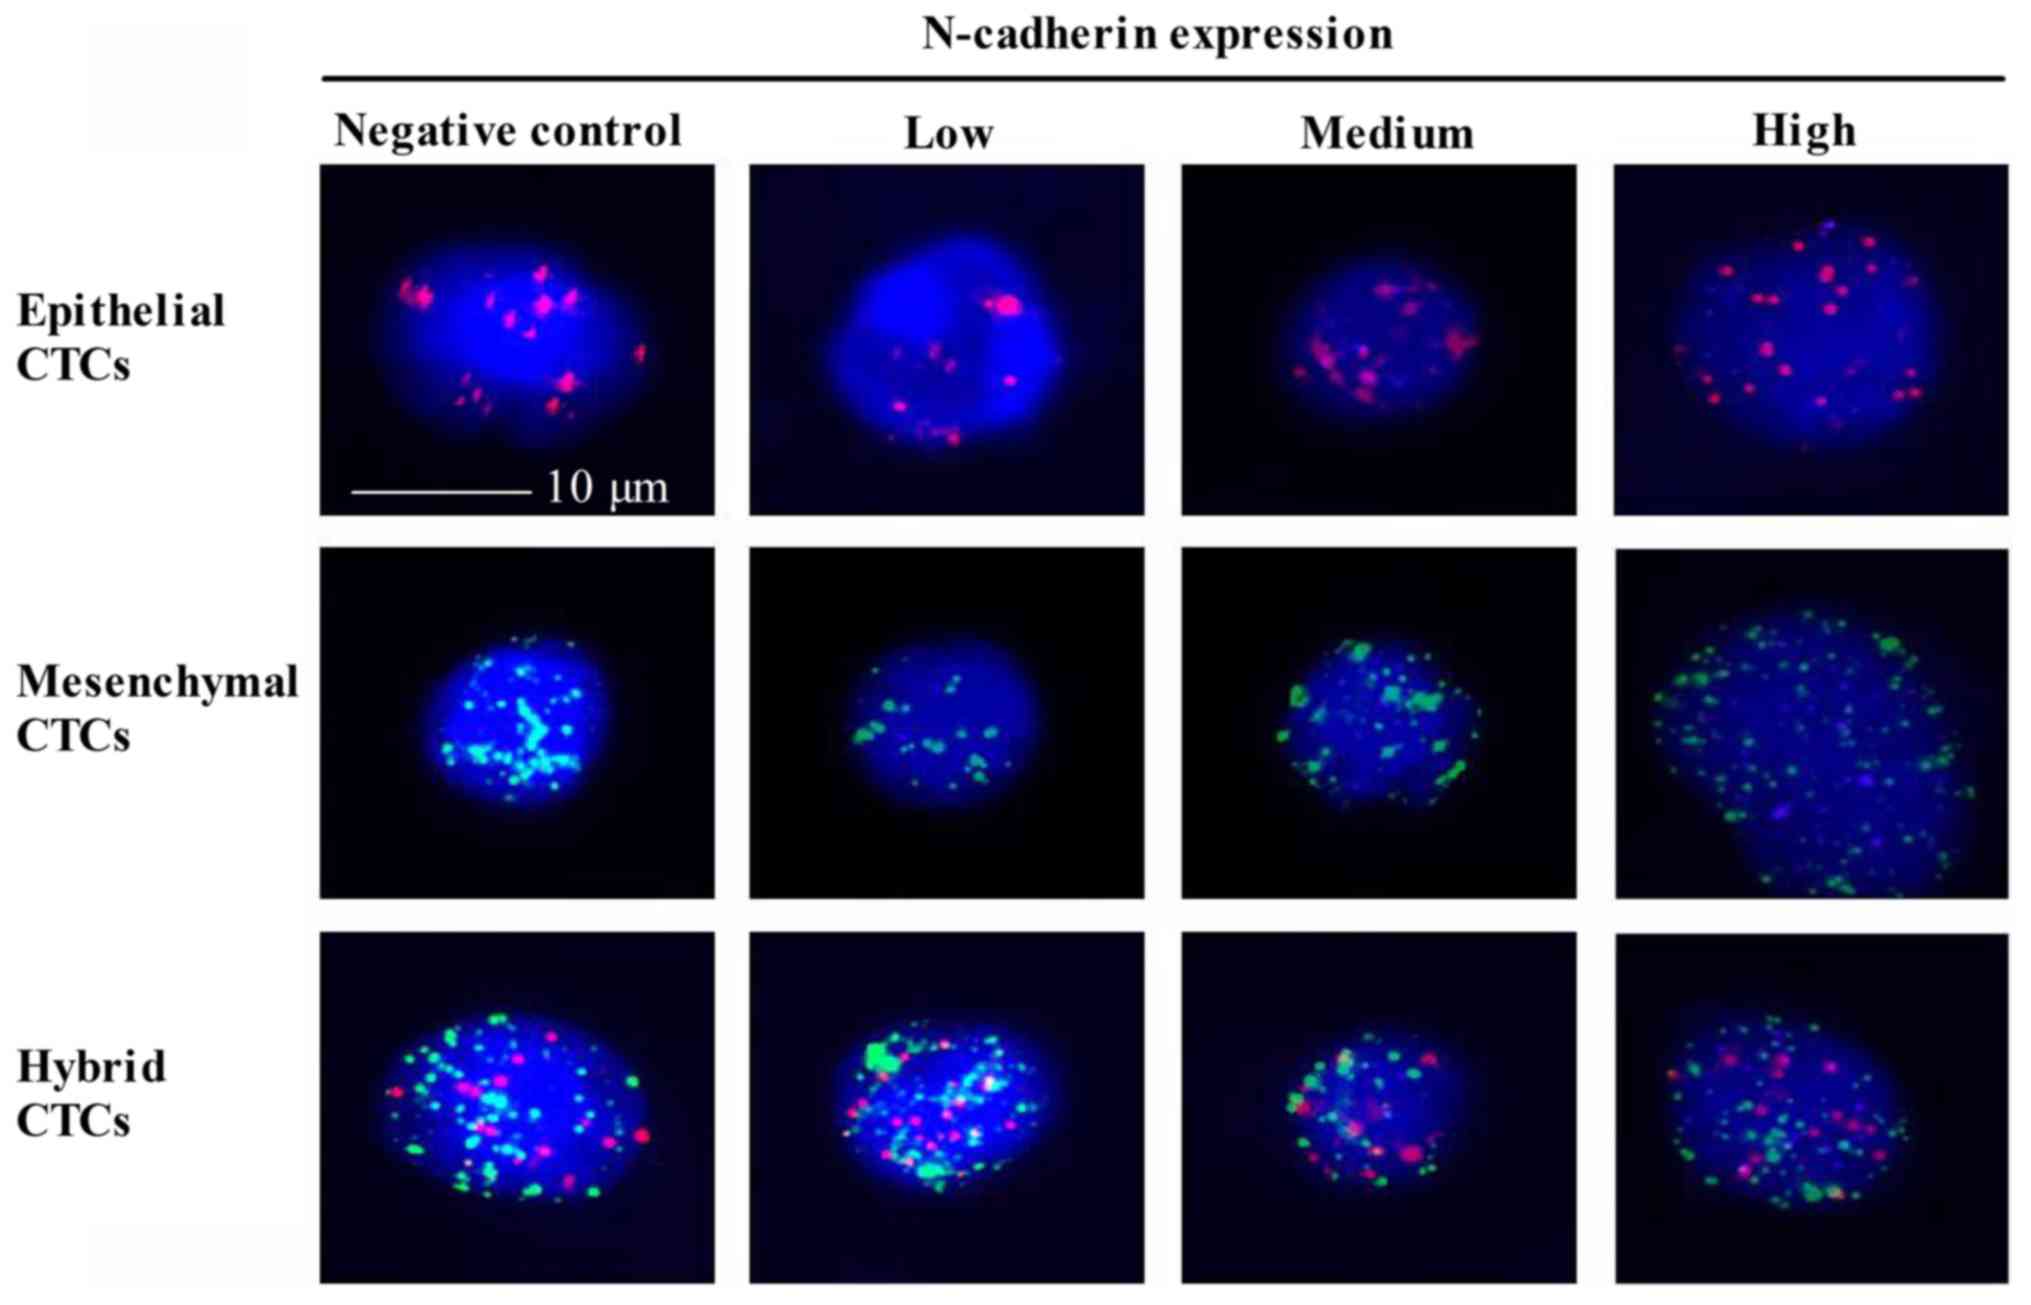
Expression of N-cadherin in CTCs and
its correlation with NPC
Expression of N-cadherin is a symbol of EMT
(36), however, to the best of our
knowledge, N-cadherin expression in CTCs of patients with NPC has
not yet been investigated. A Tri-color RNA-ISH assay was used to
indicate N-cadherin in three types of CTCs (Fig. 3). Epithelial CTCs revealed only red
fluorescence due to the marker CK18. Mesenchymal CTCs demonstrated
only green fluorescence due to the marker Twist. While hybrid CTCs
revealed both red and green fluorescence. The N-cadherin positive
rate in epithelial, mesenchymal and hybrid CTCs was 78.4, 62.2 and
79.5%, respectively. Notably, the percentage of medium N-cadherin
expression in epithelial CTCs (45.3%) and hybrid CTCs (42.5%) was
increased, compared with mesenchymal CTCs (24.8%) (Table VII). Furthermore, high N-cadherin
expression levels in three CTCs types were consistent with the
previous results. Collectively, N-cadherin was expressed with high
positive rates in all three types of CTCs. It appears that an
increased N-cadherin expression was identified in CTCs with the
potential of EMT, however further experiments are required to
illustrate this.
| Table VII.Association between CTCs and
N-cadherin expression. |
Table VII.
Association between CTCs and
N-cadherin expression.
| Type of CTCs | Cell number | N-cadherin negative
number (%) | N-cadherin positive
number (%) | Low N-cadherin
expression number (%) | Medium N-cadherin
expression number (%) | High N-cadherin
expression number (%) |
|---|
| Epithelial
CTCs | 190 | 41 (21.6) | 149 (78.4) | 49 (25.8) | 86 (45.3) | 14 (7.4) |
| Hybrid CTCs | 1,022 | 209 (20.5) | 813 (79.5) | 298 (29.2) | 434 (42.5) | 81 (7.9) |
| Mesenchymal
CTCs | 283 | 107 (37.8) | 176 (62.2) | 100 (35.3) | 70 (24.8) | 6 (2.1) |
| Total CTCs | 1,495 | 357 (23.9) | 1,138 (76.1) | 447 (29.9) | 590 (39.5) | 101 (6.8) |
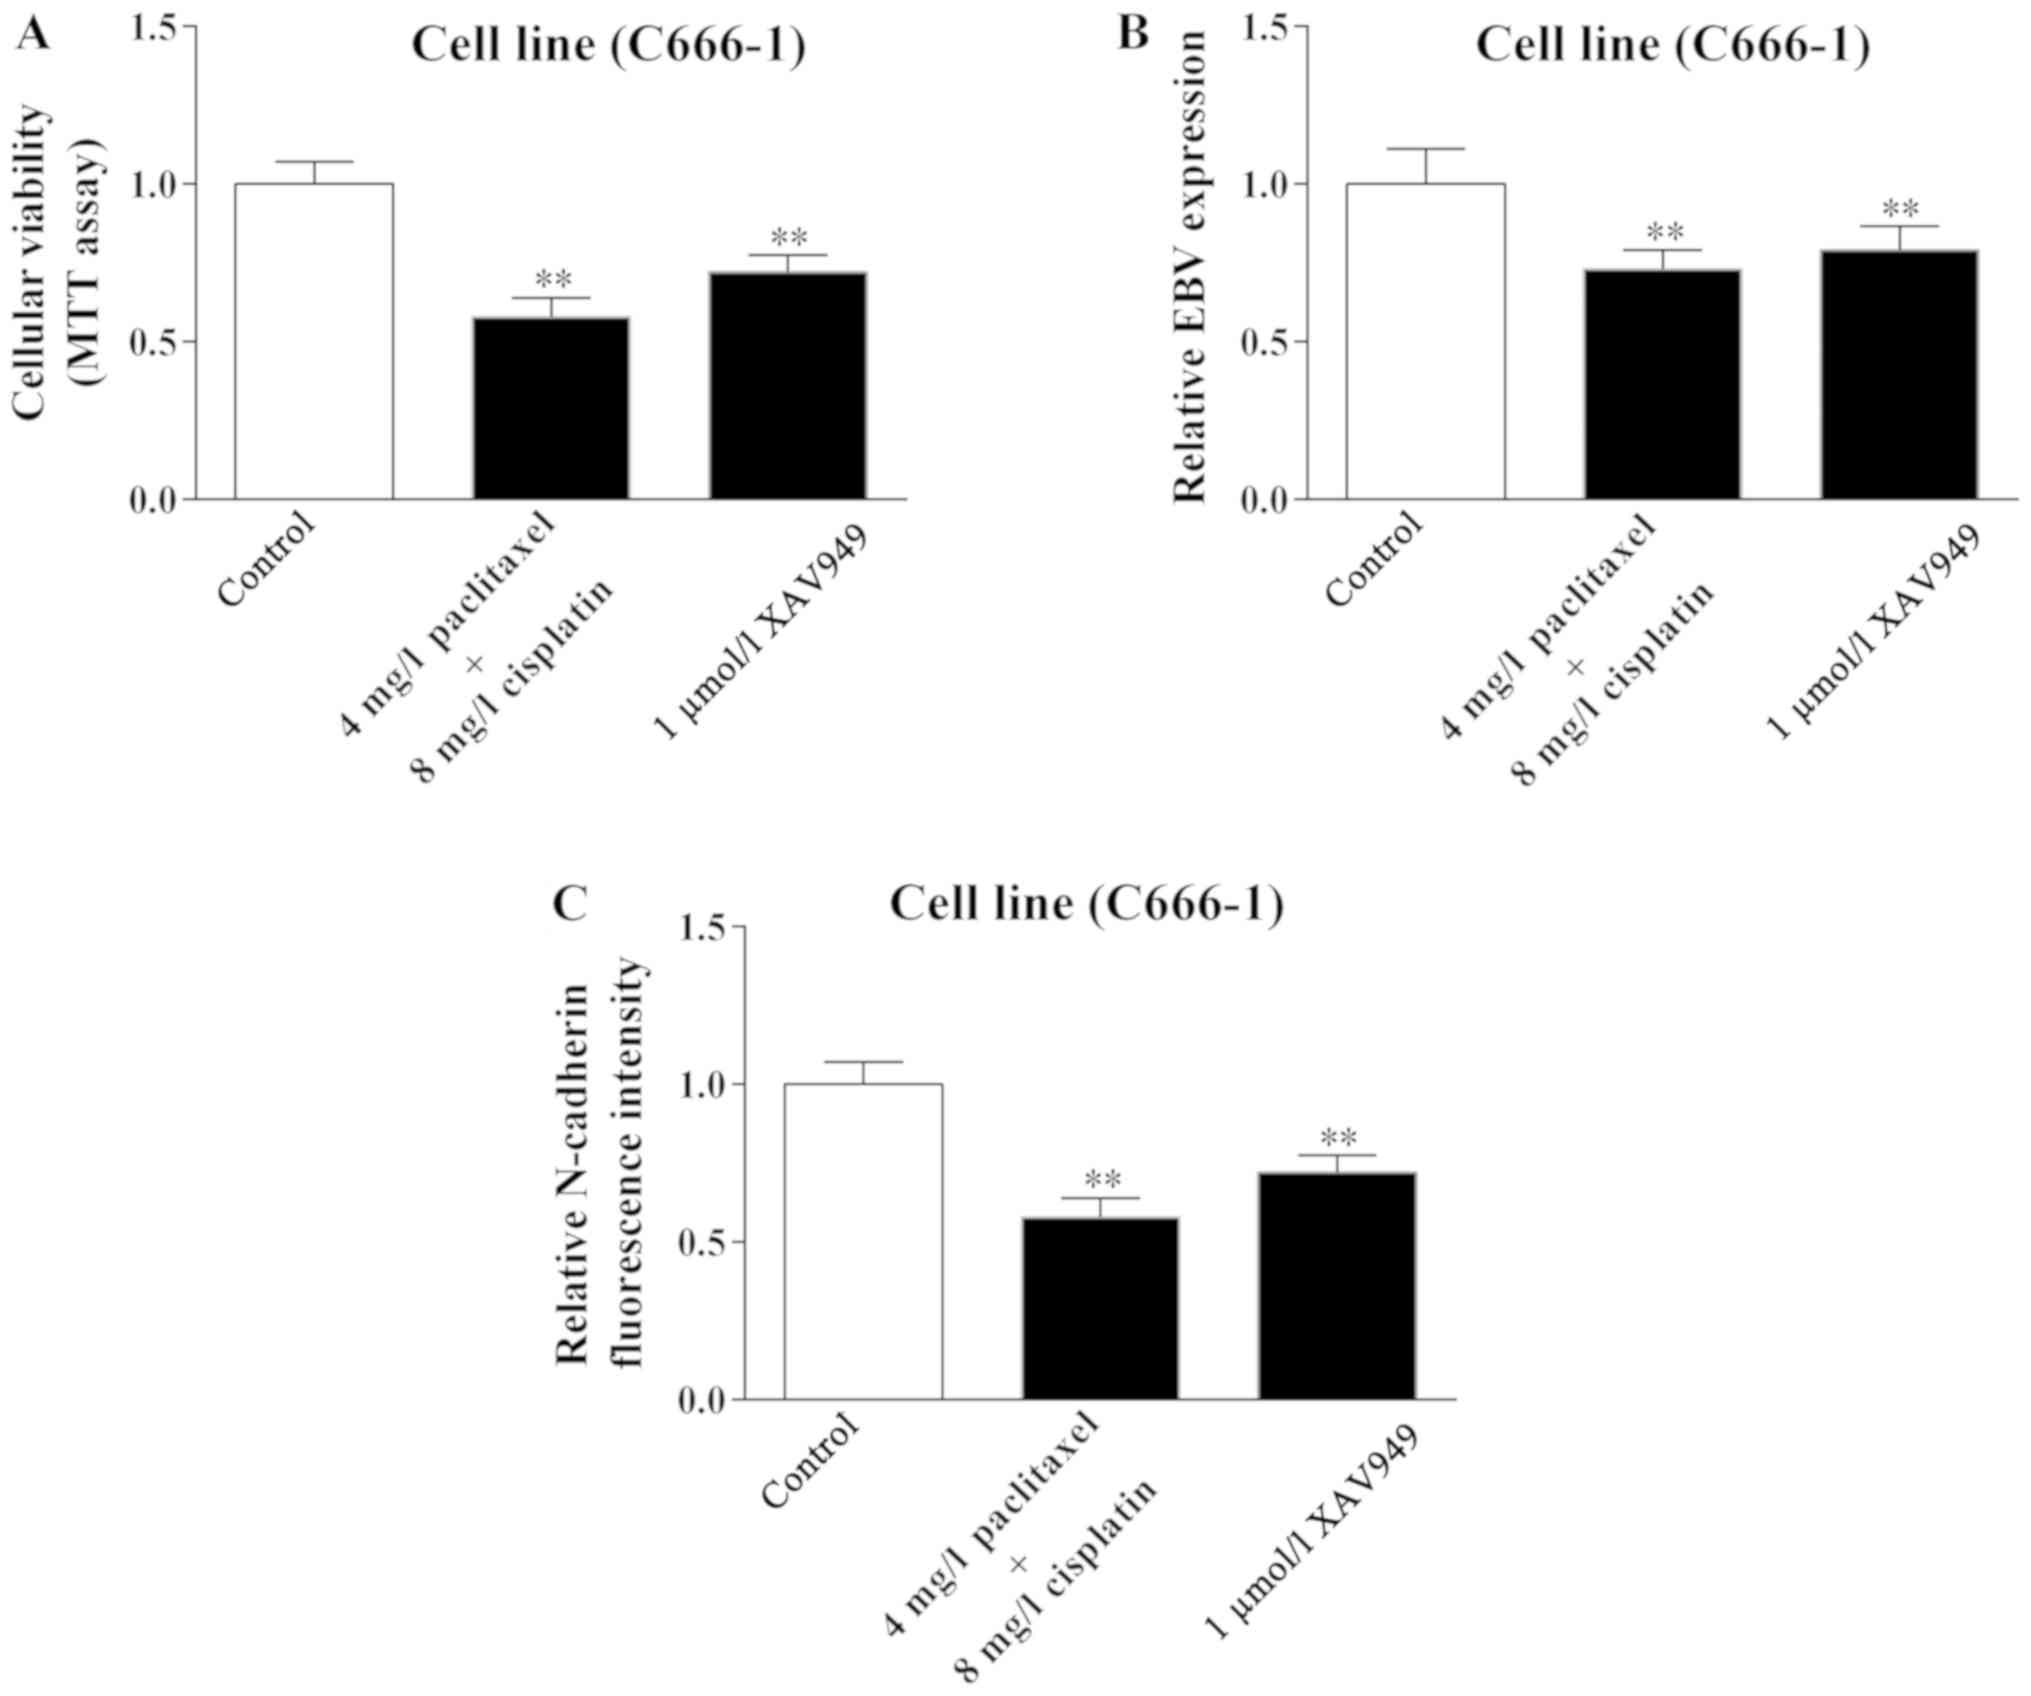
Wnt/β-catenin signaling may incite
apoptosis of C666-1 cell following treatment of cisplatin combined
with paclitaxel
The previous results established that the number and
the marker change of CTCs indicated the effect of therapy. However,
the cause of this phenomenon has not been elucidated completely.
Therefore, the present study used the NPC cell line C666-1 in an
attempt to clarify this mechanism.
In accordance with the change in the number of CTCs
following therapy, cellular viability of C666-1 was significantly
inhibited in the cisplatin combined with paclitaxel group when
compared with the control group (P<0.01; Fig. 4A). Furthermore, following treatment
with cisplatin combined with paclitaxel, levels of EBV and
N-cadherin were significantly decreased in C666-1 cells compared
with the control group (P<0.01; Fig.
4B and C). Notably, the Wnt/β-catenin inhibitor XAV949
demonstrated the identical effect on cellular viability, and EBV
and N-cadherin level of C666-1 cells, indicating that Wnt/β-catenin
signaling may have a role in the regulation of C666-1 cells
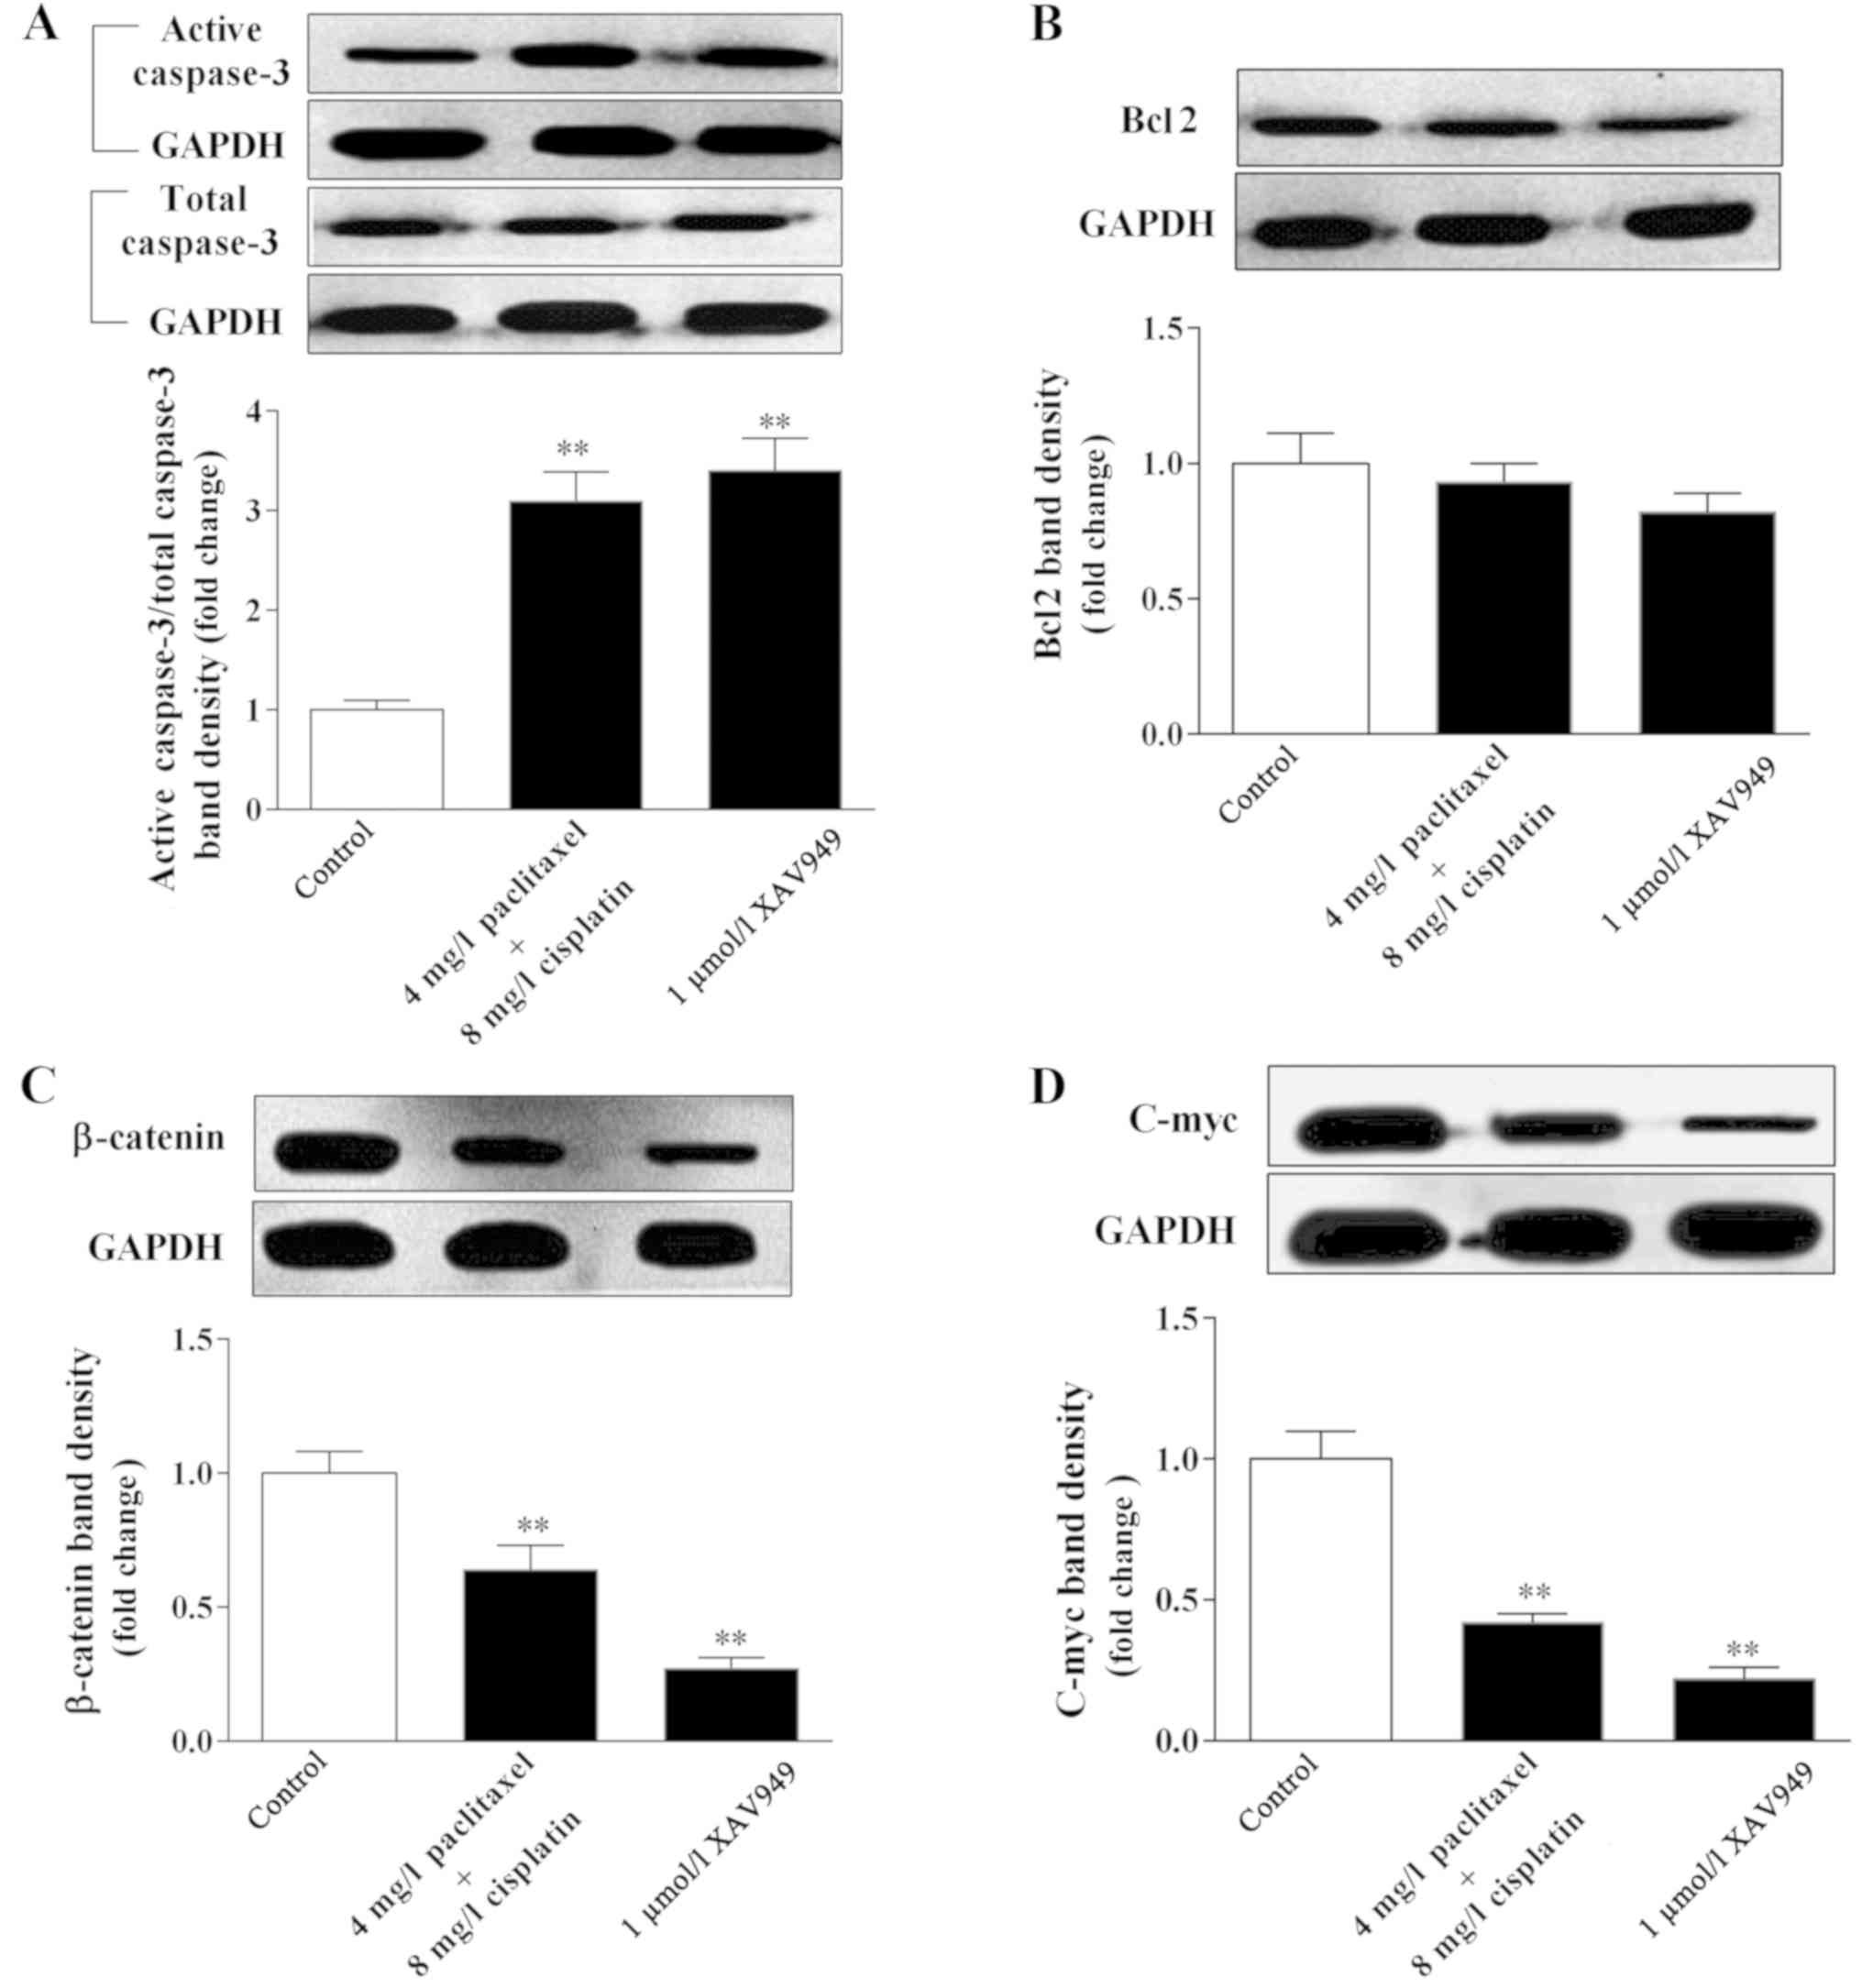
following treatment (P<0.01). By contrast, the results
demonstrated that cisplatin combined with paclitaxel, exhibited a
similar effect as XAV949, with significantly increased caspase-3
level and decreased Bcl2 level in C666-1 cells compared with the
control group (P<0.01; Fig. 5A and
B), indicating that cisplatin combined with paclitaxel could
result in apoptosis of C666-1 cells. Furthermore, the expression
levels of β-catenin and c-Myc, a key protein and downstream
factor of Wnt/β-catenin signaling (37), were significantly decreased by
cisplatin combined with paclitaxel (P=0.008 and P=0.006,
respectively, vs. the control) or XAV949 (P=0.005 and P=0.006,
respectively, vs. the control; Fig. 5C
and D). Collectively, cisplatin combined with paclitaxel could
regulate the Wnt/β-catenin signaling pathway to inhibit EBV and
N-cadherin expression, and induce apoptosis of C666-1 cells.
Discussion
Clinical staging is a basic method to evaluate
tumors, and primarily depends on imaging (38). Previously, with the development of
molecular targeted therapy, a growing number of molecular markers
have been identified and utilized to evaluate the curative effect
and prognosis of tumors (39). CTCs,
from the metastasis of primary tumors, have tumor biological
characteristics, and have gradually become a means to evaluate the
index of a tumor (40). Monitoring
the changes of CTCs in peripheral blood may be effective in
evaluating the efficacy of various therapeutics. Furthermore, as
techniques to detect CTCs progress, there will be a reduced
requirement to perform tumor biopsies. CTCs can be used for the
detection of tumors by genetic conditions, to guide targeted
therapy, which is termed as ‘liquid biopsy’ (41). The present study demonstrated that
CTCs can be identified in the peripheral blood of patients with
NPC, using a technique called CanPatrol CTC enrichment, which has
previously been demonstrated to effectively isolate and
characterize CTCs (30).
The data obtained by the present study demonstrated
that CTCs could be detected not only in advanced stages, but also
in the early stages of NPC, and mesenchymal CTCs were expressed at
an increased ratio. CTC positivity was not associated with clinical
characters, including TNM stage, histopathological type and grade,
lymph node metastasis, distant metastasis and CEA, prior to and
following therapy. EBV has a high incidence of infecting CTCs, and
previous research has demonstrated that EBV is expressed in all
three types of CTCs (42). In the
present study, the data demonstrated that EBV expression was
positively associated with CTCs at a baseline level, and a high
ratio of EBV can be detected in CTCs of patients with NPC at their
first consultation. However, no significant correlation was
identified between EBV and CTCs in patients following therapy.
Notably, the present study demonstrated that the EBV level in
C666-1 cells was decreased following treatment with paclitaxel
combined with cisplatin. For the ECOG score, the results were the
opposite of those for EBV, with it being negatively correlated with
CTCs initially and were positively correlated following treatment.
These results demonstrate that EBV may be regarded as a biomarker
to diagnose NPC.
To the best of our knowledge, there are no studies
regarding the association between the change in the number of CTCs
and the clinical response to therapy in patients with NPC. The
present data demonstrated that the increased number of total and
mesenchymal CTCs following treatment indicated poor therapeutic
effects. In the present study, it was determined that the number of
CTCs in patients who exhibited a CR or PR following treatment was
decreased or did not change. Additionally, the patients with a SD
following treatment exhibited no change in the numbers of CTCs,
while the number of CTCs in patients with a PD following treatment
was increased. In a clinical setting, patients with NPC who
initially respond to radiotherapy are frequently considered for
reduction in treatment intensity or a treatment break (43). However, rapid disease progression
during this treatment break is a potential disadvantage of this
method (44–46). CTCs may have a role in assisting
patients to prolong treatment breaks or resume therapy quicker
(47). The present data demonstrated
that if mesenchymal CTCs could not be detected, the PFS of patients
treated with cisplatin and fluoride was prolonged, indicating that
CTCs may serve as predictors of PFS.
N-cadherin is a transmembrane, hemophilic
glycoprotein belonging to the calcium-dependent cell adhesion
molecule family (48). High
expression of N-cadherin is associated with tumor invasion and
metastasis, whereas EMT is associated with tumor malignancy and
metastasis, and N-cadherin is considered as a characteristic of EMT
(49–51). In the present study, the expression
of N-cadherin was detected in the CTCs in 60 patients with NPC. The
data demonstrated that the positive expression rate of N-cadherin
in all three types of CTCs was notably high. However, the ratio of
high N-cadherin expression in the three types of CTCs was low.
Further study should prospectively address whether the expression
of N-cadherin is correlated with clinical indexes. Furthermore, the
present study demonstrated that N-cadherin was abnormally expressed
in CTCs, and N-cadherin expression in C666-1 cells was
significantly inhibited by treatment of paclitaxel combined with
cisplatin.
In accordance with the clinical results, it was
confirmed that paclitaxel combined with cisplatin could regulate
Wnt/β-catenin signaling to induce apoptosis and identify markers of
NPC cells. These results provided a new reference to use a
Wnt/β-catenin signaling inhibitor combined with traditional
antitumor medicine to treat NPC. However, further study should be
conducted prior to any widespread clinical application.
Collectively, the results of the present study
demonstrated that CTCs can be detected in the peripheral blood of
patients with NPC. CTCs exhibited a statistically significant
association with EBV prior to treatment, and the ECOG score
following treatment. In addition, the number change of CTCs was
notably associated with the treatment effect following
chemotherapy, particularly in patients treated with cisplatin and
paclitaxel. Paclitaxel combined with cisplatin was demonstrated to
regulate Wnt/β-catenin signaling to induce apoptosis and marker
expression in NPC cells, and mesenchymal CTCs may serve as a
predictor of PFS. These data indicated that CTCs may serve as a
biomarker in monitoring the therapeutic efficacy of NPC treatments.
Additional molecular mechanism-based studies are required in order
to confirm whether a signaling inhibitor combined with traditional
antitumor medicine could be an effective treatment for NPC.
Acknowledgements
The authors would like to thank Guangzhou SurExam
Bio-Tech Co., Ltd. (Guangzhou, China), who supported the present
study with CTC isolation and Tri color RNA ISH assay
experiments.
Funding
Not applicable.
Authors' contributions
Study design was undertaken by ZL and PY. The
clinical studies were conducted by DX. The experimental studies
were performed by ZL, HC and ZW. Data acquisition was performed by
YY, SW and ZW. Data analysis was performed by CL, ZC, SW, DL and
ZW. Interpretation of data was performed by ZW. Literature research
was performed by PY, SW and DL. Revision of the manuscript was
performed by ZL, DL, ZW and PY. Manuscript preparation was
conducted by ZL. Manuscript editing was conducted by ZW and ZL.
Availability of data and materials
The datasets used or analyzed in the study are
available from the corresponding author on reasonable request. We
declared that materials described in the manuscript, including all
relevant raw data, will be freely available to any scientist
wishing to use them for non-commercial purposes, without breaching
participant confidentiality.
Ethics approval and consent to
participate
The present study was approved by the Ethical
Committee of the People's Hospital of Gaozhou (Gaozhou, China).
Patients provided written informed consent for inclusion in the
present study.
Patient consent for publication
Not applicable.
Competing interests
The authors declare that they have no competing
interests.
Glossary
Abbreviations
Abbreviations:
|
NPC
|
nasopharyngeal carcinoma
|
|
CTCs
|
circulating tumor cells
|
|
ISH
|
in situ hybridization
|
|
PFS
|
progression-free survival
|
|
EBV
|
Epstein-Barr virus
|
|
ECOG
|
Eastern Cooperative Oncology Group
|
|
EMT
|
epithelial-mesenchymal transition
|
|
CR
|
complete response
|
|
PR
|
partial response
|
|
SD
|
stable disease
|
|
PD
|
progressive disease
|
References
|
1
|
Cao SM, Simons MJ and Qian CN: The
prevalence and prevention of nasopharyngeal carcinoma in China.
Chin J Cancer. 30:114–119. 2011. View Article : Google Scholar : PubMed/NCBI
|
|
2
|
Horikawa T, Yoshizaki T, Kondo S, Furukawa
M, Kaizaki Y and Pagano JS: Epstein-Barr Virus latent membrane
protein 1 induces Snail and epithelial-mesenchymal transition in
metastatic nasopharyngeal carcinoma. Br J Cancer. 104:1160–1167.
2011. View Article : Google Scholar : PubMed/NCBI
|
|
3
|
Chan AT: Nasopharyngeal carcinoma. Ann
Oncol. 21 (Suppl 7):vii308–vii312. 2010. View Article : Google Scholar : PubMed/NCBI
|
|
4
|
Lin JH, Jiang CQ, Ho SY, Zhang WS, Mai ZM,
Xu L, Lo CM and Lam TH: Smoking and nasopharyngeal carcinoma
mortality: A cohort study of 101,823 adults in Guangzhou, China.
BMC Cancer. 15:9062015. View Article : Google Scholar : PubMed/NCBI
|
|
5
|
Sousa H, Mesquita L, Ribeiro J, Catarino
R, Breda E and Medeiros R: Polymorphisms in host immune response
associated genes and risk of nasopharyngeal carcinoma development
in Portugal. Immunobiology. 221:145–152. 2016. View Article : Google Scholar : PubMed/NCBI
|
|
6
|
Ashworth TR: A case of cancer in which
cells similar to those in the tumours were seen in the blood after
death. Aust Med J. 14:146–149. 1869.
|
|
7
|
Gupta GP and Massagué J: Cancer
metastasis: building a framework. Cell. 127:679–695. 2006.
View Article : Google Scholar : PubMed/NCBI
|
|
8
|
Książkiewicz M, Markiewicz A and Żaczek
AJ: Epithelial-mesenchymal transition: A hallmark in metastasis
formation linking circulating tumor cells and cancer stem cells.
Pathobiology. 79:195–208. 2012. View Article : Google Scholar : PubMed/NCBI
|
|
9
|
Guarino M: Epithelial-mesenchymal
transition and tumour invasion. Int J Biochem Cell Biol.
39:2153–2160. 2007. View Article : Google Scholar : PubMed/NCBI
|
|
10
|
Lecharpentier A, Vielh P, Perez-Moreno P,
Planchard D, Soria JC and Farace F: Detection of circulating tumour
cells with a hybrid (epithelial/mesenchymal) phenotype in patients
with metastatic non-small cell lung cancer. Br J Cancer.
105:1338–1341. 2011. View Article : Google Scholar : PubMed/NCBI
|
|
11
|
Economopoulou P, Georgoulias V and
Kotsakis A: Classifying circulating tumor cells to monitor cancer
progression. Expert Rev Mol Diagn. 17:153–165. 2017. View Article : Google Scholar : PubMed/NCBI
|
|
12
|
Cai LL, Ye HM, Zheng LM, Ruan RS and Tzeng
CM: Circulating tumor cells (CTCs) as a liquid biopsy material and
drug target. Curr Drug Targets. 15:965–972. 2014.PubMed/NCBI
|
|
13
|
Cristofanilli M: Circulating tumor cells,
disease progression, and survival in metastatic breast cancer.
Semin Oncol 33 (3 Suppl 9). S9–S14. 2006.
|
|
14
|
Nolé F, Munzone E, Zorzino L, Minchella I,
Salvatici M, Botteri E, Medici M, Verri E, Adamoli L, Rotmensz N,
et al: Variation of circulating tumor cell levels during treatment
of metastatic breast cancer: Prognostic and therapeutic
implications. Ann Oncol. 19:891–897. 2008. View Article : Google Scholar : PubMed/NCBI
|
|
15
|
Cohen SJ, Punt CJ, Iannotti N, Saidman BH,
Sabbath KD, Gabrail NY, Picus J, Morse M, Mitchell E, Miller MC, et
al: Relationship of circulating tumor cells to tumor response,
progression-free survival, and overall survival in patients with
metastatic colorectal cancer. J Clin Oncol. 26:3213–3221. 2008.
View Article : Google Scholar : PubMed/NCBI
|
|
16
|
Fina E, Necchi A, Giannatempo P, Colecchia
M, Raggi D, Daidone MG and Cappelletti V: Clinical significance of
early changes in circulating tumor cells from patients receiving
first-line cisplatin-based chemotherapy for metastatic urothelial
carcinoma. Bladder Cancer. 2:395–403. 2016. View Article : Google Scholar : PubMed/NCBI
|
|
17
|
Hirose T, Oki Y, Kusumoto S, Sugiyama T,
Shirai T, Nakashima M, Yamaoka T, Okuda K, Ohnishi T, Ohmori T and
Adachi M: Circulating tumor cells as a predictive marker for
chemotherapy and prognostic marker in patients with metastatic
non-small cell lung cancer. J Clin Oncol. 29 (Suppl 15):e210202011.
View Article : Google Scholar
|
|
18
|
Hall C, Valad L and Lucci A: Circulating
tumor cells in breast cancer patients. Crit Rev Oncog. 21:125–139.
2016. View Article : Google Scholar : PubMed/NCBI
|
|
19
|
Alva A, Friedlander T, Clark M, Huebner T,
Daignault S, Hussain M, Lee C, Hafez K, Hollenbeck B, Weizer A, et
al: Circulating tumor cells as potential biomarkers in bladder
cancer. J Urol. 194:790–798. 2015. View Article : Google Scholar : PubMed/NCBI
|
|
20
|
Derycke LD and Bracke ME: N-cadherin in
the spotlight of cell-cell adhesion, differentiation,
embryogenesis, invasion and signalling. Int J Dev Bio. 48:463–476.
2004. View Article : Google Scholar
|
|
21
|
Craig SE and Brady-Kalnay SM: Cancer cells
cut homophilic cell adhesion molecules and run. Cancer Res.
71:303–309. 2011. View Article : Google Scholar : PubMed/NCBI
|
|
22
|
Nieman MT, Prudoff RS, Johnson KR and
Wheelock MJ: N-cadherin promotes motility in human breast cancer
cells regardless of their E-cadherin expression. J Cell Biol.
147:631–644. 1999. View Article : Google Scholar : PubMed/NCBI
|
|
23
|
Araki K, Shimura T, Suzuki H, Tsutsumi S,
Wada W, Yajima T, Kobayahi T, Kubo N and Kuwano H: E/N-cadherin
switch mediates cancer progression via TGF-β-induced
epithelial-to-mesenchymal transition in extrahepatic
cholangiocarcinoma. Br J Cancer. 105:1885–1893. 2011. View Article : Google Scholar : PubMed/NCBI
|
|
24
|
Li S and Jiao J: Effects of N-cadherin
expression on cell cycle, cell apoptosis and invasiveness and
metastasis of tongue squamous cell carcinoma cell line Tca8113
cells. Zhonghua Kou Qiang Yi Xue Za Zhi. 46:365–369. 2011.(In
Chinese). PubMed/NCBI
|
|
25
|
Hazan RB, Phillips GR, Qiao RF, Norton L
and Aaronson SA: Exogenous expression of N-cadherin in breast
cancer cells induces cell migration, invasion, and metastasis. J
Cell Biol. 148:779–790. 2000. View Article : Google Scholar : PubMed/NCBI
|
|
26
|
Valkenburg KC, Graveel CR, Zylstra-Diegel
CR, Zhong Z and Williams BO: Wnt/β-catenin signaling in normal and
cancer stem cells. Cancers (Basel). 3:2050–2079. 2011. View Article : Google Scholar : PubMed/NCBI
|
|
27
|
Chen K, Huang Y and Chen J: Understanding
and targeting cancer stem cells: Therapeutic implications and
challenges. Acta Pharmacol Sin. 34:732–740. 2013. View Article : Google Scholar : PubMed/NCBI
|
|
28
|
Lin QQ, Jin-Tian LI and Wang M: Role of
Wnt/β-catenin pathway in differentiation of nasopharyngeal
carcinoma. J Sun Yat-sen Univ (Med Sci). 4:384–387. 2005.(In
Chinese).
|
|
29
|
Wu S, Liu Z, Liu S, Lin L, Yang W and Xu
J: Enrichment and enumeration of circulating tumor cells by
efficient depletion of leukocyte fractions. Clin Chem Lab Med.
52:243–251. 2014. View Article : Google Scholar : PubMed/NCBI
|
|
30
|
Wu S, Liu S, Liu Z, Huang J, Pu X, Li J,
Yang D, Deng H, Yang N and Xu J: Classification of circulating
tumor cells by epithelial-mesenchymal transition markers. PLoS One.
10:e01239762015. View Article : Google Scholar : PubMed/NCBI
|
|
31
|
Tsongalis GJ: Branched DNA technology in
molecular diagnostics. Am J Clin Pathol. 126:448–453. 2006.
View Article : Google Scholar : PubMed/NCBI
|
|
32
|
Horn T, Chang CA and Urdea MS: Chemical
synthesis and characterization of branched
oligodeoxyribonucleotides (bDNA) for use as signal amplifiers in
nucleic acid quantification assays. Nucleic Acids Res.
25:4842–4849. 1997. View Article : Google Scholar : PubMed/NCBI
|
|
33
|
Chan AT: Nasopharyngeal carcinoma. Ann
Oncol. 21 (Suppl 7):vii308–vii312. 2010. View Article : Google Scholar : PubMed/NCBI
|
|
34
|
Wei KR, Xu Y, Liu J, Zhang WJ and Liang
ZH: Histopathological classification of nasopharyngeal carcinoma.
Asian Pac J Cancer Prev. 12:1141–1147. 2011.PubMed/NCBI
|
|
35
|
Hui EP, Ma BB, King AD, Mo F, Chan SL, Kam
MK, Loong HH, Ahuja AT, Zee BC and Chan AT: Hemorrhagic
complications in a phase ii study of sunitinib in patients of
nasopharyngeal carcinoma who has previously received high-dose
radiation. Ann Oncol. 22:1280–1287. 2011. View Article : Google Scholar : PubMed/NCBI
|
|
36
|
Luo WR, Wu AB, Fang WY, Li SY and Yao KT:
Nuclear expression of N-cadherin correlates with poor prognosis of
nasopharyngeal carcinoma. Histopathology. 61:237–246. 2012.
View Article : Google Scholar : PubMed/NCBI
|
|
37
|
Shi L, Wu YX, Yu JH, Chen X, Luo XJ and
Yin YR: Research of the relationship between β-catenin and
c-myc-mediated Wnt pathway and laterally spreading tumors
occurrence. Eur Rev Med Pharmacol Sci. 21:252–257. 2017.PubMed/NCBI
|
|
38
|
OuYang PY, Su Z, Ma XH, Mao YP, Liu MZ and
Xie FY: Comparison of TNM staging systems for nasopharyngeal
carcinoma, and proposal of a new staging system. Br J Cancer.
109:2987–2997. 2013. View Article : Google Scholar : PubMed/NCBI
|
|
39
|
Mehta S, Shelling A, Muthukaruppan A,
Lasham A, Blenkiron C, Laking G and Print C: Predictive and
prognostic molecular markers for cancer medicine. Ther Adv Med
Oncol. 2:125–148. 2010. View Article : Google Scholar : PubMed/NCBI
|
|
40
|
Micalizzi DS, Haber DA and Maheswaran S:
Cancer metastasis through the prism of epithelial-to-mesenchymal
transition in circulating tumor cells. Mol Oncol. 11:770–780. 2017.
View Article : Google Scholar : PubMed/NCBI
|
|
41
|
Alix-Panabieres C and Pantel K: The
circulating tumor cells: Liquid biopsy of cancer. Klin Lab Diagn.
60–64. 2014.(In Russian). PubMed/NCBI
|
|
42
|
Si Y, Lan G, Deng Z, Wang Y, Lu Y, Qin Y,
Huang B, Yang Y, Weng J, Han X, et al: Distribution and clinical
significance of circulating tumor cells in nasopharyngeal
carcinoma. Jpn J Clin Oncol. 46:622–630. 2016. View Article : Google Scholar : PubMed/NCBI
|
|
43
|
Chen X and Tang Q: The impact of
radiotherapy course length on the treatment results of
nasopharyngeal carcinoma (NPC). Chin J Cancer Res. 7:130–133. 1995.
View Article : Google Scholar
|
|
44
|
Ren JH, Dai XF, Yan GL, Jin M, Liu CW,
Yang KY, Wu G and Ma CM: Acute oral mucositis in nasopharyngeal
carcinoma patients treated with radiotherapy: association with
genetic polymorphism in DNA DSB repair genes. Int J Radiat Biol.
90:256–261. 2014. View Article : Google Scholar : PubMed/NCBI
|
|
45
|
Lengyel E, Baricza K, Somogyi A, Olajos J,
Pápai Z, Godény M, Németh G and Esik O: Reirradiation of locally
recurrent nasopharyngeal carcinoma. Strahlenther Onkol.
179:298–305. 2003. View Article : Google Scholar : PubMed/NCBI
|
|
46
|
Kong FF, Ying H, Du CR, Huang S, Zhou JJ
and Hu CS: Effectiveness and toxicities of intensity-modulated
radiation therapy for patients with T4 nasopharyngeal carcinoma.
PLoS One. 9:e913622014. View Article : Google Scholar : PubMed/NCBI
|
|
47
|
Paterlini-Brechot P and Benali NL:
Circulating tumor cells (CTC) detection: Clinical impact and future
directions. Cancer Lett. 253:180–204. 2007. View Article : Google Scholar : PubMed/NCBI
|
|
48
|
Hatta K, Nose A, Nagafuchi A and Takeichi
M: Cloning and expression of cDNA encoding a neural
calcium-dependent cell adhesion molecule: Its identity in the
cadherin gene family. J Cell Biol. 106:873–881. 1988. View Article : Google Scholar : PubMed/NCBI
|
|
49
|
Micalizzi DS, Farabaugh SM and Ford HL:
Epithelial-mesenchymal transition in cancer: Parallels between
normal development and tumor progression. J Mammary Gland Biol
Neoplasia. 15:117–134. 2010. View Article : Google Scholar : PubMed/NCBI
|
|
50
|
Iwatsuki M, Mimori K, Yokobori T, Ishi H,
Beppu T, Nakamori S, Baba H and Mori M: Epithelial-mesenchymal
transition in cancer development and its clinical significance.
Cancer Sci. 101:293–299. 2010. View Article : Google Scholar : PubMed/NCBI
|
|
51
|
Drocaş AI, Tomescu PI, Mitroi G, Drăgoescu
PO, Mărgăritescu C, Stepan AE, Şurlin V, CrăiŢoiu Ş, Drocaş I,
Ungureanu AM, et al: The cadherin switch assessment in the
epithelial-mesenchymal transition of urothelial bladder carcinomas.
Rom J Morphol Embryol. 57:1037–1044. 2016.PubMed/NCBI
|