Introduction
Kaposiform hemangioendothelioma (KHE) is a rare
vascular tumor type with a prevalence of 0.9/100,000 children
between 1991 and 2009 in the USA (1). It affects the head/neck region, the
extremities and the trunk, and even occurs in the retroperitoneal
or thoracic cavity, with invasion of the skin, subcutaneous fat and
muscle (2). KHE triggers pain and
causes deformity. Additionally, this local aggressive lesion may
cause platelet trapping, leading to profound thrombocytopenia, an
enlarged lesion and a consumptive coagulopathy with significant
hypofibrinogenemia, in a process termed Kasabach-Merritt phenomenon
(KMP) (3). While KHE is a benign
lesion type, KMP poses a significant threat to the life of affected
patients, and the mortality rate was as high as 12–30% between 1991
and 2009 due to various factors, including local invasion,
hemodynamic instability and compression of vital structures
(4,5). Therefore, it is necessary to develop
treatments for KHE.
Various studies have described that sirolimus, an
inhibitor of mTOR, is a treatment option for KHE (6–10).
However, sirolimus exhibits considerable inter- and
intra-individual variabilities in its pharmacokinetics (PK), with a
poor association between the drug dosage and blood concentrations,
which makes it difficult to specify an optimal dose (11,12).
Population pharmacokinetics (PPK) collects PK
information from sparse data on patients (13,14). PPK
analysis is able to distinguish inter-individual variability and
residual unexplained confounders (15). Therefore, PPK has a greater
statistical power for verifying the effect of multiple factors on
the PK of sirolimus compared with that of traditional PK analysis
(16), making it possible to define
an optimal dose schedule.
However, the sirolimus PPK model in Chinese patients
with pediatric KHE (PKHE), to the best of our knowledge, remains
undefined. The objective of the present study was to establish a
PPK model for sirolimus in a Chinese PKHE population, and to
identify factors that account for the PK variability, in order to
optimize individualized therapy.
Materials and methods
Patients and data collection
Data for a total of 17 Chinese patients with PKHE
(11 males and 6 females; age, 0.2–6 years; mean age, 1.21±1.2
years) who presented at the Children's Hospital of Fudan University
between January 2016 and April 2018, were retrospectively analyzed.
Data on the drug concentrations and relevant clinical information
were obtained from therapeutic drug monitoring (TDM) records and
medical records, respectively. The present study was approved by
the Research Ethics Committee of Children's Hospital of Fudan
University.
Information collected from the medical records
included sex, age, weight, duration of treatment with sirolimus
(DTT), daily dose of sirolimus (DDS), alanine transaminase (ALT),
aspartate transaminase (AST), creatinine (Cr), urea (UR),
hematocrit (HCT), hemoglobin (HGB), mean corpuscular hemoglobin
(MCH), mean corpuscular hemoglobin concentration (MCHC) and
concomitant treatment with other drugs (sulfamethoxazole,
methylprednisolone, digoxin, ursodeoxycholic, cimetidine,
omeprazole, fluconazole, cefoperazone/sulbactam and
voriconazole).
Drug administration
Sirolimus was administered orally on a continuous
dosing schedule at a starting dose of 0.8 mg/m2 (where
m2 represents body surface area) per dose twice daily
(10), and all of the blood
concentrations were collected prior to the next administration.
Peripheral blood was collected by the blood collection tube with
EDTA, which could be stored at 18–25°C for 24 h (according to the
instructions). The drug concentration was measured two times per
week or more frequently if required (e.g. in the case of suspicion
of intolerance or adverse events) using an automatic biochemical
analyzer (Viva-E; Siemens AG). The trough levels were maintained
between 10 and 15 ng/ml (10).
Analytical method
The blood concentration of sirolimus was measured
using an Emit 2000 Sirolimus Assay (Siemens Healthcare Diagnostics,
Inc.). Key assay performance parameters were as follows: Lower
limit of quantitation, 3.5 ng/ml; range of linear response, 3.5–30
ng/ml; values of inter-assay variability [coefficient of variation
(CV%)], <4.0%; and values of intra-assay CV (%), <6.2%.
PPK modeling
Data were analyzed using the non-linear
mixed-effects model (NONMEM) computer program (version VII; ICON
Development Solutions, LLC). The first-order conditional estimation
method with interaction option was used to estimate PK parameters
and their variability. A one-compartment model with first-order
absorption was applied to depict the absorption phase, since all
sirolimus concentrations in the present study were trough
concentrations. It was not possible to estimate the bioavailability
(F) and absorption rate constant with a lag time, since the
concentration data were insufficient. Therefore, the PK parameters
comprised apparent oral clearance (CL/F) and apparent volume of
distribution (V/F). The absorption rate constant Ka of
the model was fixed to 0.485 h−1 based on a previous
study (17).
Random-effect model
The inter-individual variability of the PK
parameters was explored using an exponential error model (17). The value of a parameter in an
individual (Pi) was a function of the parameter
value in the typical individual [TV(P)] and an individual
deviation represented by ηi. It was assumed that
ηi was symmetrically distributed in the
population, and the variance of zero-mean random variables was
estimated as part of the model estimation from equation 1:
Pi=TV(P)×exp(ηi)
Various statistical models (equations 2–4)
describing the random residual variability were considered:
Y=IPRED+ε
Y=IPRED×exp(ε)
Y=IPRED×exp(ε1)+ε2
where Y represents the observation, IPRED is
the individual predicted concentration and εn is
symmetrically distributed, for zero-mean random variables with
variance terms that are estimated as part of the population model
fitting process. Based on the minimum objective function value
(OFV), equation (3) was finally
selected to calculate the residual variability.
Covariate model
In order to explain the variability of PK
parameters, the associations among covariates and all the PK
parameters were investigated. The potential covariates included
sex, age, weight, DTT, DDS, ALT, AST, Cr, UR, HCT, HGB, MCH, MCHC
and concomitant medications. The covariate model was set up in a
stepwise manner (15). To compare
hierarchical models, a likelihood ratio test was adopted. The
change in OFV caused by the inclusion of a covariate is
proportional to twice the negative log likelihood of the data and
approximates a χ2 distribution. In the univariate
analysis, a decrease in the OFV by >3.84 (P<0.05; degrees of
freedom =1) was used as a criterion for inclusion of the covariate
in the base model (15). The
significant covariate-parameter associations were reserved in the
model. When a full regression model was built, the model was
further tested by dropping one covariate from each parameter at a
time to acquire the final model. An increase in the OFV by >6.64
(P<0.01; degrees of freedom =1) was used as the criterion for
retaining significant covariate-parameter associations in the model
(15).
Model evaluation
An internal evaluation method using bootstrap was
used to assess the stability and reliability of the final parameter
estimates (15). Bootstrap was
produced by repeated random sampling with replacement from the
original data. This procedure was performed with the software
package Wings for NONMEM (version VII; ICON Development Solutions,
LLC), and repeated 1,000 times with different random draws. The
medians and 2.5th-97.5th percentiles of the bootstrap results were
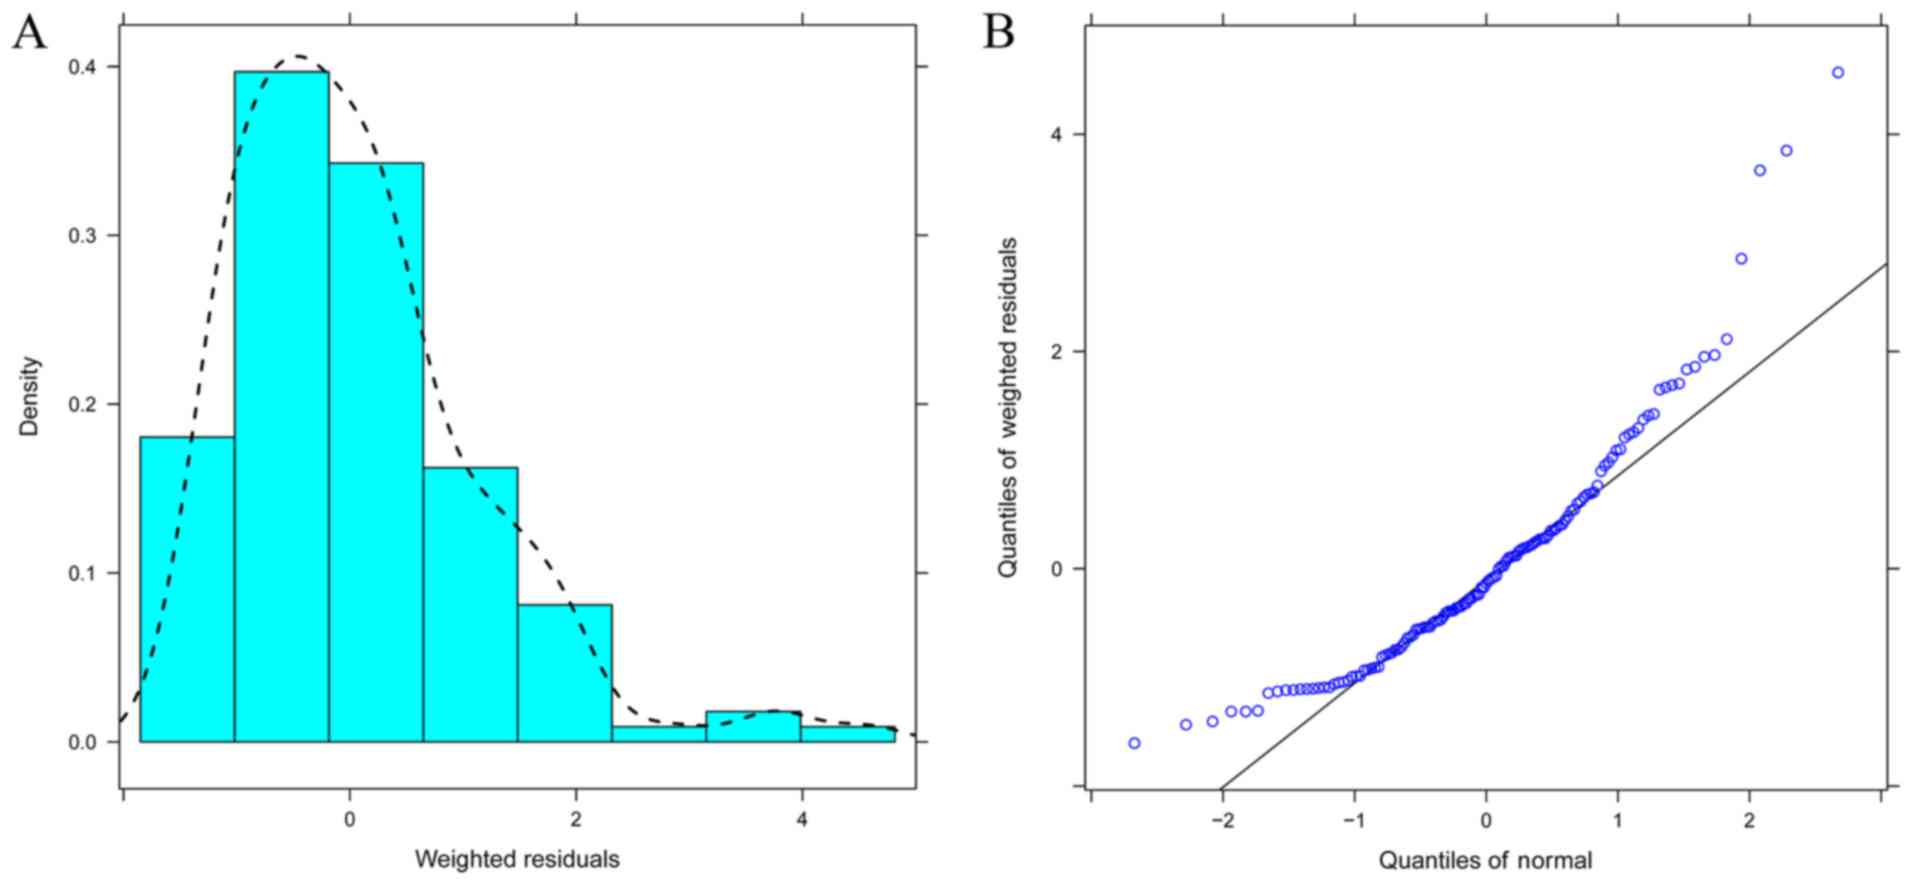
compared with the final PK parameter estimates (15). The goodness-of-fit plots were
generated by R (version 3.4.2, http://www.r-project.org). The distribution of
weighted residuals for the final model was assessed using
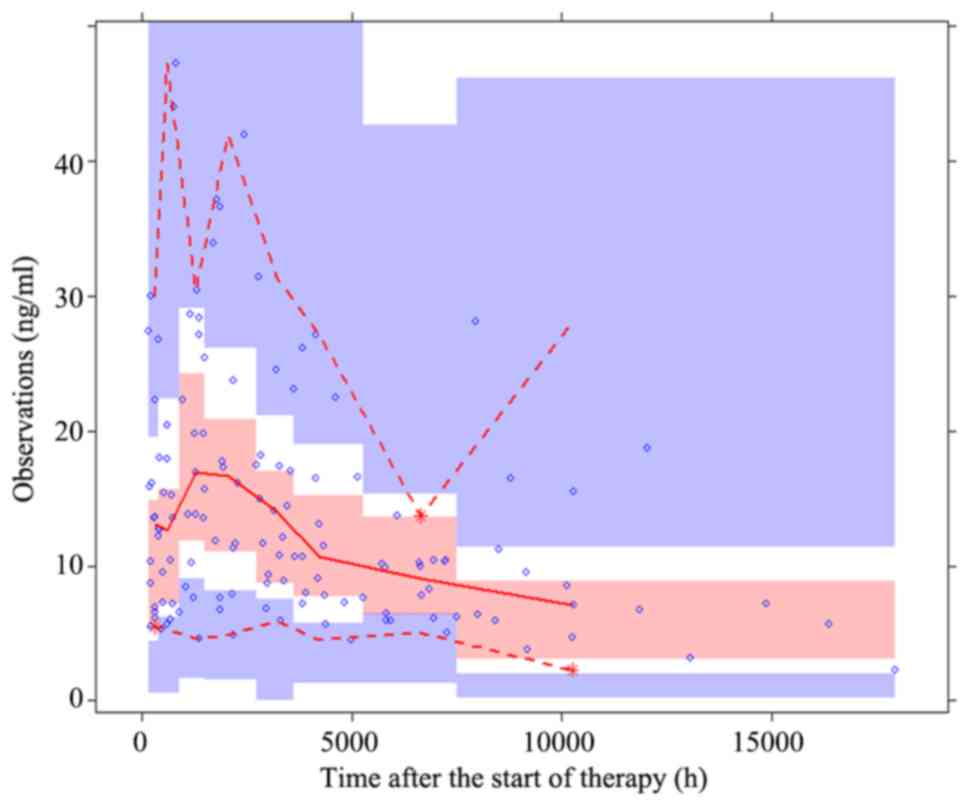
histograms and Q-Q plots. The predictive performance of the final
model was also assessed by a prediction-corrected visual predictive
check Xpose (18) package (version
4.6.1) and R (version 3.4.2)].
Results
Data collection
The data obtained from 17 Chinese pediatric patients
with KHE were included in the present analysis. A total of 133
blood concentration values were available for analysis. The patient
characteristics and drug combinations are summarized in Tables I and II.
 | Table I.Clinicopathological and demographic
data of patients. |
Table I.
Clinicopathological and demographic
data of patients.
| Characteristic | Mean ± SD | Median (range) |
|---|
| Gender
(male/female) | 11/6 | n/a |
| Age (years) | 1.21±1.2 | 0.8 (0.2–6) |
| Weight (kg) | 7.99±3.04 | 7 (3.6–18) |
| Duration of
treatment with sirolimus (days) | 154.2±149 | 117 (7–749) |
| Daily dose of
sirolimus (mg) | 0.63±0.36 | 0.5 (0.16–1.5) |
| Alanine
transaminase (IU/l) | 24.37±19.95 | 21 (2–120) |
| Aspartate
transaminase (IU/l) | 37.26±23.52 | 35 (12–165) |
| Creatinine
(µmol/l) | 18.68±3.76 | 18 (7–36) |
| Urea (mmol/l) | 3.23±3.74 | 2.7 (1–43) |
| Hematocrit (%) | 33.83±3.77 | 33.9
(22.7–43.9) |
| Hemoglobin
(g/l) | 110.33±13.64 | 110 (71.2–151) |
| Mean corpuscular
hemoglobin (pg) | 24.59±3.21 | 25.1 (16–30) |
| Mean corpuscular
hemoglobin concentration (g/l) | 324.45±17.91 | 327 (255–359) |
| Platelet count
(×109/l) | 230.19±124.99 | 248 (16–555) |
| Prothrombin time
(sec) | 12.84±1.11 | 12.7 (11–19.9) |
| Fibrin degradation
product (µg/ml) | 11.53±18.02 | 6.51
(1.28–96.25) |
| Table II.Drugs used in combination with with
sirolimus in the present study. |
Table II.
Drugs used in combination with with
sirolimus in the present study.
| Drug | Category | Number of
patients |
|---|
|
Sulfamethoxazole | 0 | 1 |
|
| 1 | 16 |
|
Methylprednisolone | 0 | 7 |
|
| 1 | 10 |
| Digoxin | 0 | 16 |
|
| 1 | 1 |
|
Ursodeoxycholic | 0 | 16 |
|
| 1 | 1 |
| Cimetidine | 0 | 16 |
|
| 1 | 1 |
| Omeprazole | 0 | 12 |
|
| 1 | 5 |
| Fluconazole | 0 | 16 |
|
| 1 | 1 |
|
Cefoperazone/sulbactam | 0 | 13 |
|
| 1 | 4 |
| Voriconazole | 0 | 16 |
|
| 1 | 1 |
Modeling
All covariates were evaluated and only the following
covariates exhibited a statistically significant effect on the PK
parameters: Age, ALT levels and sex. These were included as
significant covariates for CL/F, and duration of treatment with
sirolimus was included as a significant covariate for V/F. The
changes of the OFV are presented in Table III. The final covariate models were
as follows: CL/F = θCL/F × EXP (θAGE × age) ×
EXP (θALT × ALT) × EXP (θSEX × sex); V/F =
θV/F × EXP [θDTT × (DTT/10)]. Where EXP is
exponential function, θCL/F and θV/F are the
typical population values of CL/F and V/F, respectively.
θAGE, θALT, θSEX and
θDTT are the coefficients of the age, ALT, sex and
duration of treatment with sirolimus, respectively.
| Table III.Change of OFV of covariate
analysis. |
Table III.
Change of OFV of covariate
analysis.
| A, Inclusion |
|---|
| Model
description | OFV | Changed OFV | P-value |
|---|
| Base model | 632.127 | n/a | n/a |
| Influence of DTT on
V/F | 612.162 | −19.965 | <0.05 |
| Influence of age on
CL/F | 600.137 | −12.025 | <0.05 |
| Influence of ALT on
CL/F | 594.447 | −5.69 | <0.05 |
| Influence of sex on
CL/F | 577.809 | −16.638 | <0.05 |
|
| B,
Elimination |
|
| Model
description | OFV | Changed
OFV | P-value |
|
| Full model | 577.809 | n/a | n/a |
| Eliminate DTT on
V/F | 585.027 | 7.218 | <0.01 |
| Eliminate age on
CL/F | 591.406 | 13.597 | <0.01 |
| Eliminate ALT on
CL/F | 599.727 | 21.918 | <0.01 |
| Eliminate sex on
CL/F | 594.447 | 16.638 | <0.01 |
Model evaluation
The goodness-of-fit plots of the base model
(Fig. 1) were compared with those of
the final model (Fig. 2). Black
solid lines represent the line of unity and red smooth lines
represent the trend of the data. The closer the red smooth line is
to the black solid line, the more predictive the model is. The data
in Fig. 2 exhibited an improved
closeness degree compared with the data in Fig. 1, since Fig. 2 added covariates (age, ALT, sex and
DTT) based on Fig. 1, demonstrating
that the final model was better fitted to observed concentrations.
Parameter estimates obtained with the final model and the bootstrap
validation are presented in Table
IV. The median values of the parameter estimate obtained via
bootstrap validation were close to the respective values from the
final population model, which demonstrated that the estimates for
the PK parameters in the final population model were accurate, and
that the model was reliable. The distribution of weighted residuals
for the final model is presented in Fig.
3, which was approximately normally distributed. The
prediction-corrected visual predictive check plot for the final
model is presented in Fig. 4. The
majority of the observed concentrations were within the 95%
prediction intervals from the simulation data, indicating that the
final model had an improved predictability.
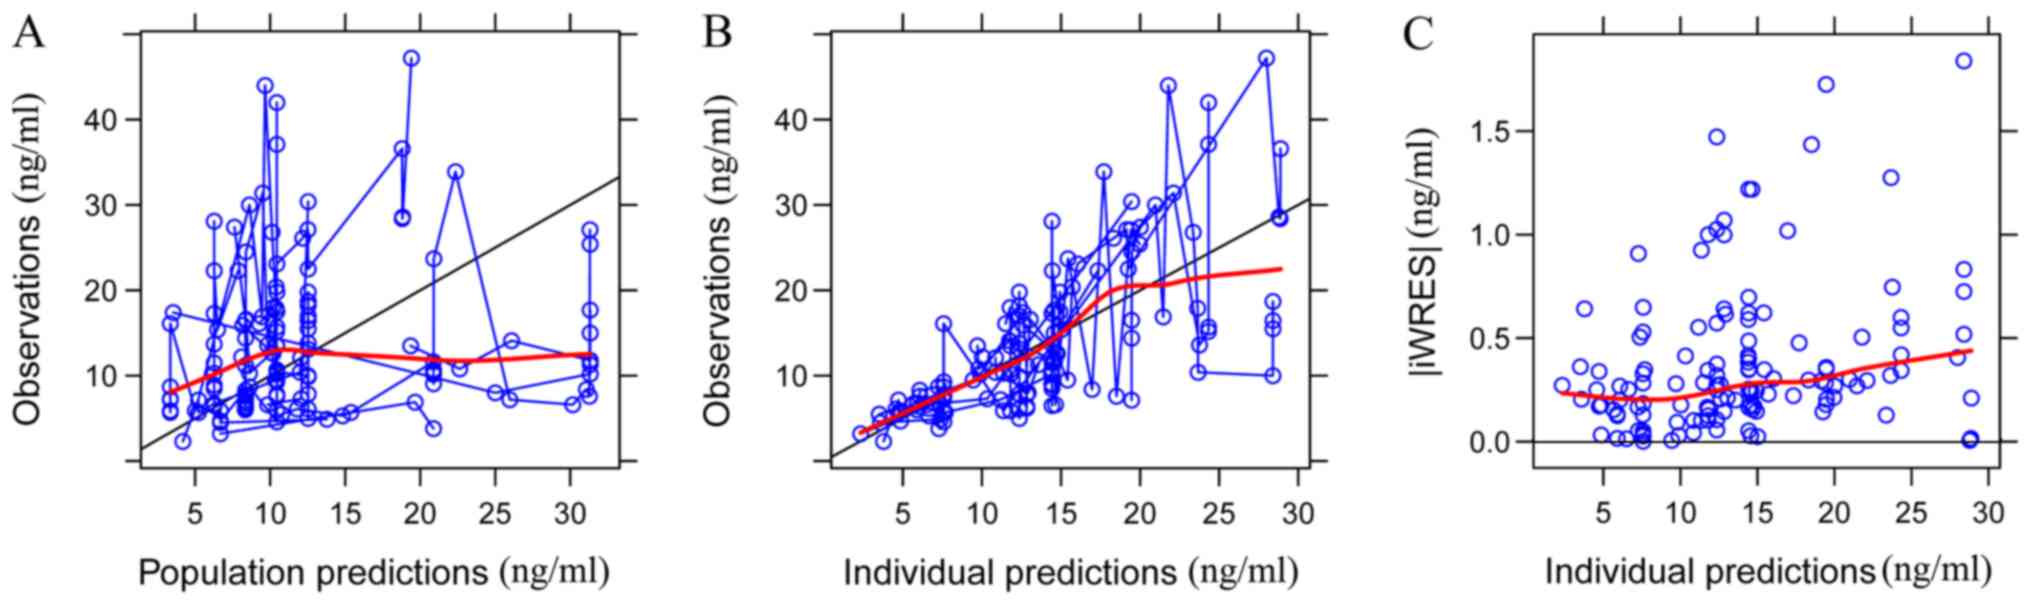 | Figure 1.Goodness-of-fit plots of the base
population model. (A) Observations vs. population predictions. The
x-axis value of a point is the population prediction of sirolimus
blood concentration and the y-axis value of a point is the
observation of sirolimus blood concentration. The closer the x- and
y-axis values of the same point are, namely, the closer the point
is to the y=x line, the closer the population prediction value
predicted by the model is to the observation of sirolimus blood
concentration. The black solid line is the line of unity (the y=x
line). The red smooth line represents the trend of the points.
Hence, the closer the red smooth line is to the black solid line,
the more predictive the model is. (B) Observations vs. individual
predictions. The x-axis value of a point is the individual
prediction of sirolimus blood concentration and the y-axis value of
a point is the observation of sirolimus blood concentration. The
closer the x- and y-axis values of the same point are, namely, the
closer the point is to the y=x line, the closer the individual
prediction value predicted by the model is to the observation of
sirolimus blood concentration. The black solid line is the line of
unity (the y=x line). The red smooth line represents the trend of
the points. Hence, the closer the red smooth line is to the black
solid line, the more predictive the model is. (C) |iWRES| vs.
individual predictions. iWRES is the difference in the values of
the individual prediction and the observation of sirolimus blood
concentration. The x-axis value of a point is the individual
prediction of sirolimus blood concentration and the y-axis value of
a point is the iWRES of the corresponding individual prediction.
The smaller the iWRES the better the model predictability. The red
smooth line represents the trend of the points. Hence, the closer
the red smooth line is to the black solid line (the y=0 line), the
more predictive the model is. iWRES, individual weighted
residuals. |
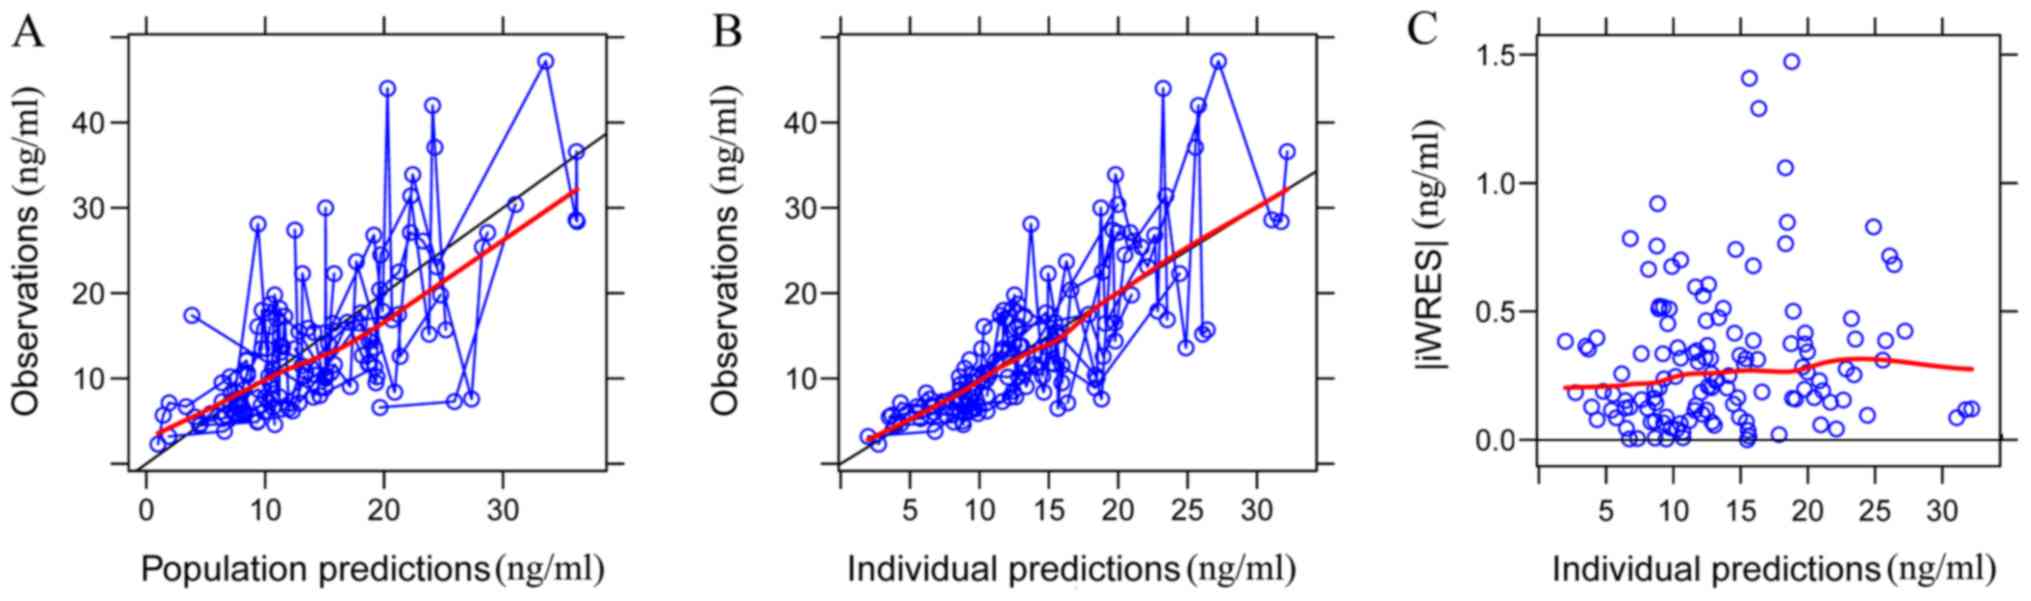 | Figure 2.Goodness-of-fit plots of the final
population model. (A) Observations vs. population predictions. The
x-axis value of a point is the population prediction of sirolimus
blood concentration and the y-axis value of a point is the observed
sirolimus blood concentration. The closer the x- and y-axis values
of the same point are, namely, the closer the point is to the y=x
line, the closer the population prediction value predicted by the
model is to the observed sirolimus blood concentration. The black
solid line is the line of unity (the y=x line). The red smooth line
represents the trend of the points. Therefore, the closer the red
smooth line is to the black solid line, the more predictive the
model is. (B) Observations vs. individual predictions. The x-axis
value of a point is the individual prediction of sirolimus blood
concentration and the y-axis value of a point is the observed
sirolimus blood concentration. The closer the x- and y-axis values
of the same point are, namely, the closer the point is to the y=x
line, the closer the individual prediction value predicted by the
model is to the observation of sirolimus blood concentration. The
black solid line is the line of unity (the y=x line). The red
smooth line represents the trend of the points. Hence, the closer
the red smooth line is to the black solid line, the more predictive
the model is. (C) |iWRES| vs. individual predictions. iWRES is the
difference in values between the individual prediction and the
observed sirolimus blood concentration. The x-axis value of a point
is the individual prediction of sirolimus blood concentration and
the y-axis value of a point is the iWRES of the corresponding
individual prediction. The smaller the iWRES value, the better the
model predictability. The red smooth line represents the trend of
the points. Therefore, the closer the red smooth line is to the
black solid line (the y=0 line), the more predictive the model is.
iWRES, individual weighted residuals. |
| Table IV.Parameter estimates of the final
model and bootstrap validation. |
Table IV.
Parameter estimates of the final
model and bootstrap validation.
|
|
|
| Bootstrap |
|
|---|
|
|
|
|
|
|
|---|
| Parameter | Estimate | SE (%) | Median | 95% CI | Bias (%) |
|---|
| CL/F (l/h) | 3.19 | 23.7 | 3.21 | [1.83, 5.46] | 0.63 |
| V/F (liters) | 165 | 26.9 | 159 | [56.12,
389.07] | −3.64 |
| Ka
(h−1) | 0.485 (fixed) | – | – | – | – |
|
θAGE | 0.215 | 21.7 | 0.21 | [0.09, 0.35] | −4.65 |
|
θALT | 0.0108 | 18 | 0.01 | [-0.01, 0.014] | 2.78 |
|
θSEX | −0.818 | 15.4 | −0.8 | [-1.08, −0.52] | −2.51 |
|
θDTT | 0.0783 | 7.8 | 0.08 | [0.02, 0.1] | 1.15 |
|
ωCL/F | 0.217 | 20.7 | 0.19 | [0.06, 0.26] | −13.13 |
|
ωV/F | 1.334 | 15.2 | 1.19 | [0.67, 1.86] | −11.02 |
| σ1 | 0.365 | 6.8 | 0.36 | [0.31, 0.4] | −1.78 |
Discussion
Sirolimus, an mTOR inhibitor, is expected to be
effective in conditions associated with disorders of the mTOR
growth control pathway (19).
Sirolimus has been widely used in transplantation patients for the
prevention of organ allograft rejection, and has been verified to
be an effective treatment for PKHE (6–10).
The present study provided the first PPK analysis of
sirolimus in Chinese patients with PKHE. Although the TDM data were
not originally designed to investigate the PK characteristics of
sirolimus, the population approach provides a powerful tool to
extract useful information from sparse sampling data (20). Therefore, the present study may help
to optimize the use of sirolimus by facilitating the achievement of
the desirable therapeutic concentration. In addition, the model of
the present study is ethically acceptable for studying pediatric
patients, since no excessive blood sampling is required, while a
larger amount of blood samples may have been required for
traditional PK studies (21). In
addition, the sirolimus PPK model in the present study has clinical
value in predicting the PK in individual patients with PKHE.
Previously, a developed sirolimus maturation model
(22,23) was used to simulate clearance
estimates using realistic age and weight covariates for age cohorts
aged 0–24 months. In addition, Mizuno et al (24) reported on model-based precision
dosing of sirolimus in pediatric patients with vascular anomalies.
The final model included a maturation function for sirolimus
clearance and allometrically scaled body weight to account for size
differences. However, their models were based on the precondition
that the patients had adequate liver and renal functions and did
not receive any cytochrome P450 family 3 subfamily A member 4
(CYP3A4) inhibitors or inducers. To explore the influence of
demographic features, biological characteristics and concomitant
medications on sirolimus CL/F in Chinese patients with PKHE, the
present PPK model was built. A one-compartment model with
first-order absorption was used to describe the absorption phase.
Age, ALT and sex influenced the CL/F, while the duration of
treatment with sirolimus influenced the V/F.
Sirolimus is mainly metabolized by the gut mucosa
and liver (25,26), and the liver is the major metabolism
organ of sirolimus, whose function can affect the drug clearance.
In the present study, ALT had an influence on the CL/F of
sirolimus, which was similar to the observation regarding the CL/F
of tacrolimus reported by Yang et al (27). In addition, growth and development
may be investigated using readily observable demographic factors,
including weight and age (28).
Weight of an individual was selected as a covariate, not body mass
index, since Emoto et al (22) and Mizuno et al (23) also selected the weight of an
individual as a covariate. Of note, referring to the present study,
weight and age exhibited co-linearity and were positively
associated. Furthermore, sex and weight also exhibited an
association. Numerous studies have demonstrated that the
association between drug clearance and body weight in pediatric
patients is non-linear and may be well described using allometric
scaling (29–31). Size is the primary covariate and may
be referenced to a 70-kg person by allometry using a coefficient of
0.75 for clearance (28). The
allometric scaling model was assessed in the present study. The
present study revealed that body weight is directly associated with
sirolimus clearance, and that age and sex are indirect markers.
However, the covariates age and sex in combination exhibited
smaller OFV and they were, therefore, used in combination in the
present study. The present study indicated that CL/F increased with
age, and that males had a higher CL/F than females of the same age.
This was expected, as infants/children gain weight as their age
increases, and males have a higher body weight than females. The
present results are essentially consistent with allometric scaling.
However, the combination of age and sex is more suitable for
modeling the trough concentration data obtained from traditional
TDM. Similarly, previous studies have also indicated that patient
sex (32) and age (33,34)
affect the CL/F of sirolimus. Furthermore, the duration of
treatment with sirolimus was significantly associated with the V/F
of sirolimus in the present study. One possible explanation is that
sirolimus widely distributes in the erythrocytes. As the health of
the patients with PKHE recovers, erythrocyte values increase after
treatment (Table SI), and this may
explain the present observation of the increased V/F with
increasing duration of treatment with sirolimus. In addition, the
17 patients with PKHE in the present study were co-treated with
various other drugs: Sulfamethoxazole, methylprednisolone, digoxin,
ursodeoxycholic, cimetidine, omeprazole, fluconazole,
cefoperazone/sulbactam and voriconazole. However, no significant
drug-drug interactions were identified in the analysis of the PK of
sirolimus.
There were several limitations in the present study.
First, since only the trough concentration data were available,
only a one-compartment model could be applied due to the lack of
sufficient informative data regarding drug absorption and
distribution. It was not possible to estimate F and the absorption
rate constant with a lag time. This is a common modeling method for
sparse data processing. In Jiao et al (17), Yang et al (27) and Wang et al (15), it was also not possible to estimate
F. Furthermore, Emoto et al (35) reported the impact of CYP3A5*3
polymorphism on sirolimus PK. However, currently, this
pharmacogenomic consideration for sirolimus has not been verified
in clinical studies. The present study was retrospectively
performed using real-world data, which means that genotyping was
not routinely performed in the population assessed in the present
study. Pharmacogenomic data was also not included in the sirolimus
PPK studies by Jiao et al (17) and Wang et al (36). Whether the inclusion of genotyping in
the PPK model may better account for the variabilities of sirolimus
in patients with PKHE should be investigated. In addition, the
limited sample size was due to low incidence, and other studies
have used similar group sizes (37).
Furthermore, information regarding how large the PKHE lesion was in
each patient with treatment time was an evaluation index of
pharmacodynamics. Population pharmacokinetics and pharmacodynamics
of sirolimus in pediatric patients with KHE will be further
established in the future.
In conclusion, the first PPK model of sirolimus in
Chinese patients with PKHE was established using retrospective data
from a real-world population obtained by routine monitoring. The
typical values of CL/F and V/F in the final model were 3.19 l/h and
165 liters, respectively. Age, ALT and sex were included as
significant covariates for CL/F, and the duration of treatment with
sirolimus was a significant covariate for V/F.
Supplementary Material
Supporting Data
Acknowledgements
Not applicable.
Funding
The present study was supported by the Clinical
Pharmacy Key Specialty Construction Project of Shanghai (grant no.
YZ2017/5), the Young Medical Talents of Wuxi (grant no. QNRC020),
the Young Project of Wuxi Health and Family Planning Research
(grant no. Q201706), the AOSAIKANG Pharmaceutical Foundation (grant
no. A201826) and the Wuxi Science and Technology Development
Guidance Plan (Medical and Health Care; grant no. CSZON1744).
Availability of data and materials
The datasets used and/or analyzed during the present
study are available from the corresponding author on reasonable
request.
Authors' contributions
ZL conceived and designed the study. DW and XC
collected the data and built the model. DW wrote the paper. XC
reviewed and edited the manuscript. All authors read and approved
the final manuscript.
Ethics approval and consent to
participate
The study was approved by the Research Ethics
Committee of Children's Hospital of Fudan University without the
need for written informed consent, since the data were
retrospectively collected without patient identifiers.
Patient consent for publication
Not applicable.
Competing interests
The authors declare that they have no competing
interests.
References
|
1
|
Reichel A, Hamm H, Wiegering V, Wiewrodt
B, Neubauer H, Ernestus K and Winkler B: Kaposiform
hemangioendothelioma with Kasabach-Merritt syndrome: Successful
treatment with sirolimus. J Dtsch Dermatol Ges. 15:329–331. 2017.
View Article : Google Scholar
|
|
2
|
DeFatta RJ, Verret DJ, Adelson RT, Gomez A
and Myers LL: Kaposiform hemangioendothelioma: Case report and
literature review. Laryngoscope. 115:1789–1792. 2005. View Article : Google Scholar : PubMed/NCBI
|
|
3
|
Yasui N, Koh K, Kato M, Park MJ, Tomizawa
D, Oshima K, Uchisaka N, Gocho Y, Arakawa A, Seki M, et al:
Kasabach-Merritt phenomenon: A report of 11 cases from a single
institution. J Pediatr Hematol Oncol. 35:554–558. 2013. View Article : Google Scholar : PubMed/NCBI
|
|
4
|
Croteau SE, Liang MG, Kozakewich HP,
Alomari AI, Fishman SJ, Mulliken JB and Trenor CC III: Kaposiform
hemangioendothelioma: Atypical features and risks of
Kasabach-Merritt phenomenon in 107 referrals. J Pediatr.
162:142–147. 2013. View Article : Google Scholar : PubMed/NCBI
|
|
5
|
Yadav D, Maheshwari A, Aneja S, Seth A and
Chandra J: Neonatal Kasabach-Merritt phenomenon. Indian J Med
Paediatr Oncol. 32:238–241. 2011. View Article : Google Scholar : PubMed/NCBI
|
|
6
|
Blatt J, Stavas J, Moats-Staats B, Woosley
J and Morrell DS: Treatment of childhood kaposiform
hemangioendothelioma with sirolimus. Pediatr Blood Cancer.
55:1396–1398. 2010. View Article : Google Scholar : PubMed/NCBI
|
|
7
|
Iacobas I, Simon ML, Amir T, Gribbin CE,
McPartland TG, Kaufman MR, Calderwood S and Nosher JL: Decreased
vascularization of retroperitoneal kaposiform hemangioendothelioma
induced by treatment with sirolimus explains relief of symptoms.
Clin Imaging. 39:529–532. 2015. View Article : Google Scholar : PubMed/NCBI
|
|
8
|
Jahnel J, Lackner H, Reiterer F,
Urlesberger B and Urban C: Kaposiform hemangioendothelioma with
Kasabach-Merritt phenomenon: From vincristine to sirolimus. Klin
Padiatr. 224:395–397. 2012. View Article : Google Scholar : PubMed/NCBI
|
|
9
|
Kai L, Wang Z, Yao W, Dong K and Xiao X:
Sirolimus, a promising treatment for refractory Kaposiform
hemangioendothelioma. J Cancer Res Clin Oncol. 140:471–476. 2014.
View Article : Google Scholar : PubMed/NCBI
|
|
10
|
Adams DM, Trenor CC III, Hammill AM, Vinks
AA, Patel MN, Chaudry G, Wentzel MS, Mobberley-Schuman PS, Campbell
LM, Brookbank C, et al: Efficacy and safety of sirolimus in the
treatment of complicated vascular anomalies. Pediatrics.
137:e201532572016. View Article : Google Scholar : PubMed/NCBI
|
|
11
|
Zimmerman JJ and Kahan BD:
Pharmacokinetics of sirolimus in stable renal transplant patients
after multiple oral dose administration. J Clin Pharmacol.
37:405–415. 1997. View Article : Google Scholar : PubMed/NCBI
|
|
12
|
MacDonald A, Scarola J, Burke JT and
Zimmerman JJ: Clinical pharmacokinetics and therapeutic drug
monitoring of sirolimus. Clin Ther. 22 (Suppl B):B101–B121. 2000.
View Article : Google Scholar : PubMed/NCBI
|
|
13
|
Chevillard L, Sabo N, Tod M, Labat L,
Chasport C, Chevaleyre C, Thibaut F, Barre J, Azuar J, Questel F,
et al: Population pharmacokinetics of oral baclofen at steady-state
in alcoholic-dependent adult patients. Fundam Clin Pharmacol.
32:239–248. 2018. View Article : Google Scholar : PubMed/NCBI
|
|
14
|
Marsot A, Michel F, Chasseloup E, Paut O,
Guilhaumou R and Blin O: Phenobarbital in intensive care unit
pediatric population: Predictive performances of population
pharmacokinetic model. Fundam Clin Pharmacol. 31:558–566. 2017.
View Article : Google Scholar : PubMed/NCBI
|
|
15
|
Wang DD, Lu JM, Li Q and Li ZP: Population
pharmacokinetics of tacrolimus in paediatric systemic lupus
erythematosus based on real-world study. J Clin Pharm Ther.
43:476–483. 2018. View Article : Google Scholar : PubMed/NCBI
|
|
16
|
Vadcharavivad S, Praisuwan S,
Techawathanawanna N, Treyaprasert W and Avihingsanon Y: Population
pharmacokinetics of tacrolimus in Thai kidney transplant patients:
Comparison with similar data from other populations. J Clin Pharm
Ther. 41:310–328. 2016. View Article : Google Scholar : PubMed/NCBI
|
|
17
|
Jiao Z, Shi XJ, Li ZD and Zhong MK:
Population pharmacokinetics of sirolimus in de novo Chinese adult
renal transplant patients. Br J Clin Pharmacol. 68:47–60. 2009.
View Article : Google Scholar : PubMed/NCBI
|
|
18
|
Jonsson EN and Karlsson MO: Xpose-an
S-PLUS based population pharmacokinetic/pharmacodynamic model
building aid for NONMEM. Comput Methods Programs Biomed. 58:51–64.
1999. View Article : Google Scholar : PubMed/NCBI
|
|
19
|
Fasolo A and Sessa C: Current and future
directions in mammalian target of rapamycin inhibitors development.
Expert Opin Investig Drugs. 20:381–394. 2011. View Article : Google Scholar : PubMed/NCBI
|
|
20
|
Thomson AH and Whiting B: Bayesian
parameter estimation and population pharmacokinetics. Clin
Pharmacokinet. 22:447–467. 1992. View Article : Google Scholar : PubMed/NCBI
|
|
21
|
Kauffman RE and Kearns GL: Pharmacokinetic
studies in paediatric patients. Clinical and ethical
considerations. Clin Pharmacokinet. 23:10–29. 1992. View Article : Google Scholar : PubMed/NCBI
|
|
22
|
Emoto C, Fukuda T, Mizuno T, Schniedewind
B, Christians U, Adams DM and Vinks AA: Characterizing the
developmental trajectory of sirolimus clearance in neonates and
infants. CPT Pharmacometrics Syst Pharmacol. 5:411–417. 2016.
View Article : Google Scholar : PubMed/NCBI
|
|
23
|
Mizuno T, Fukuda T, Emoto C,
Mobberley-Schuman PS, Hammill AM, Adams DM and Vinks AA:
Developmental pharmacokinetics of sirolimus: Implications for
precision dosing in neonates and infants with complicated vascular
anomalies. Pediatr Blood Cancer. 642017.doi: 10.1002/pbc.26470.
PubMed/NCBI
|
|
24
|
Mizuno T, Emoto C, Fukuda T, Hammill AM,
Adams DM and Vinks AA: Model-based precision dosing of sirolimus in
pediatric patients with vascular anomalies. Eur J Pharm Sci 109S.
S124–S131. 2017. View Article : Google Scholar
|
|
25
|
Lampen A, Zhang Y, Hackbarth I, Benet LZ,
Sewing KF and Christians U: Metabolism and transport of the
macrolide immunosuppressant sirolimus in the small intestine. J
Pharmacol Exp Ther. 285:1104–1112. 1998.PubMed/NCBI
|
|
26
|
Sattler M, Guengerich FP, Yun CH,
Christians U and Sewing KF: Cytochrome P-450 3A enzymes are
responsible for biotransformation of FK506 and rapamycin in man and
rat. Drug Metab Dispos. 20:753–761. 1992.PubMed/NCBI
|
|
27
|
Yang JW, Liao SS, Zhu LQ, Zhao Y, Zhang Y,
Sun XY, Rao W, Qu W, Li WZ and Sun LY: Population pharmacokinetic
analysis of tacrolimus early after Chinese pediatric liver
transplantation. Int J Clin Pharmacol Ther. 53:75–83. 2015.
View Article : Google Scholar : PubMed/NCBI
|
|
28
|
Anderson BJ and Holford NH:
Mechanism-based concepts of size and maturity in pharmacokinetics.
Annu Rev Pharmacol Toxicol. 48:303–332. 2008. View Article : Google Scholar : PubMed/NCBI
|
|
29
|
Wang DD, Chen X and Li ZP: Wuzhi capsule
and haemoglobin influence tacrolimus elimination in paediatric
kidney transplantation patients in a population pharmacokinetics
analysis: A retrospective study. J Clin Pharm Ther. Mar
12–2019.doi: 10.1111/jcpt.12828 (Epub ahead of print). View Article : Google Scholar
|
|
30
|
Wang D, Chen X, Xu H and Li Z: Population
pharmacokinetics and dosing regimen optimisation of tacrolimus in
Chinese pediatric hematopoietic stem cell transplantation patients.
Xenobiotica. 1–8. 2019.(Epub ahead of print). View Article : Google Scholar
|
|
31
|
Wang D, Chen X and Li Z: Cyclosporin
population pharmacokinetics in pediatric refractory nephrotic
syndrome based on real-world studies: Effects of body weight and
spirolactone administration. Exp Ther Med. 17:3015–3020.
2019.PubMed/NCBI
|
|
32
|
Zimmerman JJ: Exposure-response
relationships and drug interactions of sirolimus. AAPS J.
6:e282004. View Article : Google Scholar : PubMed/NCBI
|
|
33
|
Dansirikul C, Morris RG, Tett SE and
Duffull SB: A Bayesian approach for population pharmacokinetic
modelling of sirolimus. Br J Clin Pharmacol. 62:420–434. 2006.
View Article : Google Scholar : PubMed/NCBI
|
|
34
|
Tejani A, Alexander S, Ettenger R, Lerner
G, Zimmerman J, Kohaut E and Briscoe DM: Safety and
pharmacokinetics of ascending single doses of sirolimus (Rapamune,
rapamycin) in pediatric patients with stable chronic renal failure
undergoing dialysis. Pediatr Transplant. 8:151–160. 2004.
View Article : Google Scholar : PubMed/NCBI
|
|
35
|
Emoto C, Fukuda T, Venkatasubramanian R
and Vinks AA: The impact of CYP3A5*3 polymorphism on sirolimus
pharmacokinetics: Insights from predictions with a
physiologically-based pharmacokinetic model. Br J Clin Pharmacol.
80:1438–1446. 2015. View Article : Google Scholar : PubMed/NCBI
|
|
36
|
Wang M, Duan BL, Yuan YJ, Su X, Zheng H,
Wang FS and Sun H: Population pharmacokinetic characteristics of
sirolimus in healthy Chinese subjects and renal transplant
patients. Int J Clin Pharmacol Ther. 54:433–441. 2016. View Article : Google Scholar : PubMed/NCBI
|
|
37
|
Mizuno T, Fukuda T, Christians U,
Perentesis JP, Fouladi M and Vinks AA: Population pharmacokinetics
of temsirolimus and sirolimus in children with recurrent solid
tumours: A report from the Children's Oncology Group. Br J Clin
Pharmacol. 83:1097–1107. 2017. View Article : Google Scholar : PubMed/NCBI
|