Introduction
Leukemia is the most common childhood cancer. Mexico
has one of the highest incidences of childhood leukemia in the
world and has significantly higher mortality rates for this disease
than do other developed nations (1).
Moreover, acute lymphoblastic leukemia (ALL) is the most common;
the second most frequent type of leukemia in childhood is acute
myeloid leukemia (AML) (2,3).
Methotrexate (MTX) is currently one of the most
widely prescribed drugs for the treatment of ALL (4,5). MTX is
a folic acid antagonist, and its efficacy as an antineoplastic
treatment is largely attributed to its high affinity for blocking
the synthesis of purines and pyrimidines by inhibiting key enzymes
(6).
MTX is predominantly transported to the interior of
the cell by the reduced folate carrier (RFC/SLC19A1) (7); upon entry into the cell, MTX undergoes
polyglutamylation [active methotrexate polyglutamate (MTXPG)], and
2 to 6 glutamate residues are added by folylpolyglutamate
synthetase (FPGS) (7,8). The main targets of MTXPG are
dihydrofolate reductase (DHFR-also inhibited by MTX
monoglutamates), thymidylate synthase (TS),
5-aminoimidazole-4-carboxamide ribonucleotide transformylase (ATIC)
and several enzymes involved in de novo purine synthesis
(8). Alternatively, the
polyglutamation process competes with deconjugation that converts
MTXPG back into MTX by gamma-glutamyl hydrolase (GGH) (8), which increases the efflux of MTX by the
efflux transporters of the ATP-binding cassette (ABC) superfamily,
including ABCC1 and ABCG2 (7,9,10).
Alterations in the transport and metabolism of MTX
result in a decrease in its cellular accumulation, and this
decrease has been associated with resistance to MTX and compromises
its healing effect. MTX resistance has been attributed to
downregulation of the RFC gene as well as increased levels of DHFR
and TS enzymes (7,9,11,12).
However, there are a limited number of studies on the function of
the expression levels of genes involved in the transport and
metabolism of MTX in patients with childhood acute leukemia (AL).
In this study, we analyzed the mRNA expression levels of genes
involved in the transport and metabolism of MTX [reduced folate
carrier (RFC1), ATP-binding cassette subfamily C member 1
(ABCC1), ATP-binding cassette subfamily B member 1
(ABCB1), gamma-glutamyl hydrolase (GGH),
folylpolyglutamate synthetase (FPGS),
5-aminoimidazole-4-carboxamide ribonucleotide transformylase
(ATIC), thymidylate synthase (TS),
methylenetetrahydrofolate reductase (MTHFR), methionine
transferase reductase (MTRR), methionine synthase
(MS) and methylenetetrahydrofolate dehydrogenase
(MTHFD1)] in patients with AL; additionally, weanalyzed
whether the expression levels of these mRNAs could be used as
prognostic markers in AL.
Materials and methods
Study population
A case-control study was carried out in the
Laboratory of Molecular Biomedicine, School of Chemical Biological
Sciences, Autonomous University of Guerrero (Chilpancingo,
Guerrero, México). Cases included 70 patients diagnosed with AL
[ALL: 50 and AML:19] who attended the Pediatric Oncology Service of
the State Cancer Institute ‘Dr. Arturo Beltran Ortega’ in the city
of Acapulco, Guerrero, Mexico, between August 2005 and August 2011.
Diagnoses were obtained through bone marrow aspirate based on the
combination of clinical features, French-American-British
morphological criteria, cytochemical staining properties, molecular
genetic features and immunophenotyping of blast cells, and patients
were treated with the multiagent chemotherapeutic protocols used in
the Cancer Institute from Guerrero State and previously reported by
Gómez-Gómez et al (13) and
Organista-Nava J et al (14).
Controls included 66 healthy individuals (4–10×103
leukocytes/mm3) without a family history of leukemia. In
the present study, subjects in both groups, including both genders,
were 1–18 years of age and were residents of the State of Guerrero,
Mexico. Informed consent was obtained from all individuals or their
guardians after a detailed briefing of the study aims. The present
study and informed consent procedure were approved by the
Institutional Review Board of the Cancer Institute of the State of
Guerrero, Mexico. Overall survival (OS) and risk classification
were defined according to previous reports (13,14).
Briefly, OS time was determined as the time between the day of
registration into the study and the day of mortality (from any
cause) or the day of last known contact. Relapse or lack of
response was defined as recurrence of lymphoblasts of >20% blast
cells in the marrow or localized leukemic infiltrates at any site
(15). Patients with AL were
classified into one of the following two groups: Low-risk, aged
between 1 and 10 years with <50,000 leucocytes/mm3 at
diagnosis; and High-risk, aged <1 and >10 years with
>50,000 leucocytes/mm3 at diagnosis (13).
Specimen collection and total RNA
extraction
Bone marrow and/or blood samples were taken from the
135 participants and placed in tubes with an anticoagulant (EDTA).
Leukocytes were purified by selective osmotic lysis. Briefly, 1 ml
of whole blood or 250 l of bone marrow was added to 4 ml of Red
Blood Cell (RBC) Lysis Solution (155 mM ammonium chloride, 10 mM
potassium bicarbonate, 0.1 mM EDTA, pH 7.4). The sample was mixed
and incubated for 15 min on ice and was mixed every 5 min by
pipetting; the samples were then centrifuged for 10 min at 2,000
rpm to 4°C to remove the RBC lysis buffer. Total RNA from
leukocytes was extracted according to Chomczynski and Sacchi
(16).
cDNA synthesis
Total RNA (500 ng) was reverse transcribed into cDNA
by priming with oligo (dT). cDNA synthesis was performed by a
SuperScript II First-Strand Synthesis System (Thermo Fisher
Scientific, Inc., Waltham, MA, USA) for RT-PCR according to the
manufacturer's instructions. The temperature cycles were as
follows: 65°C for 10 min, 22°C for 10 min, 42°C for 90 min and 75°C
for 5 min. cDNA was stored at −20°C.
Quantification of gene expression by
real-time quantitative PCR
Quantitative real-time PCR was performed using SYBR
Green (Thermo Fisher Scientific, Inc.) and the protocol provided by
the manufacturer. All reactions for the GGH, FPGS, ABCC1, ABCB1,
ATIC, TS, MTRR, MS, RFC1, MTHFD1 and MTHFR genes were
performed in a CFX95 Real-Time System (BIO RAD, Foster City, CΑ,
USA).
The 25 µl reaction volume consisted of 12.5 µl of
SYBR Green Master Mix (SYBR Green PCR reagent kit; Applied
Biosystems, Foster City, CA, USA) containing Taq DNA polymerase,
reaction buffer, dNTP mix, 1 mM MgCl2 (final
concentration), and SYBR Green I dye, as well as 10 mM of each
primer, 500 ng of the template and ultrapure water. All primer
sequences and product sizes are described in Table I. PCRs were processed through 40
cycles of a 3-step PCR, including 15 sec of denaturation at 95°C, a
60-sec primer-dependent annealing phase [60 or 61°C, and according
to previous reports (17–27), Table
I], and 60 sec of template-dependent elongation at 72°C.
 | Table I.PCR primers sequence used in this
work. |
Table I.
PCR primers sequence used in this
work.
| Gene symbol | Forward primer (5′
to 3′) | Reverse primer (5′
to 3′) | Amplicon size
(bp) | Author (Refs.) |
|---|
| RFC1 |
CCTCGTGTGCTACCTTTGCTT |
TGATCTCGTTCGTGACCTGCT | 125 | Abdel-Haleem et
al, (17) |
| GGH |
AACCTCTGACTGCCAATTTCCATAA |
TCTCTGGATGCCACTGGACAC | 177 | Obata et al,
(18) |
| FPGS |
GGCTGGAGGAGACCAAGGATGGA |
CATGAGTGTCAGGAAGC | 68 | Ogawa et al,
(19) |
| TS |
GCAAAGAGTGATTGACACCATCAA |
CAGAGGAAGATCTCTTGGATTCCAA | 85 | Seitz et al,
(20) |
| ATIC |
TCTGATGCCTTCTTCCCTTT |
AGGTTCGTATGAGCGAGGAT | 149 | Malek et al,
(21) |
| MTHFR |
GGCCATCTGCACAAAGCTAAG |
AACTCACTTCGGATGTGCTTCAC | 140 | Liu et al,
(22) |
| MTHFD1 |
CGTGGGCAGCGGACTAA |
CCTTATTTGCGCGGAGATCT | 76 | Kawakami et
al, (23) |
| MTRR |
GCCCGGCATTTCTATGACAC |
GCCAGAGTCCAGCAATCCAC | 85 | Zhao et al,
(24) |
| MS |
TAAGATTTGCAAAGGTTGGGTCTGA |
CTGGACATACAGGTGGGAGTTGG | 172 | Huang et al,
(25) |
| ABCB1 |
GCTCAGACAGGATGTGAGTTGG |
ATAGCCCCTTTAACTTGAGCAGC | 99 | Yoshida et
al, (26) |
| ABCC1 |
TACCTCCTGTGGCTGAATCTGG |
CCGATTGTCTTTGCTCTTCATG | 138 | Yoshida et
al, (26) |
| HPRT |
AAGCTTGCTGGTGAAAAGG |
AAACATGATTCAAATCCCTGA | 134 | Ramos-Nino et
al, (27) |
The expression levels of mRNAs were determined from
the threshold cycle (Ct), and the relative expression levels were
calculated using the 2−∆∆Ct method (28). For mRNA quantification, Ct values
were normalized to the expression level of hypoxanthine-guanine
phosphoribosyltransferase (HPRT) mRNA.
Detection of translocations
The detection of BCR-ABL, ETV6 RUNX1, AML1-ETO and
CBFΒ-MYH11 translocations was realized according to the report by
Organista-Nava et al (14).
Statistical analysis
Continuous data are presented as the means ±
standard deviations (SDs) or the medians and 25 and 75th
interquartiles. Categorical data were compared by Chi-square or
Fisher's exact tests. The Mann-Whitney test was used for comparison
of the differences in mRNA expression levels between the groups.
P-values less than 0.05 were considered statistically significant.
Statistical analyses of all data were performed using SPSS
software, v.20.0 (SPSS, Inc., Chicago, IL, USA) and GraphPad Prism
software (v.5.0; GraphPad Software, Inc., La Jolla, CA, USA).
Results
Population characteristics
From August 2005 to August 2011, 69 patients with AL
were included in this study; the mean age was 7.8±4.8 (mean ± SD)
years, and the median leukocyte count at diagnosis was 15,000
leukocytes/mm3. At the time of analysis, 51 patients
(73.9%) had died, and only 18 patients remained alive (26.1%).
Healthy individuals had a mean age of 9.6±5.2 years and a normal
leukocyte count (4–10×103 leukocytes/mm3;
median 8,000 leukocytes/mm3). The characteristics of all
participants are outlined in Table
II. Of the 69 cases with AL examined by immunophenotype, the B
lineage was the most frequent (66.7%), followed by the myeloid
lineage (27.5%; Table II).
| Table II.General characteristics and clinicals
of the individuals. |
Table II.
General characteristics and clinicals
of the individuals.
| Variables | AL 69 (100) | Controls 66
(100) | P-value |
|---|
| Age (years, mean ±
SD) | 7.8±4.8 | 9.6±5.2 | 0.019 |
| No. of
leukocytes/mm3 at diagnosis | 15,000
(5,300–53,550) | 8,000
(7,000–10,000) | 0.005 |
| Sex |
|
|
|
|
Female | 27 (39.1) | 27 (40.9) | 0.727 |
|
Male | 42 (60.87) | 39 (59.1) |
|
| Status of
individuals |
|
|
|
|
Alive | 18 (26.1) | 66 (100) |
|
|
Deceased | 51 (73.9) | – |
|
| Type of acute
leukemia |
|
|
|
|
Lymphoblastic | 50 (72.5) | – |
|
|
Myeloblastic | 19 (27.5) | – |
|
| Risk by age and
leukocytes at diagnosis |
|
|
|
|
Low-risk | 27 (39.1) | – |
|
|
High-risk | 42 (60.9) | – |
|
| Relapse |
|
|
|
| No | 18 (26.1) | – |
|
|
Yes | 51 (73.9) | – |
|
|
Inmunophenotype |
|
|
|
|
B-lineage | 46 (66.7) | – |
|
|
T-lineage | 1 (1.5) | – |
|
|
B/T-lineage | 3 (4.3) | – |
|
|
Myeloid-lineage | 19 (27.5) | – |
|
| Chromosomal
translocation |
|
|
|
| BCR-ABL
[t(9;22)] | 2 (2.9) | – |
|
|
ETV6-RUNX1 [t(12;21)] | 1 (1.5) |
|
|
|
AML1-ETO [t(8;21)] | 2 (2.9) |
|
|
|
None | 57 (82.6) | – |
|
| Not
determined | 7 (10.1) | – |
|
Gene expression
Using RT-qPCR assays, we examined the expression of
levels genes involved in the transport and metabolism of MTX
(RFC1, ABCC1, ABCB1, ABCC2, ABCG2, GGH, FPGS, ATIC, TS, MTHFR,
MTRR, MS and MTHFD1) in patients with AL and healthy
individuals. The expression levels of RFC1 (median: 0.53,
P<0.001; Fig. 1A and Table III), MTHFR (median: 0.33,
P<0.001; Fig. 1F and Table III), MTRR (median: 0.46,
P<0.001; Fig. 1H and Table III), MS (median: 0.60, P=0.040;
Fig. 1I and Table III) and ABCB1 (median: 0.27,
P<0.001; Fig. 1J and Table III) in patients with AL were
significantly lower than in healthy individuals. GGH (median: 1.26,
P=0.009, Fig. 1B and Table III), FPGS (median: 1.74, P=0.02;
Fig. 1C and Table III), TS (median: 4.75, P<0.001;
Fig. 1D and Table III) and MTHFD1 (median: 1.51,
P=0.007; Fig. 1G and Table III) were highly expressed in the AL
group. As shown in Fig. 1 and
Table III, we did not observe
changes in ATIC (P=0.951; Fig. 1E
and Table III) and ABCC1 (P=0.151;
Fig. 1K and Table III) expression levels between
patients with AL and healthy individuals.
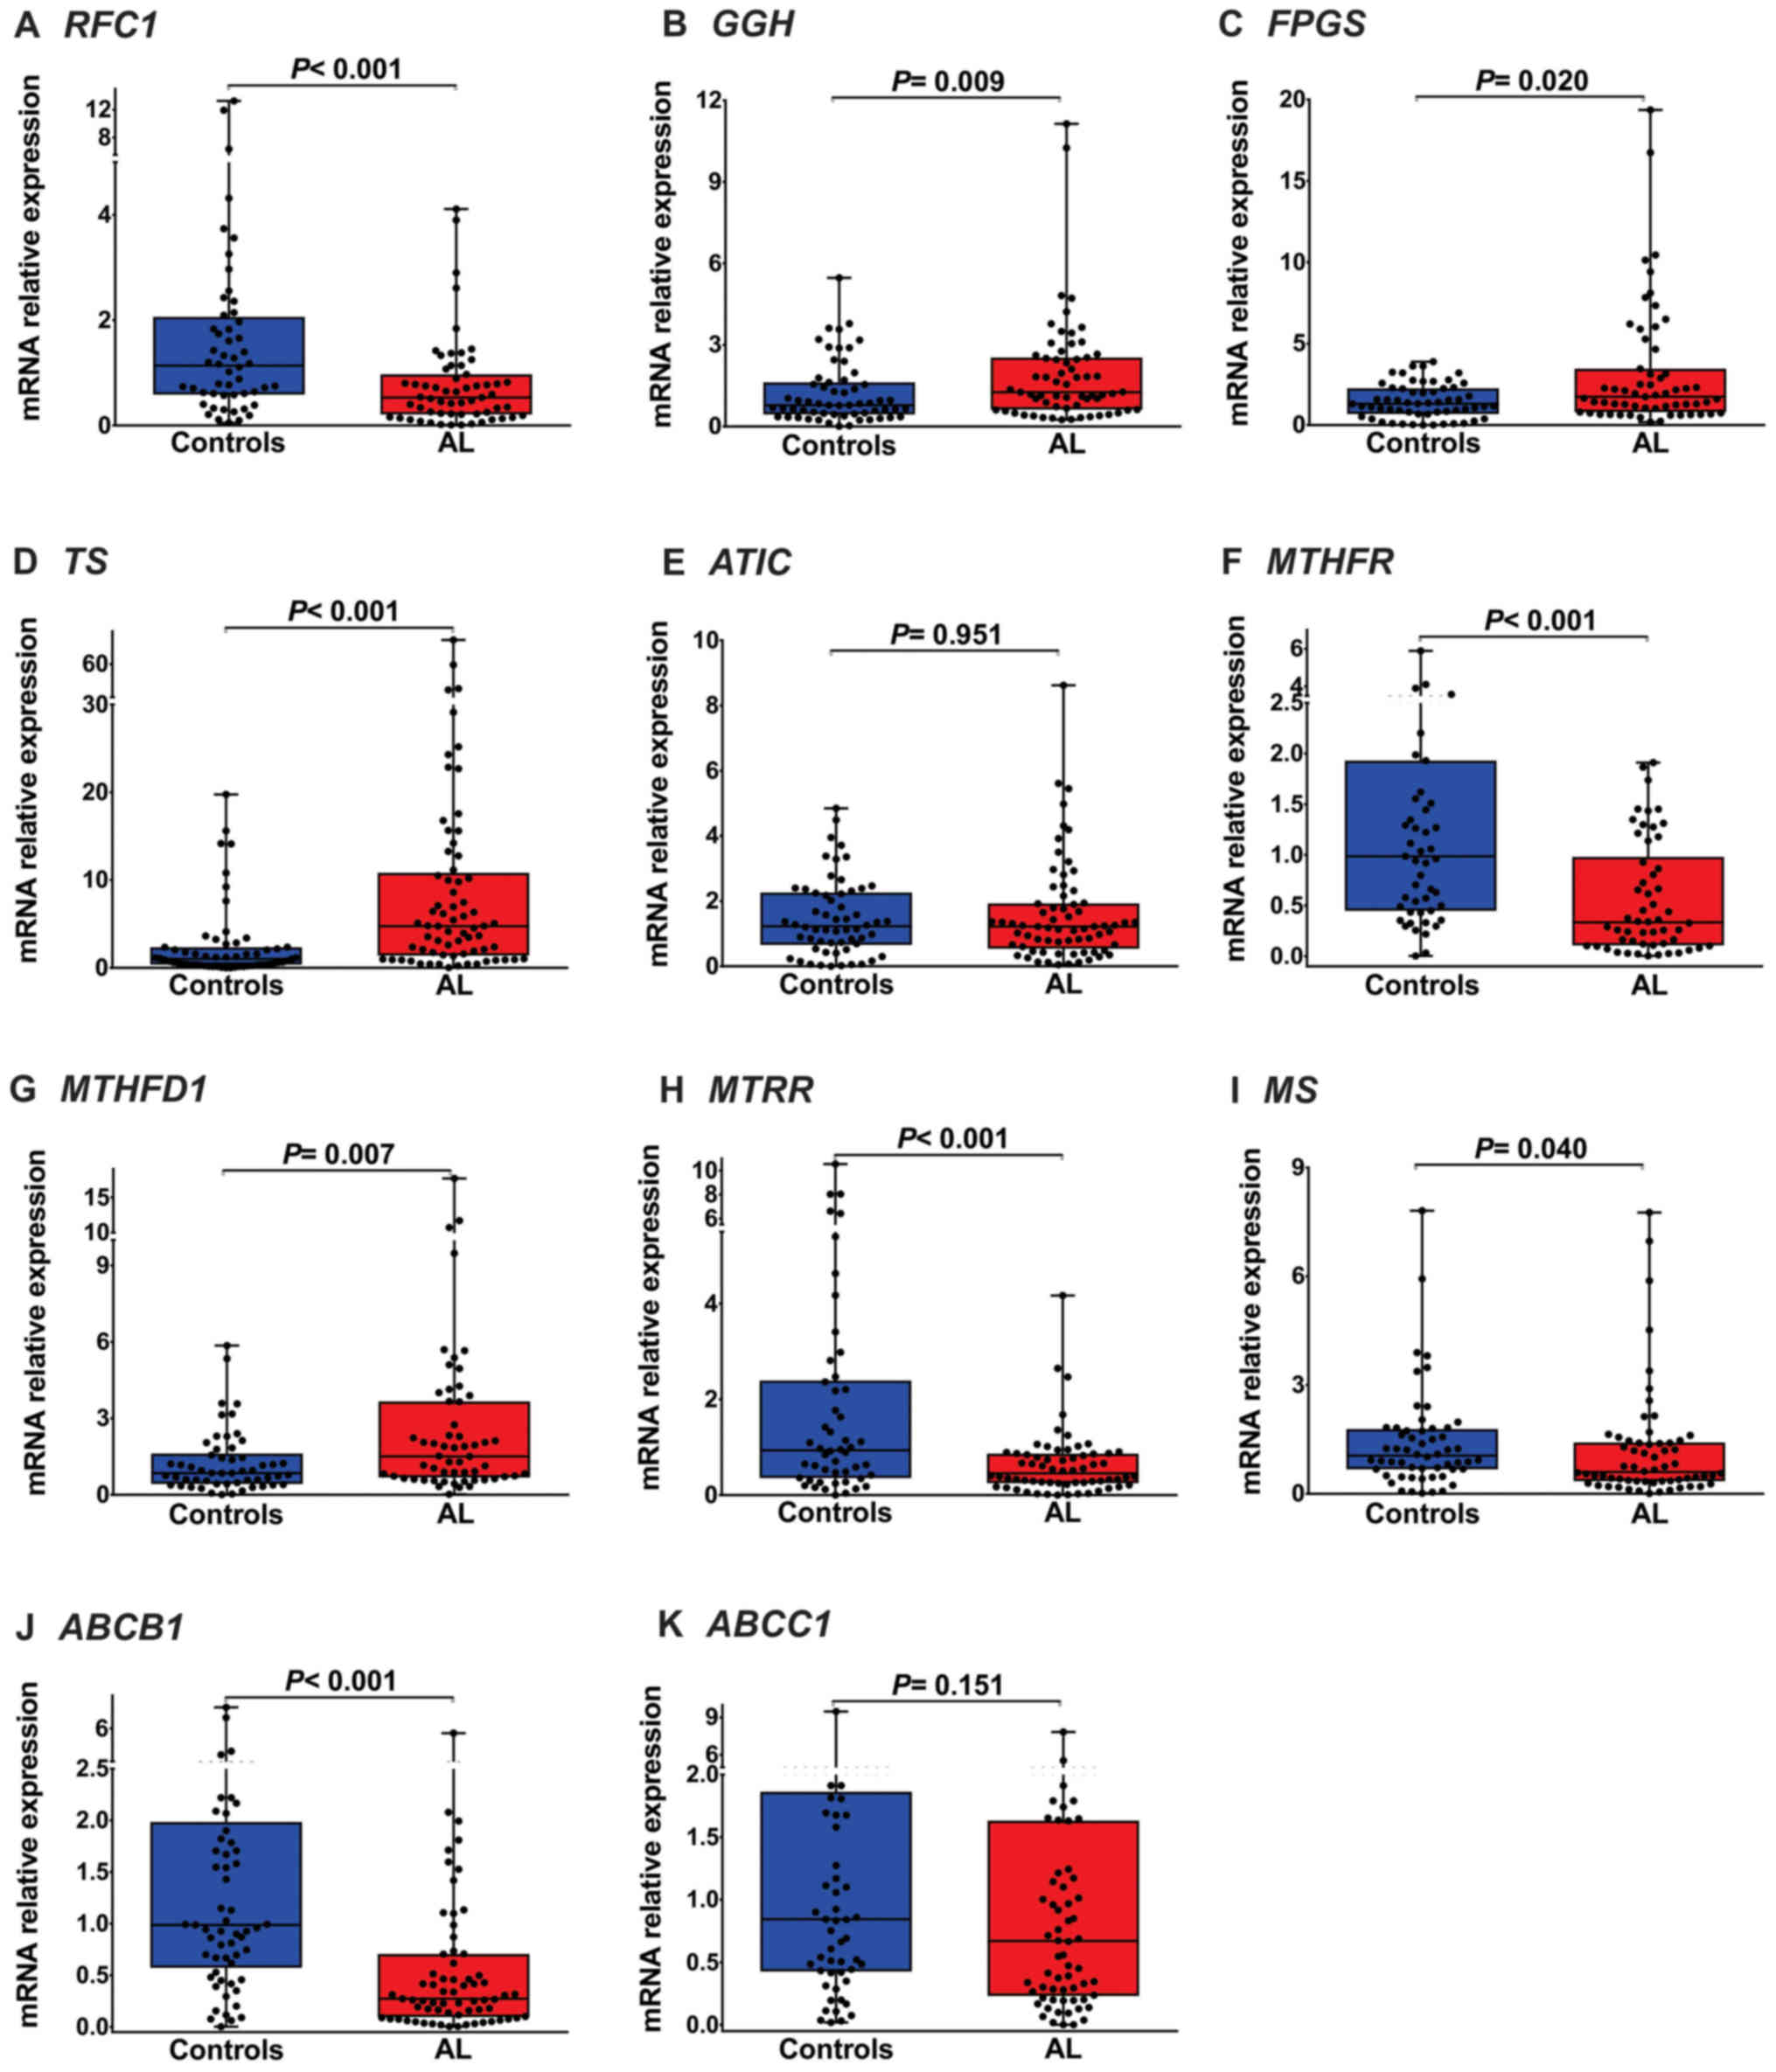 | Figure 1.Folate pathway gene expression in
childhood AL. (A) RFC1 mRNA expression was significantly lower in
patients with AL than in healthy individuals [median (25–75
percentiles), 0.53 (0.21–0.97); P<0.001]. (B) GGH mRNA
expression was significantly increased in patients with AL [1.26
(0.62–2.54); P=0.0009]. (C) FPGS expression in patients with AL was
significantly higher than that in healthy individuals [1.74
(0.80–3.46); P=0.020]. (D) TS mRNA expression was significantly
increased in patients with AL [4.75 (1.40–10.83); P<0.001]. (E)
ATIC mRNA levels were not significantly different between patients
with AL and healthy individuals [1.22 (0.54–1.93); P=0.951]. (F)
MTHFR mRNA expression was significantly lower in patients with AL
than in healthy individuals [0.33 (0.11–0.98); P<0.001]. (G)
MTHFD1 mRNA expression was significantly increased in patients with
AL [1.51 (0.68–3.66); P=0.007]. (H, I and J) MTRR, MS and ABCB1
mRNA levels were significantly diminished in patients with AL [0.46
(0.25–0.87); P<0.001, 0.60 (0.35–1.41); P=0.040 and 0.27
(0.09–0.71); P<0.001, respectively]. (K) ABCC1 mRNA expression
was not significantly different between patients with AL and
healthy individuals [0.67 (0.23–1.63); P=0.151]. RFC1, reduced
folate carrier; GGH, γ-glutamyl hydrolase; FPGS, folylpolyglutamate
synthetase; TS, thymidylate synthase; ATIC,
5-aminoimidazole-4-carboxamide ribonucleotide formyltransferase;
MTHFR, methylenetetrahydrofolate reductase; MTHFD1,
methylenetetrahydrofolate dehydrogenase 1; MTRR,
5-methyltetrahydrofolate-homocysteine methyltransferase reductase;
MS, methionine synthase; ABCB1, ATP binding cassette subfamily B
member 1; ABCC1, ATP binding cassette subfamily C member 1; AL,
acute leukemia. |
| Table III.Folate pathway gene expression in
childhood AL and healthy individuals. |
Table III.
Folate pathway gene expression in
childhood AL and healthy individuals.
|
|
| Median | 25-75%
Percentiles |
P-valueφ | Mean | Sth. deviation | Sth. error of
mean | 95% CI of mean |
|---|
| RFC1 | Controls | 1.14 | 0.58–2.06 |
<0.001a | 1.81 | 2.50 | 0.35 | 1.12–2.51 |
|
| AL | 0.53 | 0.21–0.97 |
| 0.76 | 0.85 | 0.11 | 0.54–0.98 |
| GGH | Controls | 0.78 | 0.44–1.62 | 0.009a | 1.23 | 1.15 | 0.15 | 0.93–1.53 |
|
| AL | 1.26 | 0.62–2.54 |
| 1.93 | 1.99 | 0.25 | 1.43–2.43 |
| FPGS | Controls | 1.31 | 0.68–2.26 | 0.020a | 1.46 | 1.06 | 0.14 | 1.18–1.74 |
|
| AL | 1.74 | 0.80–3.46 |
| 3.21 | 3.84 | 0.50 | 2.21–4.21 |
| TS | Controls | 1.02 | 0.37–2.34 |
<0.001a | 2.52 | 4.23 | 0.55 | 1.42–3.62 |
|
| AL | 4.75 | 1.40–10–83 |
| 9.42 | 13.83 | 1.66 | 6.10–12.74 |
| ATIC | Controls | 1.23 | 0.65–2.26 | 0.951 | 1.45 | 1.18 | 0.15 | 1.18–1.80 |
|
| AL | 1.22 | 0.54–1.93 |
| 1.60 | 1.56 | 0.19 | 1.23–1.98 |
| MTHFR | Controls | 0.99 | 0.45–1.93 |
<0.001a | 1.37 | 1.24 | 0.17 | 1.02–1.72 |
|
| AL | 0.33 | 0.11–0.98 |
| 0.56 | 0.56 | 0.08 | 0.41–0.71 |
| MTHFD1 | Controls | 0.85 | 0.43–1.62 | 0.007a | 1.27 | 1.23 | 0.17 | 0.93–1.61 |
|
| AL | 1.51 | 0.68–3.66 |
| 2.60 | 3.22 | 0.43 | 1.75–3.46 |
| MTRR | Controls | 0.94 | 0.36–2.39 |
<0.001a | 1.90 | 2.41 | 0.34 | 1.22–2.59 |
|
| AL | 0.46 | 0.25–0.87 |
| 0.64 | 0.68 | 0.09 | 0.47–0.81 |
| MS | Controls | 1.05 | 0.68–1.79 | 0.040a | 1.42 | 1.40 | 0.19 | 1.05–1.80 |
|
| AL | 0.60 | 0.35–1.41 |
| 1.20 | 1.56 | 0.20 | 0.81–1.60 |
| ABCB1 | Controls | 0.99 | 0.57–1.98 | <0.001a | 1.53 | 1.50 | 0.19 | 1.14–1.91 |
|
| AL | 0.27 | 0.09–0.71 |
| 0.62 | 0.93 | 0.11 | 0.40–0.85 |
| ABCC1 | Controls | 0.84 | 0.43–1.86 | 0.151 | 1.26 | 1.43 | 0.19 | 0.88–1.64 |
|
| AL | 0.67 | 0.23–1.63 |
| 1.10 | 1.36 | 0.17 | 0.75–1.42 |
Gene expression in patients with AL
with/without relapse
Cases were divided into the following subtype
groups: With relapse (51 cases of AL) and without relapse (18 cases
of AL). The expression levels of RFC1 (median: 0.40, P<0.001;
Fig. 2A and Table IV), were significantly lower in AL
patients with relapse than in AL patients without relapse.
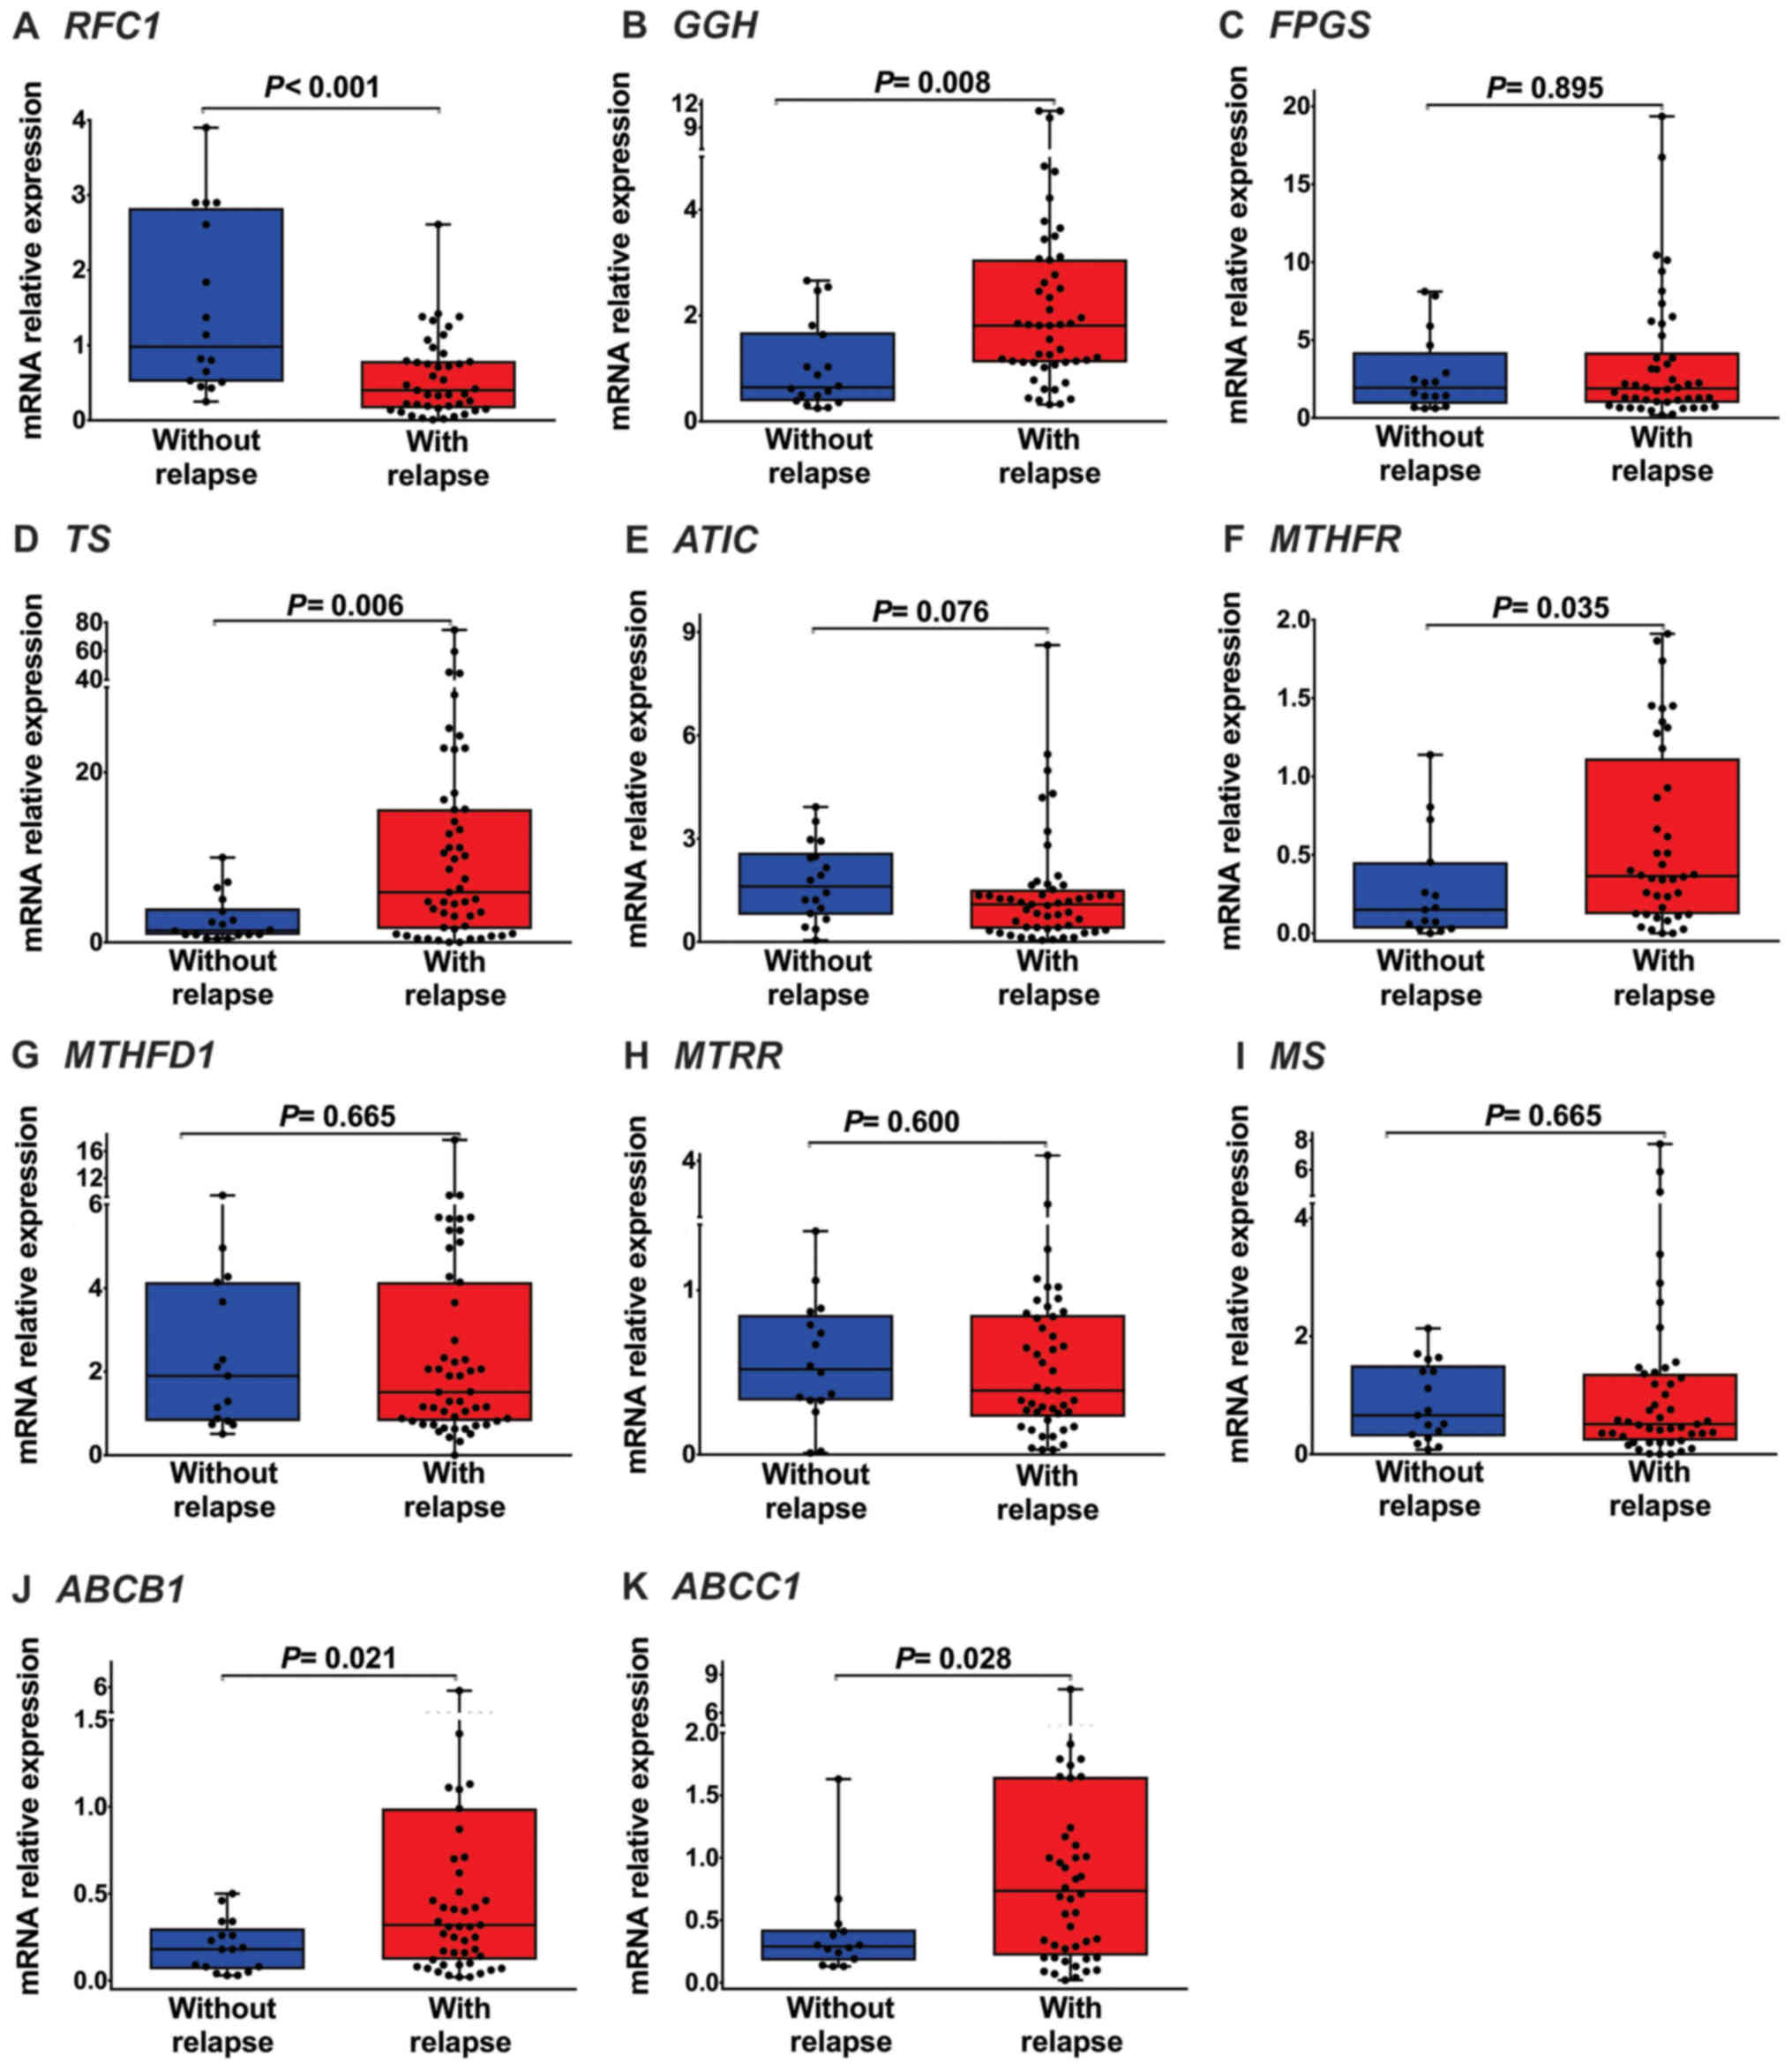 | Figure 2.Folate pathway gene expression in
patients with AL with and without relapse. (A) RFC1 mRNA expression
was significantly lower in patients with AL with relapse than in
those without relapse [median (25–75 percentiles), 0.40
(0.16–0.79); P<0.001]. (B) GGH mRNA expression was significantly
increased in patients with AL with relapse [1.81 (1.12–3.06);
P=0.008]. (C) FPGS mRNA expression was not significantly different
between patients with AL with and without relapse [1.89
(0.97–4.20); P=0.895]. (D) TS mRNA expression were significantly
increased in patients with AL with relapse [5.89 (1.58–15.66);
P=0.006]. (E) ATIC mRNA expression was not significantly different
between patients with AL with and without relapse [1.09
(0.38–1.52); P=0.076]. (F) MTHFR mRNA expression was significantly
increased in patients with AL with relapse [0.37 (0.12–1.12);
P=0.035]. (G, H and I) MTHFD1, MTRR and MS mRNA expression levels
were not significantly different between patients with AL with and
without relapse [1.51 (0.82–4.40); P=0.665, 0.40 (0.23–0.86);
P=0.600 and 0.51 (0.23–1.36); P=0.665, respectively]. (J and K)
ABCB1 and ABCC1 mRNA expression levels were significantly increased
in patients with AL with relapse [0.32 (0.12–0.99); P=0.021, 0.76
(0.22–1.65); P=0.028, respectively]. RFC1, reduced folate carrier;
GGH, γ-glutamyl hydrolase; FPGS, folylpolyglutamate synthetase; TS,
thymidylate synthase; ATIC, 5-aminoimidazole-4-carboxamide
ribonucleotide formyltransferase; MTHFR, methylenetetrahydrofolate
reductase; MTHFD1, methylenetetrahydrofolate dehydrogenase 1; MTRR,
5-methyltetrahydrofolate-homocysteine methyltransferase reductase;
MS, methionine synthase; ABCB1, ATP-binding cassette subfamily B
member 1; ABCC1, ATP-binding cassette subfamily C member 1; AL,
acute leukemia. |
| Table IV.Folate pathway gene expression in
patients with AL with and without relapse. |
Table IV.
Folate pathway gene expression in
patients with AL with and without relapse.
|
|
| Median | 25-75%
Percentiles |
P-valueφ | Mean | Sth. Deviation | Sth. error of
mean | 95% CI of mean |
|---|
| RFC1 | Without
relapse | 0.98 | 0.51–2.83 |
<0.001a | 1.50 | 1.17 | 0.29 | 0.87–2.12 |
|
| With relapse | 0.40 | 0.16–0.79 |
| 0.57 | 0.53 | 0.08 | 0.41–0.74 |
| GGH | Without
relapse | 0.64 | 0.38–1.68 | 0.008a | 1.03 | 0.83 | 0.19 | 0.61–1.44 |
|
| With relapse | 1.81 | 1.12–3.06 |
| 2.45 | 2.46 | 0.23 | 1.72–3.14 |
| FPGS | Without
relapse | 1.94 | 0.92–4.22 | 0.895 | 2.81 | 2.49 | 0.62 | 1.49–4.14 |
|
| With relapse | 1.89 | 0.97–4.20 |
| 3.45 | 4.17 | 0.61 | 2.25–4.72 |
| TS | Without
relapse | 1.40 | 0.88–4.00 | 0.006a | 2.66 | 2.74 | 0.65 | 1.30–4.03 |
|
| With relapse | 5.89 | 1.58–15.66 |
| 11.97 | 15.53 | 2.17 | 7.61–16.34 |
| ATIC | Without
relapse | 1.61 | 0.79–2.59 | 0.076 | 1.74 | 1.13 | 0.27 | 1.18–2.30 |
|
| With relapse | 1.09 | 0.38–1.52 |
| 1.40 | 1.61 | 0.23 | 0.94–1.85 |
| MTHFR | Without
relapse | 0.15 | 0.03–0.45 | 0.035a | 0.28 | 0.34 | 0.09 | 0.09–0.47 |
|
| With relapse | 0.37 | 0.12–1.12 |
| 0.60 | 0.58 | 0.09 | 0.41–0.78 |
| MTHFD1 | Without
relapse | 1.90 | 0.82–4.14 | 0.665 | 2.60 | 2.41 | 0.62 | 1.26–3.93 |
|
| With relapse | 1.51 | 0.82–4.40 |
| 2.69 | 3.10 | 0.43 | 1.82–3.56 |
| MTRR | Without
relapse | 0.52 | 0.33–0.85 | 0.600 | 0.57 | 0.37 | 0.09 | 0.37–0.76 |
|
| With relapse | 0.40 | 0.23–0.86 |
| 0.62 | 0.71 | 0.10 | 0.40–0.83 |
| MS | Without
relapse | 0.66 | 0.30–1.51 | 0.665 | 0.87 | 0.66 | 0.16 | 0.53–1.21 |
|
| With relapse | 0.51 | 0.23–1.36 |
| 1.10 | 1.55 | 0.23 | 0.65–1.56 |
| ABCB1 | Without
relapse | 0.18 | 0.07–0.30 | 0.021a | 0.19 | 0.15 | 0.04 | 0.12–0.27 |
|
| With relapse | 0.32 | 0.12–0.99 |
| 0.73 | 1.04 | 0.15 | 0.44–1.03 |
| ABCC1 | Without
relapse | 0.29 | 0.18–0.42 | 0.028a | 0.39 | 0.38 | 0.10 | 0.17–0.62 |
|
| With relapse | 0.76 | 0.22–1.65 |
| 1.01 | 1.33 | 0.19 | 0.70–1.47 |
GGH (median: 1.81, P=0.008; Fig. 2B and Table IV), TS (median: 5.89, P=0.006;
Fig. 2D and Table IV), MTHFR (median: 0.37, P=0.035;
Fig. 2F and Table IV), ABCB1 (median: 0.32, P=0.021;
Fig. 2J and Table IV) and ABCC1 (median: 0.76, P=0.028;
Fig. 2K and Table IV). Were highly expressed in the AL
patients with relapse. As shown in Fig.
2 and Table IV, we did not
observe changes in FPGS (P=0.895; Fig.
2C and Table IV), ATIC
(P=0.076; Fig. 2E and Table IV), MTHFD1 (P=0.665, Fig. 2G and Table IV), MTRR (P=0.600; Fig. 2H and Table IV) and MS (P=0.665; Fig. 2I and Table IV) expression levels between AL
patients with relapse and AL patients without relapse.
Folate pathway gene expression is
associated with AL relapse
To evaluate the correlation between mRNA expression
and the risk of relapse to AL, patients were divided into low
expression and high expression groups. The media expression levels
of RFC1 (0.76-fold), GGH (1.93-fold), FPGS (3.21-fold), TS
(9.42-fold), ATIC (1.60-fold), MTHFR (0.56-fold), MTHFD1
(2.60-fold), MTRR (0.64-fold), MS (1.20-fold), ABCB1 (0.62-fold)
and ABCC1 (1.10-fold) were used as cut-off points to divide
patients with AL into two groups (Table III). Patients with expression lower
than the cut-off value were considered to be in the low expression
group [RFC1 (n=31), GGH (n=30), FPGS (n=31), TS (n=36), ATIC
(n=35), MTHFR (n=27), MTHFD1 (n=30), MTRR (n=34), MS (n=35), ABCB1
(n=36) and ABCC1 (n=39)], while patients with expression higher
than the cut-off value were considered to be in the high expression
group [RFC1 (n=30), GGH (n=33), FPGS (n=32), TS (n=33), ATIC
(n=34), MTHFR (n=32), MTHFD1 (n=30), MTRR (n=30), MS (n=29), ABCB1
(n=33) and ABCC1 (n=24)].
Logistic regression analysis was performed to
evaluate the correlation between the mRNA expression levels of
genes in the folate pathway and the risk of AL relapse. In this
analysis, an association was observed between the mRNA expression
levels of RFC1, GGH, TS, MTHFR, ABCB1 and ABCC1 and the risk of
relapse in patients with AL (P<0.05). Compared with patients
with AL and low mRNA expression, patients with AL and high mRNA
expression had a significant increase in the risk of relapse (GGH:
OR=4.28, CI95% 1.29–14.14, P=0.017; TS: OR=7.14, CI95% 1.84–27.81,
P=0.005; MTHFR: OR=4.81, CI95% 1.31–17.64, P=0.018; ABCB1: OR=4.61,
CI95% 1.33–15.97, P=0.016 and ABCC1: OR=5.50, CI95% 1.12–27.06;
P=0.036; Table V). In contrast, high
mRNA levels of RFC1 had a protective effect (OR=0.22; CI95%
0.06–0.80; P=0.021).
| Table V.Association of folate pathway gene
expression and clinical features with the risk of relapse to
AL. |
Table V.
Association of folate pathway gene
expression and clinical features with the risk of relapse to
AL.
|
|
|
|
| Univariate
analysis | Multivariate
analysis |
|---|
|
|
|
|
|
|
|
|---|
| Variable (n) | Without relapse n
(%) | With relapse n
(%) |
P-valuea | OR | CI 95% |
P-valueb | OR | CI 95% |
P-valuec |
|---|
| Sex |
|
|
|
|
|
|
|
|
|
|
Female | 9 | 18 |
| 1.00 |
|
|
|
|
|
|
Male | 9 | 33 | 0.400 | 1.83 | 0.62–5.44 | 0.275 |
|
|
|
| Risk by age and
leukocytes at diagnosis |
|
|
|
|
|
|
|
|
|
|
Low-risk | 11 | 15 |
| 1.00 |
|
|
|
|
|
|
High-risk | 7 | 36 | 0.024d | 3.77 | 1.23–11.59 | 0.020d |
|
|
|
|
Immunophenotype |
|
|
|
|
|
|
|
|
|
|
Lymphoid-lineage | 14 | 36 |
| 1.00 |
|
|
|
|
|
|
Myeloid-lineage | 4 | 15 | 0.761 | 1.14 | 0.41–5.16 | 0.549 |
|
|
|
| RFC1 (61) |
|
|
|
|
|
|
|
|
|
|
Low-levels | 4 (25.0) | 27 (60.0) | 0.021d | 1.00 |
|
|
|
|
|
|
High-levels | 12 (75.0) | 18 (40.0) |
| 0.22 | 0.06–0.80 | 0.021d | 0.23 | 0.06–0.87 | 0.030d |
| GGH (63) |
|
|
|
|
|
|
|
|
|
|
Low-levels | 13 (72.2) | 17 (37.8) | 0.024d | 1.00 |
|
|
|
|
|
|
High-levels | 5 (27.8) | 28 (62.2) |
| 4.28 | 1.29–14.14 | 0.017d | 6.53 | 1.65–25.83 | 0.008d |
| FPGS (63) |
|
|
|
|
|
|
|
|
|
|
Low-levels | 8 (50.0) | 23 (48.9) | 1.00 | 1.00 |
|
|
|
|
|
|
High-levels | 8 (50.0) | 24 (51.1) |
| 1.04 | 0.34–3.25 | 0.941 |
|
|
|
| TS (69) |
|
|
|
|
|
|
|
|
|
|
Low-levels | 15 (83.3) | 21 (41.2) | 0.002d | 1.00 |
|
|
|
|
|
|
High-levels | 3 (16.7 | 30 (58.8) |
| 7.14 | 1.84–27.81 | 0.005d | 7.40 | 1.81–30.33 | 0.005d |
| ATIC (69) |
|
|
|
|
|
|
|
|
|
|
Low-levels | 6 (33.3) | 29 (56.9) | 0.106 | 1.00 |
|
|
|
|
|
|
High-levels | 12 (66.7) | 22 (43.1) |
| 0.38 | 0.12–1.17 | 0.086 |
|
|
|
| MTHFR (59) |
|
|
|
|
|
|
|
|
|
|
Low-levels | 11 (73.3) | 16 (49.1) | 0.037d | 1.00 |
|
|
|
|
|
|
High-levels | 4 (26.7) | 28 (50.9) |
| 4.81 | 1.31–17.64 | 0.018d | 4.50 | 1.18–17.12 | 0.027d |
| MTHFD1 (60) |
|
|
|
|
|
|
|
|
|
|
Low-levels | 7 (46.7) | 23 (51.1) | 1.00 | 1.00 |
|
|
|
|
|
|
High-levels | 8 (53.3) | 22 (48.9) |
| 0.84 | 0.26–2.69 | 0.766 |
|
|
|
| MTRR (64) |
|
|
|
|
|
|
|
|
|
|
Low-levels | 7 (43.8) | 27 (56.2) | 0.405 | 1.00 |
|
|
|
|
|
|
High-levels | 9 (56.2) | 21 (43.8) |
| 0.60 | 0.19–1.89 | 0.388 |
|
|
|
| MS (64) |
|
|
|
|
|
|
|
|
|
|
Low-levels | 8 (47.1) | 27 (57.4) | 0.573 | 1.00 |
|
|
|
|
|
|
High-levels | 9 (52.9) | 20 (42.6) |
| 0.66 | 0.22–2.01 | 0.462 |
|
|
|
| ABCB1 (69) |
|
|
|
|
|
|
|
|
|
|
Low-levels | 14 (77.8) | 22 (43.1) | 0.014d | 1.00 |
|
|
|
|
|
|
High-levels | 4 (22.2) | 29 (56.9) |
| 4.61 | 1.33–15.97 | 0.016d | 5.13 | 1.38–18.98 | 0.014d |
| ABCC1 (63) |
|
|
|
|
|
|
|
|
|
|
Low-levels | 13 (86.7) | 26 (54.2) | 0.033d | 1.00 |
|
|
|
|
|
|
High-levels | 2 (13.3) | 22 (45.8) |
| 5.50 | 1.12–27.06 | 0.036d | 4.85 | 0.95–24.74 | 0.050d |
The following variables were included in a
multivariate analysis: Risk by age and leukocytes at diagnosis and
the expression levels of RFC1, GGH, TS, MTHFR ABCB1 and ABCC1 mRNA,
to determine whether the mRNA expression of each gene predicts the
risk of relapse independently. It was observed that the expression
levels of RFC1, GGH, TS, MTHFR ABCB1 and ABCC1 were independent
prognostic factors in AL patients (Table
V). These data suggest that the mRNA expression levels of
folate pathway genes could play an important role in the risk of
relapse in this disease.
Poor survival based on the mRNA
expression levels of folate pathway genes
The association between the mRNA expression levels
of folate pathway genes and the survival of patients with AL was
investigated. In this analysis, patients with high expression
levels of GGH mRNA tended to have lower survival than did those
with low expression levels of GGH mRNA (log-rank test, P=0.004;
Fig. 3B). Similarly, a difference in
survival was evident among individuals with high levels of MTHFD1
mRNA (log-rank test; P=0.035; Fig.
3G). In patients with AL, Kaplan-Meier analysis showed no
significance between survival and the mRNA levels of RFC1, FGS, TS,
ATIC, MTHFR, MTRR, MS, ABCB1, and ABCC1 (log-rank test; P>0.05;
Fig. 3).
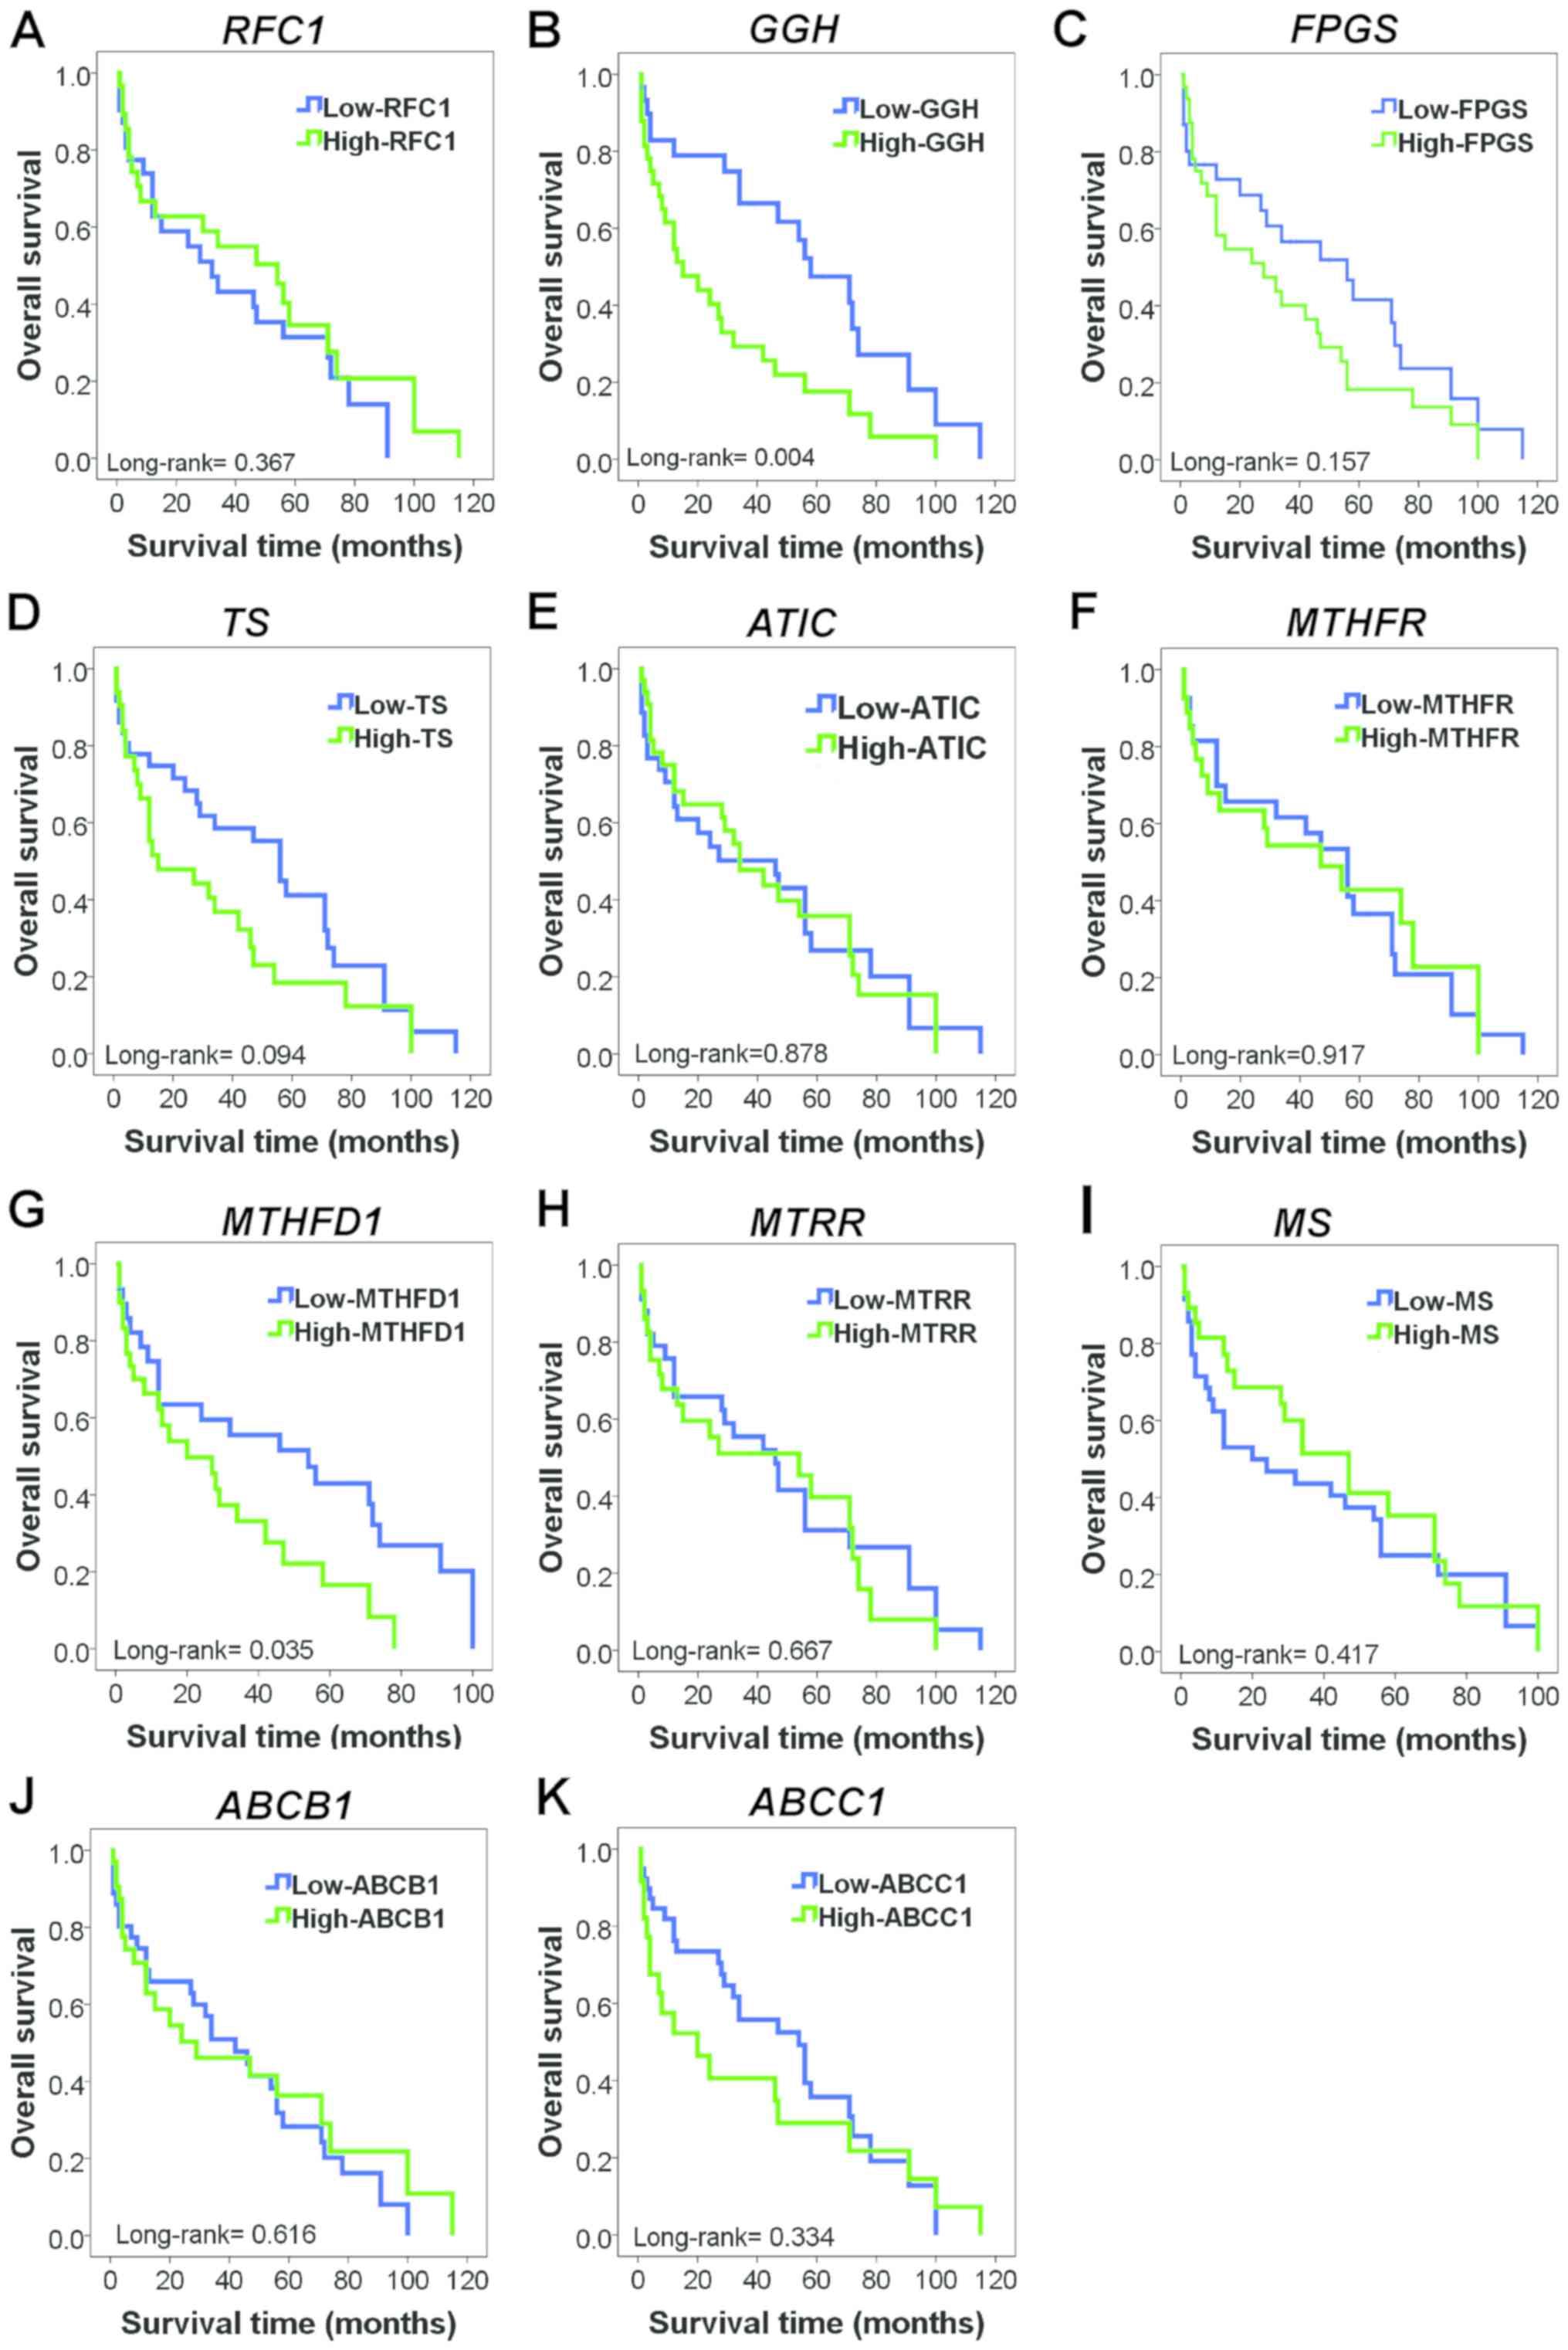 | Figure 3.Kaplan-Meier curves for overall
survival showing the influence of folate pathway gene expression in
patients with AL. (A) OS in patients with AL with high or low RFC1
mRNA expression (P=0.367). (B) OS in patients with AL with high or
low GGH mRNA expression. Patients who exhibited high levels of GGH
mRNA expression exhibited significantly decreased OS (P=0.004). (C)
OS in patients with AL with high or low FPGS mRNA expression
(P=0.157). (D) OS in patients with AL with high or low TS mRNA
expression (P=0.094). (E) OS in patients with AL with high or low
ATIC mRNA expression (P=0.878). (F) OS in patients with AL with
high or low MTHFR mRNA expression (P=0.917). (G) OS in patients
with AL with high or low MTHFD1 mRNA expression. Patients who
exhibited high levels of MTHFD1 mRNA expression also exhibited
significantly decreased OS (P=0.035). (H) OS in patients with AL
with high or low MTRR mRNA expression (P=0.667). (I) OS in patients
with AL with high or low MS mRNA expression (P=0.417). (J) OS in
patients with AL with high or low ABCB1 mRNA expression (P=0.616).
(K) OS in patients with AL with high or low ABCC1 mRNA expression
(P=0.334). RFC1, reduced folate carrier; GGH, γ-glutamyl hydrolase;
FPGS, folylpolyglutamate synthetase; TS, thymidylate synthase;
ATIC, 5-aminoimidazole-4-carboxamide ribonucleotide
formyltransferase; MTHFR, methylenetetrahydrofolate reductase;
MTHFD1, methylenetetrahydrofolate dehydrogenase 1; MTRR,
5-methyltetrahydrofolate-homocysteine methyltransferase reductase;
MS, methionine synthase; ABCB1, ATP-binding cassette subfamily B
member 1; ABCC1, ATP-binding cassette subfamily C member 1; AL,
acute leukemia; OS, overall survival. |
Discussion
ALs are the most common type of childhood cancer.
Despite advancements in therapeutic strategies, the prognosis of
patients with AL significantly varies and is difficult to predict.
Additionally, different responses to the same therapy are observed
among patients with AL (29).
Therefore, finding new biomarkers for the identification of
patients with a high risk of not responding to treatment is very
important to modify therapeutic methods to improve the survival of
patients with AL.
MTX was one of the first anticancer therapeutic
agents for the treatment of childhood leukemia (4,6). In this
study, the expression of RFC1 was significantly lower (P=0.006) in
patients with AL with relapse than in those without relapse.
According to previous studies, the expression levels of RFC1 mRNA
are diminished in HEP-2 cells treated with MTX, and reduced RFC1
leads to decreased intracellular MTX, which is involved in MTX
resistance (30,31). Thus, the decreased expression of RFC1
mRNA results in inefficient absorption of antifolates by tumor
cells, leading to the development of MTX resistance.
Alternatively, the mRNA expression levels of
MTX-metabolizing enzymes, including FPGS and GGH, were elevated in
patients with AL, while GGH mRNA was overexpressed in patients who
relapsed during treatment with MTX. GGH is responsible for
eliminating the glutamate groups from MTXPG, favoring its efflux
from cells, and high levels of GGH mRNA are reportedly associated
with resistance to MTX (32). Our
results are consistent with those of Kim et al (33), who reported that overexpression of
GGH is associated with MTX resistance. These results suggest that
GGH is related to MTX resistance in patients with AL since its
overexpression could favor the exit of MTX from the cell,
preventing it from exerting its antineoplastic activity. Similarly,
GGH expression is associated with poor prognosis and unfavorable
clinical outcomes in breast and prostate cancers and pleural
mesothelioma (18,34,35).
Consistent with these findings, our data suggest that high mRNA
levels of GGH play an important role in survival in patients with
AL and that GGH may be a therapeutic target in AL. Additionally,
FPGS mRNA was overexpressed in patients with AL with relapse.
Similar to previous reports, the expression of FPGS was elevated in
AL cell lines (36).
Regarding folate-dependent enzymes, changes were
observed in the mRNA expression levels of the MS, MTRR, MTHFR, TS,
MTHFD1 and ATIC genes. MTRR is involved in the synthesis of DNA and
production of S-adenosylmethionine (SAM); MTRR also plays an
important role in carcinogenesis (37). MTRR is an enzyme that controls the
activity of MS in the metabolism of folate through the transfer of
methyl groups of methyltetrahydrofolate to homocysteine via MS
(24,37,38). No
studies have analyzed the expression of MTTR mRNA in patients with
AL. In our study, MTRR expression levels were lower in the AL group
than in the control group. Nevertheless, significant differences
were not observed between patients with and without relapse. In
patients with breast cancer and ovarian cancer cells, increased
expression of MTRR mRNA (37,39) was
observed.
MS catalyzes the remethylation of homocysteine to
methionine; deficiencies in the activity of MS result in
hyperhomocysteinemia (25,40), which is a risk factor for cancer
(41). This decrease in MS activity
leads to an increase in homocysteine and a reduction in DNA
methylation processes and, is an important factor in the
development of cancer (42,43). Our results show decreased levels of
MS in patients with AL, similar to the findings in ovarian, renal,
prostate, breast, colon, leukemia, non-small cell lung carcinoma
cell lines (44).
Another important enzyme involved in the
remethylation of homocysteine is MTHFR, which catalyzes the
conversion of 5,10-CH3-THF to 5-CH3-THF for
the remethylation of homocysteine to methionine (22,45). In
this study, MTHFR mRNA levels were decreased in patients with AL.
We also observed that MTHFR mRNA levels were substantially elevated
in patients who relapsed during treatment compared to those in
patients who did not relapse. This observation is similar to the
findings of Liu et al (22),
who observed that the reduced mRNA level of MTHFR had an
association with the risk for esophageal cancer. The biological
effect of overexpression of MTHFR mRNA is not completely defined,
and there are no studies showing its relationship with response to
treatment in patients with AL.
TS is a folate-dependent enzyme that plays a central
role in deoxythymidine monophosphate synthesis, which is critical
for the synthesis and repair of DNA by serving as the main
intracellular source of dUTM (46,47). Our
results show increased levels of TS mRNA in patients with AL,
similar to findings observed in breast cancer (47) and pancreatic cancer (20). We also found that patients with AL
with relapse showed increased mRNA expression levels of TS. Our
results are in line with previous reports showing a significant
aggressive phenotype and poor prognosis (47–49).
These data indicate that TS is involved in disease progression and
relapse in cancer, which occur because TS is a target enzyme of
MTXPG and is overexpressed in AL and in patients with relapse. It
is possible that MTX does not inhibit this enzyme, as we did not
observe inhibition of TS; thus, DNA synthesis is favored, and cells
continue to proliferate uncontrollably.
The ABC transporter family is a group of membrane
transporters that transport different molecules through the cell
membrane. ABCs are divided into different subgroups (named A-G) and
have been associated with multidrug resistance (26,50,51).
Regarding the ABC transporter family, we found increased expression
levels of ABCB1 and ABCC1 mRNAs in patients with AL who relapsed
during treatment. Our findings are similar to those reported by Ho
et al (52) and Eadie et
al (53), who observed that the
overexpression of ABC transporter mRNA (ABCB1, ABCC1 and ABCG2) is
correlated with increased cellular resistance of leukemic
cells.
Likewise, in a multivariate analysis, we observed
that the expression levels of RFC1, GGH, TS, MTHFR ABCB1 and ABCC1
are independent prognostic factors in AL patients, excluding
leukocytes at diagnosis and age (Table
V). As shown in Fig. 4, we
hypothesize that the high expression levels of ABCB1 and ABCC1
genes play an important role in the resistance to MTX treatment by
favoring its efflux from cells. Likewise, decreased levels of RFC1
mRNA will result in MTX not being captured by the cells. In
additon, the increase in GGH levels favors the depolyglutamation of
MTX, preventing it from exerting its activity. ATIC and TS are
overexpressed, indicating that MTXPG does not inhibit these enzymes
and, favors cell proliferation in AL patients with relapse
(Fig. 4).
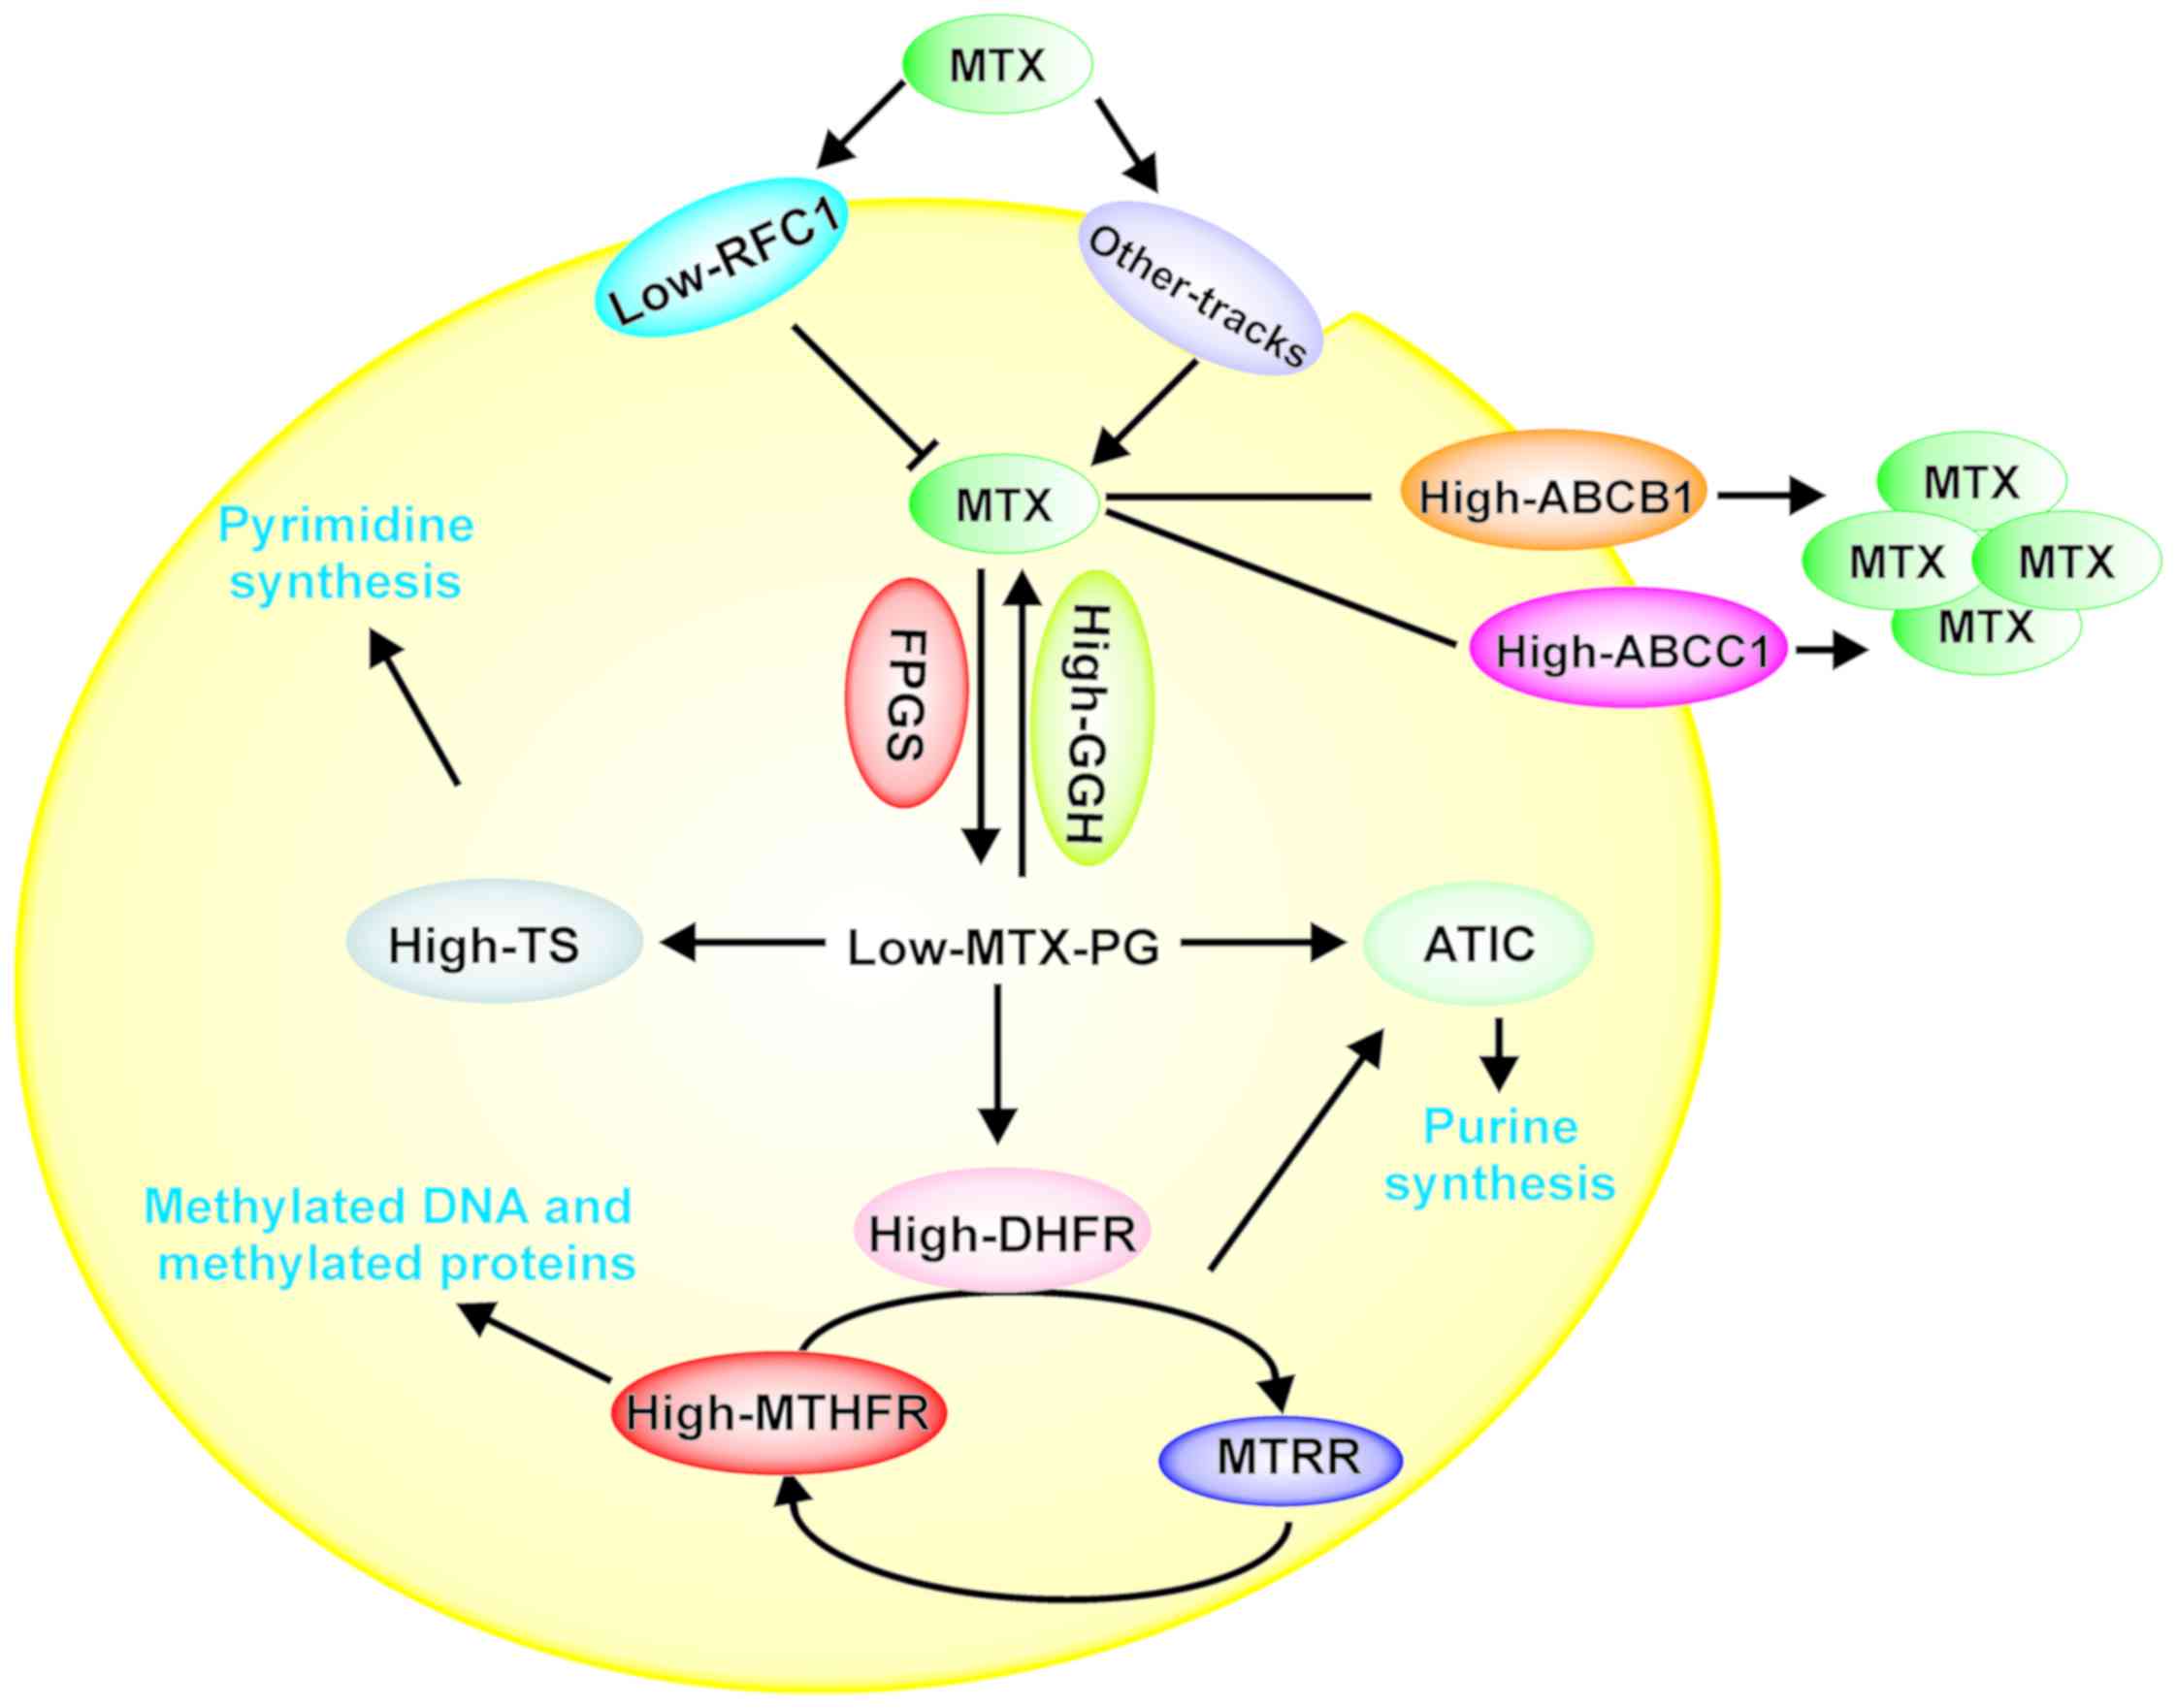 | Figure 4.Model of the possible role of folate
pathway gene expression levels involved in the transport and
metabolism of MTX in patients with AL with relapse. The decreased
levels of RFC1 could favor inhibition of MTX internalization into
the cell, while the increase in GGH levels favors MTX
depolyglutamation, preventing MTX from exerting its activity, which
also affects the levels of ATIC and TS (overexpression). Moreover,
high expression levels of ABCB1 and ABCC1 cause the efflux of MTX
from the cell. All of these processes favor cell proliferation and
survival. RFC1, reduced folate carrier; GGH, γ-glutamyl hydrolase;
FPGS, folylpolyglutamate synthetase; TS, thymidylate synthase;
ATIC, 5-aminoimidazole-4-carboxamide ribonucleotide
formyltransferase; MTHFR, methylenetetrahydrofolate reductase;
MTHFD1, methylenetetrahydrofolate dehydrogenase 1; MTRR,
5-methyltetrahydrofolate-homocysteine methyltransferase reductase;
MS, methionine synthase; ABCB1, ATP-binding cassette subfamily B
member 1; ABCC1, ATP-binding cassette subfamily C member 1. |
In conclusion, our data indicate that the
deregulation of the mRNA expression levels of genes involved in the
transport (RFC1, ABCB1, and ABCC1) and metabolism (GGH, TS, MTHFR)
of MTX had impacts on the risk of relapse and survival of AL
Mexican patients. However, this analysis was based only on 69
patients and needs to be confirmed in a larger population.
Acknowledgements
Not applicable.
Funding
The present study was supported by Universidad
Autónoma de Guerrero. Jorge Organista-Nava (CVU: 236745) and Yazmín
Gómez-Gómez (CVU: ٢٣٦٧٢٨) were recipients of postdoctoral
fellowships from CONACYT. The present study was supported by grant
from CONACYT, México (Fondo Sectorial de Investigación en Salud y
Seguridad Social; grant no. A3-S-47392).
Availability of data and materials
The datasets used and/or analyzed during the present
study are available from the corresponding author on reasonable
request.
Authors' contributions
JON, YGG, BIA and MALV made substantial
contributions to the conception and design of the study. BIA, ABRR,
MVSH, MAJL, OMH and MALV provided the study materials or patients.
JON, YGG, JGS and MALV collection and assembled the data. JON, YGG,
JGS, ABRR, MVSH, MAJL, OMH and MALV performed the data analysis and
interpretation. JON, YGG, BIA and MALV wrote the manuscript. All
authors read and approved the final manuscript.
Ethics approval and consent to
participate
The present study and informed consent procedure
were approved by the Institutional Review Board of the Cancer
Institute of the State of Guerrero, Mexico. Patients who
participated in this research had complete clinical data. Written
informed consent was obtained from all individuals or their
guardians after a detailed briefing of the study aims.
Patient consent for publication
Not applicable.
Competing interests
The authors declare that they have no competing
interests.
References
|
1
|
Bekker-Méndez VC, Miranda-Peralta E,
Núñez-Enríquez JC, Olarte-Carrillo I, Guerra-Castillo FX,
Pompa-Mera EN, Ocaña-Mondragón A, Rangel-López A, Bernáldez-Ríos R,
Medina-Sanson A, et al: Prevalence of gene rearrangements in
mexican children with acute lymphoblastic Leukemia: A population
study-report from the mexican interinstitutional group for the
identification of the causes of childhood leukemia. Biomed Res Int.
2014:2105602014. View Article : Google Scholar : PubMed/NCBI
|
|
2
|
Mejía-Aranguré JM, Pérez-Saldivar MaL,
Pelayo-Camacho R, et al: Childhood acute leukemias in Hispanic
population: Differences by age peak and immunophenotype. Novel
Aspects in Acute Lymphoblastic Leukemia. Rijeka: InTech; Croatia:
pp. 322011
|
|
3
|
Leukemia in Childers. American Cancer
Society, 2019, . https://www.cancer.org/cancer/leukemia-in-children.htmlMarch
10–2019
|
|
4
|
Stanulla M and Schrappe M: Treatment of
childhood acute lymphoblastic leukemia. Semin Hematol. 46:52–63.
2009. View Article : Google Scholar : PubMed/NCBI
|
|
5
|
Pui CH, Robison LL and Look AT: Acute
lymphoblastic leukaemia. Lancet. 371:1030–1043. 2008. View Article : Google Scholar : PubMed/NCBI
|
|
6
|
Hider SL, Bruce IN and Thomson W: The
pharmacogenetics of methotrexate. Rheumatology (Oxford).
46:1520–1524. 2007. View Article : Google Scholar : PubMed/NCBI
|
|
7
|
Assaraf YG: Molecular basis of antifolate
resistance. Cancer Metastasis Rev. 26:153–181. 2007. View Article : Google Scholar : PubMed/NCBI
|
|
8
|
de Beaumais TA and Jacqz-Aigrain E:
Intracellular disposition of methotrexate in acute lymphoblastic
leukemia in children. Curr Drug Metab. 13:822–834. 2012. View Article : Google Scholar : PubMed/NCBI
|
|
9
|
Gonen N and Assaraf YG: Antifolates in
cancer therapy: Structure, activity and mechanisms of drug
resistance. Drug Resist Updat. 15:183–210. 2012. View Article : Google Scholar : PubMed/NCBI
|
|
10
|
Wojtuszkiewicz A, Peters GJ, Woerden NL,
Dubbelman B, Escherich G, Schmiegelow K, Sonneveld E, Pieters R,
van de Ven PM, Jansen G, et al: Methotrexate resistance in relation
to treatment outcome in childhood acute lymphoblastic leukemia. J
Hematol Oncol. 8:612015. View Article : Google Scholar : PubMed/NCBI
|
|
11
|
Rothem L, Aronheim A and Assaraf YG:
Alterations in the expression of transcription factors and the
reduced folate carrier as a novel mechanism of antifolate
resistance in human leukemia cells. J Biol Chem. 278:8935–8941.
2003. View Article : Google Scholar : PubMed/NCBI
|
|
12
|
de Jonge R, Hooijberg JH, van Zelst BD,
Jansen G, van Zantwijk CH, Kaspers GJ, Peters GJ, Ravindranath Y,
Pieters R and Lindemans J: Effect of polymorphisms in
folate-related genes on in vitro methotrexate sensitivity in
pediatric acute lymphoblastic leukemia. Blood. 106:717–720. 2005.
View Article : Google Scholar : PubMed/NCBI
|
|
13
|
Gómez-Gómez Y, Organista-Nava J,
Saavedra-Herrera MV, Rivera-Ramírez AB, Terán-Porcayo MA, Del
Carmen Alarcón-Romero L, Illades-Aguiar B and Leyva-Vázquez MA:
Survival and risk of relapse of acute lymphoblastic leukemia in a
Mexican population is affected by dihydrofolate reductase gene
polymorphisms. Exp Ther Med. 3:665–672. 2012. View Article : Google Scholar : PubMed/NCBI
|
|
14
|
Organista-Nava J, Gómez-Gómez Y,
Illades-Aguiar B, Del Carmen Alarcón-Romero L, Saavedra-Herrera MV,
Rivera-Ramírez AB, Garzón-Barrientos VH and Leyva-Vázquez MA: High
miR-24 expression is associated with risk of relapse and poor
survival in acute leukemia. Oncol Rep. 33:1639–1649. 2015.
View Article : Google Scholar : PubMed/NCBI
|
|
15
|
Reiter A, Schrappe M, Ludwig WD, Hiddemann
W, Sauter S, Henze G, Zimmermann M, Lampert F, Havers W, Niethammer
D, et al: Chemotherapy in 998 unselected childhood acute
lymphoblastic leukemia patients. Results and conclusions of the
multicenter trial ALL-BFM 86. Blood. 84:3122–3133. 1994.PubMed/NCBI
|
|
16
|
Chomczynski P and Sacchi N: Single-step
method of RNA isolation by acid guanidinium
thiocyanate-phenol-chloroform extraction. Anal Biochem.
162:156–159. 1987. View Article : Google Scholar : PubMed/NCBI
|
|
17
|
Abdel-Haleem AM, El-Zeiry MI, Mahran LG,
Abou-Aisha K, Rady MH, Rohde J, Mostageer M and Spahn-Langguth H:
Expression of RFC/SLC19A1 is associated with tumor type in bladder
cancer patients. PLoS One. 6:e218202011. View Article : Google Scholar : PubMed/NCBI
|
|
18
|
Obata T, Tanaka M, Suzuki Y and Sasaki T:
The role of thymidylate synthase in pemetrexed-resistant malignant
pleural mesothelioma cells. J Cancer Therapy. 4:82013. View Article : Google Scholar
|
|
19
|
Ogawa M, Watanabe M, Mitsuyama Y, Anan T,
Ohkuma M, Kobayashi T, Eto K and Yanaga K: Thymidine phosphorylase
mRNA expression may be a predictor of response to post-operative
adjuvant chemotherapy with S-1 in patients with stage III
colorectal cancer. Oncol Lett. 8:2463–2468. 2014. View Article : Google Scholar : PubMed/NCBI
|
|
20
|
Seitz U, Wagner M, Neumaier B, Wawra E,
Glatting G, Leder G, Schmid RM and Reske SN: Evaluation of
pyrimidine metabolising enzymes and in vitro uptake of
3′-[18F]fluoro-3′-deoxythymidine [(18F)FLT] in pancreatic cancer
cell lines. Eur J Nucl Med Mol Imaging. 29:1174–1181. 2002.
View Article : Google Scholar : PubMed/NCBI
|
|
21
|
Malek RL, Irby RB, Guo QM, Lee K, Wong S,
He M, Tsai J, Frank B, Liu ET, Quackenbush J, et al: Identification
of Src transformation fingerprint in human colon cancer. Oncogene.
21:7256–7265. 2002. View Article : Google Scholar : PubMed/NCBI
|
|
22
|
Liu R, Yin L and Pu Y: Association between
gene expression of metabolizing enzymes and esophageal squamous
cell carcinomas in china. Genet Test Mol Biomarkers. 16:1211–1217.
2012. View Article : Google Scholar : PubMed/NCBI
|
|
23
|
Kawakami K, Ooyama A, Ruszkiewicz A, Jin
M, Watanabe G, Moore J, Oka T, Iacopetta B and Minamoto T: Low
expression of gamma-glutamyl hydrolase mRNA in primary colorectal
cancer with the CpG island methylator phenotype. Br J Cancer.
98:1555–1561. 2008. View Article : Google Scholar : PubMed/NCBI
|
|
24
|
Zhao JY, Yang XY, Gong XH, Gu ZY, Duan WY,
Wang J, Ye ZZ, Shen HB, Shi KH, Hou J, et al: Functional variant in
methionine synthase reductase intron-1 significantly increases the
risk of congenital heart disease in the han chinese population
clinical perspective. Circulation. 125:482–490. 2012. View Article : Google Scholar : PubMed/NCBI
|
|
25
|
Huang T, Wahlqvist ML and Li D: Effect of
n-3 polyunsaturated fatty acid on gene expression of the critical
enzymes involved in homocysteine metabolism. Nutr J. 11:62012.
View Article : Google Scholar : PubMed/NCBI
|
|
26
|
Yoshida M, Suzuki T, Komiya T, Hatashita
E, Nishio K, Kazuhiko N and Fukuoka M: Induction of MRP5 and SMRP
mRNA by adriamycin exposure and its overexpression in human lung
cancer cells resistant to adriamycin. Int J Cancer. 94:432–437.
2001. View Article : Google Scholar : PubMed/NCBI
|
|
27
|
Ramos-Nino ME, Scapoli L, Martinelli M,
Land S and Mossman BT: Microarray analysis and RNA silencing link
fra-1 to cd44 and c-met expression in mesothelioma. Cancer Res.
63:3539–3545. 2003.PubMed/NCBI
|
|
28
|
Nolan T, Hands RE and Bustin SA:
Quantification of mRNA using real-time RT-PCR. Nat Protoc.
1:1559–1582. 2006. View Article : Google Scholar : PubMed/NCBI
|
|
29
|
Dulucq S, St-Onge G, Gagné V, Ansari M,
Sinnett D, Labuda D, Moghrabi A and Krajinovic M: DNA variants in
the dihydrofolate reductase gene and outcome in childhood ALL.
Blood. 111:3692–3700. 2008. View Article : Google Scholar : PubMed/NCBI
|
|
30
|
Obuchi W, Ohtsuki S, Uchida Y, Ohmine K,
Yamori T and Terasaki T: Identification of transporters associated
with etoposide sensitivity of stomach cancer cell lines and
methotrexate sensitivity of breast cancer cell lines by
quantitative targeted absolute proteomics. Mol Pharmacol.
83:490–500. 2013. View Article : Google Scholar : PubMed/NCBI
|
|
31
|
Galbiatti ALS, Castro R, Caldas HC,
Padovani JA, Pavarino ÉC and Goloni-Bertollo EM: Alterations in the
expression pattern of MTHFR, DHFR, TYMS, and SLC19A1 genes after
treatment of laryngeal cancer cells with high and low doses of
methotrexate. Tumor Biol. 34:3765–3771. 2013. View Article : Google Scholar
|
|
32
|
Li WW, Waltham M, Tong W, Schweitzer BI
and Bertino JR: Increased Activity of γ-Glutamyl Hydrolase in Human
Sarcoma Cell Lines: A Novel Mechanism of Intrinsic Resistance to
Methotrexate (MTX). Chemistry and Biology of Pteridines and
Folates. Ayling JE, Nair MG and Baugh CM: Springer US; Boston, MA:
pp. 635–638. 1993, View Article : Google Scholar
|
|
33
|
Kim SE, Cole PD, Cho RC, Ly A, Ishiguro L,
Sohn KJ, Croxford R, Kamen BA and Kim YI: γ-Glutamyl hydrolase
modulation and folate influence chemosensitivity of cancer cells to
5-fluorouracil and methotrexate. Br J Cancer. 109:2175–2188. 2013.
View Article : Google Scholar : PubMed/NCBI
|
|
34
|
Shubbar E, Helou K, Kovács A, Nemes S,
Hajizadeh S, Enerbäck C and Einbeigi Z: High levels of γ-glutamyl
hydrolase (GGH) are associated with poor prognosis and unfavorable
clinical outcomes in invasive breast cancer. BMC Cancer. 13:472013.
View Article : Google Scholar : PubMed/NCBI
|
|
35
|
Melling N, Rashed M, Schroeder C,
Hube-Magg C, Kluth M, Lang D, Simon R, Möller-Koop C, Steurer S,
Sauter G, et al: High-level γ-glutamyl-hydrolase (GGH) expression
is linked to poor prognosis in ERG negative prostate cancer. Int J
Mol Sci. 18:E2862017. View Article : Google Scholar : PubMed/NCBI
|
|
36
|
Galpin AJ, Schuetz JD, Masson E,
Yanishevski Y, Synold TW, Barredo JC, Pui CH, Relling MV and Evans
WE: Differences in folylpolyglutamate synthetase and dihydrofolate
reductase expression in human B-Lineage versus T-lineage leukemic
lymphoblasts: Mechanisms for lineage differences in methotrexate
polyglutamylation and cytotoxicity. Mol Pharmacol. 52:155–163.
1997. View Article : Google Scholar : PubMed/NCBI
|
|
37
|
Chen J, Wang Q, Yin FQ, Zhang W, Yan LH
and Li L: MTRR silencing inhibits growth and cisplatin resistance
of ovarian carcinoma via inducing apoptosis and reducing autophagy.
Am J Transl Res. 7:1510–1527. 2015.PubMed/NCBI
|
|
38
|
Kotsopoulos J, Hecht JL, Marotti JD,
Kelemen LE and Tworoger SS: Relationship between dietary and
supplemental intake of folate, methionine, vitamin B(6) and folate
receptor α expression in ovarian tumors. Int J Cancer.
126:2191–2198. 2010.PubMed/NCBI
|
|
39
|
López-Cortés A, Echeverría C, Oña-Cisneros
F, Sánchez ME, Herrera C, Cabrera-Andrade A, Rosales F, Ortiz M and
Paz-Y-Miño C: Breast cancer risk associated with gene expression
and genotype polymorphisms of the folate-metabolizing MTHFR gene: A
case-control study in a high altitude Ecuadorian mestizo
population. Tumor Biol. 36:6451–6461. 2015. View Article : Google Scholar
|
|
40
|
Leclerc D, Campeau E, Goyette P, Adjalla
CE, Christensen B, Ross M, Eydoux P, Rosenblatt DS, Rozen R and
Gravel RA: Human methionine synthase: cDNA cloning and
identification of mutations in patients of the cblG complementation
group of folate/cobalamin disorders. Hum Mol Genet. 5:1867–1874.
1996. View Article : Google Scholar : PubMed/NCBI
|
|
41
|
Wu LL and Wu JT: Hyperhomocysteinemia is a
risk factor for cancer and a new potential tumor marker. Clin Chim
Acta. 322:21–28. 2002. View Article : Google Scholar : PubMed/NCBI
|
|
42
|
Li Y and Tollefsbol TO: Impact on DNA
methylation in cancer prevention and therapy by bioactive dietary
components. Curr Med Chem. 17:2141–2151. 2010. View Article : Google Scholar : PubMed/NCBI
|
|
43
|
Wajed SA, Laird PW and DeMeester TR: DNA
methylation: An alternative pathway to cancer. Ann Surg. 234:10–20.
2001. View Article : Google Scholar : PubMed/NCBI
|
|
44
|
Zhang W, Braun A, Bauman Z, Olteanu H,
Madzelan P and Banerjee R: Expression profiling of homocysteine
junction enzymes in the NCI60 panel of human cancer cell lines.
Cancer Res. 65:1554–1560. 2005. View Article : Google Scholar : PubMed/NCBI
|
|
45
|
Bahari G, Hashemi M, Naderi M and Taheri
M: Association between methylenetetrahydrofolate reductase (MTHFR)
gene polymorphisms and susceptibility to childhood acute
lymphoblastic leukemia in an iranian population. Int J Hematol
Oncol Stem Cell Res. 10:130–137. 2016.PubMed/NCBI
|
|
46
|
Erčulj N, Kotnik BF, Debeljak M, Jazbec J
and Dolžan V: Influence of folate pathway polymorphisms on
high-dose methotrexate-related toxicity and survival in childhood
acute lymphoblastic leukemia. Leuk Lymphoma. 53:1096–1104. 2012.
View Article : Google Scholar : PubMed/NCBI
|
|
47
|
Shan F, Liu YL, Wang Q and Shi YL:
Thymidylate synthase predicts poor response to pemetrexed
chemotherapy in patients with advanced breast cancer. Oncol Lett.
16:3274–3280. 2018.PubMed/NCBI
|
|
48
|
Yu Z, Sun J, Zhen J, Zhang Q and Yang Q:
Thymidylate synthase predicts for clinical outcome in invasive
breast cancer. Histol Histopathol. 20:871–878. 2005.PubMed/NCBI
|
|
49
|
Kaira K, Okumura T, Ohde Y, Takahashi T,
Murakami H, Kondo H, Nakajima T and Yamamoto N: Prognostic
significance of thymidylate synthase expression in the adjuvant
chemotherapy after resection for pulmonary metastases from
colorectal cancer. Anticancer Res. 31:2763–2771. 2011.PubMed/NCBI
|
|
50
|
Vrana D, Hlavac V, Brynychova V,
Vaclavikova R, Neoral C, Vrba J, Aujesky R, Matzenauer M, Melichar
B and Soucek P: ABC transporters and their role in the neoadjuvant
treatment of esophageal cancer. Int J Mol Sci. 19:E8682018.
View Article : Google Scholar : PubMed/NCBI
|
|
51
|
Robey RW, Pluchino KM, Hall MD, Fojo AT,
Bates SE and Gottesman MM: Revisiting the role of ABC transporters
in multidrug-resistant cancer. Nat Rev Cancer. 18:452–464. 2018.
View Article : Google Scholar : PubMed/NCBI
|
|
52
|
Ho MM, Hogge DE and Ling V: MDR1 and BCRP1
expression in leukemic progenitors correlates with chemotherapy
response in acute myeloid leukemia. Exp Hematol. 36:433–442. 2008.
View Article : Google Scholar : PubMed/NCBI
|
|
53
|
Eadie LN, Dang P, Saunders VA, Yeung DT,
Osborn MP, Grigg AP, Hughes TP and White DL: The clinical
significance of ABCB1 overexpression in predicting outcome of CML
patients undergoing first-line imatinib treatment. Leukemia.
31:752016. View Article : Google Scholar : PubMed/NCBI
|


