Introduction
Ewing sarcoma (ES) is a highly malignant tumor with
a low survival rate and high rate of metastasis. In a British
cohort of patients with ES, ES accounts for 14% of pediatric bone
tumors (1). Comprehensive
strategies, including localized surgery, radiotherapy and
chemotherapy, have been developed for the treatment of patients
with ES (2). However, 30–40% of
patients develop recurrence or metastasis after comprehensive
therapy (3). The 5-year survival
rate of patients with ES was only 55% in a British cohort of
patients (1). Therefore, further
research on the pathogenesis of ES is required to improve the
prognosis of affected patients.
According to a previous study, the Ewing sarcoma
breakpoint region 1 (EWS)-E26 transformation-specific (ETS) fusion
gene is a major factor in ES (4).
EWS-ETS fusion genes may confer upon tumors the capacity for
metastasis and invasion by altering RNA transcriptional regulation
and epigenetic modification (5,6).
Previous studies on the EWS-ETS fusion gene have revealed the
unique role of this fusion gene in the development of ES; however,
treatment targeting the EWS-ETS fusion gene has been difficult to
achieve, and there is increasing evidence demonstrating that
EWS-ETS may not be the sole driver in metastatic ES (7–9). In
addition, the prognostic value of the EWS-ETS fusion gene in
patients with ES remains unclear. A retrospective study identified
a significant association between EWS-friend leukemia virus
integration 1 (FLI1) transcript subtypes and patient outcomes
(10). However, two prospective
studies were unable to validate this observation (11,12).
Consequently, recognition of new therapeutic or predictive
biomarkers to contribute to the treatment of ES is urgently needed
to improve the prognosis of these patients.
Weighted gene co-expression network analysis (WGCNA)
is an advanced approach to studying the associations between genes
and clinical traits. Compared with traditional microarray analysis
methods, WGCNA analysis uses a soft threshold instead of the hard
threshold of traditional differential gene screening, which
facilitates the screening of valuable genes with small fold changes
that may be important in the gene regulation cascade (13).
In addition, WGCNA is an efficient method of
studying the associations between genes and clinical phenotypes
(14). In the present study, WGCNA
was used to classify genes with similar expression patterns into
different modules. Associations between the co-expression modules
and clinical features of patients were analyzed. The most relevant
modules to overall vital survival (OVS) and metastasis status of
patients with ES were selected for further analysis.
Materials and methods
Data collection and preprocessing
ES data were downloaded from the Gene Expression
Omnibus (GEO) database (https://www.ncbi.nlm.nih.gov/geo/) as dataset GSE17679
(15). Probes were mapped to gene
symbols using the hgu133plus2.db (version 3.2.3) package
(http://bioconductor.org/packages/hgu133plus2.db/)
in R. If multiple probes were mapped to gene symbols, the mean
value was regarded as the expression value of the gene and the
repeated probes were dismissed.
Construction of a weighted
co-expression network
The WGCNA package in R is a widely used method of
identifying co-expression networks (16). Pearson's correlation coefficient was
calculated to construct the correlation matrix. A soft-thresholding
function was used to transform the correlation matrix into a
weighted adjacency matrix. To acquire a co-expression network with
a balance between scale-independence and mean connectivity, the
scale-independence and mean connectivity were calculated in
different powers by the soft-connectivity algorithm. The adjacency
matrix was transformed into a topological overlap matrix (TOM).
1-TOM was used as the distance measurement to cluster genes into
co-expression modules with a deep split value of 2, minimum size
cutoff of 20 and maximum module size of 5,000. A merge height of
0.3 was set as a criterion to cluster similar modules. To identify
the association between a co-expression module and a clinical
feature, P-values and correlation coefficients were calculated to
produce trait-module heatmaps.
PPI network construction and
functional annotation
The Search Tool for the Retrieval of Interacting
Genes/Proteins (STRING) database (date of access, August 2018;
http://string-db.org) was used to construct the
protein-protein interaction (PPI) network, which contained
experimental and in silico predicted PPI information. The
data source was set to only the experiment source. Low-connection
proteins were hidden. Hub genes are genes that serve a key role in
the regulation of the network. In the present study, the
betweenness centrality (BC) was used to measure the importance of a
node in the PPI network. Cytohubb in Cytoscape software (version
3.7.1, http://www.cytoscape.org) was used to
screen for the hub genes, and the top 50 genes with high BC values
were selected for subsequent analysis. Gene Ontology (GO) and Kyoto
Encyclopedia of Genes and Genomes (KEGG) functional enrichment
analysis was performed using the Metascape website (date of access,
August 2018; http://metascape.org).
Survival analysis
Since ES is a rare cancer, after carefully searching
the GEO database, ArrayExpress (https://www.ebi.ac.uk/arrayexpress/) and TCGA database
(https://cancergenome.nih.gov/) with
loose screening criteria (including clinical information), only one
GEO dataset, GSE63157 (17), met the
requirements (detailed clinical information) of the present study.
Following annotation, the expression profiles of 85 samples and
17,186 probes were obtained. The Survival and Survminer packages in
R were used to analyze and visualize the survival data and
P<0.05 was considered to indicate a statistically significant
difference. All the R packages used in the present study can be
found at http://www.bioconductor.org or
https://cran.r-project.org/web/packages.
Results
Construction of weighted gene
co-expression network
The expression matrix and clinical data of GSE17679
(15) were downloaded from the GEO
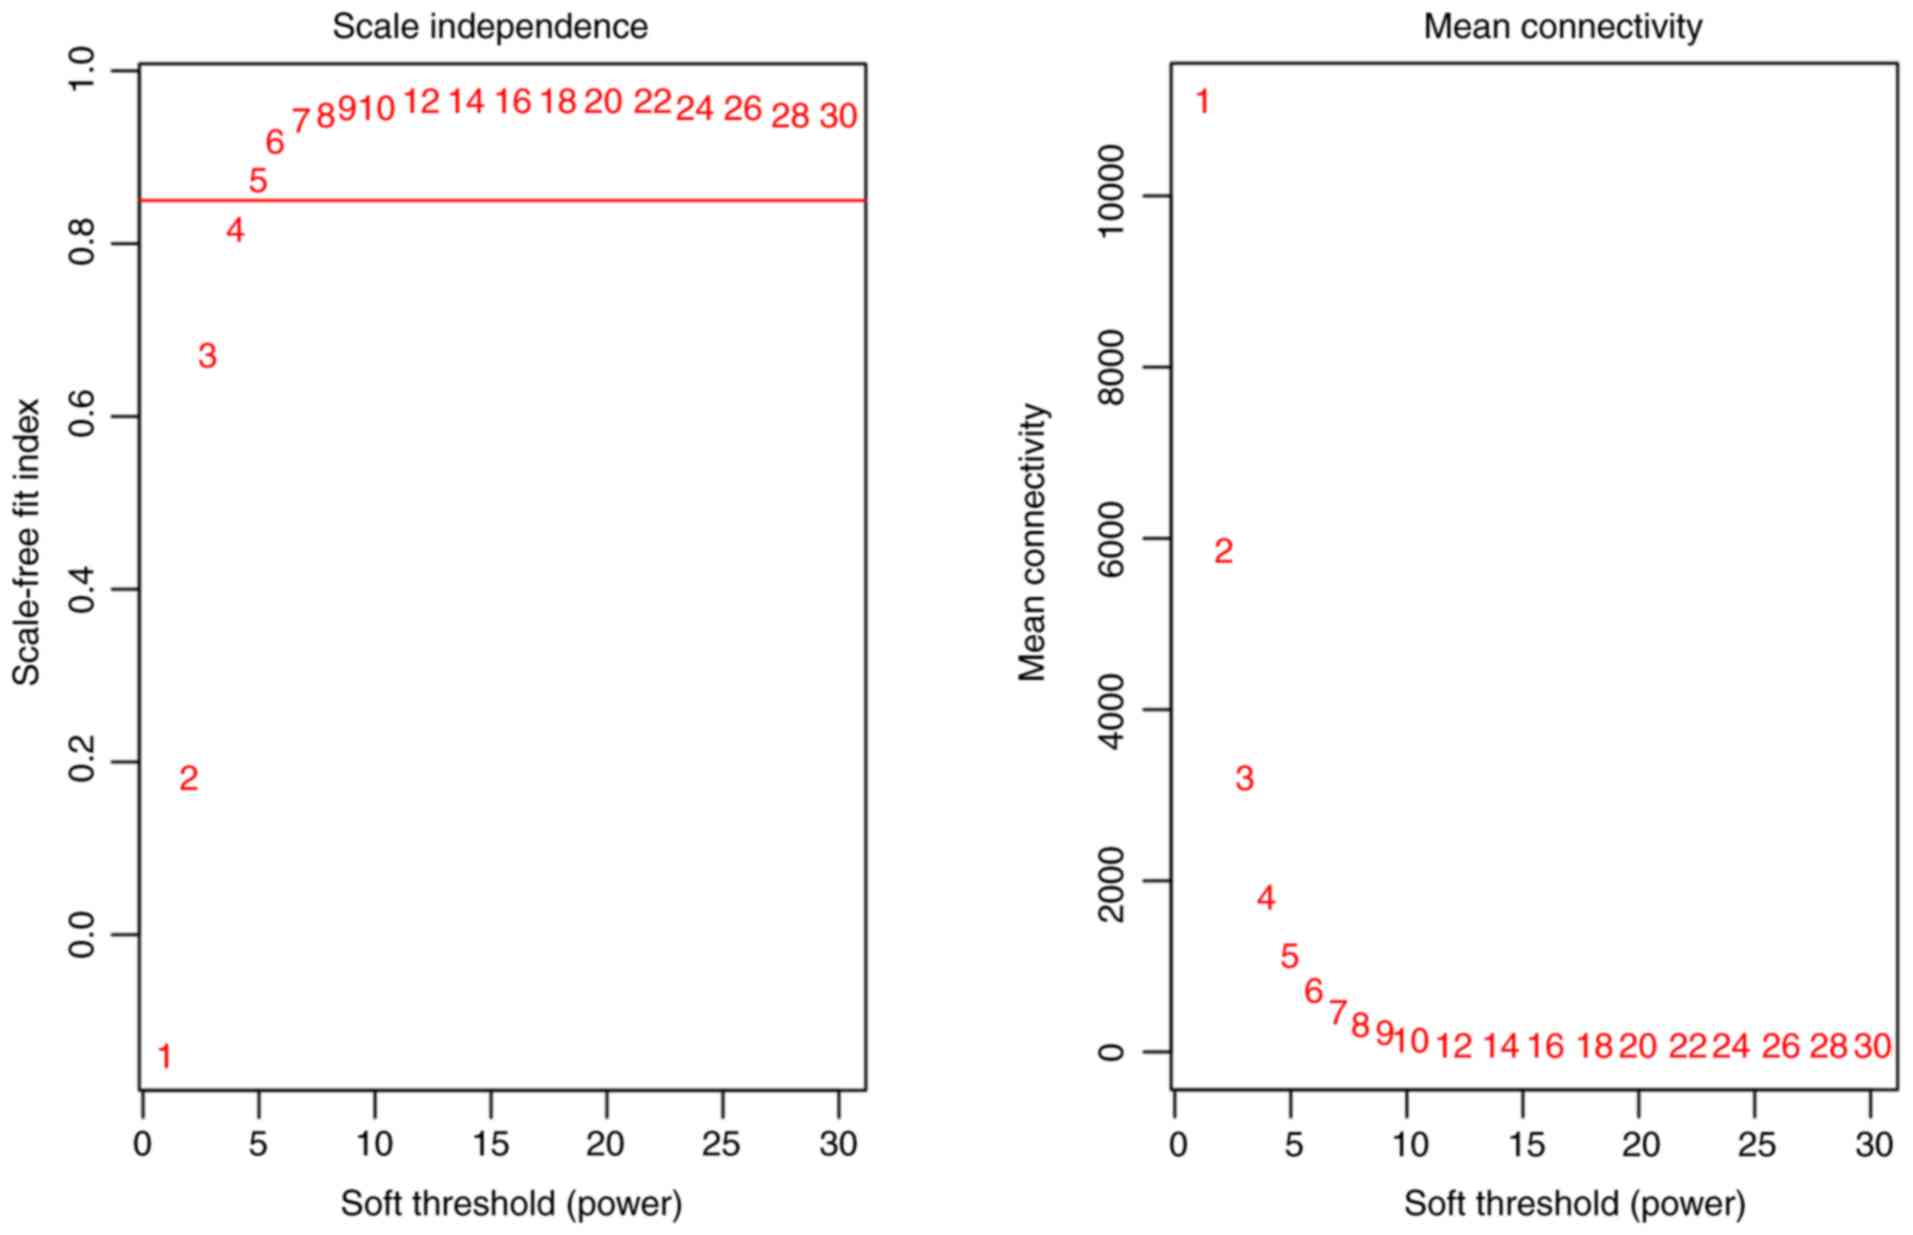
database. The scale-independence and mean connectivity were
calculated at different thresholds (Fig.
1). Appropriate soft-thresholding has a relatively good balance
between scale-independence and mean connectivity of the weighted
co-expression network; scale-independence >0.85 and average
connectivity <100 were used as the criteria for a suitable soft
threshold. As presented in Fig. 1, a
soft threshold power of 5 was chosen for the identification of
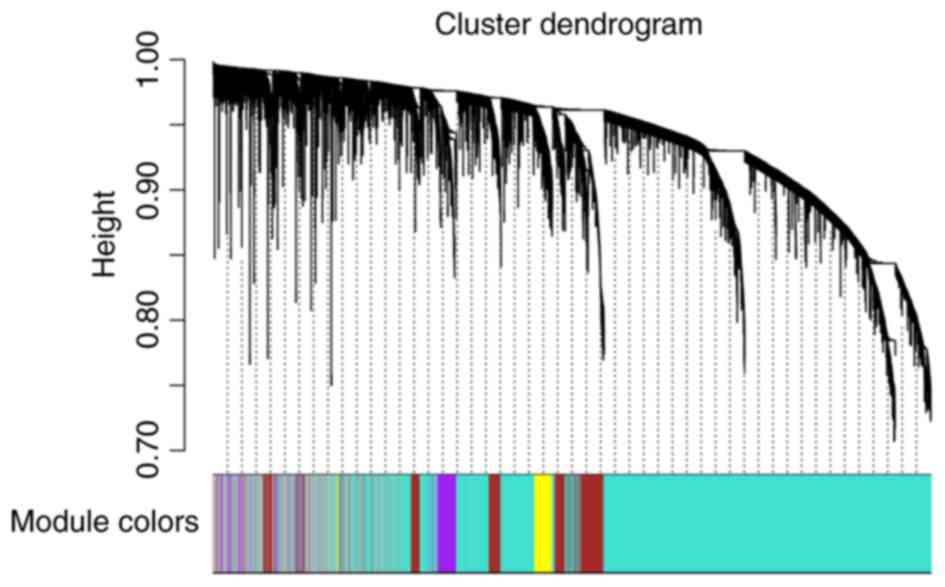
co-expression modules. A cluster dendrogram based on the
dissimilarity of the topological overlap matrix was generated
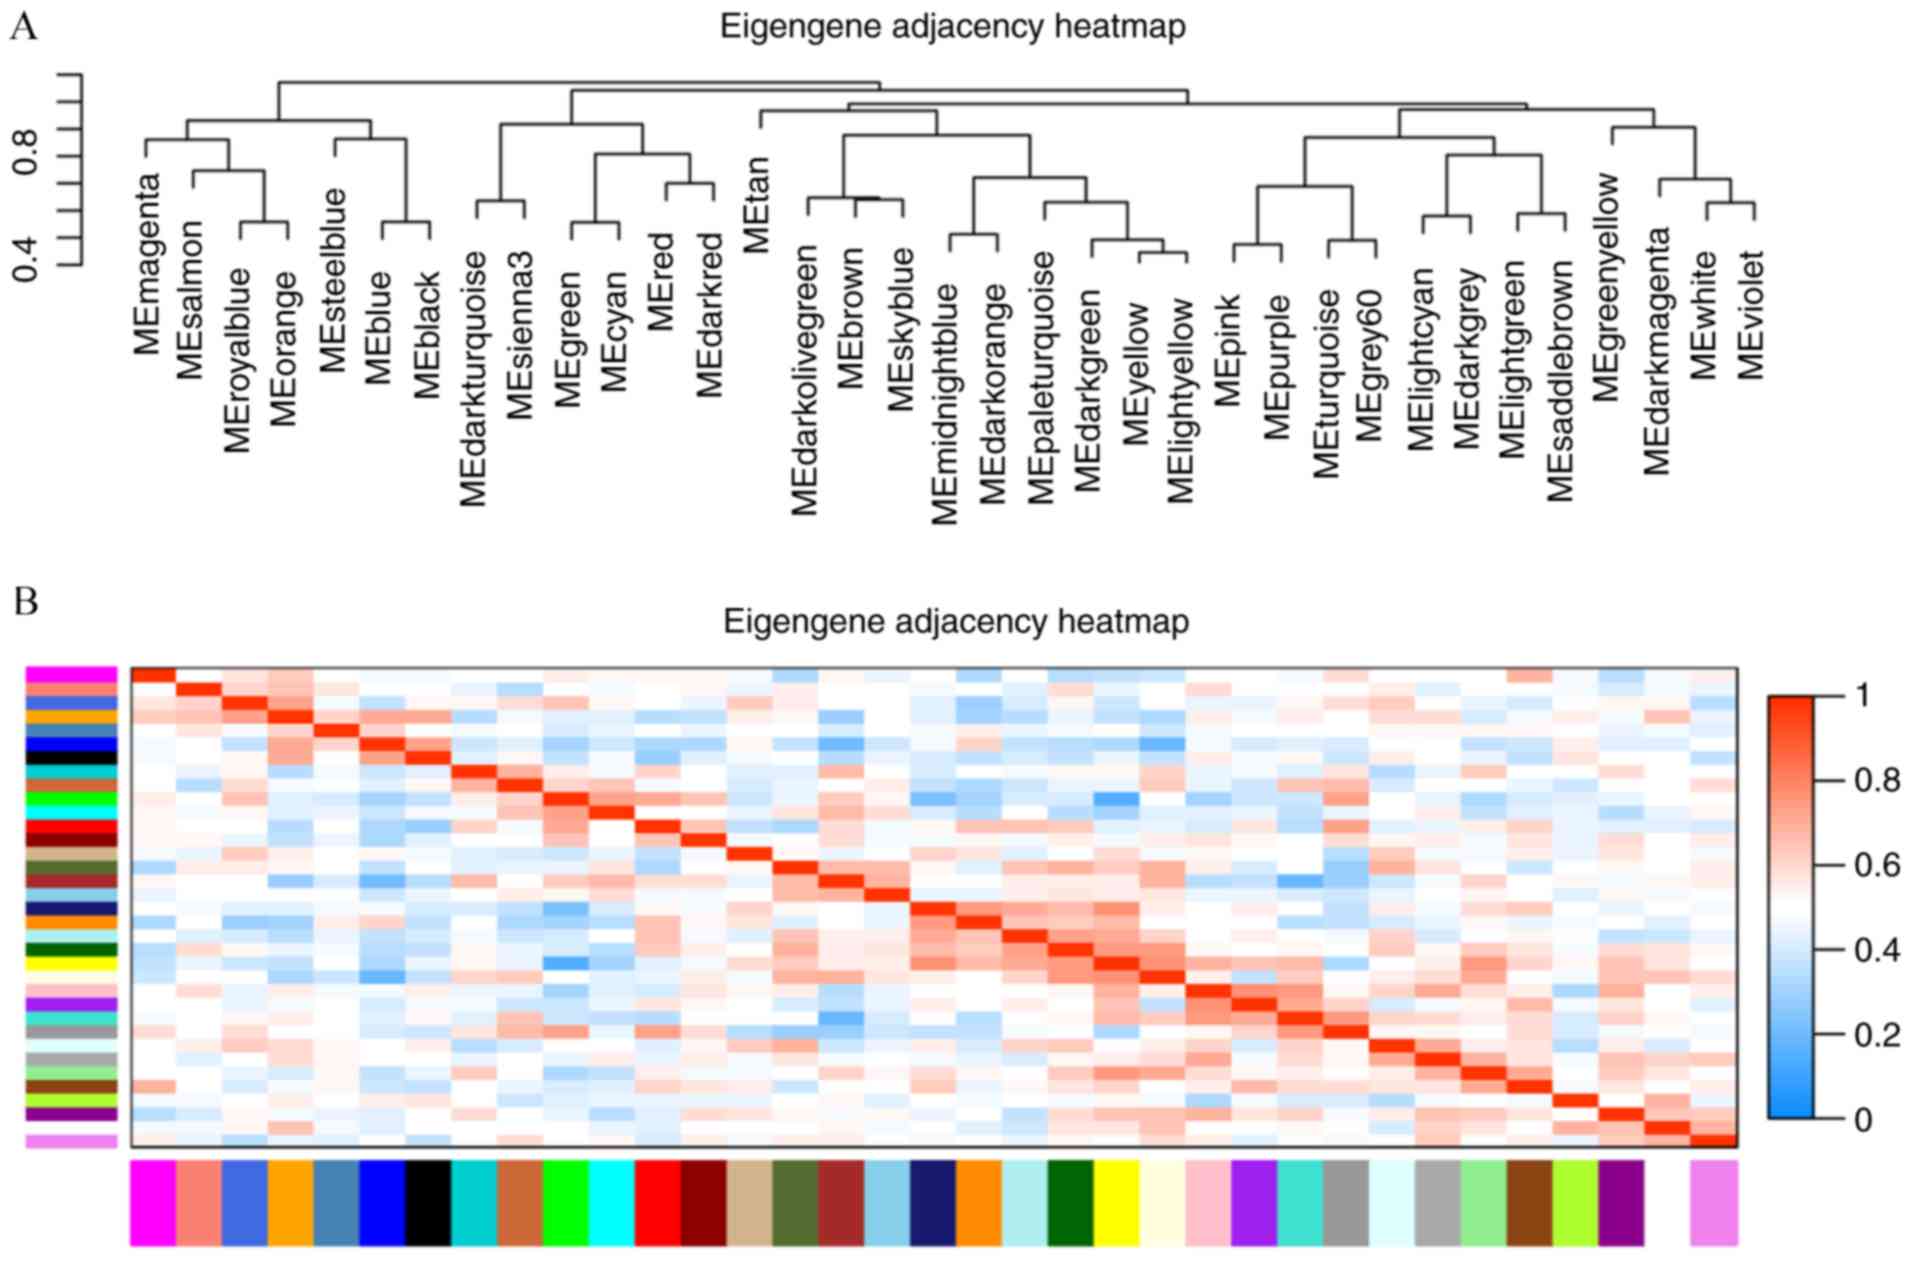
(Fig. 2). Acceptable
discriminability was present between each module in the similarity
heatmap plot (Fig. 3).
Identification of metastasis-related
co-expression modules and OVS-related co-expression modules
The first principal component of each module was
defined as the module eigengene (ME), which represented the
expression levels of all genes in the module. Gene significance
(GS) was used to evaluate the correlation between genes and
clinical features by linear regression; the module significance
(MS) was calculated by averaging the absolute GS values of all
genes in the co-expression module. The most statistically
significant module (P<0.0001) in each clinical feature (OVS and
metastasis) were further analyzed.
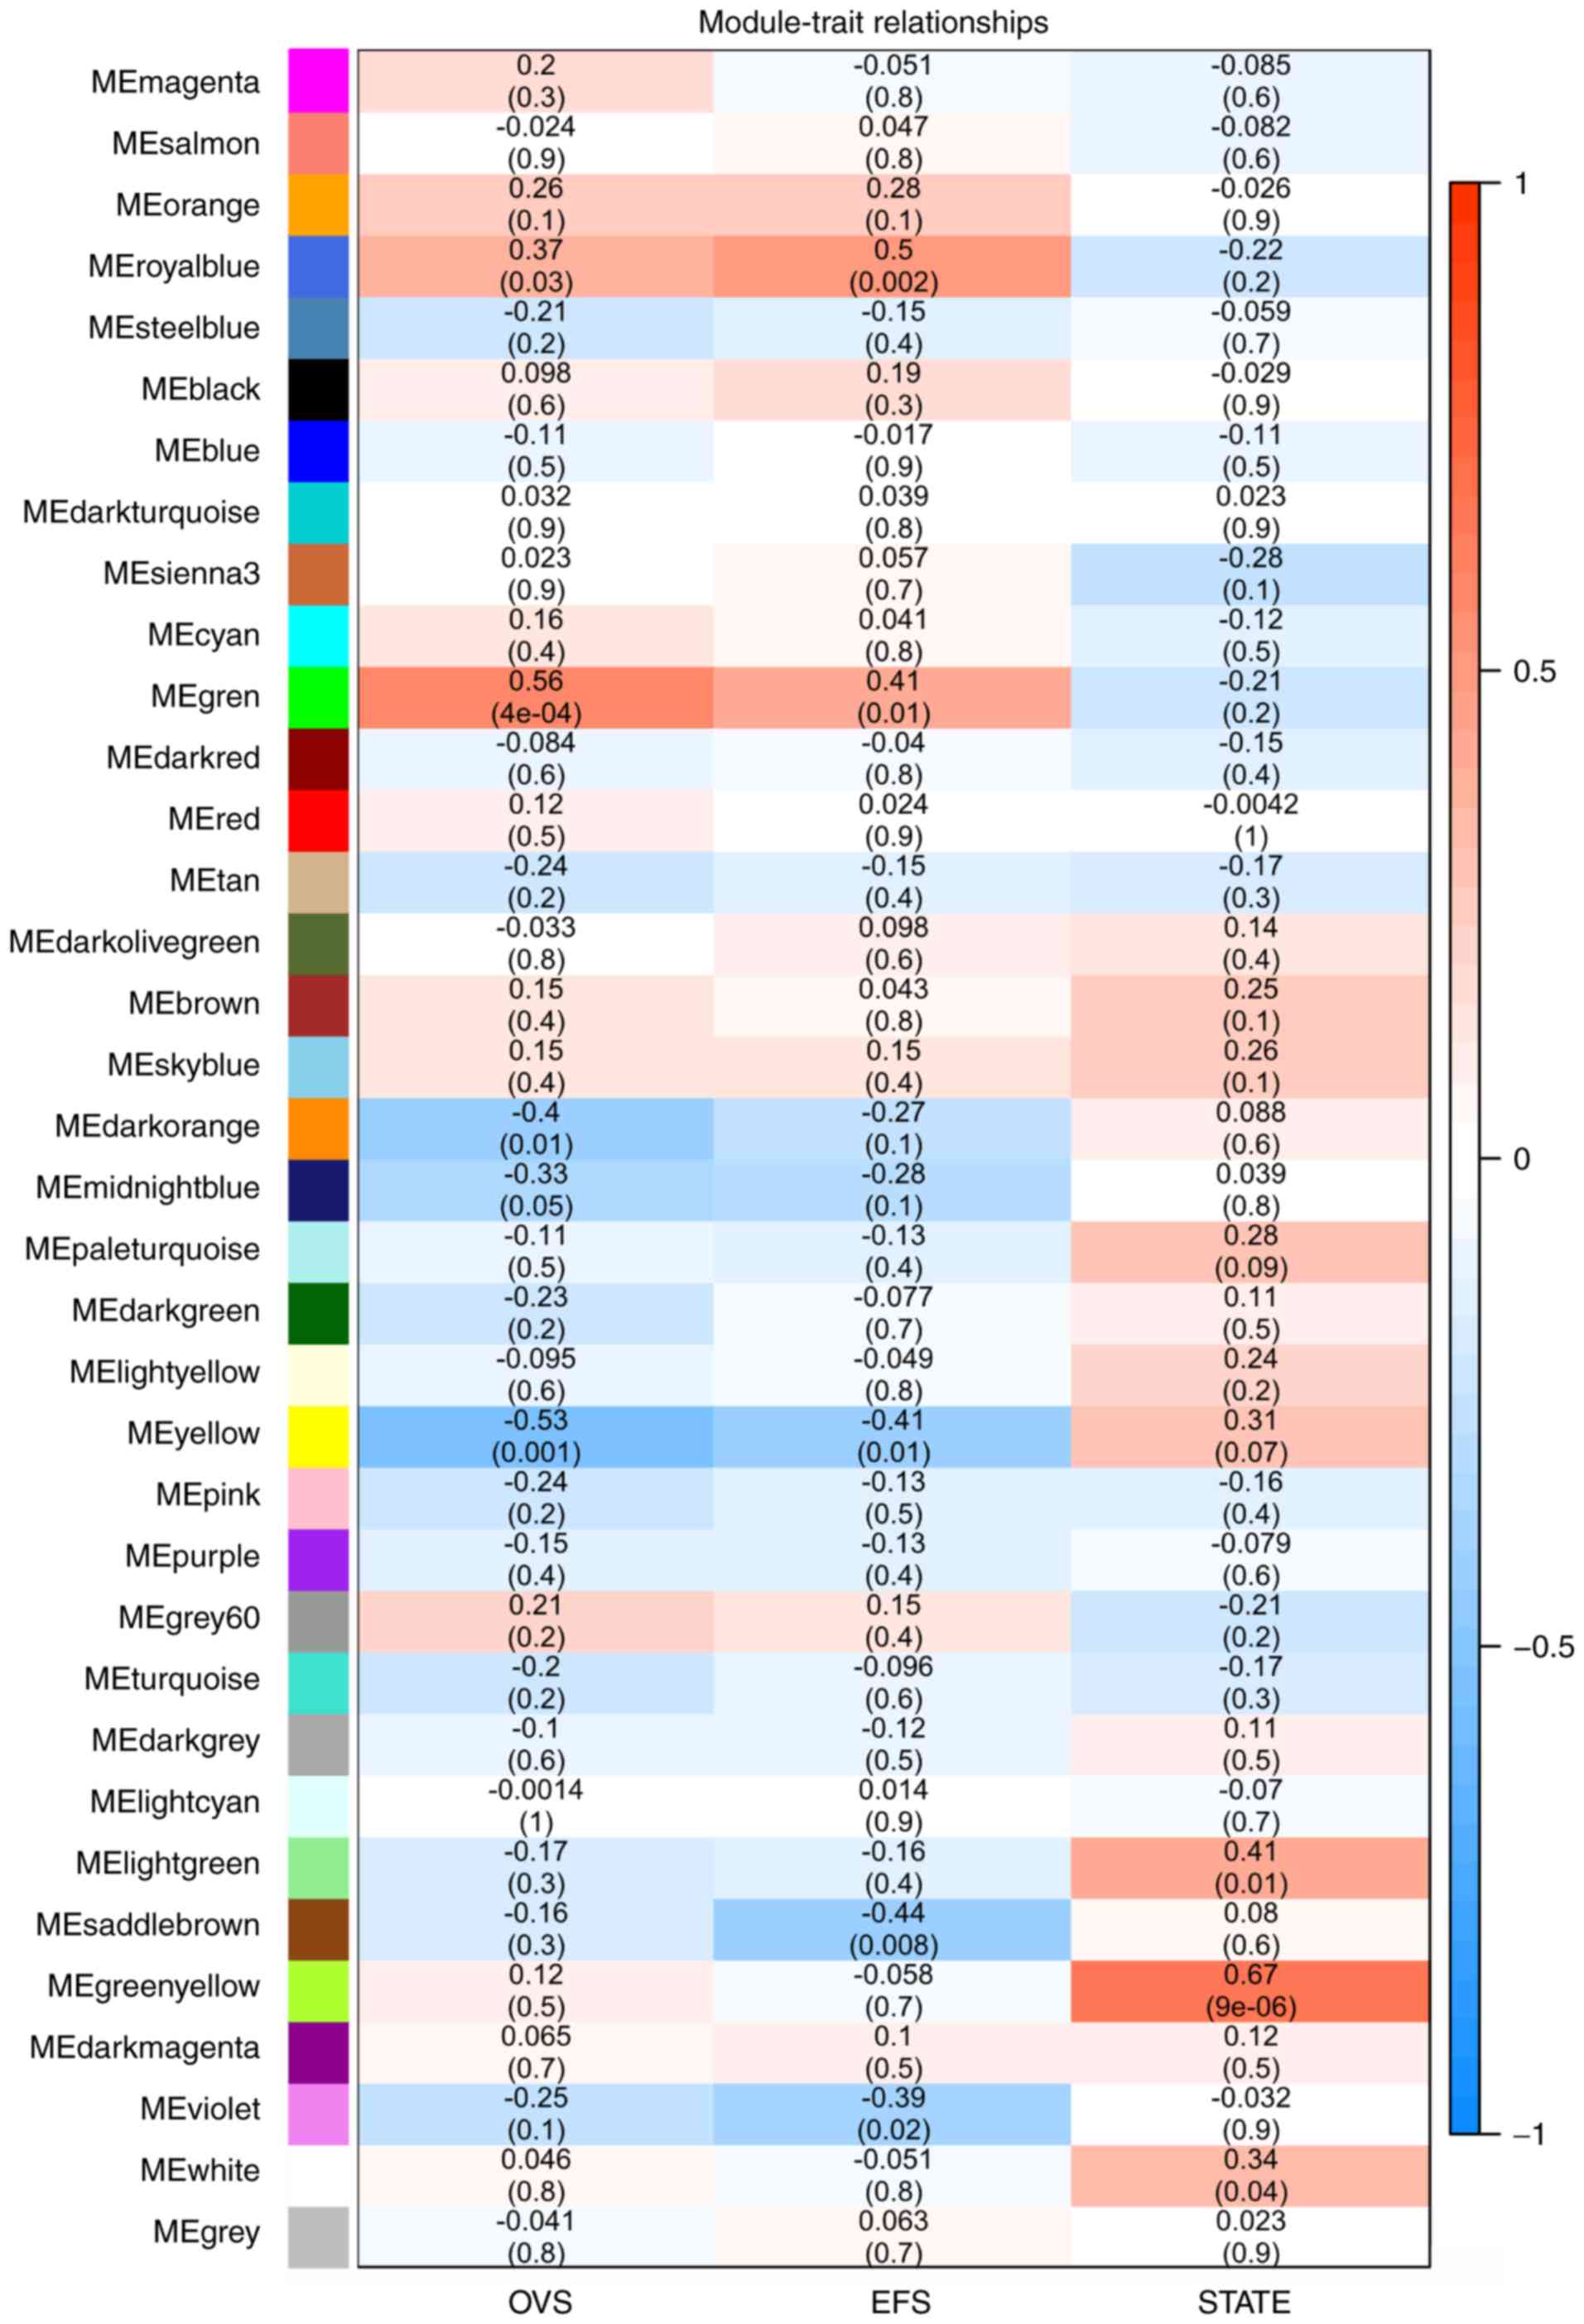
As presented in Fig.
4, OVS was significantly correlated with the green module
(r2=0.56; P=4×10⁻⁴). The royal blue module
was correlated with event-free survival (EFS) (r2=0.5;
P=0.002), whereas the green-yellow module was most significantly
correlated with metastatic state (r2=0.67,
P=9×10⁻⁶). Subsequent analyses focused on the
metastasis-associated co-expression module (yellow-green) and the
OVS-associated co-expression module (green).
PPI network in co-expression
modules
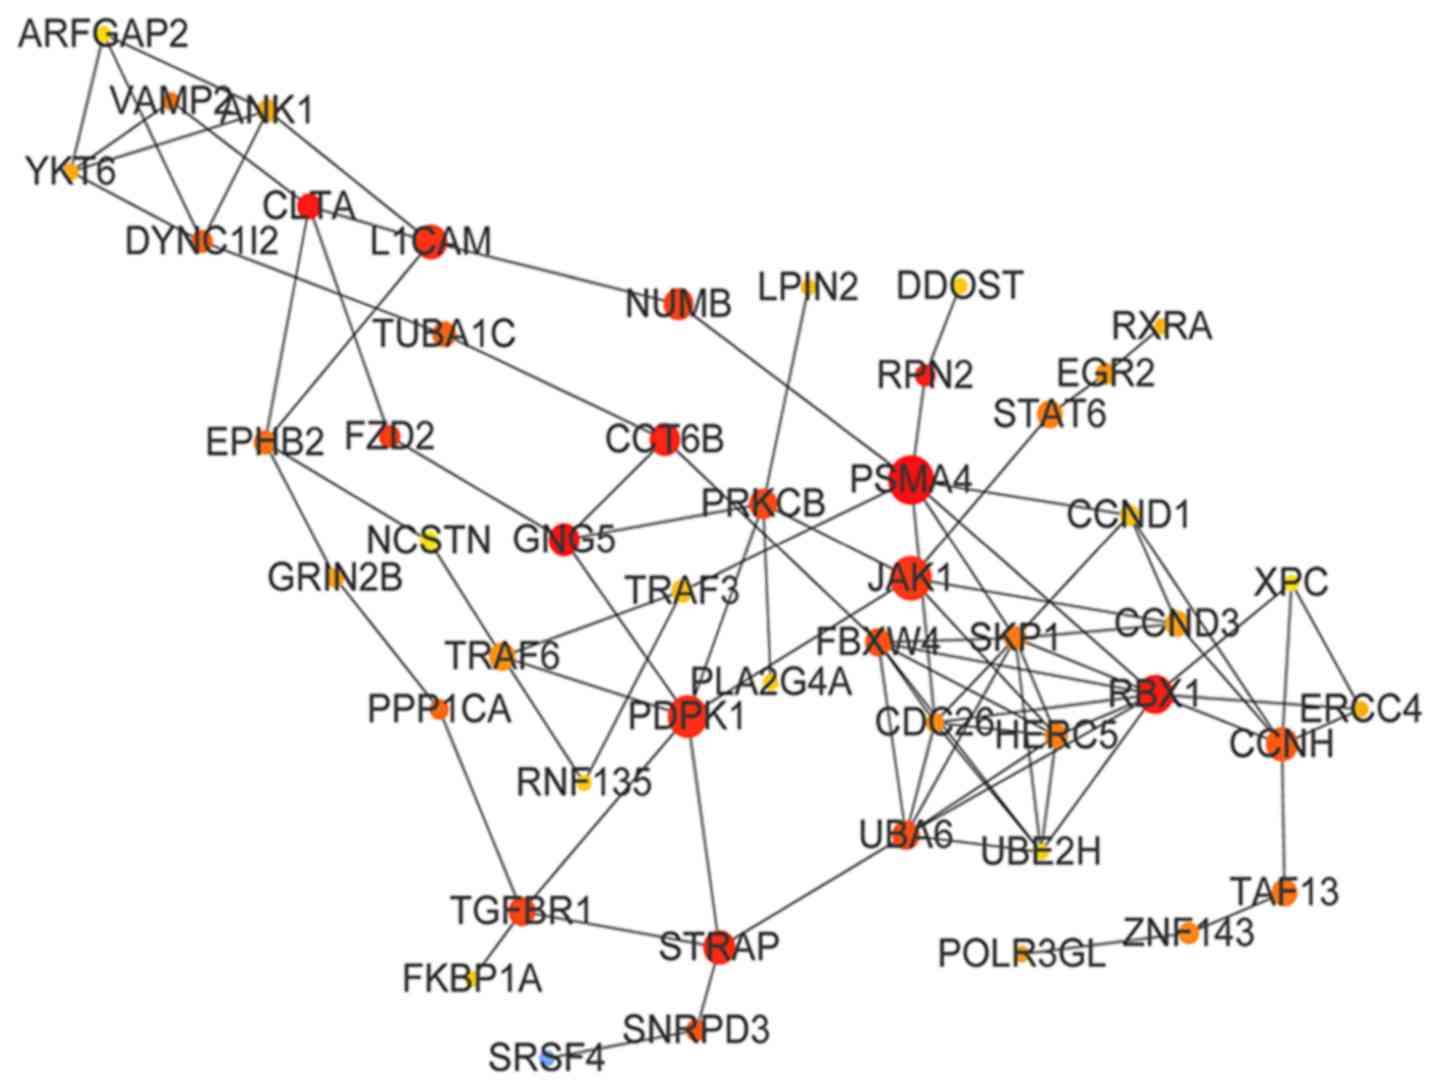
Following analysis of the STRING database, two PPI
networks of the top 50 BC genes in the green and green-yellow
modules were constructed. The PPI network of the green module is
presented in Fig. 5; the top 10
genes of the green module by BC value were proteasome subunit α4
(PSMA4; BC=12,145), G-protein subunit γ5 (BC=11,152), clathrin
light chain A (BC=8,382), ring-box 1 (BC=7,332), ribophorin II
(BC=7,288), chaperonin-containing TCP1 subunit 6B (BC=6,931),
serine/threonine kinase receptor-associated protein (STRAP;
BC=6,736), 3-phophoinositide-dependent protein kinase 1 (BC=6,652),
L1 cell adhesion molecule (L1CAM; BC=6,468) and Janus kinase 1
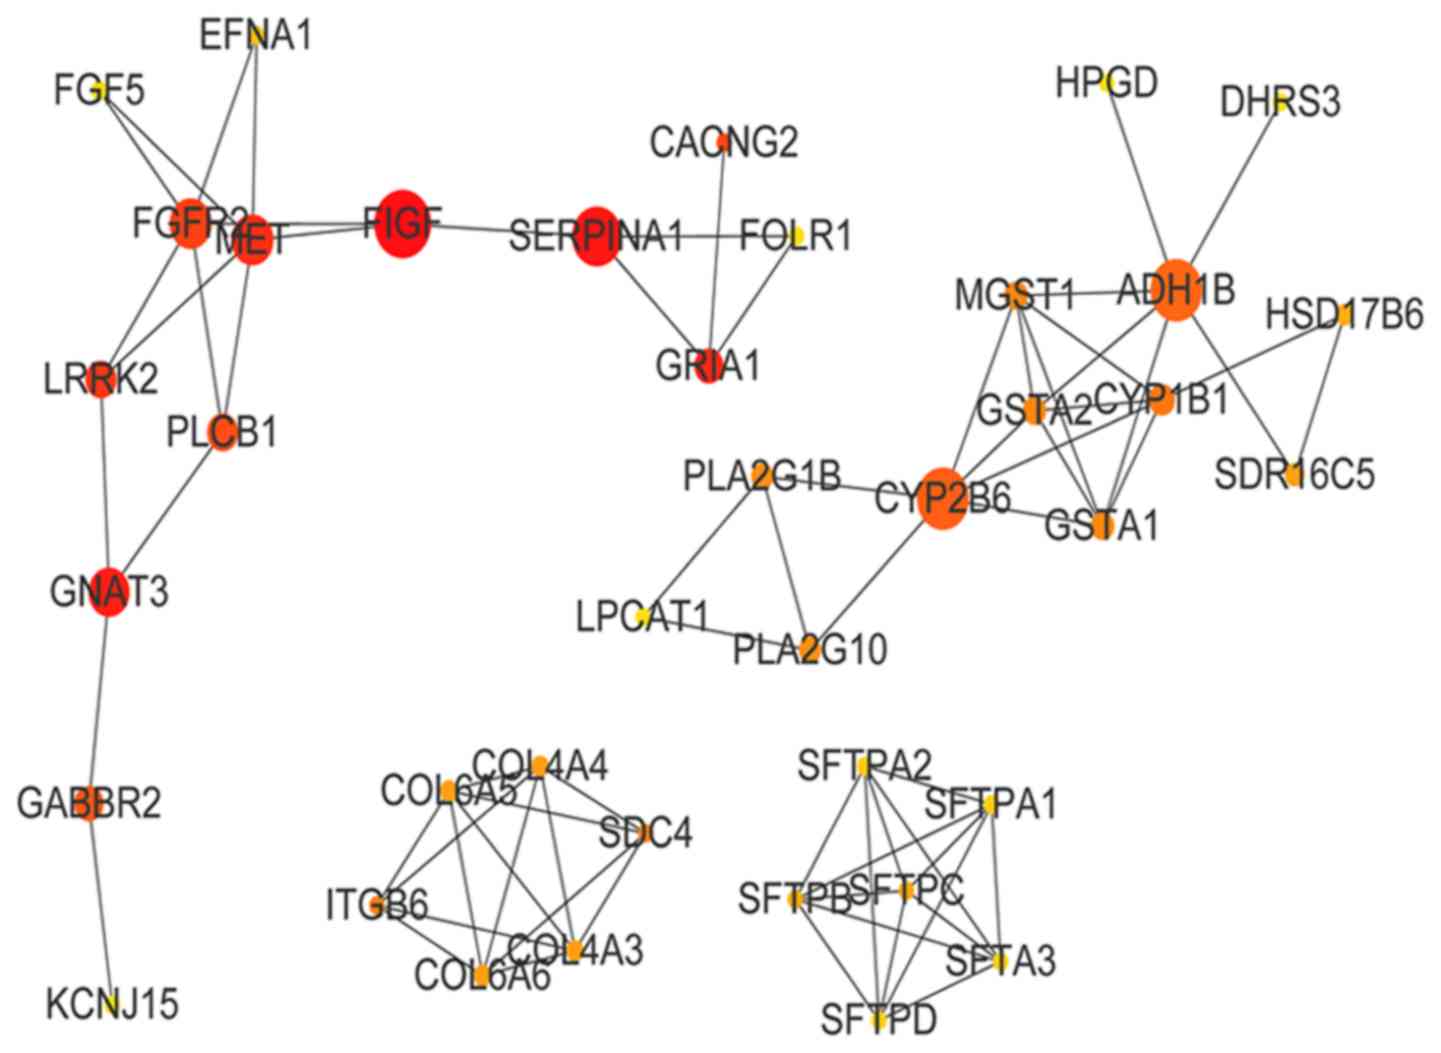
(BC=6,346). The PPI network of the green-yellow module is presented
in Fig. 6. The top 10 genes in
green-yellow module by BC value were vascular endothelial growth
factor D (BC=300), serpin family A member 1 (BC=252), G-protein
subunit α transducing 3 (BC=229), glutamate ionotropic receptor
AMPA subunit 1 (BC=200), Met proto-oncogene (BC=198), leucine-rich
repeat kinase 2 (BC=160), fibroblast growth factor receptor 2
(BC=154), calcium voltage-gated channel auxiliary subunit γ2
(CACNG2; BC=136), phospholipase C β1 (BC=112) and γ-aminobutyric
acid type B receptor subunit 2 (GABBR2; BC=94).
Functional enrichment of metastasis-
and OVS-associated modules
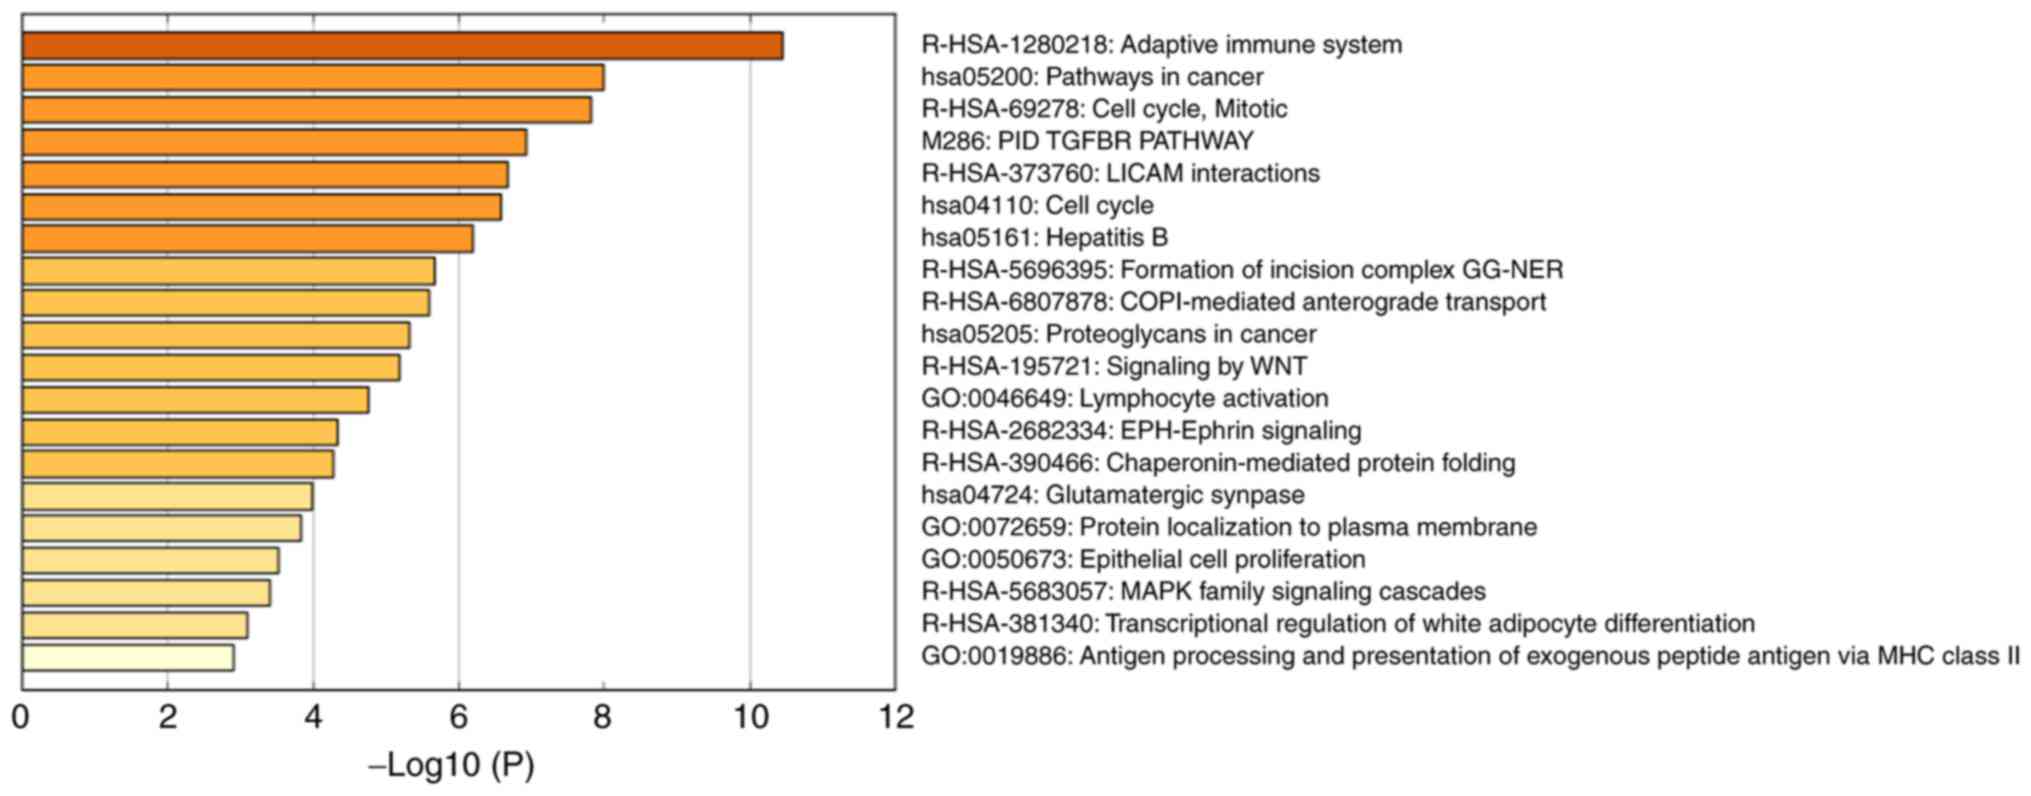
Functional enrichment analysis was used to determine
the biological significance of the top 50 high-BC genes in the OVS-
and metastasis-associated modules (Table
I; Fig. 7). The results
demonstrated that the OVS-associated module was mainly enriched in
the cell cycle and immune response, including ‘adaptive immune
system’ [log10(P)=−10.45], ‘pathways in cancer’ [log10(P)=−7.99],
‘cell cycle, mitotic’ [log10(P)=−7.81], ‘PID TGFBR PATHWAY’
[log10(P)=−6.92], ‘L1CAM interactions’ [log10(P)=−6.67] and ‘cell
cycle’ [log10(P)=−6.57].
 | Table I.Top 6 clusters with representative
enriched terms (one per cluster). |
Table I.
Top 6 clusters with representative
enriched terms (one per cluster).
| Category | Description | %a |
Log10(P)b | Genes |
|---|
| R-HSA-1280218 | Adaptive immune
system | 30 | −10.45 | CLTA, DYNC1I2,
FKBP1A, PDPK1, PRKCB, PSMA4, FBXW4, SKP1, TRAF6, UBE2H, RBX1,
HERC5, UBA6, TUBA1C, CDC26 |
| hsa05200 | Pathways in
cancer | 20 | −7.99 | CCND1, FZD2, GNG5,
JAK1, PRKCB, RXRA, TGFBR1, TRAF3, TRAF6, RBX1 |
| R-HSA-69278 | Cell cycle,
mitotic | 22 | −7.81 | CCND1, CCND3, CCNH,
DYNC1I2, PRKCB, PSMA4, SKP1, LPIN2, RBX1, TUBA1C, CDC26 |
| M-286 | PID TGFBR
PATHWAYc | 10 | −6.92 | FKBP1A, PDPK1,
PPP1CA, TGFBR1, STRAP |
| R-HSA-373760 | L1CAM
interactions | 12 | −6.67 | ANK1, CLTA, EPHB2,
L1CAM, NUMB, TUBA1C |
| hsa04110 | Cell cycle | 12 | −6.57 | CCND1, CCND3, CCNH,
SKP1, RBX1, CDC26 |
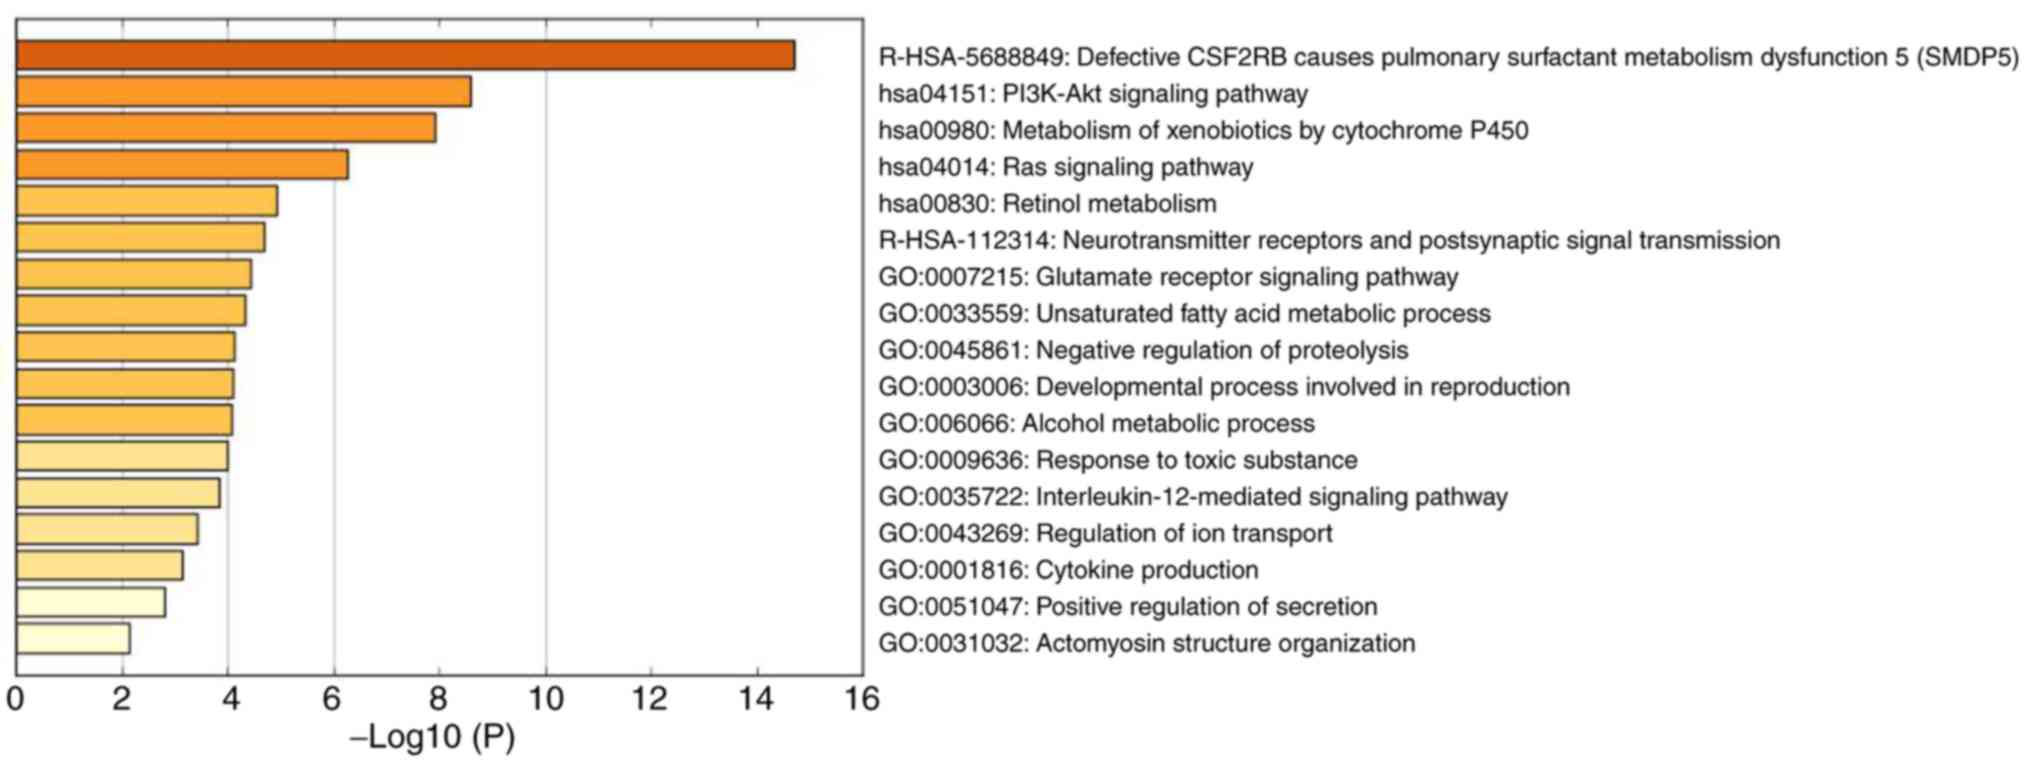
The enrichment analysis of the top 50 high-BC genes
of the metastasis-associated module was performed using Metascape
(Table II; Fig. 8); the genes in this module were
mainly associated with cellular metabolism and internal signal
transduction, including ‘defective CSF2RB causes pulmonary
surfactant metabolism dysfunction 5 (SMDP5)’ [log10(P)=−14.69],
‘PI3K-Akt signaling pathway’ [log10(P)=−8.59], ‘metabolism of
xenobiotics by cytochrome P450’ [log10(P)=−7.91], ‘Ras signaling
pathway’ [log10(P)=−6.26], ‘retinol metabolism’ [log10(P)=−4.93]
and ‘neurotransmitter receptors and postsynaptic signal
transmission’ [log10(P)=−4.68].
| Table II.Top 6 clusters with representative
enriched terms (one per cluster). |
Table II.
Top 6 clusters with representative
enriched terms (one per cluster).
| GO | Description | %a |
Log10(P)b | Genes |
|---|
| R-HSA-5688849 | Defective CSF2RB
causes pulmonary surfactant metabolism dysfunction 5 (SMDP5) | 12 | −14.69 | SFTPB, SFTPC,
SFTPD, SFTA3, SFTPA1, SFTPA2 |
| hsa04151 | PI3K-Akt signaling
pathway | 20 | −8.59 | COL4A3, COL4A4,
EFNA1, FGF5, FGFR2, VEGFD, ITGB6, MET, COL6A6, COL6A5 |
| hsa00980 | Metabolism of
xenobiotics by cytochrome P450 | 12 | −7.91 | ADH1B, CYP1B1,
CYP2B6, GSTA1, GSTA2, MGST1 |
| hsa04014 | Ras signaling
pathway | 14 | −6.26 | EFNA1, FGF5, FGFR2,
VEGFD, MET, PLA2G1B, PLA2G10 |
| hsa00830 | Retinol
metabolism | 8 | −4.93 | ADH1B, CYP2B6,
HSD17B6, SDR16C5 |
| R-HSA-112314 | Neurotransmitter
receptors and postsynaptic signal transmission | 10 | −4.68 | GRIA1, GABBR2,
CACNG2, PLCB1, GNAT3 |
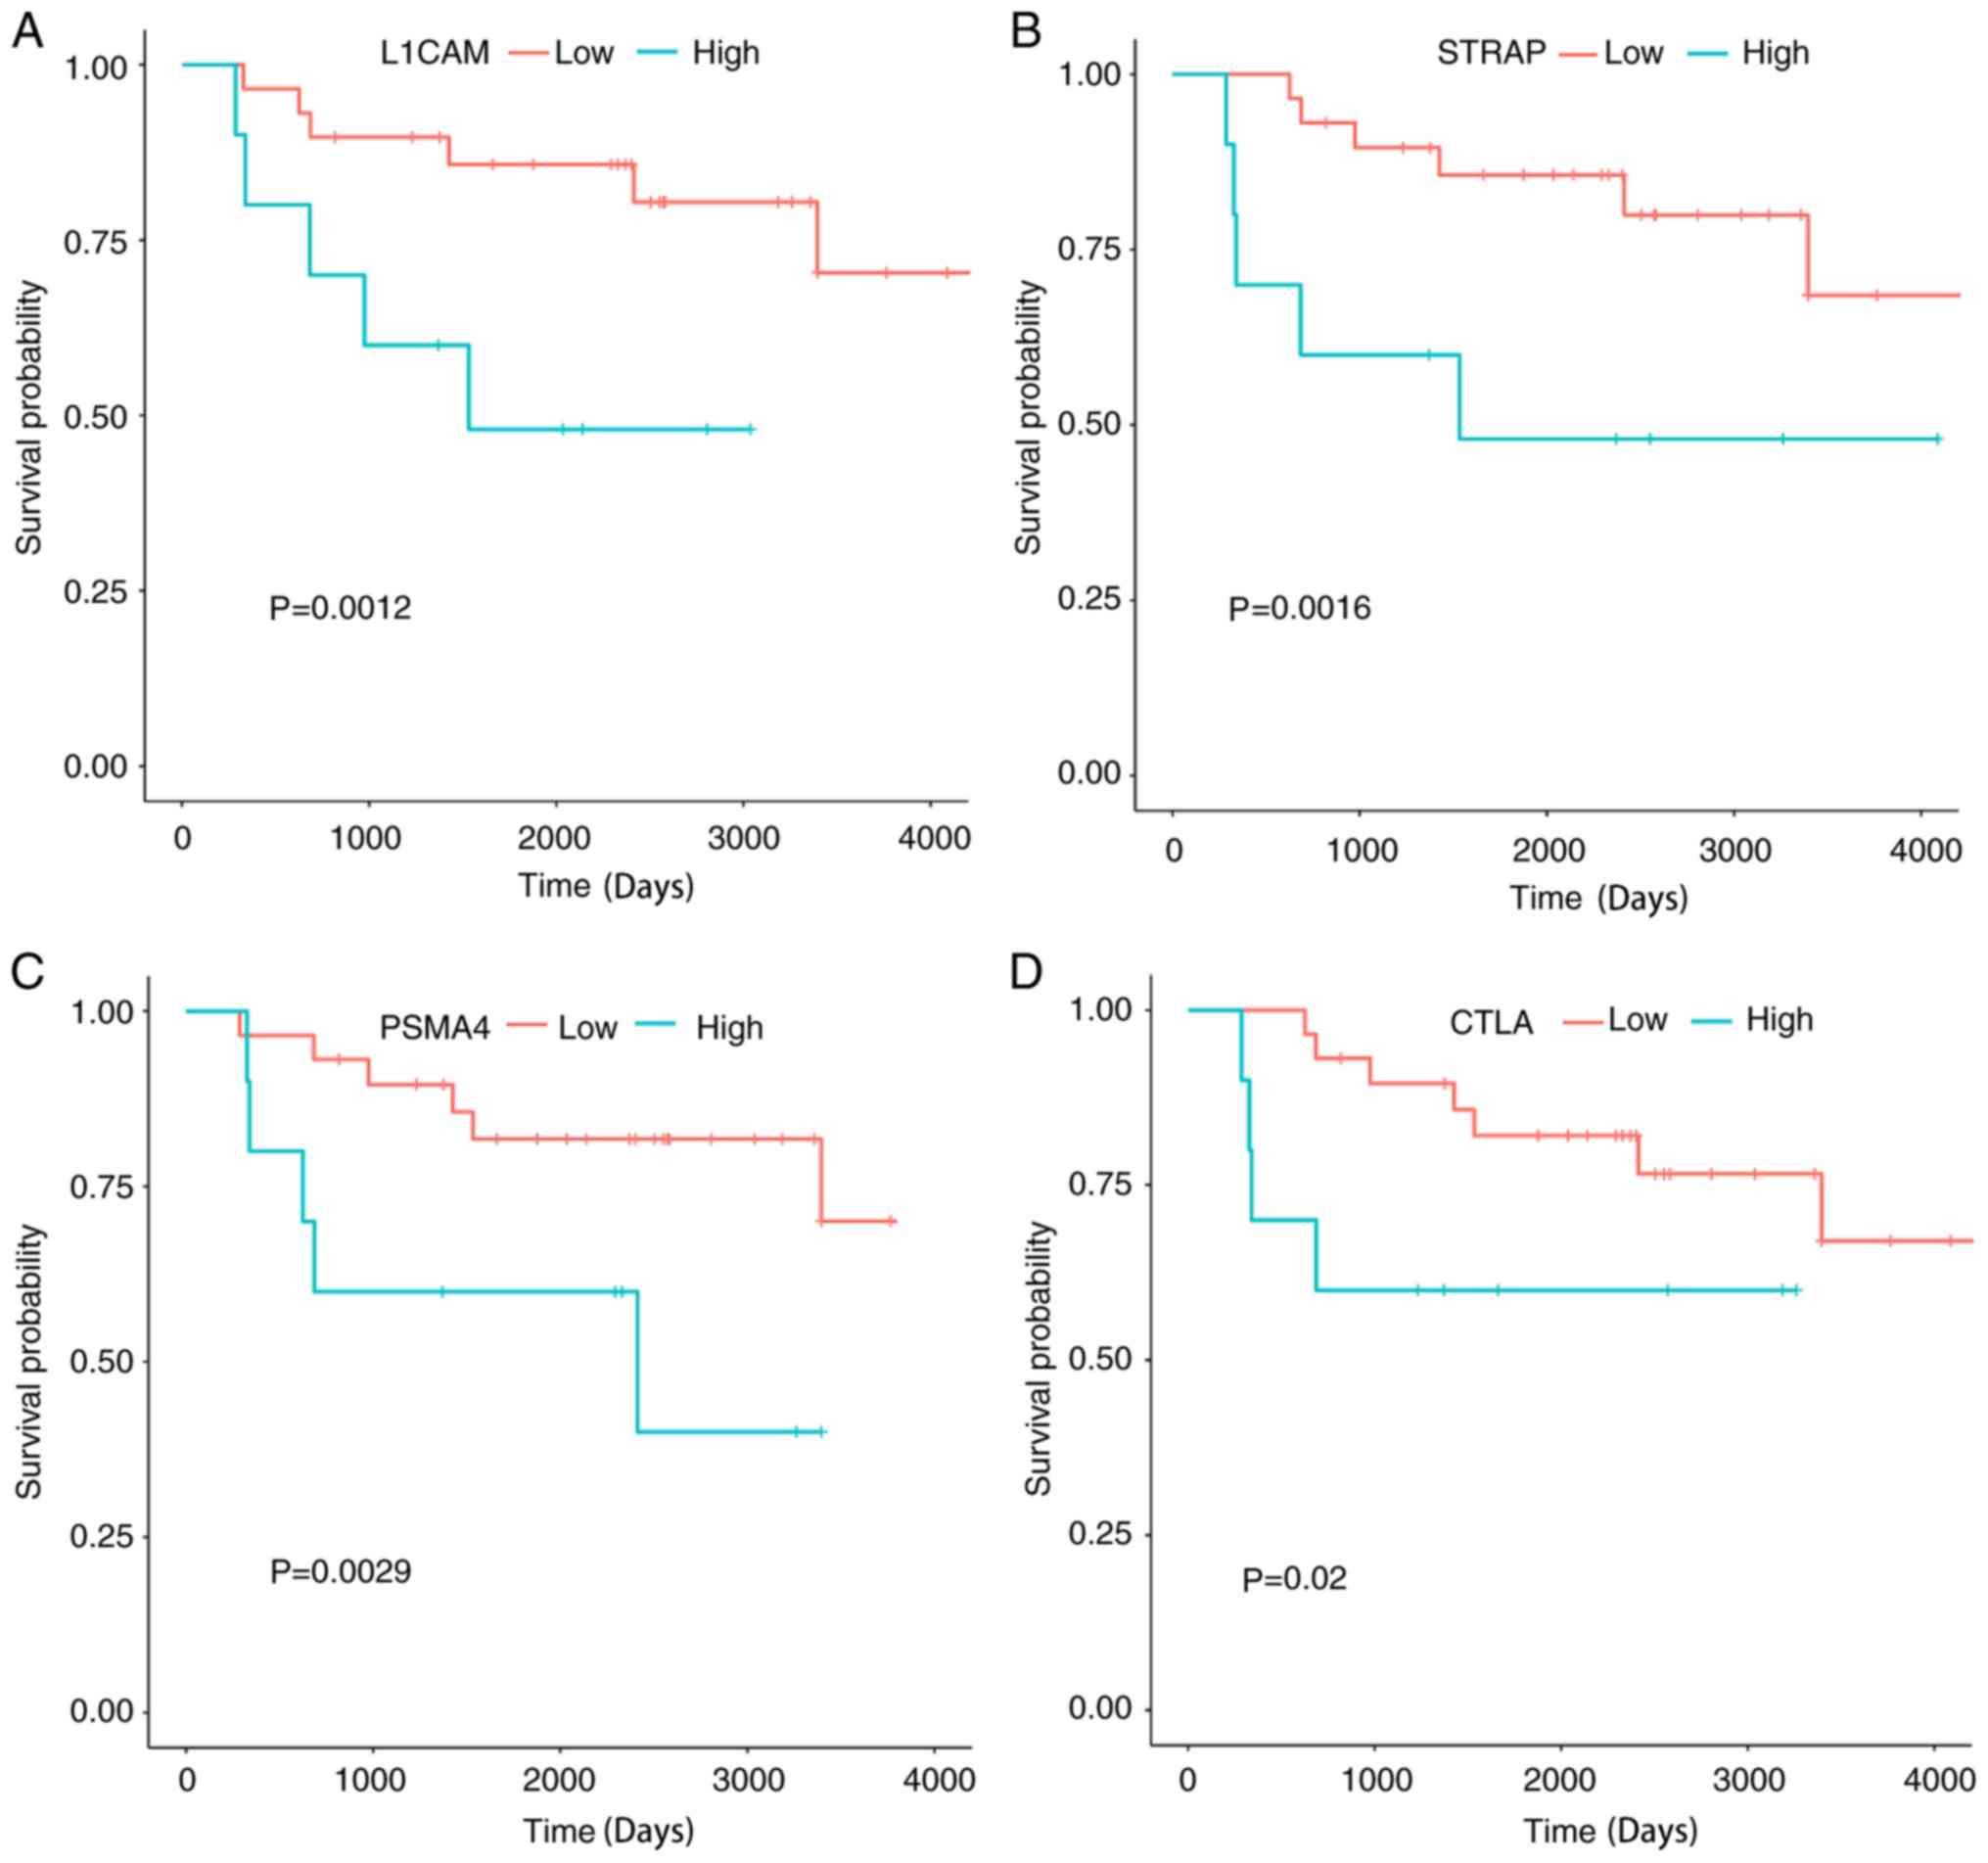
Prognostic significance of the
identified genes
To determine the association between the identified
hub genes and OVS of patients, the GEO GSE63157 dataset was used.
All the genes in each module were sorted according to BC value, and
R was used to calculate the association between the total survival
time of patients with ES, and the top 10 hub genes ranked by BC
were assessed. The top hub genes ranked by P-value of survival
analysis are shown in Fig. 9.
Significant associations were observed between the OVS of patients
with ES and the four genes (PSMA4, L1CAM, STRAP and CTLA) (all
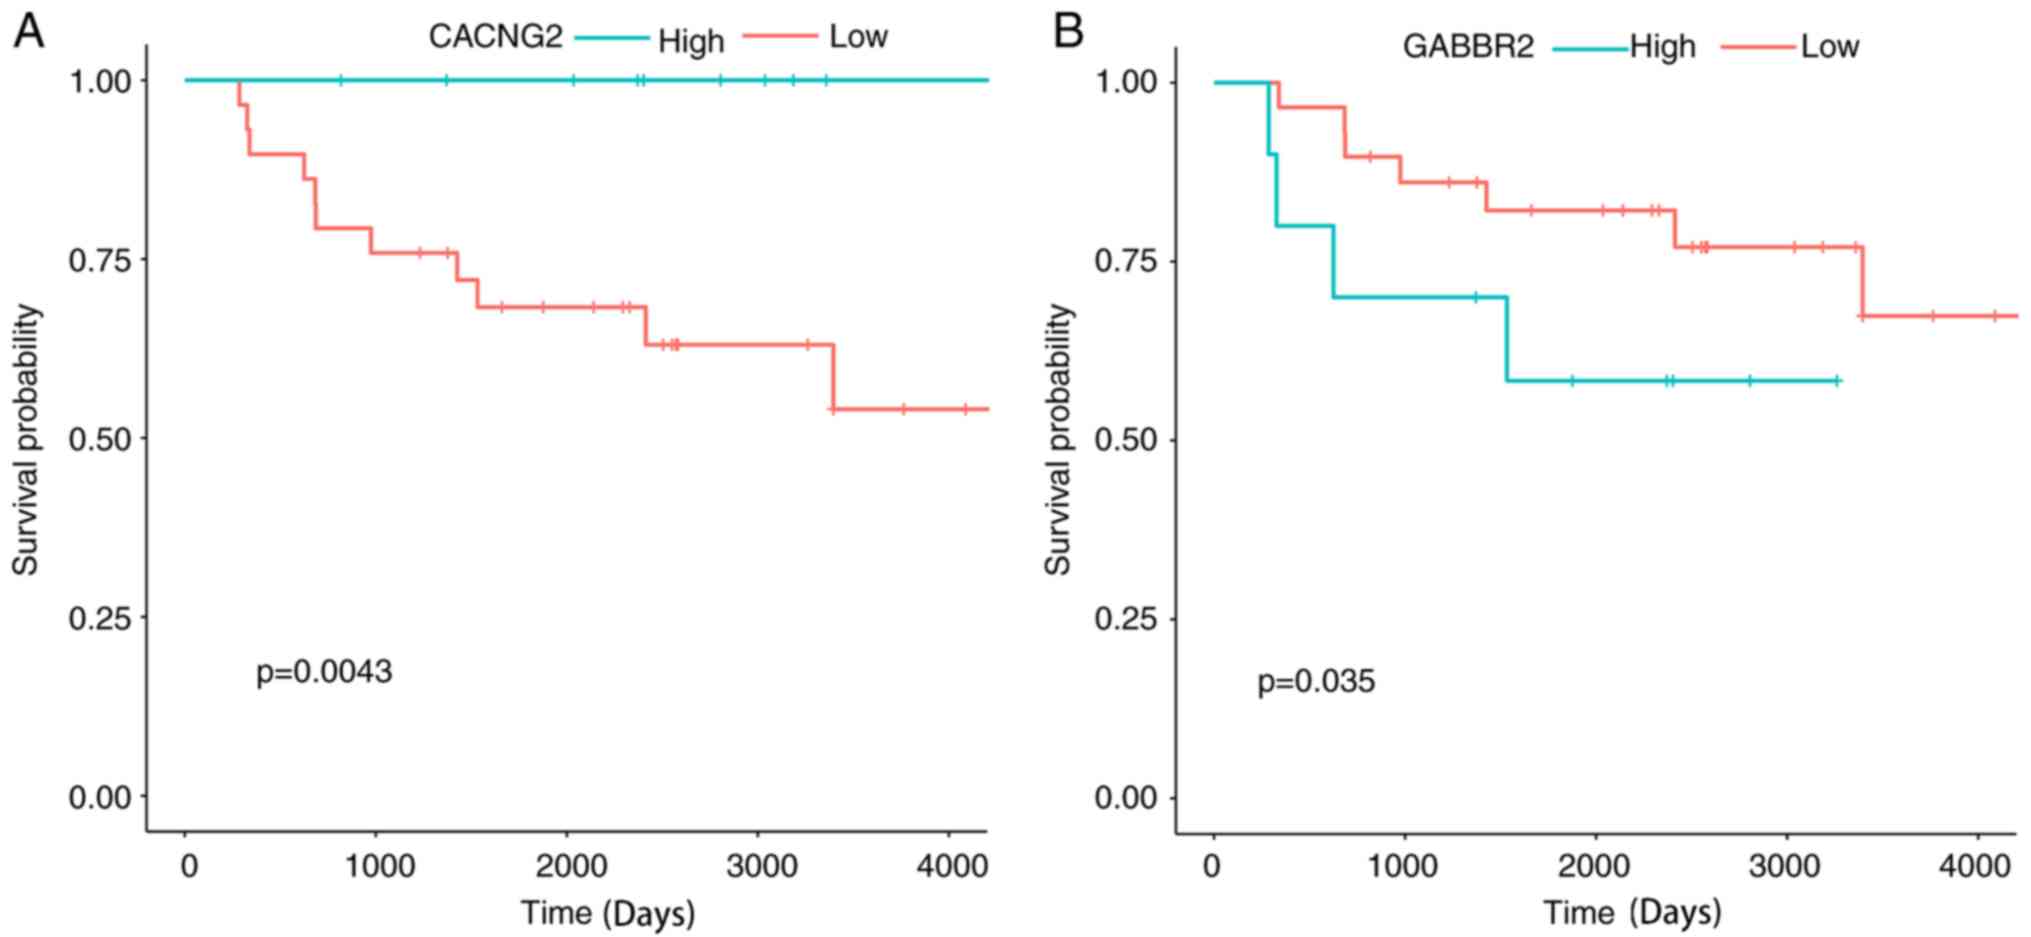
P<0.05; Fig. 9). The association
between the top 10 hub genes ranked by BC (2 genes were excluded as
the probeID in the GeneChip® platform was unavailable)
of the metastasis-related module and the OVS of the patients were
also examined. It was determined that two genes were statistically
significant prognostic factors for ES. High expression of CACNG2
and low expression of GABBR2 were favorable prognostic factors for
patients with ES (Fig. 10).
Discussion
ES is the second most common pediatric bone tumor
(18). Although a comprehensive
treatment plan for ES already exists, it remains an invasive tumor
with a high recurrence rate and a low 5-year survival rate
(2). Previous studies have revealed
that the EWS-ETS fusion gene may be the driving gene for ES;
however, targeted therapy for the EWS-ETS fusion gene is still
difficult to achieve (2). Therefore,
it is necessary to identify new target genes, which may lead to the
improvement of prognosis in patients with ES.
In the present study, two modules associated with
OVS and metastatic state were identified by weighted co-expression
analysis. The GO and KEGG pathway enrichment analysis of the
OVS-associated module revealed that the genes in this module were
enriched in the immune response and cell cycle, including terms
such as ‘adaptive immune system’ and ‘pathways in cancer’. The
results of the WGCNA analysis demonstrated that PSMA4 served a hub
role in the PPI network of the OVS-associated module. Previous
studies have reported that mutations in PSMA4 may be associated
with familial lung cancer (19,20),
which suggests that PSMA4 may be a potential proto-oncogene. In
addition, PSMA4 serves a role in chemotherapy resistance and immune
response (21). PSMA4 forms a
complex with proteasome activator subunits 3 and 4, which is
required in the processing of major histocompatibility complex
(MHC) class I-presented antigenic peptides (22–24). MHC
class I serve a crucial role in the activation of cytotoxic
T-cells, which is responsible for the tumor-associated immune
response (25,26). Therefore, PSMA4 may be associated
with tumor immune disorders, and further research is needed to
elucidate the role of PSMA4 in the carcinogenesis of ES.
The protein encoded by L1CAM is an axonal
glycoprotein that belongs to the immunoglobulin supergene family.
L1CAM is a cell adhesion molecule associated with the prognosis of
ovarian cancer, melanoma and endometrial cancer (27–29), and
multivariate Cox survival analysis has suggested that L1CAM may be
an independent prognostic variable in a number of different types
of cancer, although there were no studies examining it potential as
a prognostic variable in ES (30).
These results suggest that L1CAM may serve a crucial role in tumor
progression. In addition to that in cancerous tissues, abnormal
L1CAM expression has also been identified in precancerous lesions.
Geismann et al (31) revealed
the role of L1CAM in the malignant transformation of pancreatic
cancer, and an association with precancerous lesions was also
identified in inflammatory bowel disease (32) and endometriosis (33). Taken together, previous studies have
demonstrated the crucial role of L1CAM in the prognosis of
carcinomas originating from epithelial tissue. The results of the
present study revealed that L1CAM may also be a potential
prognostic biomarker of ES.
In a previous study, STRAP was described to
negatively regulate the transforming growth factor b (TGF-β)
signaling pathway by binding to Smad7 (34). STRAP regulates the mitogen-activated
protein kinase/extracellular signal-regulated kinase signaling
pathway in a unmber ofdifferent types of tumor (35). Overexpression of STRAP has been
identified in osteosarcoma (36). In
addition, downstream of STRAP, the TGF-β signaling pathway is a
crucial osteoblastic signaling pathway in the early stage of bone
formation (37), and has been
identified to be overexpressed in high-grade osteosarcoma tissue
(38). Since STRAP serves osteogenic
and oncogenic roles in bone tumors, further evidence is needed to
determine the role of STRAP in the tumorigenesis of ES.
In the present study, KEGG pathway and GO functional
enrichment showed that the top 50 BC genes in the
metastasis-associated module were mostly enriched in terms
associated with metabolism and signaling pathways. According to the
literature, CACNG2 encodes a protein involved in the trafficking of
glutamatergic AMPA receptors (39).
Previous studies have revealed the key role of CACNG2 in mental and
neuropathic disorders, including bipolar disorder, schizophrenia
(40) and chronic pain (39). GABBR2 is a protein involved in
neurological disorders, such as epilepsy (41) and Huntington's disease (42). However, the roles of CACNG2 and
GABBR2 in ES are still unclear. The results of the present study
suggested that these two genes may serve as potential biomarkers
for metastasis or prognosis in patients with ES. Further research
is needed to elucidate their role in this disease.
In conclusion, the present study identified several
potential molecules involved in the metastasis and prognosis of ES.
The WGCNA analysis identified certain co-expression modules in ES,
which were associated with clinical features of the samples, to
screen for clinical feature-associated genes. The hub genes
identified in the present study require further research due to the
lack of associated studies. The PPI network and functional
enrichment of the hub genes may provide a view into the gene
co-expression interaction framework of ES.
Acknowledgements
Not applicable.
Funding
No funding was received.
Availability of data and materials
The datasets generated and/or analyzed during the
current study are available in the GEO repository,(accession nos.
GSE63157 and GSE17679).
Authors' contributions
BW, JL and XL analyzed the data and wrote the
manuscript. YO designed the experiment and revised the manuscript.
The final version of the manuscript has been approved by all
authors.
Ethics approval and consent to
participate
Not applicable.
Patient consent for publication
Not applicable.
Competing interests
The authors declare that they have no competing
interests.
References
|
1
|
Whelan J, McTiernan A, Cooper N, Wong YK,
Francis M, Vernon S and Strauss SJ: Incidence and survival of
malignant bone sarcomas in England 1979–2007. Int J Cancer.
131:E508–E517. 2012. View Article : Google Scholar : PubMed/NCBI
|
|
2
|
Grunewald TGP, Cidre-Aranaz F, Surdez D,
Tomazou EM, de Álava E, Kovar H, Sorensen PH, Delattre O and
Dirksen U: Ewing sarcoma. Nat Rev Dis Primers. 4:52018. View Article : Google Scholar : PubMed/NCBI
|
|
3
|
Stahl M, Ranft A, Paulussen M, Bölling T,
Vieth V, Bielack S, Görtitz I, Braun-Munzinger G, Hardes J, Jürgens
H and Dirksen U: Risk of recurrence and survival after relapse in
patients with Ewing sarcoma. Pediatr Blood Cancer. 57:549–553.
2011. View Article : Google Scholar : PubMed/NCBI
|
|
4
|
Burchill SA: Ewing's sarcoma: Diagnostic,
prognostic, and therapeutic implications of molecular
abnormalities. J Clin Pathol. 56:96–102. 2003. View Article : Google Scholar : PubMed/NCBI
|
|
5
|
Riggi N, Knoechel B, Gillespie SM,
Rheinbay E, Boulay G, Suvà ML, Rossetti NE, Boonseng WE, Oksuz O,
Cook EB, et al: EWS-FLI1 utilizes divergent chromatin remodeling
mechanisms to directly activate or repress enhancer elements in
Ewing sarcoma. Cancer Cell. 26:668–681. 2014. View Article : Google Scholar : PubMed/NCBI
|
|
6
|
Sankar S, Bell R, Stephens B, Zhuo R,
Sharma S, Bearss DJ and Lessnick SL: Mechanism and relevance of
EWS/FLI-mediated transcriptional repression in Ewing sarcoma.
Oncogene. 32:5089–5100. 2013. View Article : Google Scholar : PubMed/NCBI
|
|
7
|
Chaturvedi A, Hoffman LM, Welm AL,
Lessnick SL and Beckerle MC: The EWS/FLI oncogene drives changes in
cellular morphology, adhesion, and migration in ewing sarcoma.
Genes Cancer. 3:102–116. 2012. View Article : Google Scholar : PubMed/NCBI
|
|
8
|
Fadul J, Bell R, Hoffman LM, Beckerle MC,
Engel ME and Lessnick SL: EWS/FLI utilizes NKX2-2 to repress
mesenchymal features of Ewing sarcoma. Genes Cancer. 6:129–143.
2015.PubMed/NCBI
|
|
9
|
Pedersen EA, Menon R, Bailey KM, Thomas
DG, Van Noord RA, Tran J, Wang H, Qu PP, Hoering A, Fearon ER, et
al: Activation of Wnt/β-catenin in ewing sarcoma cells antagonizes
EWS/ETS function and promotes phenotypic transition to more
metastatic cell states. Cancer Res. 76:5040–5053. 2016. View Article : Google Scholar : PubMed/NCBI
|
|
10
|
de Alava E, Kawai A, Healey JH, Fligman I,
Meyers PA, Huvos AG, Gerald WL, Jhanwar SC, Argani P, Antonescu CR,
et al: EWS-FLI1 fusion transcript structure is an independent
determinant of prognosis in Ewing's sarcoma. J Clin Oncol.
16:1248–1255. 1998. View Article : Google Scholar : PubMed/NCBI
|
|
11
|
Le Deley MC, Delattre O, Schaefer KL,
Burchill SA, Koehler G, Hogendoorn PC, Lion T, Poremba C, Marandet
J, Ballet S, et al: Impact of EWS-ETS fusion type on disease
progression in Ewing's sarcoma/peripheral primitive neuroectodermal
tumor: Prospective results from the cooperative Euro-E.W.I.N.G. 99
trial. J Clin Oncol. 28:1982–1988. 2010. View Article : Google Scholar : PubMed/NCBI
|
|
12
|
van Doorninck JA, Ji L, Schaub B, Shimada
H, Wing MR, Krailo MD, Lessnick SL, Marina N, Triche TJ, Sposto R,
et al: Current treatment protocols have eliminated the prognostic
advantage of type 1 fusions in Ewing sarcoma: A report from the
Children's Oncology Group. J Clin Oncol. 28:1989–1994. 2010.
View Article : Google Scholar : PubMed/NCBI
|
|
13
|
Langfelder P and Horvath S: WGCNA: An R
package for weighted correlation network analysis. BMC
Bioinformatics. 9:5592008. View Article : Google Scholar : PubMed/NCBI
|
|
14
|
Saris CG, Horvath S, van Vught PW, van Es
MA, Blauw HM, Fuller TF, Langfelder P, DeYoung J, Wokke JH, Veldink
JH, et al: Weighted gene co-expression network analysis of the
peripheral blood from Amyotrophic Lateral Sclerosis patients. BMC
Genomics. 10:4052009. View Article : Google Scholar : PubMed/NCBI
|
|
15
|
Savola S, Klami A, Myllykangas S, Manara
C, Scotlandi K, Picci P, Knuutila S and Vakkila J: High expression
of complement component 5 (C5) at tumor site associates with
superior survival in Ewing's sarcoma family of tumour patients.
ISRN Oncol 2011. 1687122011.
|
|
16
|
M K: Post-genome informatics.
2000.PubMed/NCBI
|
|
17
|
Volchenboum SL, Andrade J, Huang L,
Barkauskas DA, Krailo M, Womer RB, Ranft A, Potratz J, Dirksen U,
Triche TJ and Lawlor ER: Gene expression profiling of ewing sarcoma
tumors reveals the prognostic importance of tumor-stromal
interactions: A report from the Children's oncology group. J Pathol
Clin Res. 1:83–94. 2015. View
Article : Google Scholar : PubMed/NCBI
|
|
18
|
Kovar H, Dworzak M, Strehl S, Schnell E,
Ambros IM, Ambros PF and Gadner H: Overexpression of the
pseudoautosomal gene MIC2 in Ewing's sarcoma and peripheral
primitive neuroectodermal tumor. Oncogene. 5:1067–1070.
1990.PubMed/NCBI
|
|
19
|
Amos CI, Wu X, Broderick P, Gorlov IP, Gu
J, Eisen T, Dong Q, Zhang Q, Gu X, Vijayakrishnan J, et al:
Genome-wide association scan of tag SNPs identifies a
susceptibility locus for lung cancer at 15q25.1. Nat Genet.
40:616–622. 2008. View
Article : Google Scholar : PubMed/NCBI
|
|
20
|
Liu P, Vikis HG, Wang D, Lu Y, Wang Y,
Schwartz AG, Pinney SM, Yang P, de Andrade M, Petersen GM, et al:
Familial aggregation of common sequence variants on 15q24-25.1 in
lung cancer. J Natl Cancer Inst. 100:1326–1330. 2008. View Article : Google Scholar : PubMed/NCBI
|
|
21
|
Wang T, Chen T, Thakur A, Liang Y, Gao L,
Zhang S, Tian Y, Jin T, Liu JJ and Chen M: Association of PSMA4
polymorphisms with lung cancer susceptibility and response to
cisplatin-based chemotherapy in a Chinese Han population. Clin
Transl Oncol. 17:564–569. 2015. View Article : Google Scholar : PubMed/NCBI
|
|
22
|
Groettrup M, Soza A, Eggers M, Kuehn L,
Dick TP, Schild H, Rammensee HG, Koszinowski UH and Kloetzel PM: A
role for the proteasome regulator PA28alpha in antigen
presentation. Nature. 381:166–168. 1996. View Article : Google Scholar : PubMed/NCBI
|
|
23
|
Rut W and Drag M: Human 20S proteasome
activity towards fluorogenic peptides of various chain lengths.
Biol Chem. 397:921–926. 2016. View Article : Google Scholar : PubMed/NCBI
|
|
24
|
Yano M, Koumoto Y, Kanesaki Y, Wu X and
Kido H: 20S proteasome prevents aggregation of heat-denatured
proteins without PA700 regulatory subcomplex like a molecular
chaperone. Biomacromolecules. 5:1465–1469. 2004. View Article : Google Scholar : PubMed/NCBI
|
|
25
|
Rodig SJ, Gusenleitner D, Jackson DG,
Gjini E, Giobbie-Hurder A, Jin C, Chang H, Lovitch SB, Horak C,
Weber JS, et al: MHC proteins confer differential sensitivity to
CTLA-4 and PD-1 blockade in untreated metastatic melanoma. Sci
Transl Med. 10(pii): eaar33422018. View Article : Google Scholar : PubMed/NCBI
|
|
26
|
Nakayama M: Antigen presentation by
MHC-dressed cells. Front Immunol. 5:6722014.PubMed/NCBI
|
|
27
|
Fogel M, Gutwein P, Mechtersheimer S,
Riedle S, Stoeck A, Smirnov A, Edler L, Ben-Arie A, Huszar M and
Altevogt P: L1 expression as a predictor of progression and
survival in patients with uterine and ovarian carcinomas. Lancet.
362:869–875. 2003. View Article : Google Scholar : PubMed/NCBI
|
|
28
|
Fogel M, Mechtersheimer S, Huszar M,
Smirnov A, Abu-Dahi A, Tilgen W, Reichrath J, Georg T, Altevogt P
and Gutwein P: L1 adhesion molecule (CD 171) in development and
progression of human malignant melanoma. Cancer Lett. 189:237–247.
2003. View Article : Google Scholar : PubMed/NCBI
|
|
29
|
Zeimet AG, Reimer D, Huszar M, Winterhoff
B, Puistola U, Azim SA, Müller-Holzner E, Ben-Arie A, van Kempen
LC, Petru E, et al: L1CAM in early-stage type I endometrial cancer:
Results of a large multicenter evaluation. J Natl Cancer Inst.
105:1142–1150. 2013. View Article : Google Scholar : PubMed/NCBI
|
|
30
|
Altevogt P, Doberstein K and Fogel M:
L1CAM in human cancer. Int J Cancer. 138:1565–1576. 2016.
View Article : Google Scholar : PubMed/NCBI
|
|
31
|
Geismann C, Morscheck M, Koch D, Bergmann
F, Ungefroren H, Arlt A, Tsao MS, Bachem MG, Altevogt P, Sipos B,
et al: Up-regulation of L1CAM in pancreatic duct cells is
transforming growth factor beta1- and slug-dependent: Role in
malignant transformation of pancreatic cancer. Cancer Res.
69:4517–4526. 2009. View Article : Google Scholar : PubMed/NCBI
|
|
32
|
Schafer H, Struck B, Feldmann EM, Bergmann
F, Grage-Griebenow E, Geismann C, Ehlers S, Altevogt P and Sebens
S: TGF-β1-dependent L1CAM expression has an essential role in
macrophage-induced apoptosis resistance and cell migration of human
intestinal epithelial cells. Oncogene. 32:180–189. 2013. View Article : Google Scholar : PubMed/NCBI
|
|
33
|
Finas D, Huszar M, Agic A, Dogan S, Kiefel
H, Riedle S, Gast D, Marcovich R, Noack F, Altevogt P, et al: L1
cell adhesion molecule (L1CAM) as a pathogenetic factor in
endometriosis. Hum Reprod. 23:1053–1062. 2008. View Article : Google Scholar : PubMed/NCBI
|
|
34
|
Datta PK and Moses HL: STRAP and Smad7
synergize in the inhibition of transforming growth factor beta
signaling. Mol Cell Biol. 20:3157–3167. 2000. View Article : Google Scholar : PubMed/NCBI
|
|
35
|
Halder SK, Anumanthan G, Maddula R, Mann
J, Chytil A, Gonzalez AL, Washington MK, Moses HL, Beauchamp RD and
Datta PK: Oncogenic function of a novel WD-domain protein, STRAP,
in human carcinogenesis. Cancer Res. 66:6156–6166. 2006. View Article : Google Scholar : PubMed/NCBI
|
|
36
|
Pruksakorn D, Klangjorhor J,
Lirdprapamongkol K, Teeyakasem P, Sungngam P, Chaiyawat P,
Phanphaisarn A, Settakorn J and Srisomsap C: Oncogenic roles of
serine-threonine kinase receptor-associated protein (STRAP) in
osteosarcoma. Cancer Chemother Pharmacol. 82:1039–1047. 2018.
View Article : Google Scholar : PubMed/NCBI
|
|
37
|
Chen G, Deng C and Li YP: TGF-β and BMP
signaling in osteoblast differentiation and bone formation. Int J
Biol Sci. 8:272–288. 2012. View Article : Google Scholar : PubMed/NCBI
|
|
38
|
Franchi A, Arganini L, Baroni G, Calzolari
A, Capanna R, Campanacci D, Caldora P, Masi L, Brandi ML and Zampi
G: Expression of transforming growth factor beta isoforms in
osteosarcoma variants: Association of TGF beta 1 with high-grade
osteosarcomas. J Pathol. 185:284–289. 1998. View Article : Google Scholar : PubMed/NCBI
|
|
39
|
Nissenbaum J, Devor M, Seltzer Z, Gebauer
M, Michaelis M, Tal M, Dorfman R, Abitbul-Yarkoni M, Lu Y,
Elahipanah T, et al: Susceptibility to chronic pain following nerve
injury is genetically affected by CACNG2. Genome Res. 20:1180–1190.
2010. View Article : Google Scholar : PubMed/NCBI
|
|
40
|
Liu YL, Fann CS, Liu CM, Chen WJ, Wu JY,
Hung SI, Chen CH, Jou YS, Liu SK, Hwang TJ, et al: RASD2, MYH9, and
CACNG2 genes at chromosome 22q12 associated with the subgroup of
schizophrenia with non-deficit in sustained attention and executive
function. Biol Psychiatry. 64:789–796. 2008. View Article : Google Scholar : PubMed/NCBI
|
|
41
|
Yoo Y, Jung J, Lee YN, Lee Y, Cho H, Na E,
Hong J, Kim E, Lee JS, Lee JS, et al: GABBR2 mutations determine
phenotype in rett syndrome and epileptic encephalopathy. Ann
Neurol. 82:466–478. 2017. View Article : Google Scholar : PubMed/NCBI
|
|
42
|
Philpott AL, Fitzgerald PB, Bailey NW,
Churchyard A, Georgiou-Karistianis N and Cummins TD: A GABBR2 gene
variant modifies pathophysiology in Huntington's disease. Neurosci
Lett. 620:8–13. 2016. View Article : Google Scholar : PubMed/NCBI
|